
The US national debt hit a milestone in August 2026. It reached a staggering $40 trillion. The national debt is the amount owed by the US federal government to holders of government bonds and bills (treasury securities). The debt grows each year by the size of the annual government deficit, which is the amount that government expenditure exceeds tax and other revenues. The bigger the deficit, the more the national debt grows. The $40 trillion debt represents 126% of GDP – in other words it is more that the total annual output of the USA. It represents around $118,000 per head or $290,000 per household
But does this high and rising debt matter? And how does it compare with other countries?
The comparative size of the national debt
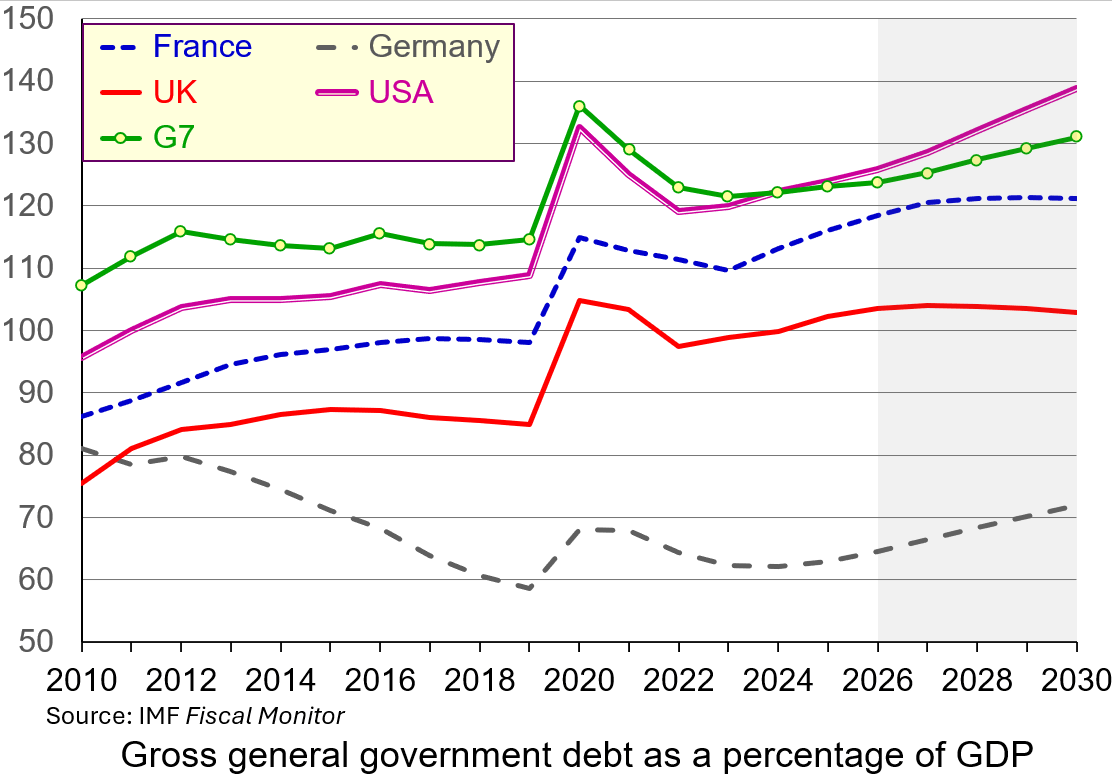 In absolute terms, the US national debt is huge, reflecting, in part, the size of the US economy. In percentage terms (126% of GDP), it is higher than Germany (65%), the UK (104%), Canada (110%) and France (118%) and slightly higher than the G7 average (124%). It is lower, however, than Italy (138%) and much lower than Japan (204%).
What is more, the IMF forecasts that the US national debt will rise from 126% of GDP in 2026 to 139% by 2030. This is because of continuing budget deficits, which require funding. The federal budget deficit is forecast to be around $2 trillion in the financial year ending September 2026 – it was $1.78 trillion in the previous financial year.
Japan’s debt percentage, by contrast, is forecast to fall from 204% in 2026 to 194% by 2030. Also, only about 10% of Japan’s debt is held by foreign investors. Around 90% is financed domestically by Japanese households, local banks, insurance companies, and the Bank of Japan. This makes Japan’s debt more sustainable than the USA’s, where around 28% is held by foreign investors (foreign governments, companies, banks and individuals).
Unlike domestic institutions (such as pension funds), which often have a structural bias to hold domestic assets, foreign investors typically view a country’s bonds as one of many global alternatives and are likely to switch faster to other countries’ assets during periods of market stress. The higher the proportion of bonds held outside the country, the more vulnerable the country is likely to be to bond market speculation.
The UK’s national debt percentage is forecast to fall slightly from 104% of GDP in 2026 to 103% in 2030. However, the UK is a global financial hub and the percentage of debt held by foreign investors (around 30%) is a little higher than in the USA. UK debt held overseas has risen from around 15% in the mid-2000s. It is likely to rise further.
Does high and rising US national debt matter?
 Servicing the debt. In February 2022, the US central bank rate (the Federal Funds rate) was 0.25%. It then rose in increments to combat rising inflation and reached 5.5% by July 2023. Although it has come down slightly since, standing at 3.75% in August 2026, US interest rates are higher now than at any time from 2008 to 2022. With higher interest rates, the USA now pays roughly $1.1 trillion annually just to service the debt. This accounts for around 15% of total federal spending – up from an historical 50-year average of just under 9%.
Upward pressure on domestic borrowing rates. To fund its deficits, the US Treasury Department must continually issue massive amounts of government bonds. This high volume of government borrowing competes for capital in global financial markets, which can push up broader interest rates. For businesses, this imposes a cost on investment and can act as a disincentive to borrow. For consumers, it adds to cost-of-living pressures by raising the cost of mortgages, car loans, credit card debt and other borrowing.
Crowding out other public spending. The money spent on servicing the debt is not available for building roads or other infrastructure, funding education, healthcare or defence, or providing social security. Annual interest payments of around $1.1 trillion now exceed national defence spending (around £960 billion), making it the third-largest item in the federal budget after healthcare and social security. As the national deficits and debt expand, so a higher proportion of current taxes is being used to fund past expenditure.
Long-term fiscal risk
The US dollar is the world’s primary reserve currency. This creates persistent global demand for US debt. However, ratings agencies and other organisations, such as the Congressional Budget Office (CBO), warn that adding $1 trillion to national debt roughly every five months is an unsustainable trajectory that could eventually erode confidence in the US economy.
 Already, many countries are seeking to expand the range of currencies used as reserves, including Chinese yuan, the euro and crypto currencies. They are also holding more gold. In 2001, the US dollar accounted for 72% of currencies held globally as reserves; by 2025 this had fallen to 57%. This process could accelerate as confidence in the USA is eroded because of the size of the debt and the capricious policies towards trade.
During periods of quantitative easing (QE), central banks, including the Fed, purchased large amounts of government bonds. But now, as central banks scale back their bond holdings in programmes of quantitative tightening (QT), foreign private investors and domestic households are being forced to absorb the majority of newly issued government debt, making pricing and yields increasingly sensitive to global investor demands. A decline in confidence can lead to a large sale of bonds, forcing down their price, thereby forcing up their yield and hence the interest that has to be paid on newly issued bonds. This is what happened in the UK in September 2022 under the short-lived administration of Liz Truss when she and her chancellor, Kwasi Kwarteng, made unfunded promises of tax cuts.
The USA is not immune to such bond market jitters. In mid-August, the yield on 30-year US Treasury bonds reached 5.3% – the highest level since 2007.
A worsening problem
 The US deficit is likely to increase, making the national debt rise more rapidly. There are various reasons.
The US population, as in many countries, is ageing and the proportion of retired people is rising. This puts increasing demands on healthcare and social security, with a proportionately smaller workforce to fund them.
The deficit has also been increased by deliberate government policies. For example, Donald Trump’s 2025 ‘One Big Beautiful Bill’ Act made substantial tax cuts, largely for the wealthy.
Congress caps the debt at a certain level and in the past this has acted as a brake on size of the deficit. However, the cap was raised by $5 trillion in 2025 and this could well happen again, allowing debt levels to expand further.
But reining in the deficit could have a contractionary effect on the economy as taxes are raised and/or expenditure is cut. Governments are reluctant to do this as it could lead to recession, or at least falling growth in the short term, and this could affect their chances or re-election. With the mid-terms approaching in the USA, and the presidential election just two years later, this is an unlikely policy for the Trump administration to pursue.
Articles
- Five charts explaining America’s $40 trillion debt
euronews, oloresz Katanich (22/8/26)
- How Much the National Debt Grew Under Trump and Biden
Time, Chantelle Lee (22/8/26)
- 7 questions about the national debt hitting $40 trillion
PBS News, Lisa Desjardins (19/8/26)
- The U.S. National Debt Officially Surpassed $40 Trillion in August: Here’s What History Says This Means for the Stock Market
Yahoo! Finance, Neil Patel, The Motley Fool (24/8/26)
- National debt reaches grim $40 trillion milestone. Here’s why that matters
CNN, Tami Luhby, John Towfighi, Matt Stiles and Amy O’Kruk (20/8/26)
- Jumpy bond markets make it clear: Trump risks driving US into debt crisis
The Guardian, Heather Stewart (23/8/26)
- Is the Trump Treasury panicking over the level of US debt?
The Guardian, Kenneth Rogoff (26/8/26)
- US debt hits $40 trillion: Who does Washington owe and why does it matter?
Aljazeera, Shola Lawal (21/8/26)
- US national debt passes $40tn after doubling in a decade
BBC News, Michael Race and Francisco Velasquez (20/8/26)
- Why the US economy is ringing alarm bells
BBC News, Michael Race (21/8/26)
- The war is raising the price of money. That’s a problem for the global economy
CNN, Matt Egan (2/9/26)
Information
Questions
- Distinguish between national debt, central government debt and general government debt.
- Would it be possible to run a budget deficit and yet for the national debt to fall as a percentage of GDP?
- Japan and Italy have a higher debt to GDP ratio than the USA or the UK. Why are they less subject to bond market pressures than the USA or the UK?
- What policy measures would you recommend to the US government to tackle the rising national debt and why?
- Could the USA ‘grow its way out of the debt problem’?

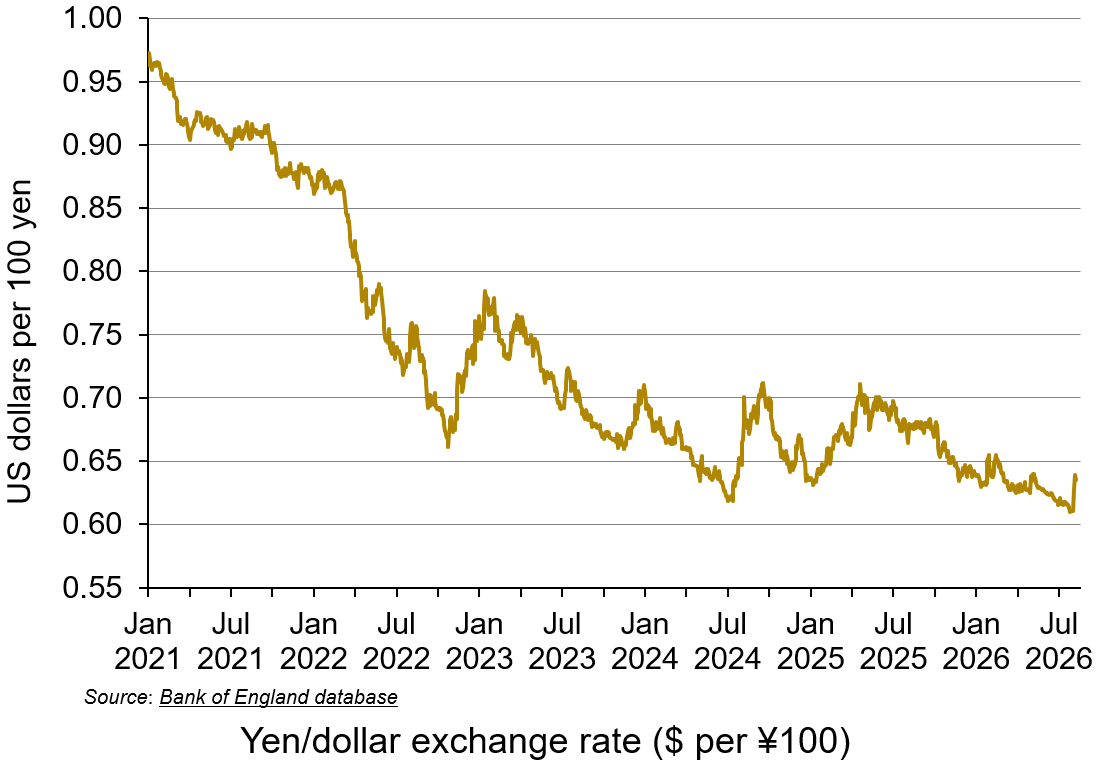
The yen has been depreciating against the dollar and other currencies for several months. It fell from 100 yen = $0.97 in January 2021 to $0.61 by the end of July 2026 – a fall of 37%. This marked a 40-year low. But then, at the end of July it rallied and by 3 August the rate was 100 yen = $0.64 – a rise of nearly 5%. But why did this happen and what will be the implications for Japan and the wider world economy?
Why has the yen fallen so much since 2021?
 There have been two main drivers.
The first is fiscal policy. For many years, Japan has been pursuing expansionary fiscal policy in an attempt to stimulate the sluggish economy. This has led to large budget deficits and public-sector debt. Since 2020, general government gross debt has been around 255% of GDP, the largest of any high-income economy.
Recently, the Japanese government has adopted aggressive supplementary budgets to fund, among other things, fuel subsidies and public-private investment initiatives. This has involved the issuance of more government bonds to fund the necessary borrowing.
 Fiscal pressures have also increased becase of demography. A rapidly aging population and declining birth rates have required substantial public spending on healthcare, social security and pensions. Meanwhile, the tax-paying working-age population has declined as a proportion of total population.
On the plus side, unlike most highly indebted nations, over 90% of Japan’s debt is held domestically by Japanese residents, Japanese institutional investors, banks and the Bank of Japan (BoJ). This lowers the risk of default and hence the risk premium on Japanese bonds.
 The second driver is monetary policy. Interest rates have been kept low over many years, including periods of negative rates, as the BoJ has attempted to stimulate the economy. Low interest rates have sometimes been backed up with quantitative easing to increase money supply.
Since March 2024, however, there have been four interest rate increases. The latest was in June 2026 when the BoJ raised the short-term policy rate from 0.75% to 1.0% – the highest level since 1995. Despite this, interest rates have remained below those in other countries, and this contributed to the continuing fall of the yen.
A falling yen has helped to increase Japanese exports by making them more competitive, but more expensive imports have contributed to rising Japanese inflation.
Low interest rates have also stimulated the yen-dollar carry trade. This is where investors borrow money in yen at low interest rates, convert it into US dollars and invest it in higher-yielding US assets, typically US government bonds (‘Treasury bonds’). This borrowing in yen to buy dollars further contributed to the depreciation of the yen against the dollar.
Co-ordinated intervention
 In an attempt to raise the value of the yen, the Bank of Japan and the US Federal Reserve acted together – their first joint currency rescue operation since 2011. The BoJ spent tens of billions of dollars to buy yen; the US Treasury bought yen by selling euros. Prior to the intervention, global hedge funds held near-record short positions against the yen, meaning that they sold yen at a current price, agreeing to buy them back at a particular later date, hoping that the yen would fall in the meantime and that they would therefore make a profit. The sudden joint intervention forced these traders to buy back the yen to cut their losses before the rate rose further. This accelerated the yen’s appreciation.
But why did the USA join Japan in intervening? Japan is the largest foreign holder of US Treasuries ($1.1 trillion). The USA intervened to discourage Japanese investors from selling US Treasuries in order to raise cash, thereby pushing up US borrowing costs.
The rise in the yen was also encouraged by speculators who are expecting further interest rate rises from the BoJ to counter inflation and support public finances, driving domestic bond yields higher. This will lead to a narrowing of interest rates between Japan and other countries.
Effects on the Japanese economy
 If the yen continues to appreciate, this will help to reduce inflation by making imports cheaper and will help to ease cost-of-living pressures on Japanese consumers. Japan is heavily reliant on imported energy and raw materials.
However, the decline in the yen over recent years has provided a large boost to Japanese exports. A sharp reversal in this could severely affect exporters’ profits and have a serious negative impact on economic growth.
If the appreciation continues, it would lead to an unwinding of the carry trade. To prevent mounting currency losses, highly leveraged institutional investors would be forced to sell assets, such as US and other countries’ shares and bonds to buy back yen and pay off their debts. This potentially massive unwinding would be likely to create global market volatility and drive up interest rates.
Articles
- Yen holds gains after Japan, US confirm joint intervention, signal more action
Reuters, Makiko Yamazaki and Leika Kihara (3/8/26)
- Yen surges to three-month peak, dollar pares losses after intervention
Reuters, Chibuike Oguh (3/8/26)
- US dollar weakens sharply against the Japanese yen after officials intervene in markets
ABC7 Eyewitness News, Mayuko Ono and Elaine Kurtenbach (3/8/26)
- Yen hits three-month high after Trump helps prop up currency
The Guardian, Graeme Wearden (3/8/26)
- Why has Trump stepped in to prop up Japan’s currency?
The Guardian, Jonathan Yerushalmy (3/8/26)
- Why the U.S. stepped in after decades to prop up Japan’s yen — and what’s at stake
CNBC, Lee Ying Shan (3/8/26)
- Politics & Policy Analysis: How Bessent is pushing Warsh’s Fed to expand backstop for Japan’s yen defense
CNBC, Matt Peterson (3/8/26)
- Why Japan is propping up the yen – and why the US helped
The Straits Times (4/8/26)
- The Pros and Cons of a Strong Dollar
Johnston Investment Counsel (3/8/26)
- Why the U.S. Stepped In to Prop Up Japan’s Yen Currency
Yahoo!Finance, Tiago Ventura (3/8/26)
- Why the U.S. Is Helping Prop Up Japan’s Weak Currency
The New York Times, Eshe Nelson (3/8/26)
- U.S.-Japan Intervention Triggers Yen Carry Trade Fears
The Chosun Daily, Lee Hai-woon (3/8/26)
- What top minds in markets are saying about the US intervention to prop up Japan’s currency
Business Insider, Jennifer Sor (3/8/26)
Data
Questions
- What have been the benefits and costs to Japan of a depreciating exchange rate?
- Explain the carry trade.
- Why might the yen-dollar carry trade unwind and what would be the consequences for Japan and the USA?
- Find out what has happened to the exchange rate between the yen and the euro. Has this been driven by the carry trade?
- For what reasons might the yen (a) now continue rising; (b) resume depreciating?
- Find out what has happened to the yen/dollar exchange rate since this blog was written. Explain your findings.

The prices of many species of fish have risen in recent months. Coastal pelagic fish, such as mackerel, herring and sardines have risen especially rapidly. Mackerel, once seen as a cheap source of protein, is no longer quite such a ‘bargain’.
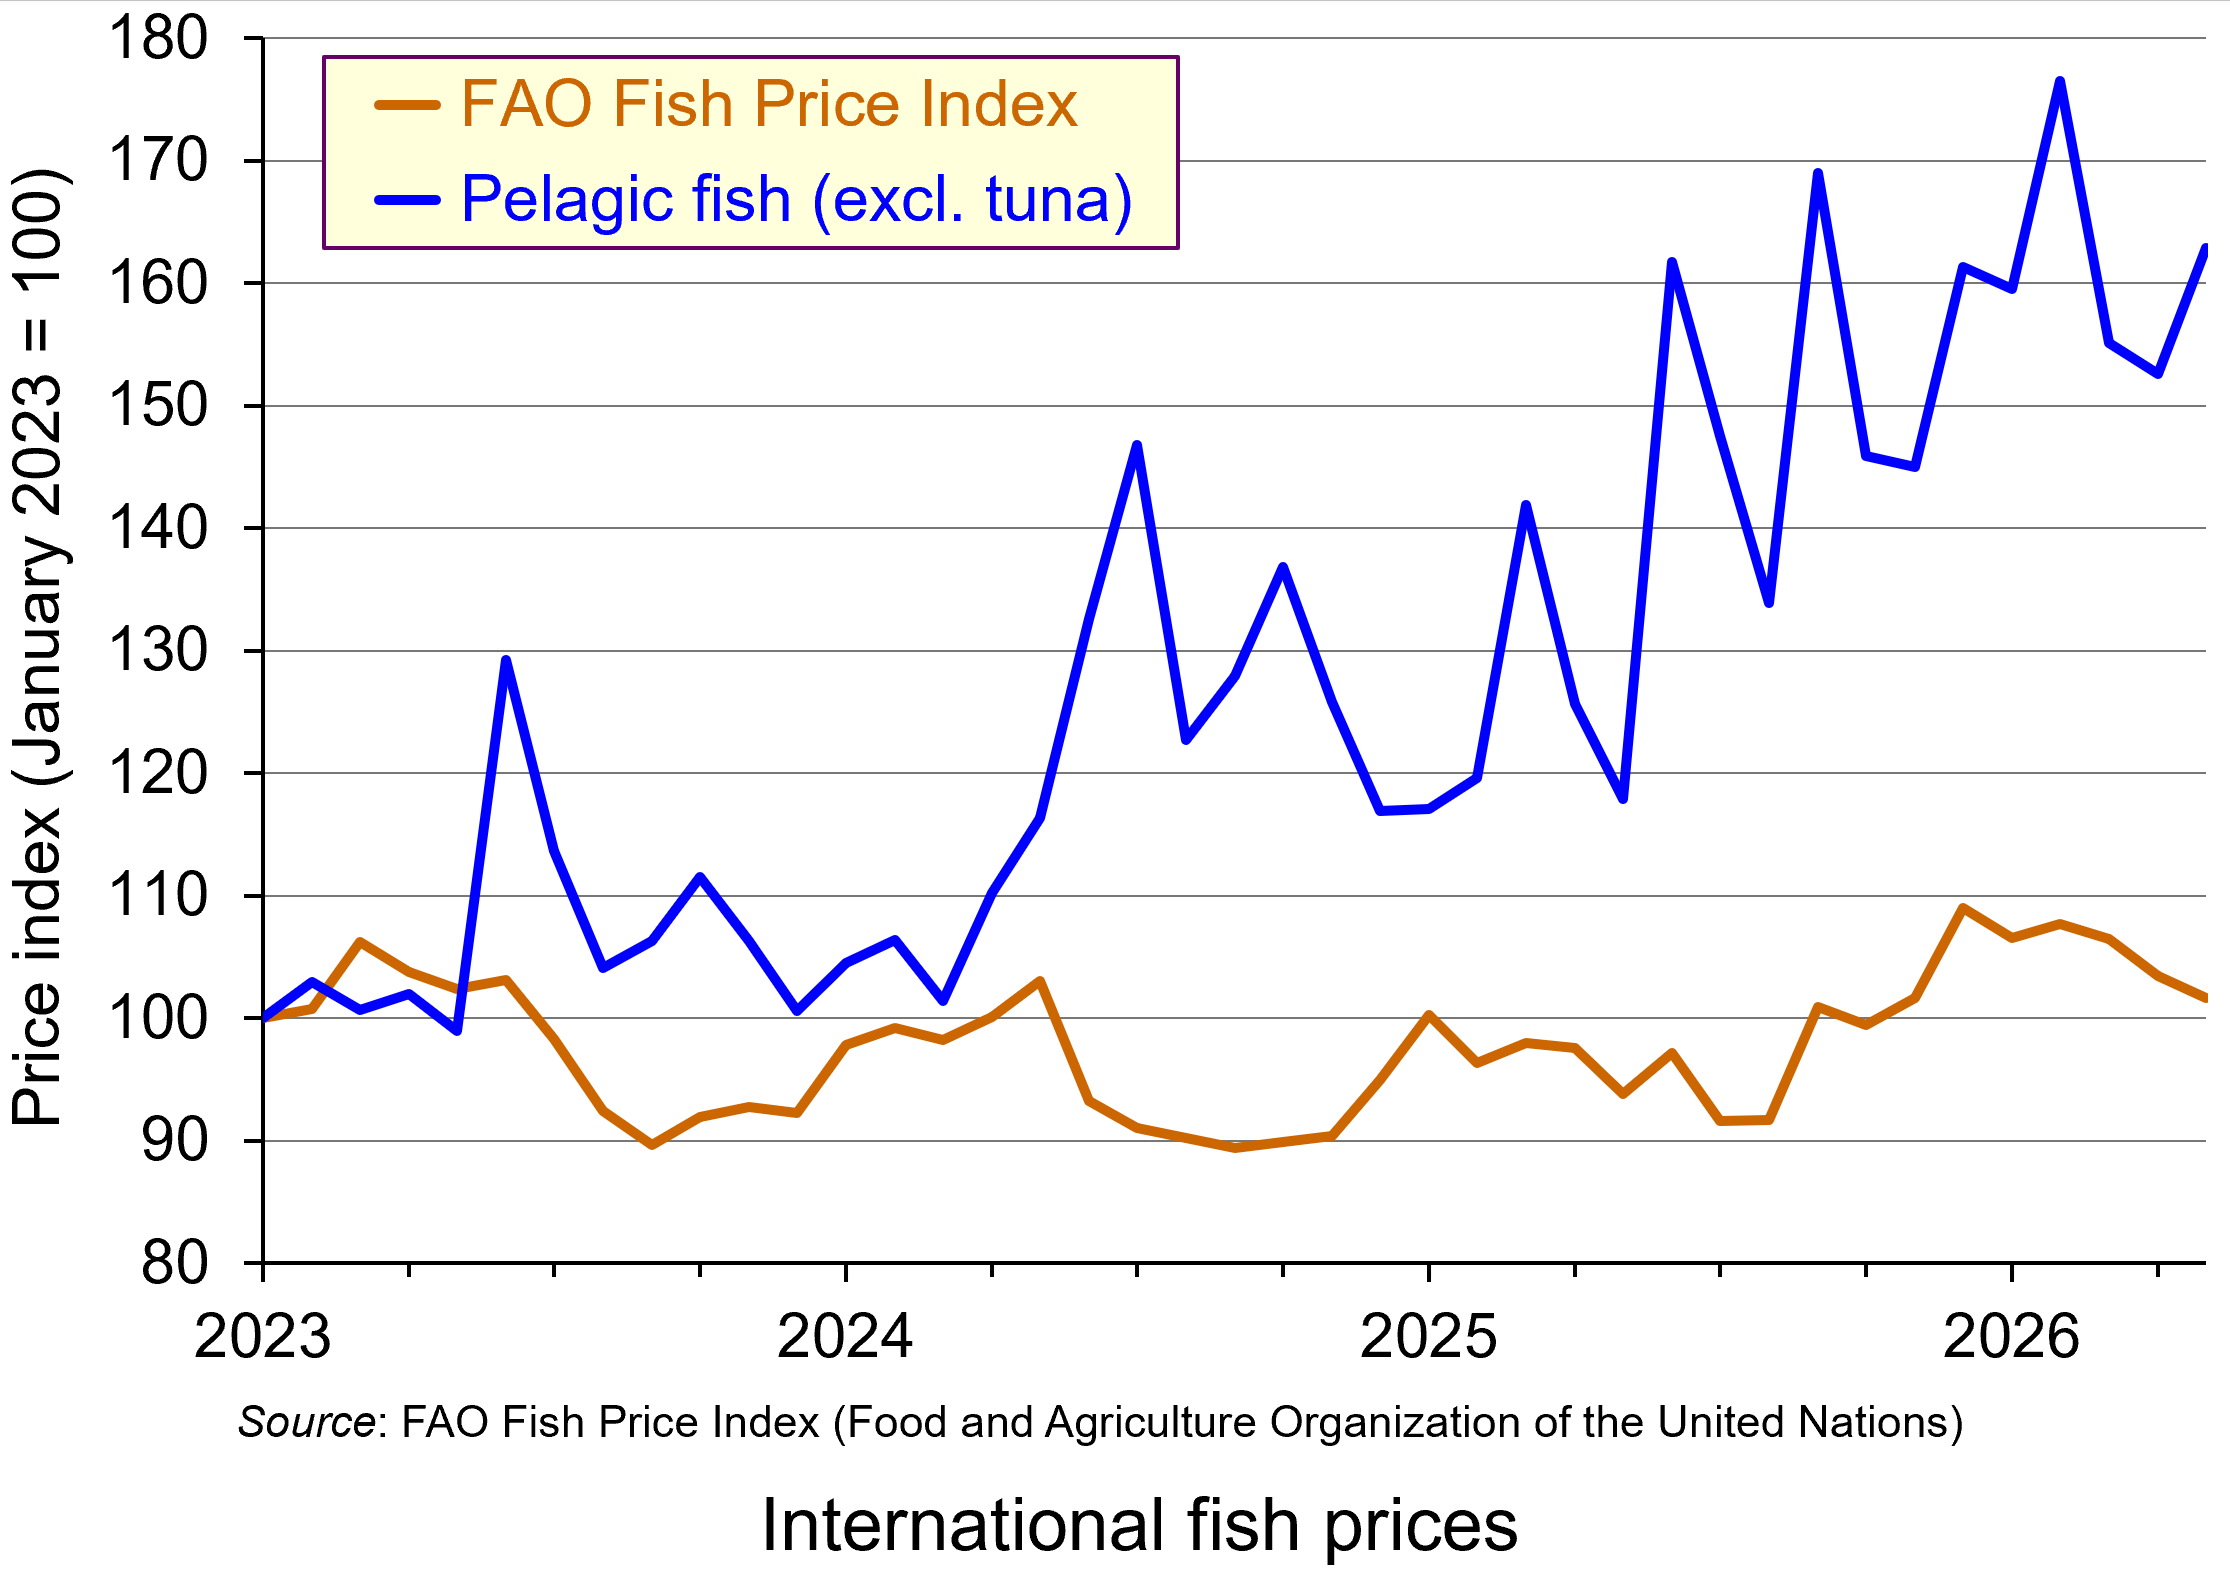 From January 2023 to May 2026, the international price index of pelagic fish rose by 69%. In 2025, UK supermarket fresh, chilled smoked and tinned mackerel prices rose by an average of 25%; and over the first part of 2026, some tinned mackerel product lines have increased by as much 55%. In February 2026, Waitrose announced that it would suspend sales of fresh and chilled mackerel and tinned mackerel once current stocks had been cleared. It cited overfishing and sustainability concerns.
Supply and demand
But why have mackerel prices risen so much? The price of fish is determined by demand and supply. So what has changed? The main changes have been on the supply side.
Supply. Most of the world’s supply of mackerel comes from the Northeast Atlantic. These waters have been overfished for many years, thereby depleting the stock of the fish and reducing the amount of mackerel caught.
 To arrest the decline and allow stocks to rebuild, the International Council for the Exploration of the Sea (ICES) recommended a quota of 174,357 tonnes for 2026. This would represent a 70% cut from 2025. The main fishing countries – Norway, the UK, the Faroe Islands and Iceland – eventually agreed to a quota of 299,010 tonnes: a cut of 48%. After a series of bilateral agreements between the four countries over access to each other’s waters, this resulted in the following quota shares: UK 30.55%, Norway 26.4%, Faroes 12% and Iceland 10.5%. The remaining 20.55% would be for the EU, Greenland and Russia.
Despite these other countries not being part of the deal, in May 2026 the EU agreed to reduce its catch by 48% too. Russia, however, set its own quota of 67,548 tonnes, which is 22.6% of the total 299,010 quota, above the 20.55% set aside for the EU, Russia and Greenland combined and almost almost five times Russia’s historic quota share! The UK, EU and Iceland responded by agreeing to bar Russian vessels carrying mackerel from entering their ports.
The quotas have added to the decline in supply, even though the aim is to increase supply in the future as stocks are rebuilt. In May this year, the Norwegian catch was down nearly 85% – well below the 48% reduction in the quota.
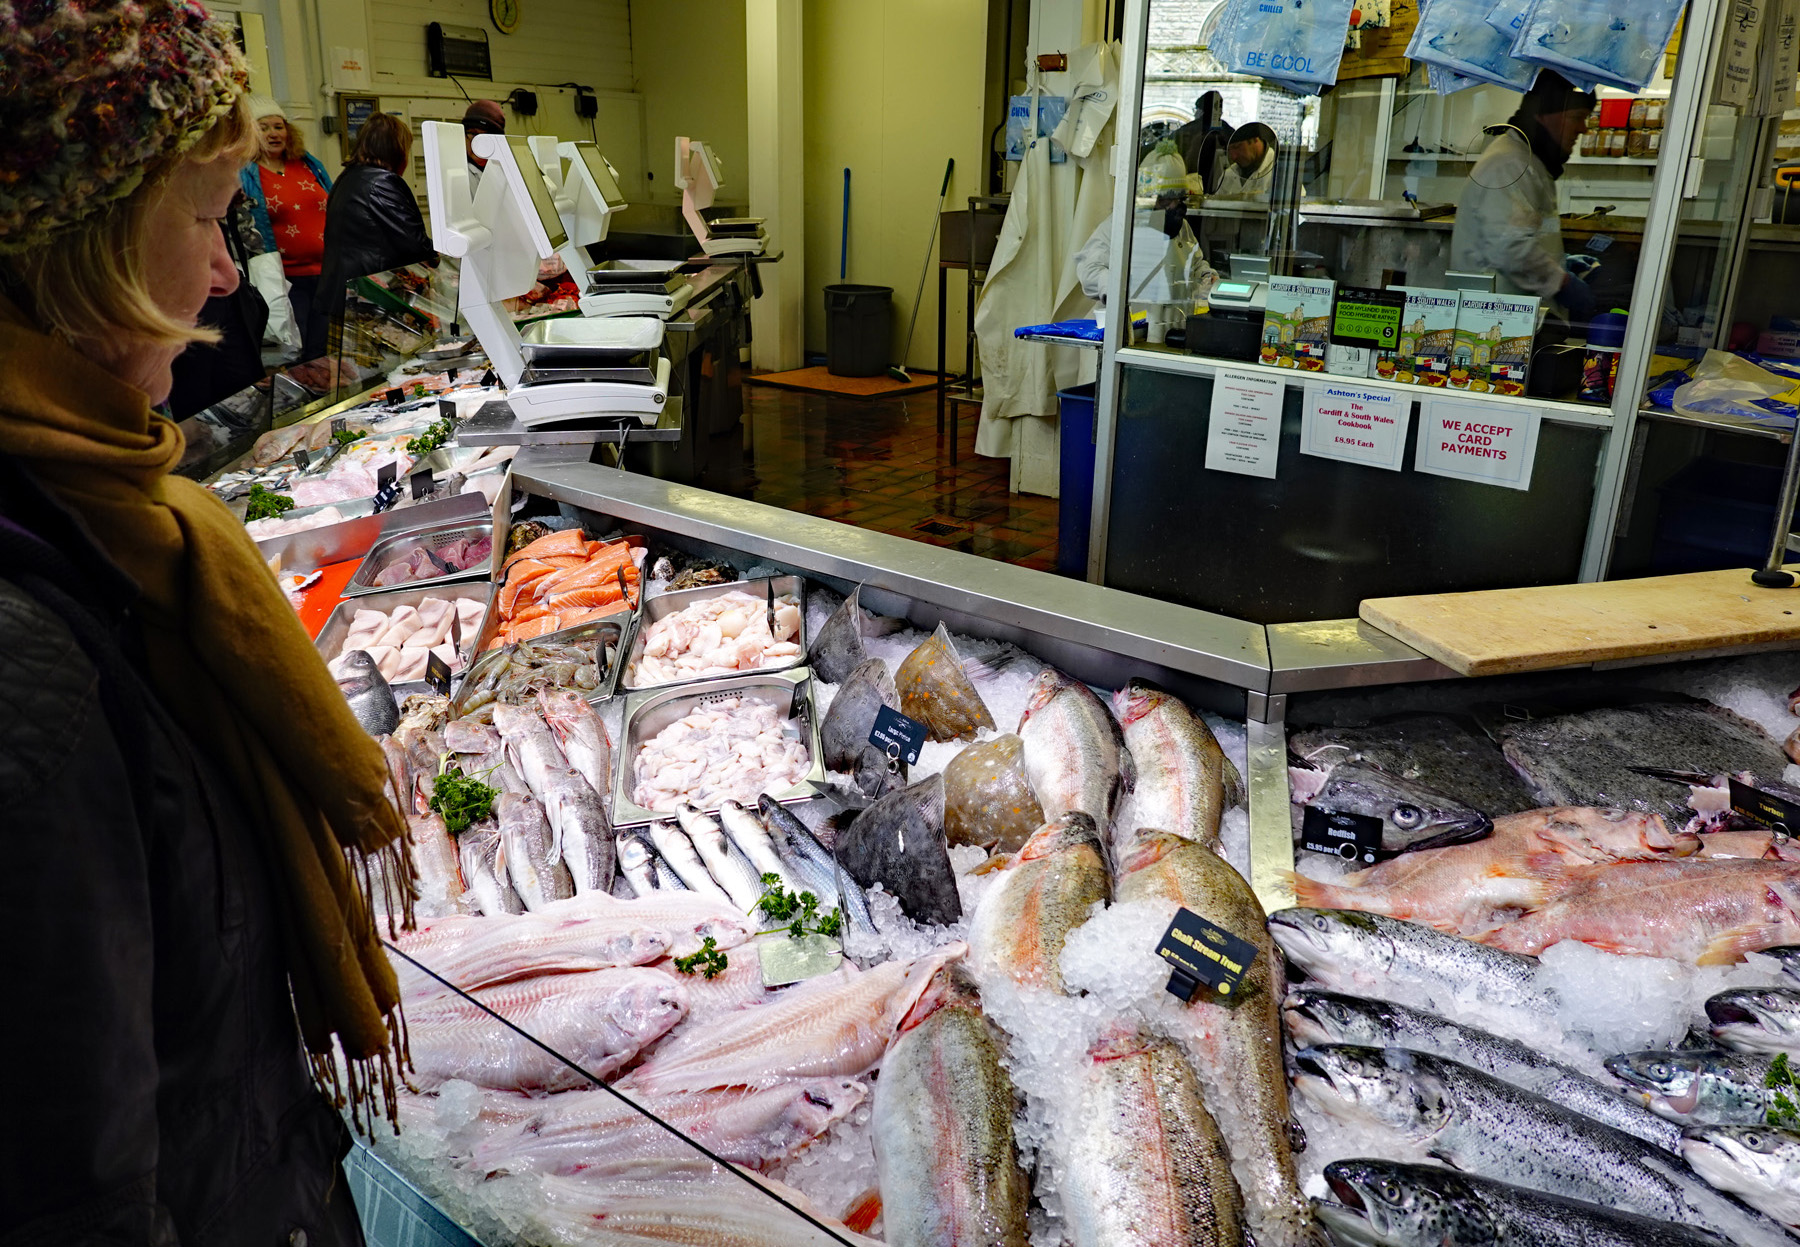 Demand. Despite higher prices, demand has remained strong. Part of the reason is that demand is relatively inelastic. This is because, despite its increase in price, mackerel remains a relatively cheap fish and thus there is little option to switch to cheaper alternative fish. Indeed, with other fish going up in price, and meat too, some people may even switch to mackerel.
Another reason for strong demand is the growing market outside Europe, especially in southeast Asia, China, South Korea and Japan. In some of these countries, mackerel is seen as a luxury fish and people are prepared to pay higher prices, making demand relatively inelastic but at the other end of the market. In 2025, imports of frozen whole mackerel into the region rose by nearly 9%, despite rising prices.
However, Norwegian exports to the region have been falling, reflecting lower quotas in 2025 and lower still in 2026. This has further exacerbated the rise in price and intensified competition between Asian importers. For example, in July 2026, Korea sent a ‘mackerel envoy’ to Norway and other major exporters to seek to secure additional supplies.
The future
With supply restricted by declining stocks and tighter quotas, and with a price inelastic and growing demand, the high prices of mackerel in all forms look set to last – at least until stocks rebuild and quotas can be relaxed. But, with total quotas well above the level suggested by the ICES, rebuilding could take a long time.
Articles
- Norwegian Mackerel Prices Drive Record Pelagic Values in 2025
The Fishing Daily, Oliver McBride (25/5/26)
- Mackerel prices soar as demand and supply pressures take hold
The Grocer, Charles Elliman (23/1/26)
- Mackerel Prices Have Broken Historical Highs And May See Another Surge in 2026
Caharbor Import and Export Co., Ltd, China (12/1/26)
- Waitrose to suspend mackerel sales due to overfishing concerns
BBC News, Emer Moreau (27/2/26)
- Holy mackerel! The fish Waitrose removed from its shelves
Epigram (University of Bristol student newspaper), Grace Golby (6/6/26)
- Four Northeast Atlantic coastal parties agree on 2026 mackerel quotas, shares; EU left out again
SeafoodSource, Regin Winther Poulsen (17/12/25)
- EU Raises Mackerel Quotas despite Scientific Overfishing Warnings
The Fishing Daily, Oliver McBride (30/3/26)
- High Mackerel Prices Reshape Asian Small Pelagic Trade
The Fishing Daily, Oliver McBride (2/6/26)
- Korea dispatches ‘mackerel envoy’ to Norway as prices spike
Korea JoongAng Daily, Ahn Hyo-Seong (6/7/26)
- Norwegian Mackerel Supply Plunges, Korean Catch Regains Price Edge
Seoul Economic Daily, Nam Yoon-jung (28/6/26)
- Geopolitical unrest, currency effects and quota cuts led to a decline in the value of Norwegian seafood exports in the first half of the year
Norwegian Seafood Council, Press Release (3/7/26)
- Norwegian Seafood Exports: Frozen Mackerel and Herring Prices Surge in Week 26 of 2026
IndexBox (1/7/26)
- New sanctions on Russia following huge unilateral increase in mackerel quota
Fishing News, Steve Mackinson (9/7/26)
Data
Questions
- Draw a supply and demand diagram to illustrate what has happened to mackerel prices.
- What is the effective price elasticity of supply of mackerel?
- Why is demand for mackerel relatively price inelastic in the UK, except when prices rise above a certain level?
- Why is demand for mackerel relatively price inelastic in certain Asian countries, such as Japan and South Korea?
- In which country is demand for mackerel likely to be more income elastic: the UK or Japan?
- Under what circumstances might the price of mackerel in five years’ time be (a) higher than now; (b) lower than now? What will determine which is more likely?
- Should other supermarkets follow Waitrose’s lead in stopping the sale of mackerel?
- What is the ‘tragedy of the commons’? Why is a common resource such as fish in the open seas likely to result in the tragedy?

Andy Burnham is set to become UK Prime Minister on 20 July if no-one else stands to replace Keir Starmer. In a speech on 29 June, he outlined his economic vision. Central to this is devolution, where a greater number of economic decisions would be taken locally rather than by central government. This approach has been dubbed ‘Manchesterism’, in reference to his time as Mayor of Greater Manchester from 2017 to earlier this year. Under his mayoralty, Greater Manchester (GM) achieved faster economic growth than other regions or cities in the UK. From 2017 to 2023, GM’s gross value added grew by an average of 6.6% per annum and the city of Manchester’s by 8.4% – the highest of any city in the UK. The UK average was 4.9% and London’s was 4.6%.
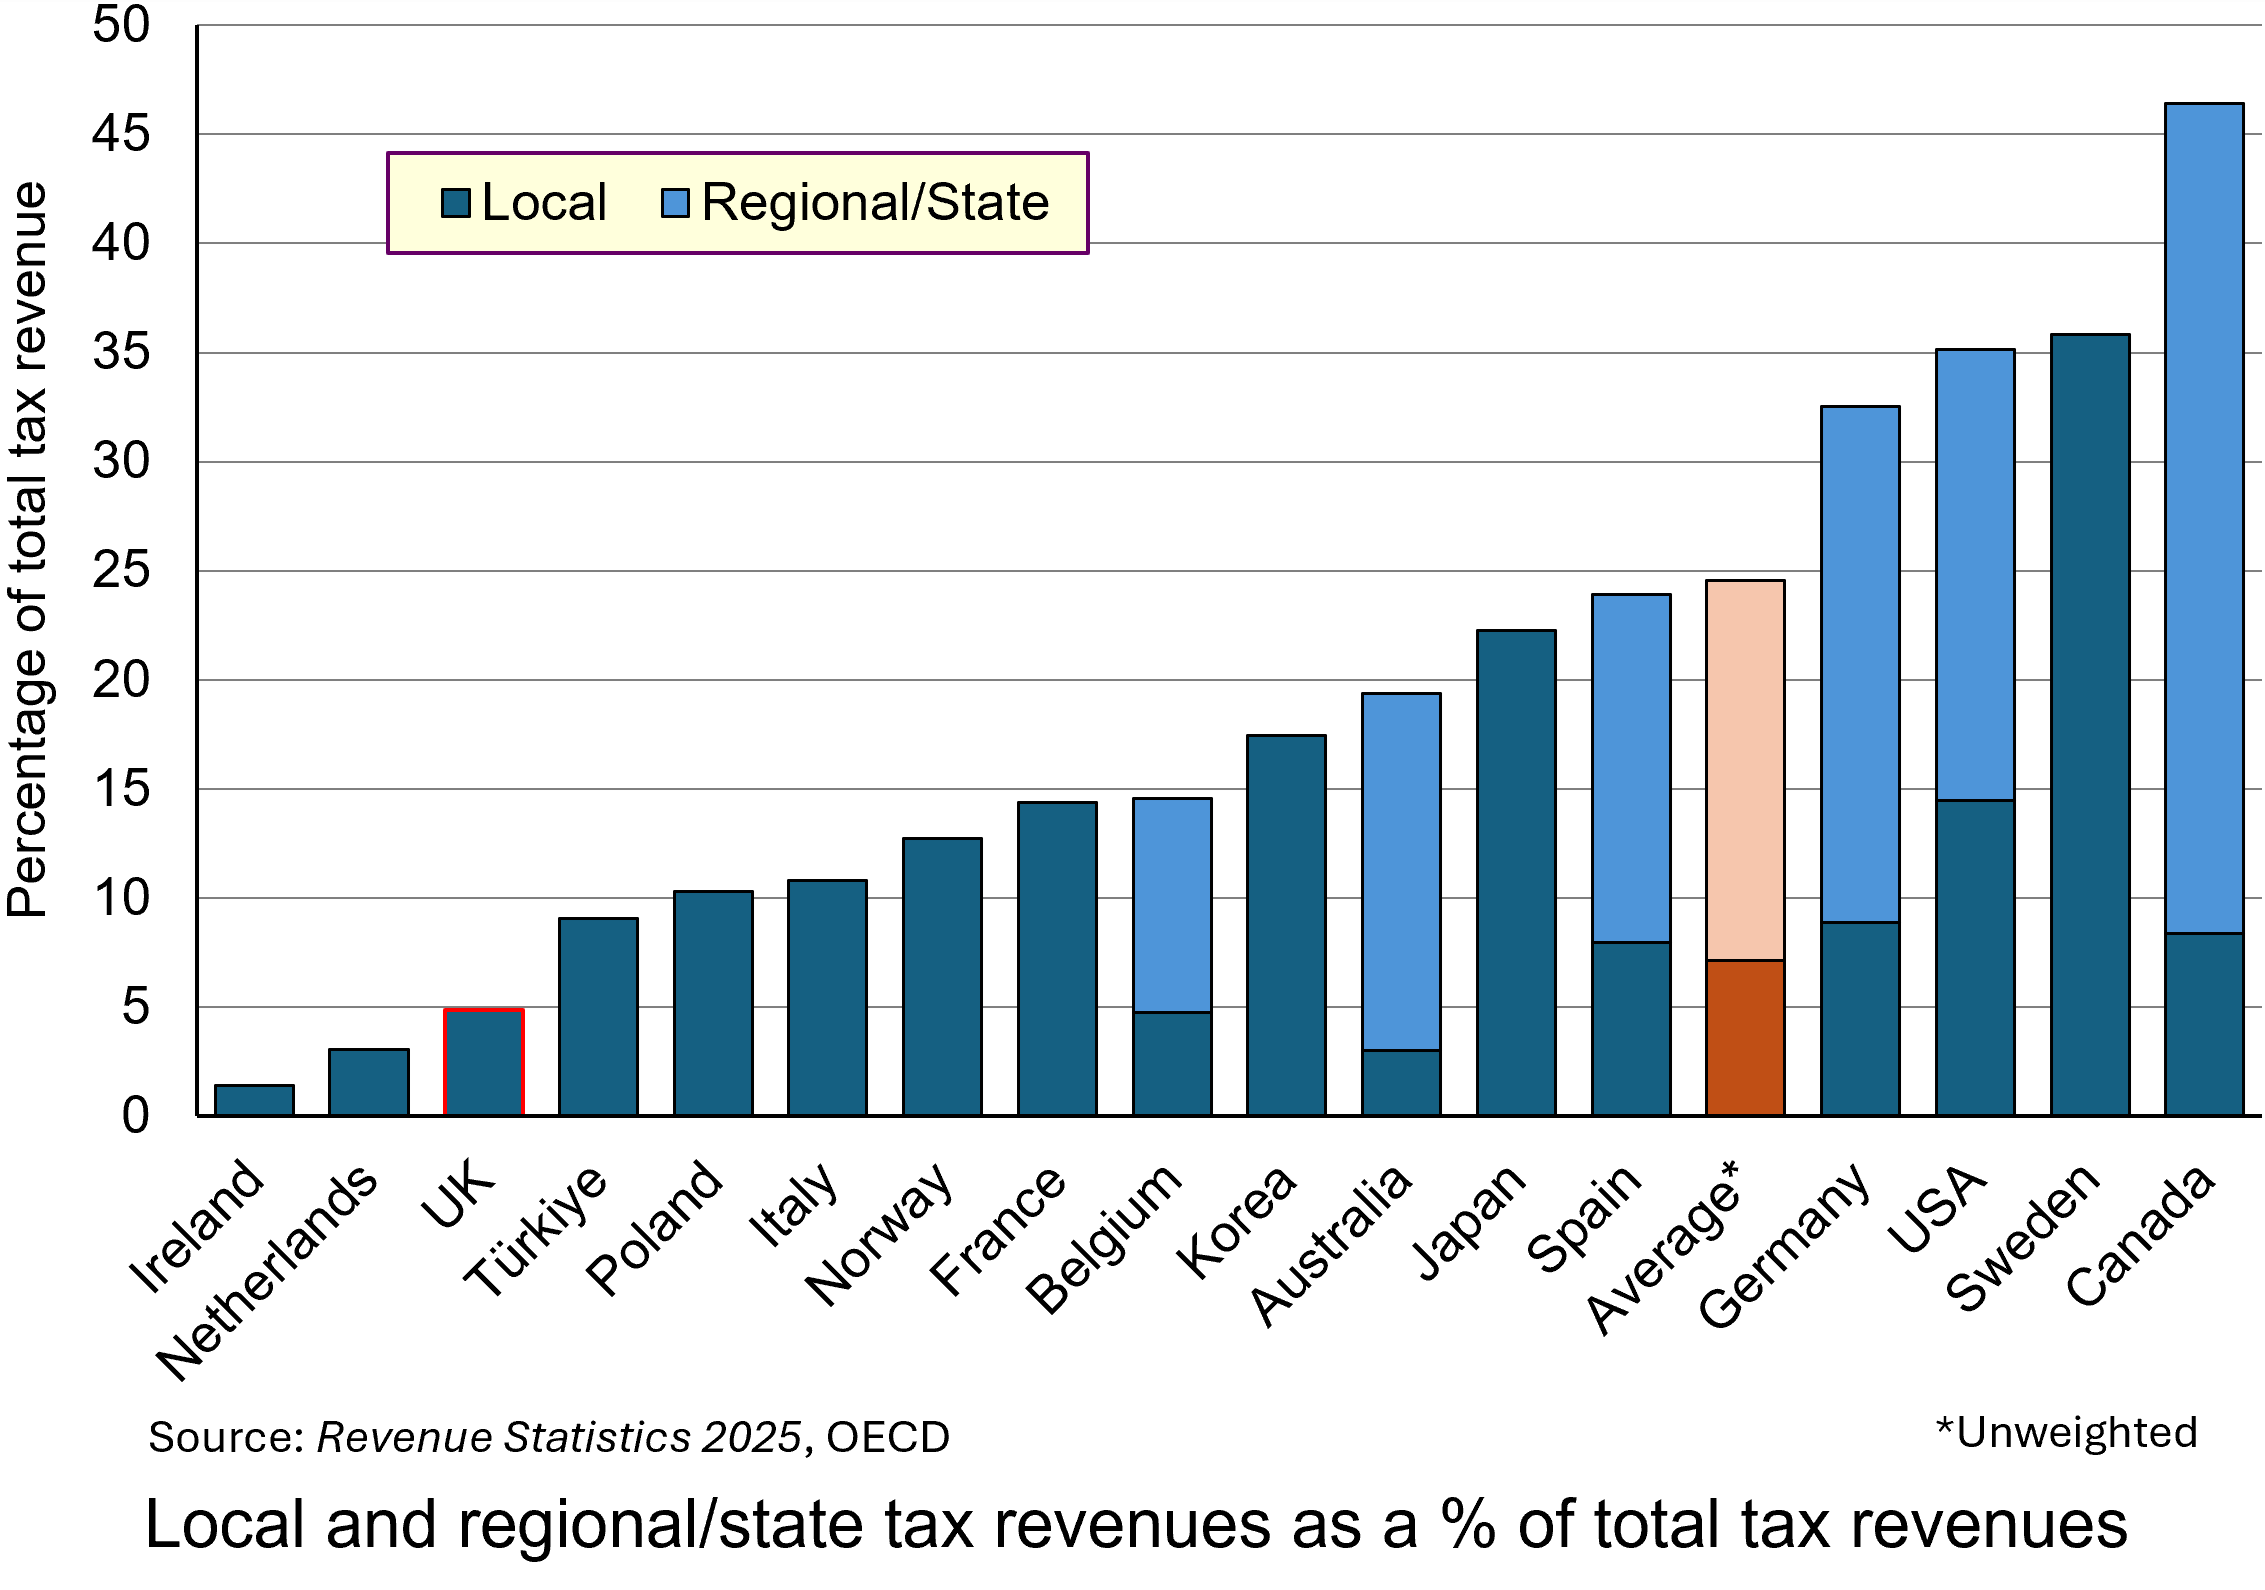 The UK, especially England, is one of the least devolved of the OECD countries. One aspect of this is taxation. The chart shows local taxes and, in the case of federal countries, state/regional/provincial taxes too. (Click here for a PowerPoint.)
Only 4.9% of UK tax revenue is in the form of local taxes (council tax and 50% of business rates) and the amount that can be raised in council tax is capped by the central government. The remainder of UK tax revenue goes to central government in the form of income taxes, social security taxes (national insurance), VAT, excise duties, etc. This compares with an average of 7.1% local taxes and 24.5% local plus regional taxes across the 17 OECD countries shown in the chart.
Andy Burnham plans to shift some of the spending and tax-raising powers from Whitehall to metro mayors and local councils. The aim is to stimulate productivity and economic growth at a regional and local level by tailoring support and incentives to local needs and strengths. Local leaders will be best positioned to understand these needs and strengths and will be able to customise spending and support appropriately.
 Examples of the types of greater autonomy over decision making would include:
- Control over adult education budgets to allow them to be tailored to provide training and apprenticeships to meet the skills requirements of existing and emerging industries in the area;
- Forming partnerships with local universities to support research and development that complements regional economic growth;
- Providing greater funding for and control over local transport infrastructure, including roads, buses, trams, trains, etc., with local consultation to make them fit for the local population and businesses;
- Tailoring business incentives to local needs and to the needs of the businesses themselves so as to attract an increase in investment;
- Greatly expanding council house building, which has virtually dried up in recent years, with mayors and/or local authorities empowered to develop local housing strategies, including affordable housing programmes, and to direct housing investment funding to particular housing developments in areas of greatest need.
Andy Burnham has pledged to stick to the government’s two existing fiscal rules:
a) The Stability Rule (Fiscal Mandate): the current (day-to-day) budget must be in balance or surplus. In other words the provision of salaries, public services, state pensions, welfare, etc. must be covered by government revenues (largely taxation). The government should borrow only to fund long-term investment.
b) The Debt Rule (Stock Mandate): each year, public-sector net financial liabilities (PSNFL) must be forecast by the OBR to be falling as a share of GDP compared to the previous year in three years’ time. This acts as a break on the amount of borrowing for long-term investment.
It is likely, therefore, that there will be little extra government money for investment. Rather, the policy involves a redistribution of public-sector investment from central government to mayoral/local authorities.
 In theory, such a policy of devolution need not see a redistribution from richer to poorer regions, but that might be part of the policy when the details are published. The UK has a bigger gap in productivity (GDP per worker) between its capital city and other large cities than in do other countries. Birmingham, Sheffield, Leeds, Newcastle, etc., as well as Cardiff, Glasgow, Edinburgh and Belfast, lag further behind London in output per head and economic growth than do other European countries lag behind their capital city. Thus the gap between Paris and Lyon, Toulouse and Marseille is narrower; as is that between Belin and Munich, Hamburg and Frankfurt. It is a similar picture in Spain and Italy. In the USA, some cities, such as San Francisco, outperform Washington DC and New York. A redistribution of government funding from London to the regions could see their incomes rise faster without having too much impact on London, which would still continue to attract large amounts of private investment.
Overall, there would be little increase in government funding. ‘Manchesterism’ is not, therefore, a demand-side policy. It is a supply-side policy – directing funds to areas where, combined with local incentives and local knowledge, the funding could yield greater returns and thereby increase potential GDP.
But this is not to say that there is no effect on aggregate demand. The hope is that devolution along the lines outlined by Andy Burnham will attract increased private investment, thereby increasing actual GDP as well as further increasing potential GDP.
We wait to see the details over the coming weeks.
Articles
- Will Andy Burnham’s devolution plan raise economic growth?
BBC Verify, Ben Chu (29/6/26)
- Burnham’s ‘Manchesterism’ could change the UK, but is not yet a full economic plan
BBC News, Faisal Islam (29/6/26)
- Burnham’s ‘Manchesterism’ got him to No 10 – but will it work for the UK?
BBC News, Faisal Islam (17/7/26)
- Burnham says there is some room for movement on tax
BBC News, Kate Wannel and Joshua Nevett (3/7/26)
- England’s mayors should be given sweeping new powers, says devolution expert
The Guardian, Kiran Stacey (2/7/26)
- What is Andy Burnham’s economic and political blueprint for Britain?
The Guardian, Richard Partington and Jessica Elgot (29/6/26)
- Why Andy Burnham’s radical plan relies on the Treasury being a friend of devolution
The Conversation, Dave Richards and Sam Warner (26/6/26)
- How Andy Burnham may try to give the UK economy a boost in his ‘10‑year plan’
The Conversation, Steve Schifferes (29/6/26)
- Could Andy Burnham let mayors raise more taxes?
House of Commons Research Briefing, Mark Sandford (2/7/26)
- Andy Burnham sets out policy plans in first major speech in PM leadership bid: Legal comments
Browne Jacobson, Dan Robinson (29/6/26)
- What does Andy Burnham think ‘Good Growth’ is?
Centre for Cities, Jess Tulasiewicz (30/6/26)
- Manchester’s digital transformation could be a blueprint for other parts of the UK
The Conversation, Richard Whittle (21/7/26)
Videos
Data
Questions
- Use an aggregate demand and supply diagram (simple or dynamic) to illustrate the effects on real GDP of a successful devolution strategy.
- Find out the details of the last Conservative government’s ‘levelling up’ policy. Was it similar in aims to that of ‘Manchesterism’?
- How could a policy of devolution as outlined by Andy Burnham affect income distribution within regions?
- Find out about the approach to regional policy in the EU. Is it similar to that being advocated by Andy Burnham?
- What is meant by ‘regional multipliers’? Why might they differ from the national multiplier?
 It is 10 years since the Brexit referendum. From an electorate of 46,501,251 people, 17,410,742 (37.4%) voted to leave, 16,141,241 (34.7%) voted to remain and 12,949,258 (27.8%) did not vote. The UK left the EU on 31 January 2020 at 11:00 pm, but remained in the single market and customs union during a transition period lasting for a further 11 months until December 31 2020.
To mark the 10th anniversary of the vote a number of articles have been written assessing the effects of Brexit. Here we look at the economic effects, as do the articles linked below. This blog updates the analysis of an earlier one, The costs of Brexit: a clearer picture.
Trade
After the referendum, extensive negotiations took place on the trading arrangements between the UK and EU that would exist once Brexit was finalised.
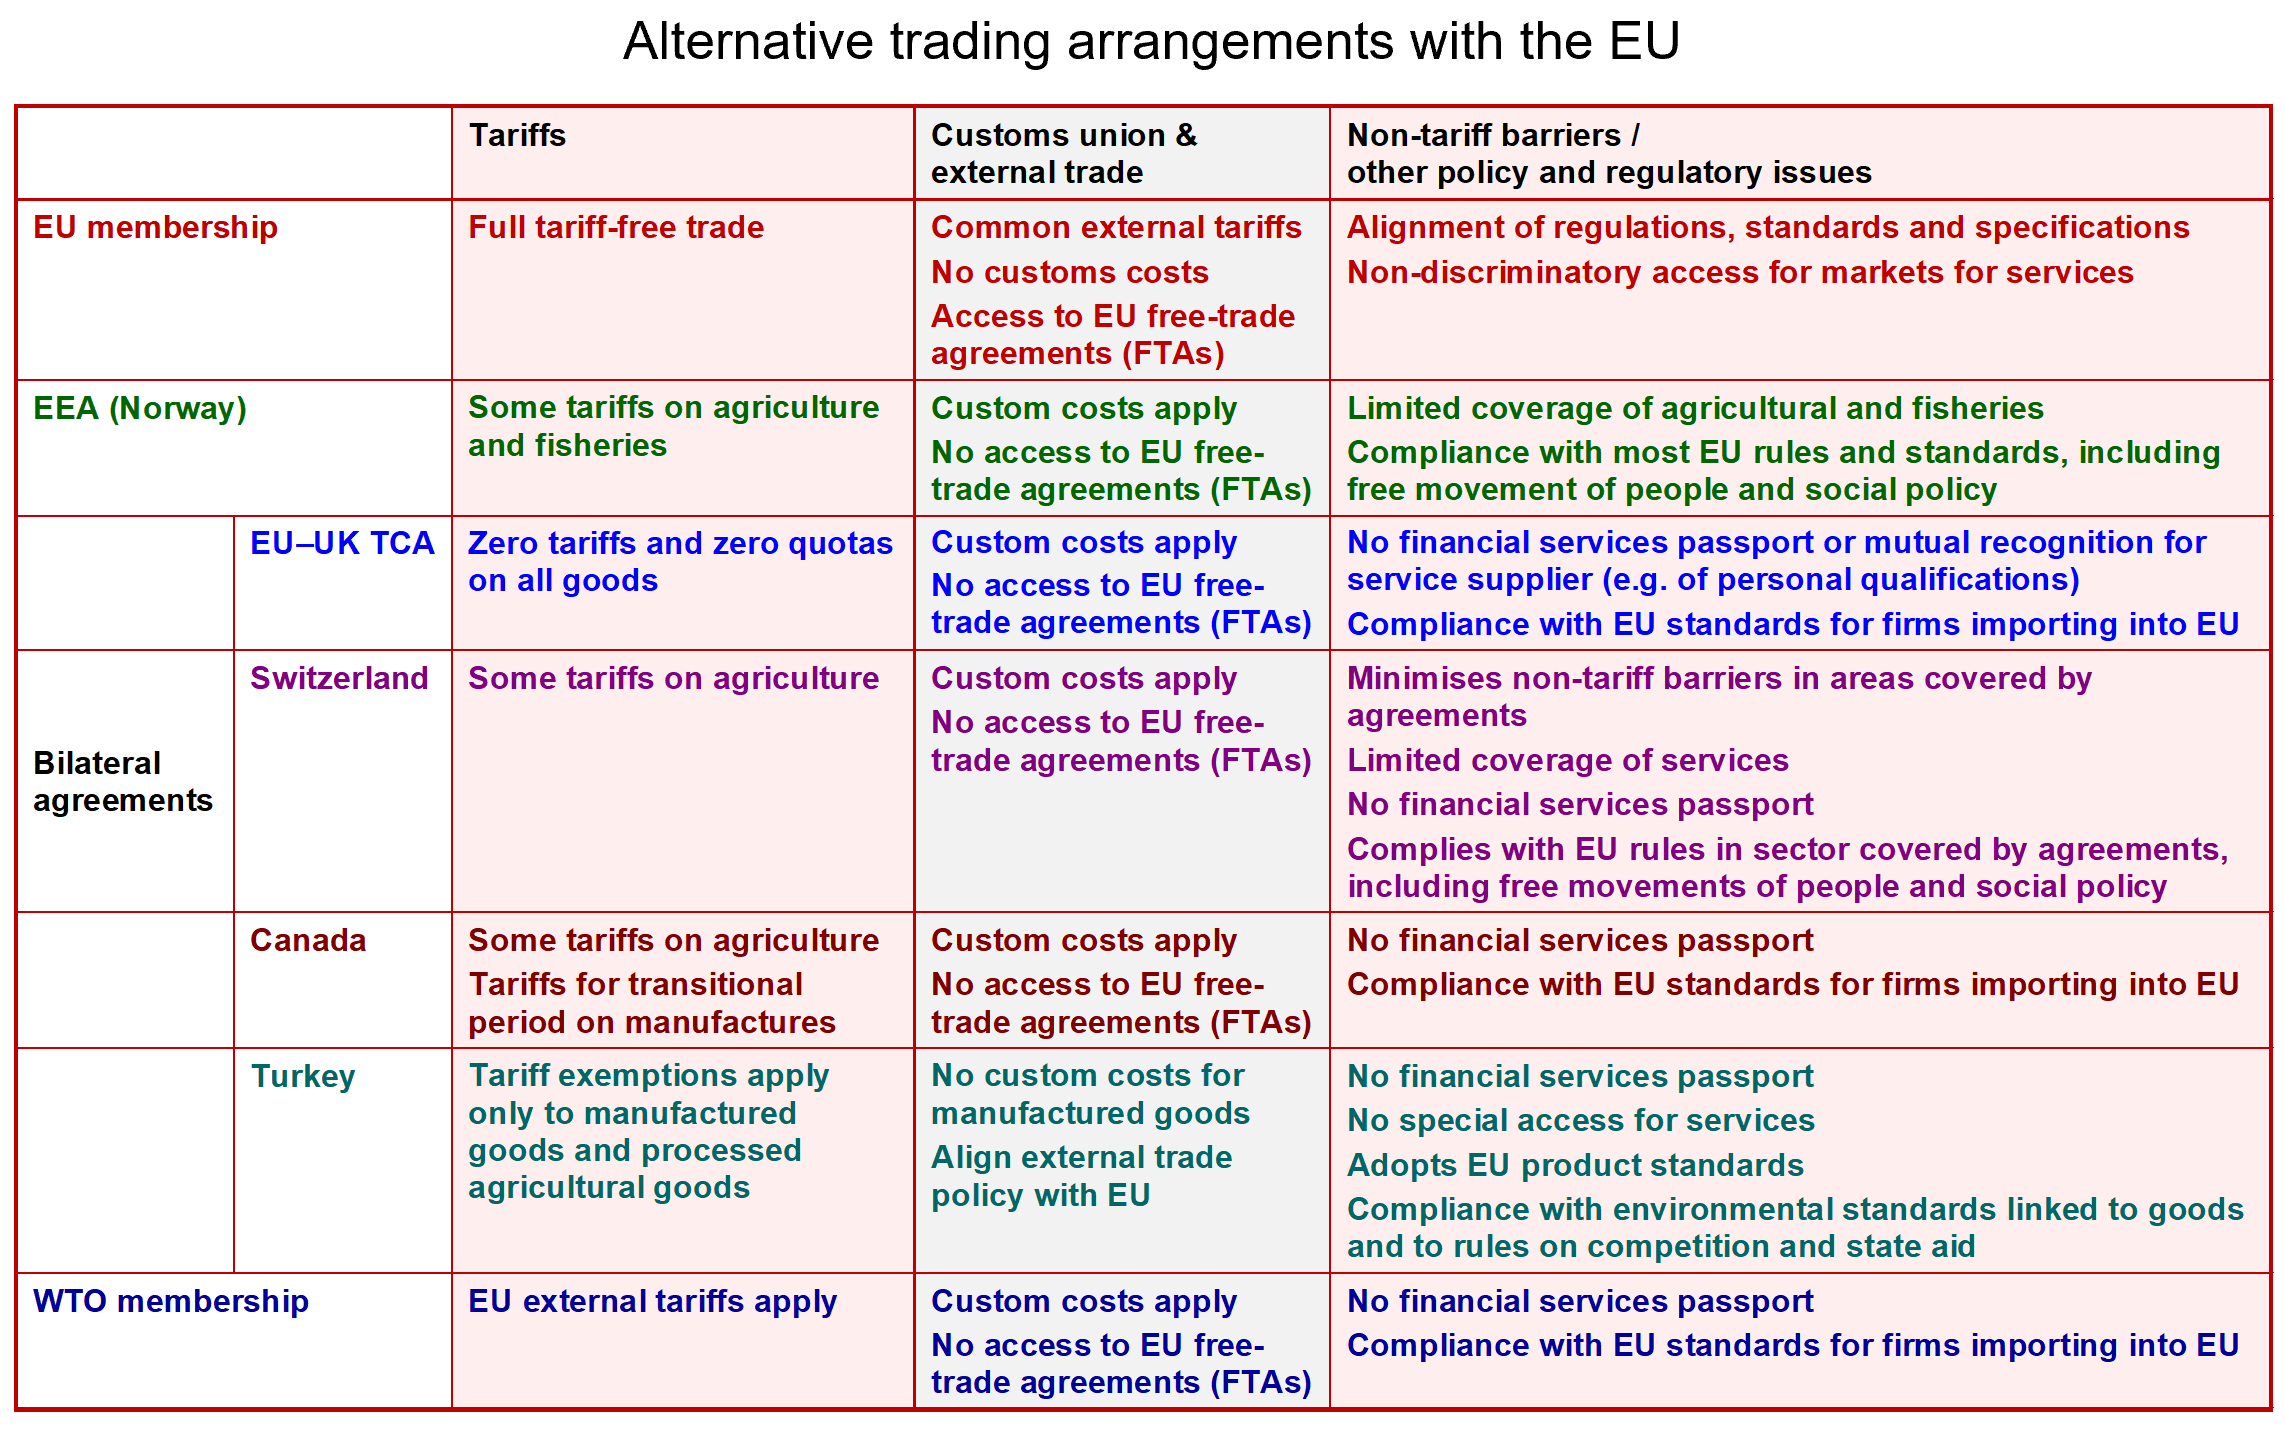
One possibility was ‘The Norwegian model’, which would have seen the UK join the European Economic Area (EEA), giving it access to the single market, but removing regulation in some key areas, such as fisheries and home affairs. This was ruled out in favour of a bilateral trade agreement. Three main types were available:
- Swiss model, where the UK would negotiate a series of bilateral agreements with the EU, including selective or general access to the single market.
- Canadian model, where the UK would form a comprehensive trade agreement with the EU to lower customs tariffs and other barriers to trade.
- Turkish model, where the UK would form a customs union with the EU. In Turkey’s case the agreement relates principally to manufactured goods.
The agreement reached, the Trade and Cooperation Agreement (TCA) was a version of the Canadian model. The UK would leave the single market and customs union, but there would be tariff-free and quota-free trade in goods between the UK and the EU. However, to ensure that it was EU and UK business that would benefit from these ‘trade preferences’, businesses must show that their products fulfil ‘rules of origin’ requirements.
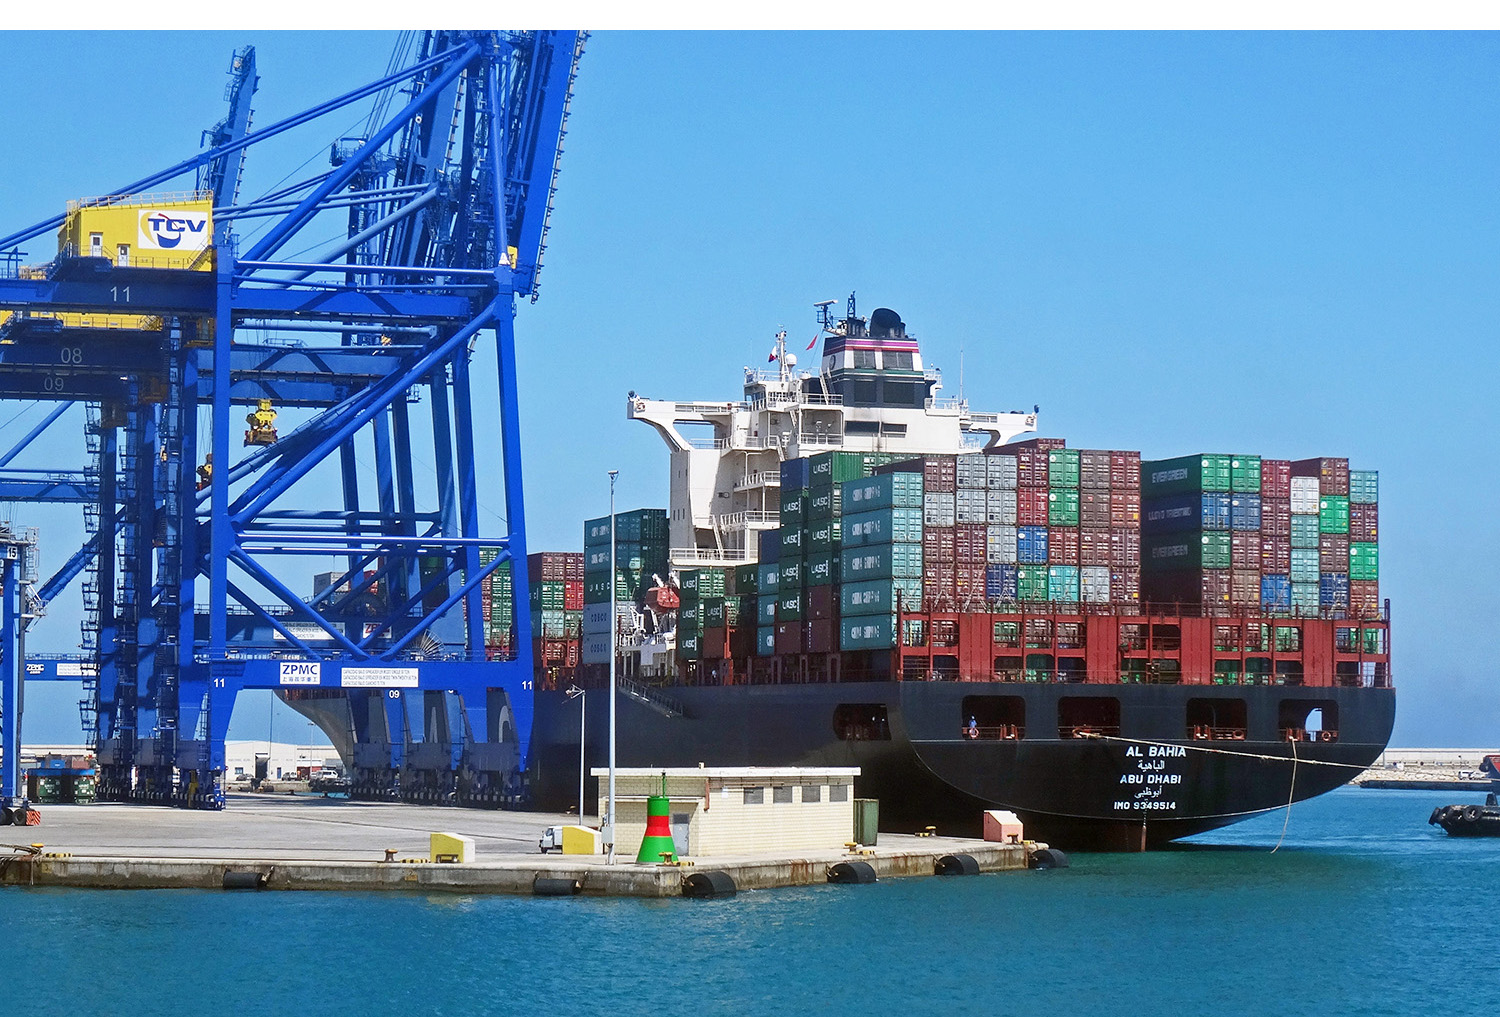 Rules of origin. Under rules of origin requirements, when a good is imported into the UK from outside the EU and then has value added to it by processing, packaging, cleaning, remixing, preserving, refashioning, etc., it can only count as a UK good if sufficient value or weight is added. The proportions vary by product, but generally goods must have approximately 50% UK content (or 80% of the weight of foodstuffs) to qualify for tariff-free access to the EU. For example, in the case of a petrol car, 55% of its value must have been created in either the EU or UK.
Meeting rules of origin has created a large amount of paperwork for businesses and this has created a significant barrier to trade. What is more, exporters are required to complete import/export declarations. Also, agri-food goods are subject to strict physical border controls. These barriers have increased the costs of trade and reduced its volume.
Services. Free trade in services is not provided by the TCA. Instead, services exporters face various barriers, such as certain professional qualifications no longer being recognised in EU countries and a loss of ‘passporting’ rights that previously allowed cross-border financial operations with minimal extra permissions.
Brexit impact. Despite new barriers to trade in services, they are generally less significant than the barriers for trade in goods, particularly in a digital age. Indeed, UK services exports have held up well. Although they fell in 2020, they have grown significantly since. According to House of Commons Library Statistics on UK-EU trade (see link below):
In 2025, UK exports of services to the EU were 28% above their 2019 level in real terms. Exports to non-EU countries were 26% above their 2019 level.
UK exports of goods to the EU, however, have fared less well. In 2025 they were 14% below their 2019 level in real terms. This is partly the effect of COVID and the Ukraine war, but exports to non-EU countries were only 8% lower than 2019. According to research by economists John Springford and Anton Spisak for the Centre for European Reform (see link below), Brexit has depressed UK goods exports to the EU by 16%. According to the Office for Budget Responsibility, (see link below) both exports and imports in the long run will be around 15% lower than they would have been if the UK had remained in the EU. What is more, the growth of goods trade (exports plus imports) has fallen well behind the average of the rest of the G7. And according to British Chambers of Commerce research (see link below), 54% of UK exporters think the TCA is making it harder to export and the need for change is urgent.
The new barriers reduce market access, while lower export volumes reduce competition and economies of scale. There is less competition too from imports, with many EU firms no longer exporting to the UK because of the costs. The barriers lead to a misallocation of resources, with highly productive UK firms exporting less, with less productive firms in the UK and EU focusing purely on their domestic markets. The barriers thus impose an impediment to the exploitation of comparative advantage
Investment
 Both domestic and foreign direct investment (FDI) in the UK have been adversely affected by Brexit. Bloom et al., in their paper for the NBER (see link below), estimate that by 2025, investment was 12–18% lower than it would have been without Brexit.
In the early years after the referendum, lower capital investment was mainly the result of uncertainty and devoting significant resources to administrative Brexit preparations. Later it was largely the result of the trade barriers themselves. Not surprisingly, firms in the UK with high exposure to EU markets experienced a sharper decline in investment than less-exposed ones.
The end of the single market and customs union reduced the attractiveness of the UK as a hub for FDI relative to competitor countries. And UK firms were encouraged to invest in the EU to create hubs for selling within the EU, thereby allowing them to avoid the trade barriers.
According to the Bloom et al. analysis, the effect of lower investment and less competition has been a fall in UK productivity of around 3% to 4% compared to remaining in the EU. The Office For Budget Responsibility argues that the post-Brexit trading relationship will reduce long-run productivity by 4% relative to remaining in the EU.
Growth in GDP
Lower investment, lower productivity and trade barriers have had a negative impact on economic growth. According to analysis by the National Institute of Economic and Social Research (NIESR) (see link below), by the end of 2023, UK real GDP was some 2–3% lower solely as a result of Brexit – in other words, after having taken into account the effects of COVID-19 and the Russia-Ukraine war. This corresponds to a per capita income loss of approximately £850. The NIESR analysis predicts that this will rise to some 5–6% of GDP, or about £2,300 per capita, by 2035.
Bank of England data, based on surveys of chief financial officers of over 2000 firms (small, medium and large), suggest that the UK economy is some 6% smaller than it would have been without Brexit. The Office for Budget Responsibility estimates that Brexit has caused a long-run reduction in GDP of 4% as a result of a similar percentage reduction in productivity.
The growth of small and medium-sized enterprises (SMEs) has been disproportionately dampened by the compliance costs of trade with the EU. Some SMEs, especially in the food and drink sector, have ceased exporting to the EU altogether.
Labour supply and migration
Halting the right of EU workers to move freely to the UK for work created acute labour shortages in specific sectors such as hospitality, health and social care, logistics, construction and agriculture. However, while immigration from the EU fell dramatically, this was more than offset by increased immigration from non-EU countries. But this was unable to fill shortfalls in some sectors.
 The loss of free movement of labour means that UK workers now face restrictions on working in the EU. These include obtaining a work visa, which requires a formal job offer, sponsorship and meeting strict salary thresholds. While business trips for meetings, conferences, trade fairs, etc. are generally exempt, if the work involves remuneration, then normally a work visa will be required. The terms of work visas vary between member states. This has created a considerable barrier for touring bands and other artists. Short-term self-employed or freelance work is highly restricted, with virtually no work permit options available for visiting UK nationals.
Because employing UK nationals now imposes extra administrative and time-consuming burdens on local EU employers, many now prioritize applicants from EU nations who can start immediately.
Articles
- Ten years on, Brexit’s economic impact is becoming clearer
BBC News, Faisal Islam (24/6/26)
- How Brexit is estimated to have hit the UK economy
Reuters, David Milliken (17/6/26)
- Ten years on, Britain counts the cost of Brexit
CNN, Hanna Ziady (22/6/26)
- Brexit at 10: The economy
Institute for Government: Comment, Giles Wilkes (16/6/26)
- Brexit has been an economic failure
LSE Blogs, Thomas Sampsos (16/6/26)
- Ten years after the referendum, how Brexit could have been done differently
The Conversation, Renaud Foucart (22/6/26)
- How Brexit has made Britain poorer – in charts
The Guardian, Richard Partington (14/6/26)
- The cost of Brexit, ten years on: The impact of leaving the customs union and single market on UK trade
Centre for European Reform, John Springford and Anton Spisak (18/6/26)
- Rejoining customs union would not fix damage caused by Brexit, research finds
The Guardian, Heather Stewart (18/6/26)
- The Economic Impact of Brexit
National Bureau of Economic Research , Nicholas Bloom, Philip Bunn, Paul Mizen, Pawel Smietanka, Gregory Thwaites and Sasha Abrahams (revised June 2026)
- Brexit’s impact on the UK economy
UK in a Changing Europe: blog, Gregory Thwaites, Nicholas Bloom, Paul Mizen, Pawel Smietanka and Philip Bunn (4/12/25)
- What the NBER gets wrong on the ‘Economic Impact of Brexit’
Julian Jessop (24/11/25)
- Brexit burden must be cut
British Chambers of Commerce (22/6/26)
- Brexit impact will be negative ‘for the foreseeable future,’ Bank of England governor warns
Business Matters, Jamie Young (19/10/25)
- Brexit knocked 6% off the UK economy, Bank of England company data suggests
Business Matters, Jamie Young (22/6/26)
- Brexit ten years on: the economy
UK in a Changing Europe: blog, Jonathan Portes (2/6/26)
- Brexit 10 years later: How the UK economy and politics changed, in charts
CNBC, Joseph Wilkins and Chloe Taylor (23/6/26)
- Ten Years of Brexit: An Assessment of the Macroeconomic, Regional, and Sectoral Impacts
NIESR blog (19/6/26)
- Brexit was supposed to limit immigration – it did the opposite
LSE blogs, Alan Manning (22/6/26)
Videos
Reports, Research, Analysis and Data
- Brexit analysis
OBR
- Brexit: research and analysis
UK Parliament
- Brexit analyses
Centre for Economic Performance (LSE)
- Trading relationship with the EU
House of Commons Library, Ilze Jozepa, Dominic Webb and Matthew Ward (25/4/25)
- Statistics on UK-EU trade
House of Commons Library, Matthew Ward and Dominic Webb (12/6/26)
- How are our Brexit trade forecast assumptions performing?
Office for Budget Responsibility, Economic and fiscal outlook – March 2024, Box 2.4
- Revisiting the Effect of Brexit
National Institute of Economic and Social Research, Ahmet Ihsan Kaya, Iana Liadze, Hailey Low, Patricia Sánchez Juanino and Stephen Millard (16/11/23)
- Net migration to the UK
The Migration Observatory, Madeleine Sumption, Ben Brindle and Peter William Walsh (27/5/26)
Questions
- Summarise the negative effects of Brexit on the UK economy.
- Why is it difficult to quantify these effects?
- How have UK firms attempted to reduce the costs of exporting to the EU?
- Why have goods exports been worse affected by Brexit than services exports?
- What difficulties would lie in the way of the UK negotiating a Turkish or Swiss model of trading relations with the EU?
- Have there been any economic benefits from Brexit and, if so, what?
