
Andy Burnham is set to become UK Prime Minister on 20 July if no-one else stands to replace Keir Starmer. In a speech on 29 June, he outlined his economic vision. Central to this is devolution, where a greater number of economic decisions would be taken locally rather than by central government. This approach has been dubbed ‘Manchesterism’, in reference to his time as Mayor of Greater Manchester from 2017 to earlier this year. Under his mayoralty, Greater Manchester (GM) achieved faster economic growth than other regions or cities in the UK. From 2017 to 2023, GM’s gross value added grew by an average of 6.6% per annum and the city of Manchester’s by 8.4% – the highest of any city in the UK. The UK average was 4.9% and London’s was 4.6%.
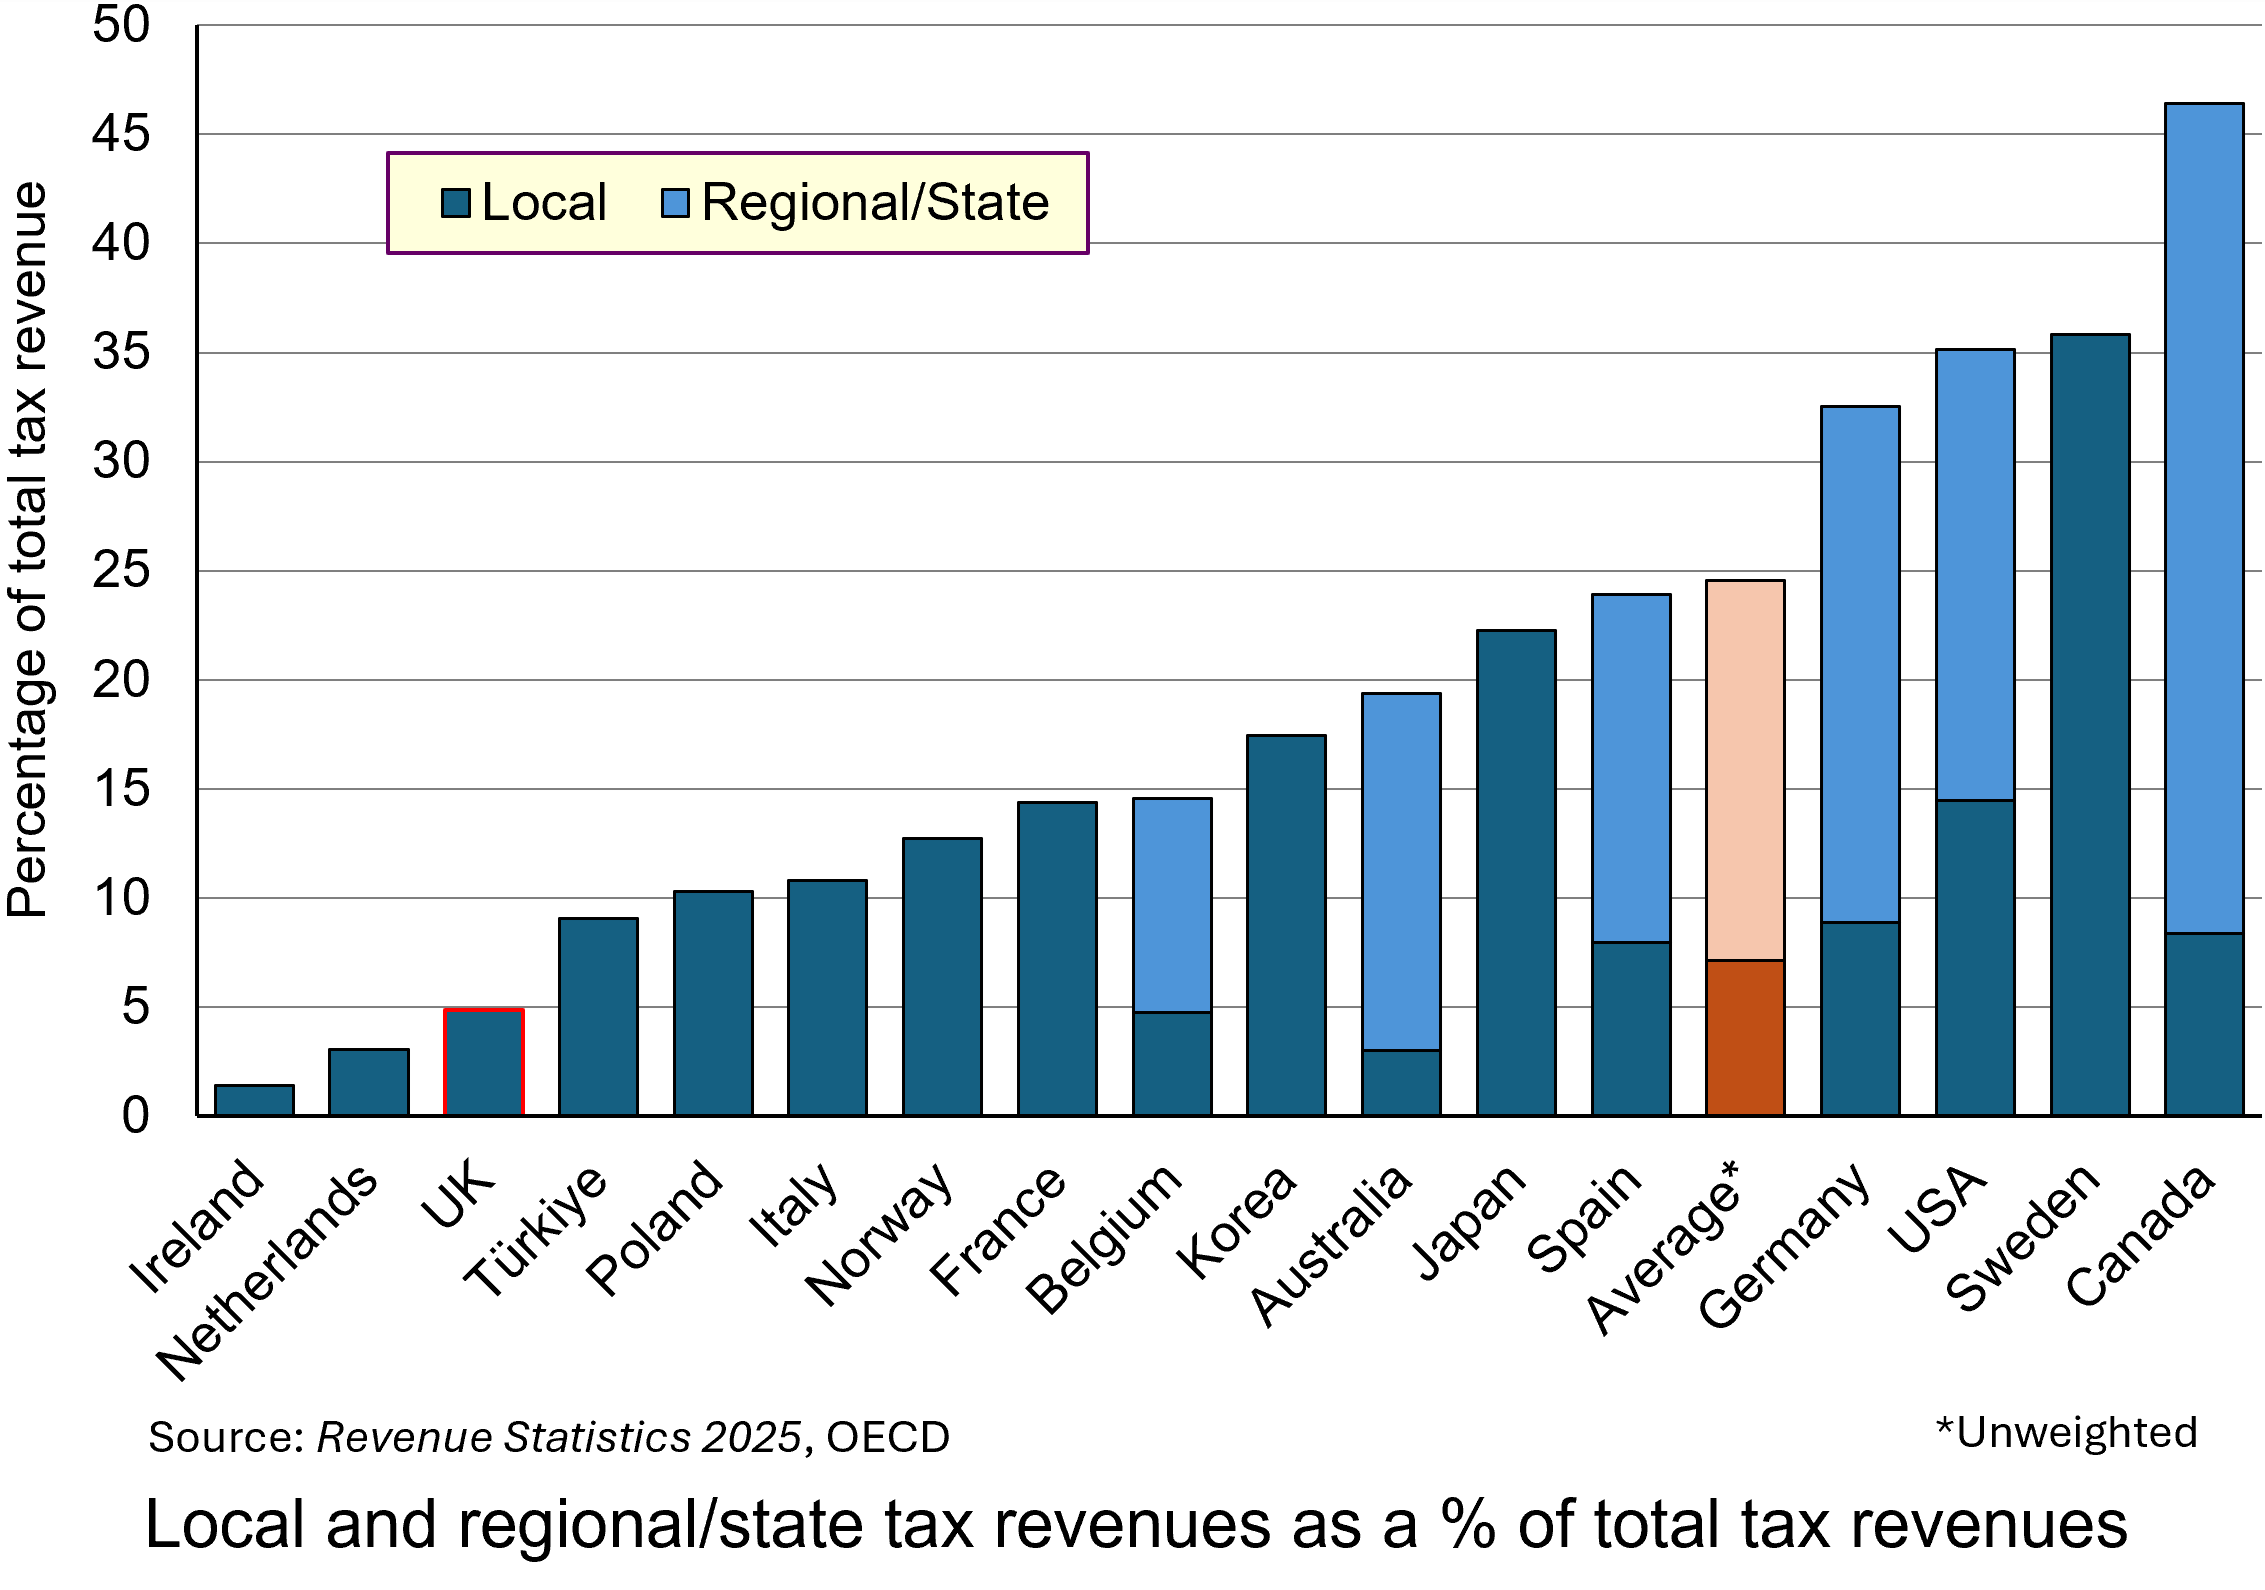 The UK, especially England, is one of the least devolved of the OECD countries. One aspect of this is taxation. The chart shows local taxes and, in the case of federal countries, state/regional/provincial taxes too. (Click here for a PowerPoint.)
Only 4.9% of UK tax revenue is in the form of local taxes (council tax and 50% of business rates) and the amount that can be raised in council tax is capped by the central government. The remainder of UK tax revenue goes to central government in the form of income taxes, social security taxes (national insurance), VAT, excise duties, etc. This compares with an average of 7.1% local taxes and 24.5% local plus regional taxes across the 17 OECD countries shown in the chart.
Andy Burnham plans to shift some of the spending and tax-raising powers from Whitehall to metro mayors and local councils. The aim is to stimulate productivity and economic growth at a regional and local level by tailoring support and incentives to local needs and strengths. Local leaders will be best positioned to understand these needs and strengths and will be able to customise spending and support appropriately.
 Examples of the types of greater autonomy over decision making would include:
- Control over adult education budgets to allow them to be tailored to provide training and apprenticeships to meet the skills requirements of existing and emerging industries in the area;
- Forming partnerships with local universities to support research and development that complements regional economic growth;
- Providing greater funding for and control over local transport infrastructure, including roads, buses, trams, trains, etc., with local consultation to make them fit for the local population and businesses;
- Tailoring business incentives to local needs and to the needs of the businesses themselves so as to attract an increase in investment;
- Greatly expanding council house building, which has virtually dried up in recent years, with mayors and/or local authorities empowered to develop local housing strategies, including affordable housing programmes, and to direct housing investment funding to particular housing developments in areas of greatest need.
Andy Burnham has pledged to stick to the government’s two existing fiscal rules:
a) The Stability Rule (Fiscal Mandate): the current (day-to-day) budget must be in balance or surplus. In other words the provision of salaries, public services, state pensions, welfare, etc. must be covered by government revenues (largely taxation). The government should borrow only to fund long-term investment.
b) The Debt Rule (Stock Mandate): each year, public-sector net financial liabilities (PSNFL) must be forecast by the OBR to be falling as a share of GDP compared to the previous year in three years’ time. This acts as a break on the amount of borrowing for long-term investment.
It is likely, therefore, that there will be little extra government money for investment. Rather, the policy involves a redistribution of public-sector investment from central government to mayoral/local authorities.
 In theory, such a policy of devolution need not see a redistribution from richer to poorer regions, but that might be part of the policy when the details are published. The UK has a bigger gap in productivity (GDP per worker) between its capital city and other large cities than in do other countries. Birmingham, Sheffield, Leeds, Newcastle, etc., as well as Cardiff, Glasgow, Edinburgh and Belfast, lag further behind London in output per head and economic growth than do other European countries lag behind their capital city. Thus the gap between Paris and Lyon, Toulouse and Marseille is narrower; as is that between Belin and Munich, Hamburg and Frankfurt. It is a similar picture in Spain and Italy. In the USA, some cities, such as San Francisco, outperform Washington DC and New York. A redistribution of government funding from London to the regions could see their incomes rise faster without having too much impact on London, which would still continue to attract large amounts of private investment.
Overall, there would be little increase in government funding. ‘Manchesterism’ is not, therefore, a demand-side policy. It is a supply-side policy – directing funds to areas where, combined with local incentives and local knowledge, the funding could yield greater returns and thereby increase potential GDP.
But this is not to say that there is no effect on aggregate demand. The hope is that devolution along the lines outlined by Andy Burnham will attract increased private investment, thereby increasing actual GDP as well as further increasing potential GDP.
We wait to see the details over the coming weeks.
Articles
- Will Andy Burnham’s devolution plan raise economic growth?
BBC Verify, Ben Chu (29/6/26)
- Burnham’s ‘Manchesterism’ could change the UK, but is not yet a full economic plan
BBC News, Faisal Islam (29/6/26)
- Burnham’s ‘Manchesterism’ got him to No 10 – but will it work for the UK?
BBC News, Faisal Islam (17/7/26)
- Burnham says there is some room for movement on tax
BBC News, Kate Wannel and Joshua Nevett (3/7/26)
- England’s mayors should be given sweeping new powers, says devolution expert
The Guardian, Kiran Stacey (2/7/26)
- What is Andy Burnham’s economic and political blueprint for Britain?
The Guardian, Richard Partington and Jessica Elgot (29/6/26)
- Why Andy Burnham’s radical plan relies on the Treasury being a friend of devolution
The Conversation, Dave Richards and Sam Warner (26/6/26)
- How Andy Burnham may try to give the UK economy a boost in his ‘10‑year plan’
The Conversation, Steve Schifferes (29/6/26)
- Could Andy Burnham let mayors raise more taxes?
House of Commons Research Briefing, Mark Sandford (2/7/26)
- Andy Burnham sets out policy plans in first major speech in PM leadership bid: Legal comments
Browne Jacobson, Dan Robinson (29/6/26)
- What does Andy Burnham think ‘Good Growth’ is?
Centre for Cities, Jess Tulasiewicz (30/6/26)
- Manchester’s digital transformation could be a blueprint for other parts of the UK
The Conversation, Richard Whittle (21/7/26)
Videos
Data
Questions
- Use an aggregate demand and supply diagram (simple or dynamic) to illustrate the effects on real GDP of a successful devolution strategy.
- Find out the details of the last Conservative government’s ‘levelling up’ policy. Was it similar in aims to that of ‘Manchesterism’?
- How could a policy of devolution as outlined by Andy Burnham affect income distribution within regions?
- Find out about the approach to regional policy in the EU. Is it similar to that being advocated by Andy Burnham?
- What is meant by ‘regional multipliers’? Why might they differ from the national multiplier?
 The UK Chancellor of the Exchequer, Rachel Reeves, will present her annual Budget in late autumn. It will involve some hard economic and political choices. The government would like to spend more money on improving public services but has pledged not to raise taxes ‘on working people’, which is interpreted as not raising the rates of income tax, national insurance for employees and the self-employed, and VAT. What is more, government borrowing is forecast by the OBR to be £118 billion, or nearly 4.0% of GDP, for the the year 2025/26. This is a fall from the 5.1% in 2024/25 and is well below the 15.0% in 2020/21 during the pandemic. But it is significantly above the 2.1% in 2018/19.
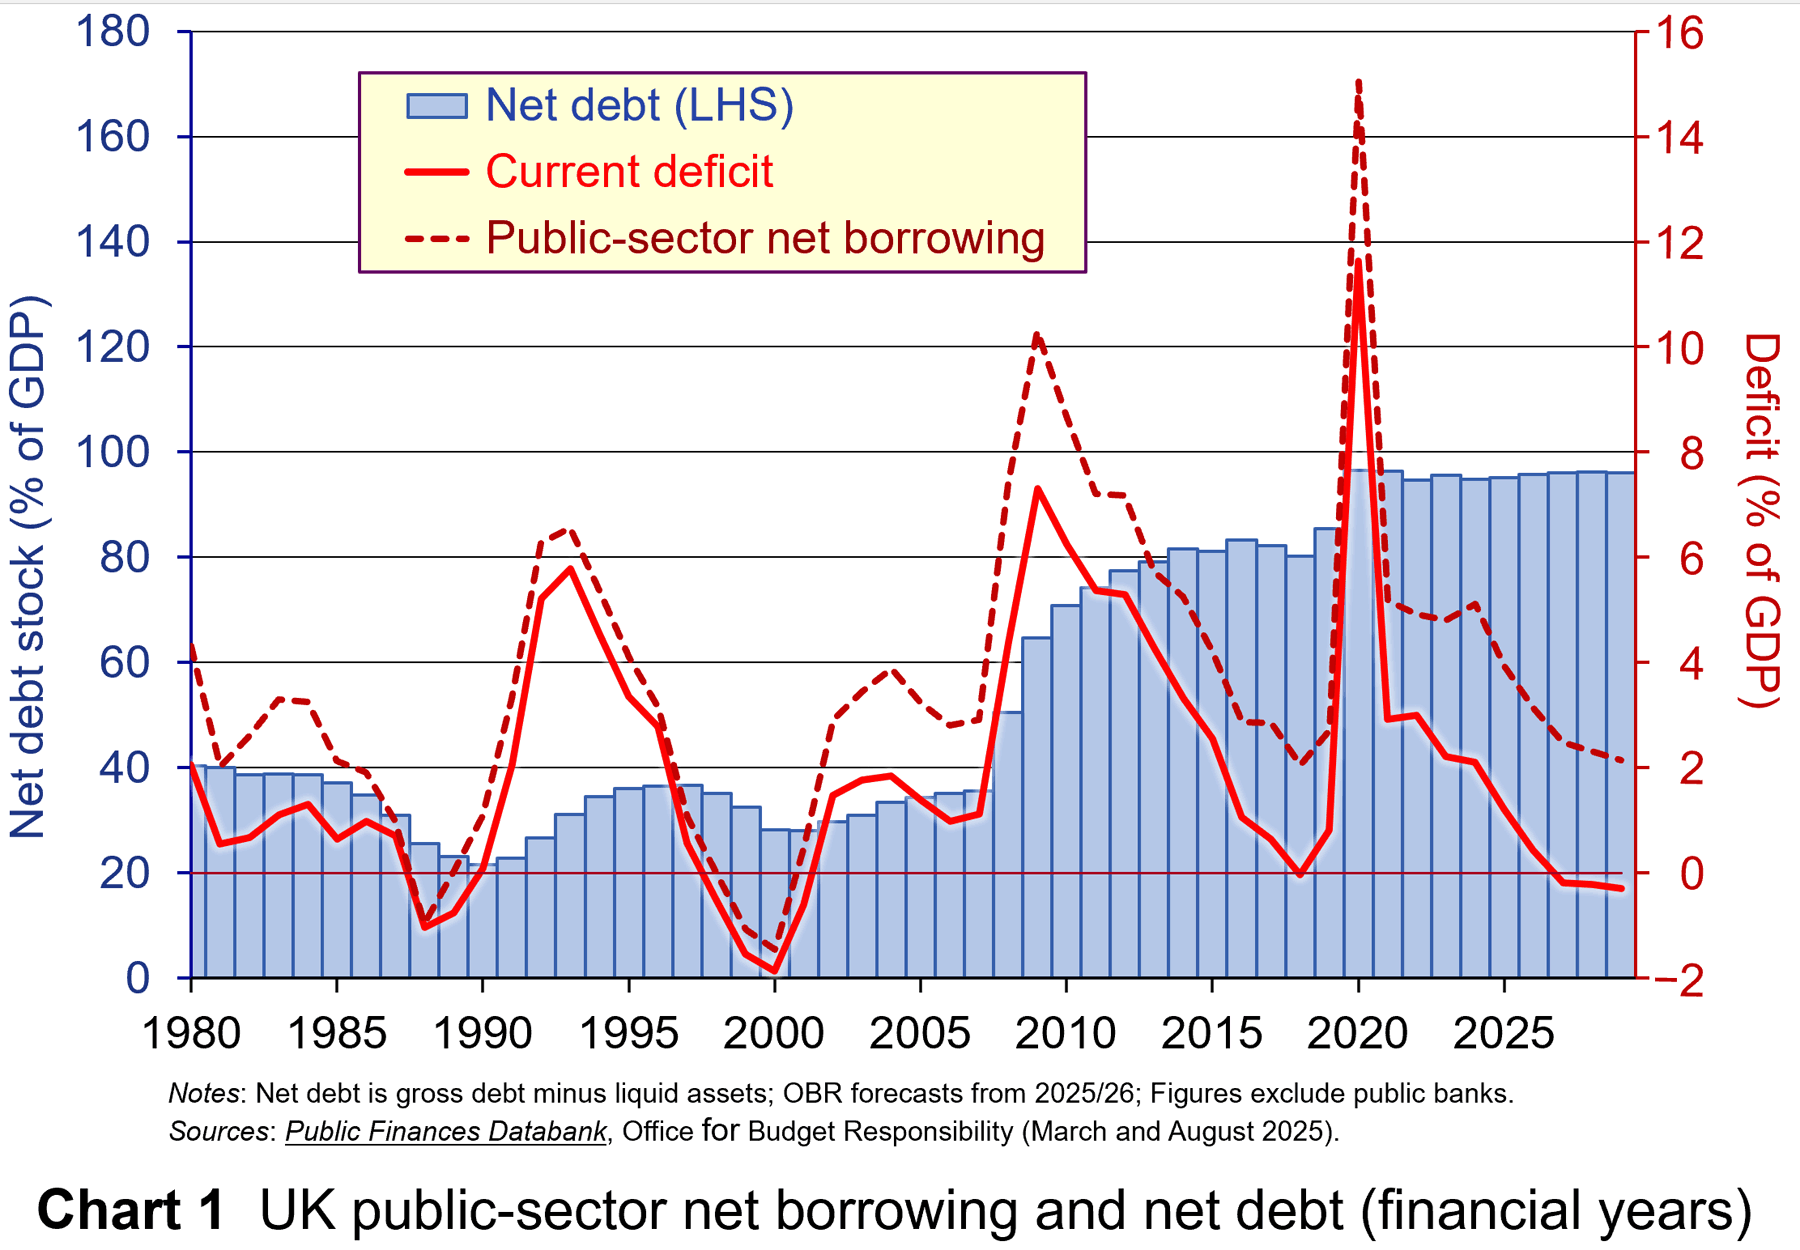 The government has pledged to stick to its two fiscal rules. The first is that the day-to-day, or ‘current’, budget (i.e. excluding investment) should be in surplus or in deficit of no more than 0.5 per cent of GDP by 2029/30 (or the third year of the rolling forecast period from the 2026/27 Budget). This allows investment to be funded by borrowing. The second rule is that public-sector net debt, which includes public-sector debt plus pension liabilities minus equity, loans and other financial assets, should be falling by 2029/30 (or the third year of the rolling forecast period from the 2026/27 Budget). The current budget deficit (i.e. excluding borrowing for investment) was forecast by the OBR in March to be 1.2% of GDP for 2025/26 (see Chart 1) and to be a surplus of 0.3% in 2029/30 (£9.9 billion). (Click here for a PowerPoint of the chart.)
The OBR’s March forecasts, therefore, were that the rules would be met with current policies and that the average rate of economic growth would be 1.8% over the next four years.
However, there would be very little room for manoeuvre, and with global political and economic uncertainty, including the effects of tariffs, climate change on harvests and the continuing war in Ukraine, the rate of economic growth might be well below 1.8%.
The March forecasts were based on the assumption that inflation would fall and hence that the Bank of England would reduce interest rates. Global pressure on inflation, however, might result in inflation continuing to be above the Bank of England’s target of 2%. This would mean that interest rates would be slow to fall – if at all. This would dampen growth and make it more expensive for the government to service the public-sector debt, thus making it harder to reduce the public-sector deficit.
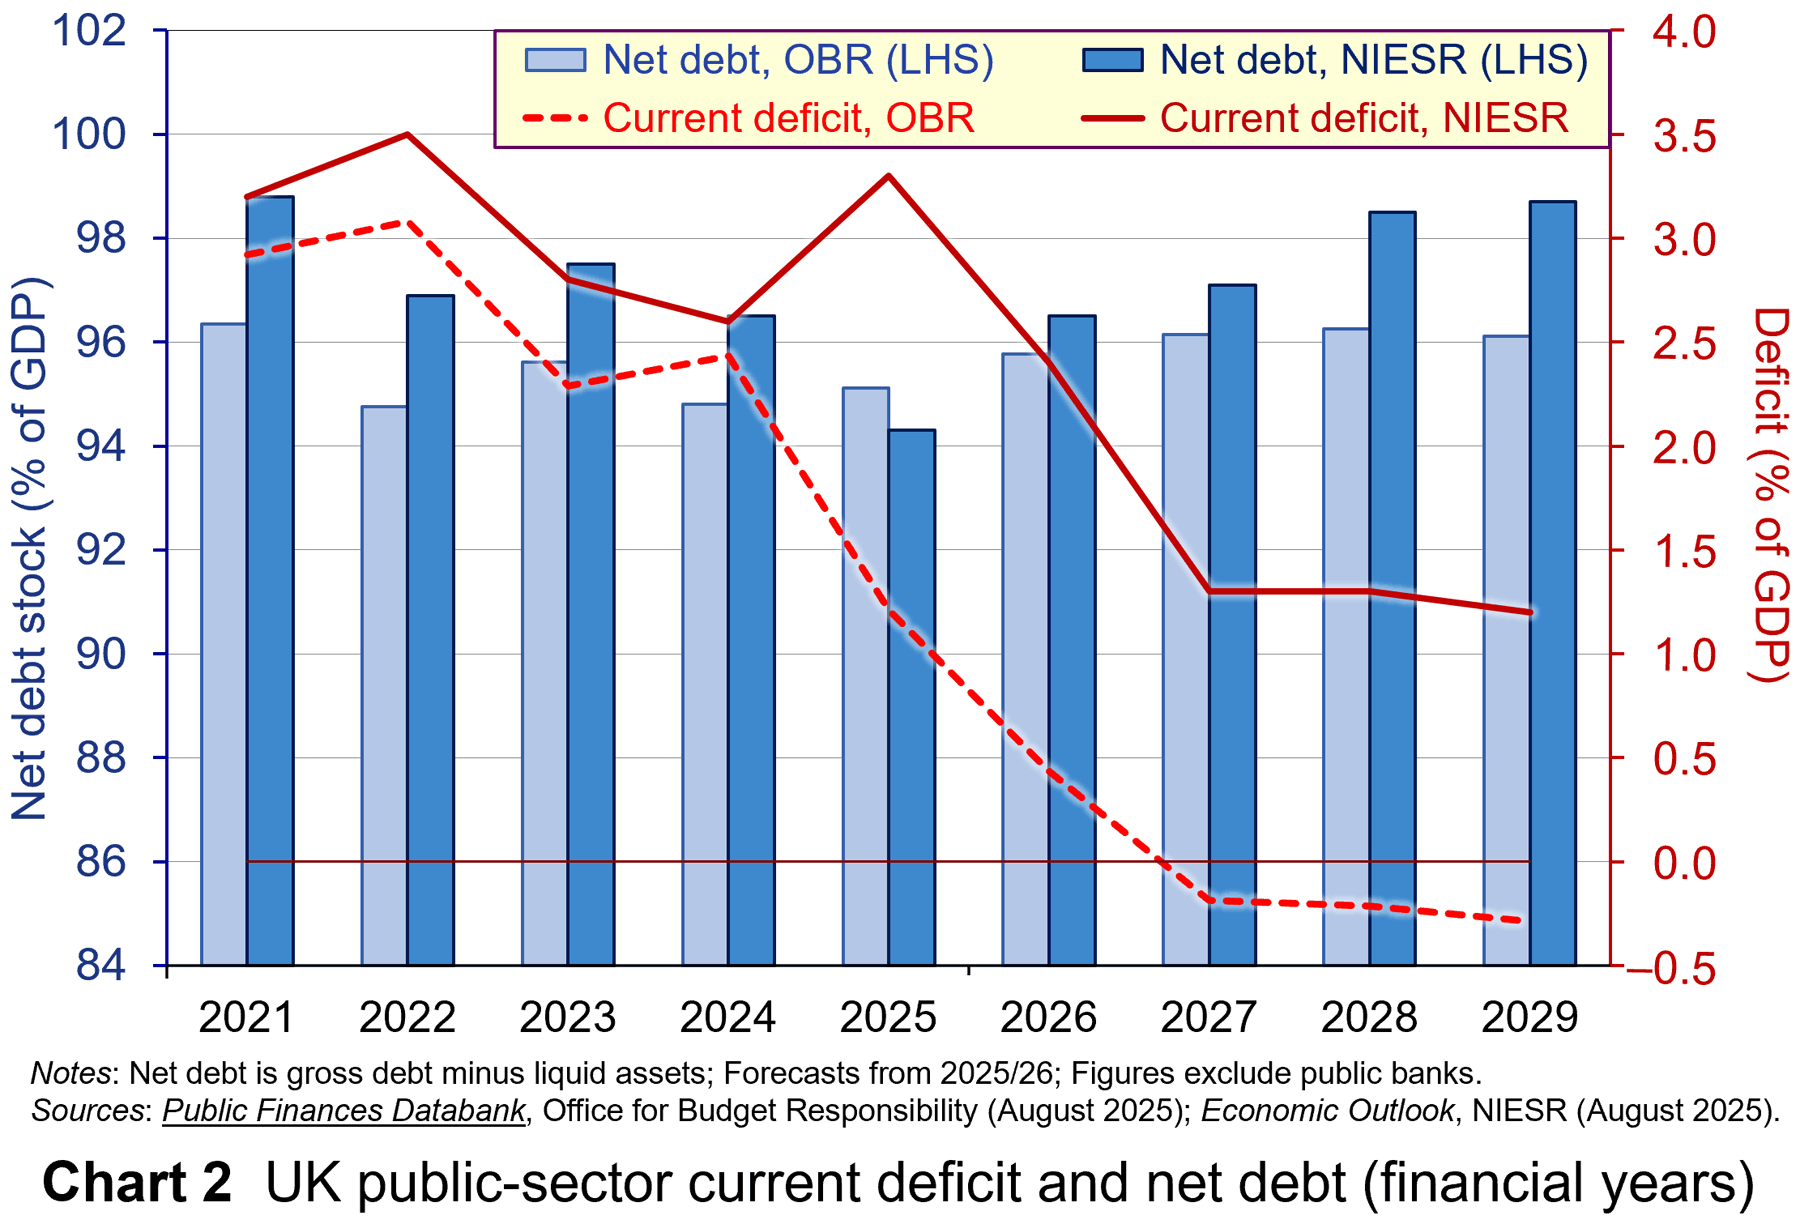 A forecast earlier this month by the National Institute for Economic and Social Research (NIESR) (see link below and Chart 2) reflects these problems and paints a gloomier picture than the OBR’s March forecast. The NIESR forecasts that GDP will grow by only 1.3 per cent in 2025, 1.2 per cent in 2026, 1.1% in 2027 and 1.0% in 2028, with the average for 2025 to 2023 being 1.13%. This is the result of high levels of business uncertainty and the effects of tariffs on exports. With no change in policy, the current deficit would be £41.2 billion in the 2029/30 financial year. Inflation would fall somewhat, but would stick at around 2.7% from 2028 to 2030. Net debt would be rising in 2029/30 &ndash but only slightly, from 98.7% to 99.0%. (Click here for a PowerPoint of the chart.)
So what are the policy options open to the government for dealing with a forecast current budget deficit of £41.2 billion (1.17% of GDP)? There are only three broad options.
Increase borrowing
One approach would be to scrap the fiscal rules and accept increased borrowing – at least temporarily. This would avoid tax increases or expenditure cuts. By running a larger budget deficit, this Keynesian approach would also have the effect of increasing aggregate demand and, other things being equal, could lead to a multiplied rise in national income. This in turn would lead to higher tax revenues and thereby result in a smaller increase in borrowing.
There are two big problems with this approach, however.
The first is that it would, over time, increase the public-sector debt and would involve having to spend more each year on servicing that debt. This would leave less tax revenue for current spending or investment. It would also involve having to pay higher interest rates to encourage people to buy the additional new government bonds necessary to finance the increased deficit.
 The second problem is that the Chancellor has said that she will stick to the fiscal rules. If she scraps them, if only temporarily, she runs the risk of losing the confidence of investors. This could lead to a run on the pound and even higher interest rates. This was a problem under the short-lived Liz Truss government when the ‘mini’ Budget of September 2022 made unfunded pledges to cut taxes. There was a run on the pound and the Bank of England had to make emergency gilt purchases.
One possibility that might be more acceptable to markets would be to rewrite the investment rule. There could be a requirement on government to invest a certain proportion of GDP (say, 3%) and fund it by borrowing. The supply-side benefits could be faster growth in potential output and higher tax revenue over the longer term, allowing the current deficit rule to be met.
Cut government expenditure
Politicians, especially in opposition, frequently claim that the solution is to cut out public-sector waste. This would allow public expenditure to be cut without cutting services. This, however, is harder than it might seem. There have been frequent efficiency drives in the public sector, but from 1919 to 2023 public-sector productivity fell by an average of 0.97% per year.
Causes include: chronic underinvestment in capital, resulting in outdated equipment and IT systems and crumbling estates; decades of underfunding that have left public services with crumbling estates, outdated equipment and insufficient IT systems; inconsistent, short-term government policy, with frequent changes in government priorities; bureaucratic systems relying on multiple legacy IT systems; workforce challenges, especially in health and social care, with high staff turnover, recruitment difficulties, and a lack of experienced staff.
 The current government has launched a Public Sector Productivity Programme. This is a a cross-government initiative to improve productivity across public services. Departments are required to develop productivity plans to invest in schemes designed to achieve cost savings and improve outcomes in areas such as the NHS, police, and justice system. A £1.8 billion fund was announced in March 2024, to support public-sector productivity improvements and digital transformation. Part of this is to be invested in digital services and AI to improve efficiency. According to the ONS, total public-service productivity in the UK grew by 1.0% in the year to Q1 2025; healthcare productivity grew 2.7% over the same period. It remains to be seen whether this growth in productivity will be maintained. Pressure from the public, however, will mean that any gains are likely to be in terms of improved services rather than reduced government expenditure.
Increase taxes
This is always a controversial area. People want better public services but also reduced taxes – at least for themselves! Nevertheless, it is an option seriously being considered by the government. However, if it wants to avoid raising the rates of income tax, national insurance for employees and the self-employed, and VAT, its options are limited. It has also to consider the political ramifications of taking unpopular tax-raising measures. The following are possibilities:
Continue the freeze on income tax bands. They are currently frozen until April 2028. The extra revenue from extending the freeze until April 2030 would be around £7 billion. Although this may be politically more palatable than raising the rate of income tax, the revenue raised will be well short of the amount required and thus other measures will be required. Although some £40 billion will have been raised up to 2028 (which has already been factored in), as inflation falls, so the fiscal drag effect will fall: nominal incomes will need to rise less to achieve any given rise in real incomes.
 Cutting tax relief for pensions. Currently, people get income tax relief at their marginal rate on pension contributions made by themselves and their employer up to £60 000 per year or 100% of their earnings, whichever is smaller. When people draw on their pension savings, they pay income tax at their marginal rate, even if the size of their savings has grown from capital gains, interest or dividends. Reducing the limits or restricting relief to the basic rate of tax could make a substantial contribution to increasing government revenue. In 2023/24, pension contribution relief cost the government £52 billion. Restricting relief to the basic rate or cutting the annual limit would make the relief less regressive. In such a case, when people draw on their pension savings, the income tax rate could be limited to the basic rate to avoid double taxation.
Raising the rate of inheritance tax (IHT) or reducing the threshold. Currently, estates worth more than £325 000 are taxed at a marginal rate of 40%. The threshold is frozen until 2029/30 and thus additional revenue will be received by the government as asset prices increase. If the rate is raised above 40%, perhaps in bands, or the threshold were lowered, then this will earn additional revenue. However, the amount will be relatively small compared to the predicted current deficit in 2029/30 of £41 billion. Total IHT revenue in 2022/23 was only 6.7 billion. Also, it is politically dangerous as people could claim that the government was penalising people who had saved in order to help the next generation, who are struggling with high rents or mortgages.
Increased taxes on business. The main rate of corporation tax was raised from 19% to 25% in April 2023 and the employers’ national insurance rate was raised from 13.8% to 15% and the threshold reduced from £9100 to £5000 per year in April 2025. There is little or no scope for raising business taxes without having significant disincentive effects on investment and employment. Also, there is the danger that raising rates might prompt companies to relocate abroad.
 Raise fuel and/or other duties. Fuel duties raise approximately £24 billion. They are set to decline gradually with the shift to EVs and more fuel-efficient internal combustion engines. Fuel duty remained unchanged at 57.95p per litre from 2011 to 2022 and then was ‘temporarily’ cut to 52.95p. The rate of 52.95p is set to remain until at least 2026. There is clearly scope here to raise it, if only by the rate of inflation each year. Again, the main problem is a political one that drivers and the motor lobby generally will complain. Other duties include alcohol, tobacco/cigarettes/vaping, high-sugar beverages and gambling. Again, there is scope for raising these. There are two problems here. The first is that these duties are regressive, falling more heavily on poorer people. The second is that high duties can encourage illegal trade in these products.
Raising one of the three major taxes: income tax, employees’ national insurance and VAT. This will involve reneging on the government’s election promises. But perhaps it’s better to bite the bullet and do it sooner rather than later. Six European countries have VAT rates of 21%, three of 22%, three of 23%, two of 24%, four of 25%, one of 25.5% and one of 27%. Each one percentage point rise would raise about 9 billion. A one percentage point rise across all UK income tax rates would raise around £5.8 billion. As far as employees’ national insurance rates are concerned, the Conservative government reduced the main rate twice from 12% to 10% in January 2024 and from 10% to 8% in April 2024. The government could argue that raising it back to, say, 10% would still leave it lower than previously. A rise to 10% would raise around £11 billion.
Conclusion
The choices for the Chancellor are not easy. As the NIESR’s Economic Outlook puts it:
Simply put, the Chancellor cannot simultaneously meet her fiscal rules, fulfil spending commitments, and uphold manifesto promises to avoid tax rises for working people. At least one of these will need to be dropped – she faces an impossible trilemma.
Articles
- The Chancellor’s Trilemma
UK Economic Outlook: NIESR, Benjamin Caswell, Fergus Jimenez-England, Hailey Low, Stephen Millard, Eliza da Silva Gomes, Adrian Pabst, Tibor Szendrei and Arnab Bhattacharjee (6/8/25)
- Reeves must raise tax to cover £41bn gap, says think tank
BBC News, Lucy Hooker (6/8/25)
- Chancellor warned ‘substantial tax rises’ needed – as she faces ‘impossible trilemma’
Sky News, Gurpreet Narwan (6/8/25)
- Rachel Reeves needs to put up taxes to cover £40bn deficit, thinktank says
The Guardian, Phillip Inman (6/8/25)
- What’s the secret to fixing the UK’s public finances? Here’s what our panel of experts would do
The Conversation, Steve Schifferes, Conor O’Kane, Guilherme Klein Martins, Jonquil Lowe and Maha Rafi Atal (15/8/25)
- Why radical tax reform may be only way for Reeves to balance the books
The Guardian, Phillip Inman (21/8/25)
- Reeves and Starmer to prepare ground for tax rises in a difficult autumn budget
The Guardian, Jessica Elgot, Richard Partington and Eleni Courea (7/8/25)
- How much money does the UK government borrow, and does it matter?
BBC News (21/8/25)
- More pain for Reeves as government borrowing cost nears 27-year high
The Guardian, Phillip Inman (26/8/25)
Data
Questions
- Which of the options would you choose and why?
- Should the government introduce a wealth tax on people with wealth above, say, £2 million? If so, should it be a once-only tax or an annual tax?
- Research another country’s fiscal position and assess the choices their finance minister took.
- Look at a previous UK Budget from a few years ago and the forecasts on which the Budget decisions were made (search Budget [year] on the GOV.UK website). How accurate did the forecasts turn out to be? If the Chancellor then had known what would actually happen in the future, would their decisions have been any different and, if so, in what ways?
- Should fiscal decisions be based on forecasts for three of four years hence when those forecasts are likely to be unreliable?
- Should fiscal and monetary policy decisions be made totally separately from each other?
 Inflation has been rising around the world as a combination of a recovery in demand and supply-chain issues have resulted in aggregate demand exceeding aggregate supply. Annual consumer price inflation at the beginning of 2022 is around 2.5% in China, 3.5% in Sweden, 5% in the eurozone, Canada and India, 6% in the UK and South Africa, 7% in the USA and 7.5% in Mexico. In each case it is forecast to go a little higher before falling back again.
Inflation in Turkey
In Turkey inflation is much higher. The official annual rate of consumer price inflation in December 2021 was 36.1%, sharply up from 21.3% in November. But according to Turkey’s influential ENAGrup the December rate was much higher still at 82.8%. Official producer price inflation was 79.9% and this will feed through into official consumer price inflation in the coming weeks.
The rise in inflation has hit the poor particularly badly. According to the official statistics, in the year to December 2021, domestic energy prices increased by 34.2%, food by 44.7% and transport by 53.7%. In response, the government has raised the minimum wage by nearly 50% for 2022.
Causes of high and rising inflation
 Why is Turkey’s inflation so much higher than in most developed and emerging economies and why has it risen so rapidly? The answer is that aggregate demand has been excessively boosted – well ahead of the ability of supply to respond. This has driven inflation expectations.
Turkey’s leader, President Erdoğan, in recent years has been seeking to stimulate economic growth through a mixture of supply-side, fiscal and monetary policies. He has hoped that the prospect of high growth would encourage both domestic and inward investment and that this would indeed drive the high growth he seeks. To encourage investment he has sought to reduce the reliance on imports through various measures, such as public procurement favouring domestic firms, tax reliefs for business and keeping interest rates down. He has claimed that the policy is focused on investment, production, employment and exports, instead of the ‘vicious circle of high interest rates and low exchange rates’.
With the pandemic, fiscal policy was largely focused on health, social security and employment measures. Such support was aided by a relatively healthy public finances. General government debt was 32% of GDP in 2020. This compares with 74% for the EU and 102% for the G7. Nevertheless, the worsening budget deficit has made future large-scale expenditure on public infrastructure, tax cuts for private business and other supply-side measures more difficult. Support for growth has thus fallen increasingly to monetary policy.
The Turkish central bank is not independent, with the President firing senior officials with whom he disagrees over monetary policy. The same applies to the Finance Ministry, with independently-minded ministers losing their jobs. Monetary and exchange rate policy have thus become the policy of the President. And it is here that a major part of the current problem of rising inflation lies.
Monetary and exchange rate policy
Despite rising inflation, the central bank has reduced interest rates. At its monthly meeting in September 2021, the Turkish central bank reduced its key rate from 19% to 18% and then to 16% in October, to 15% in November and 14% in December. These unprecedented rate cuts saw a large increase in the money supply. M1 rose by 11.7% in November alone; the annual growth rate was 59.5%. Broad money (M2 and M3) similarly rose. M3 grew by an annual rate of 51% in November 2021. The cut in interest rates and rise in money supply led to a rise in nominal expenditure which, in turn, led to higher prices.
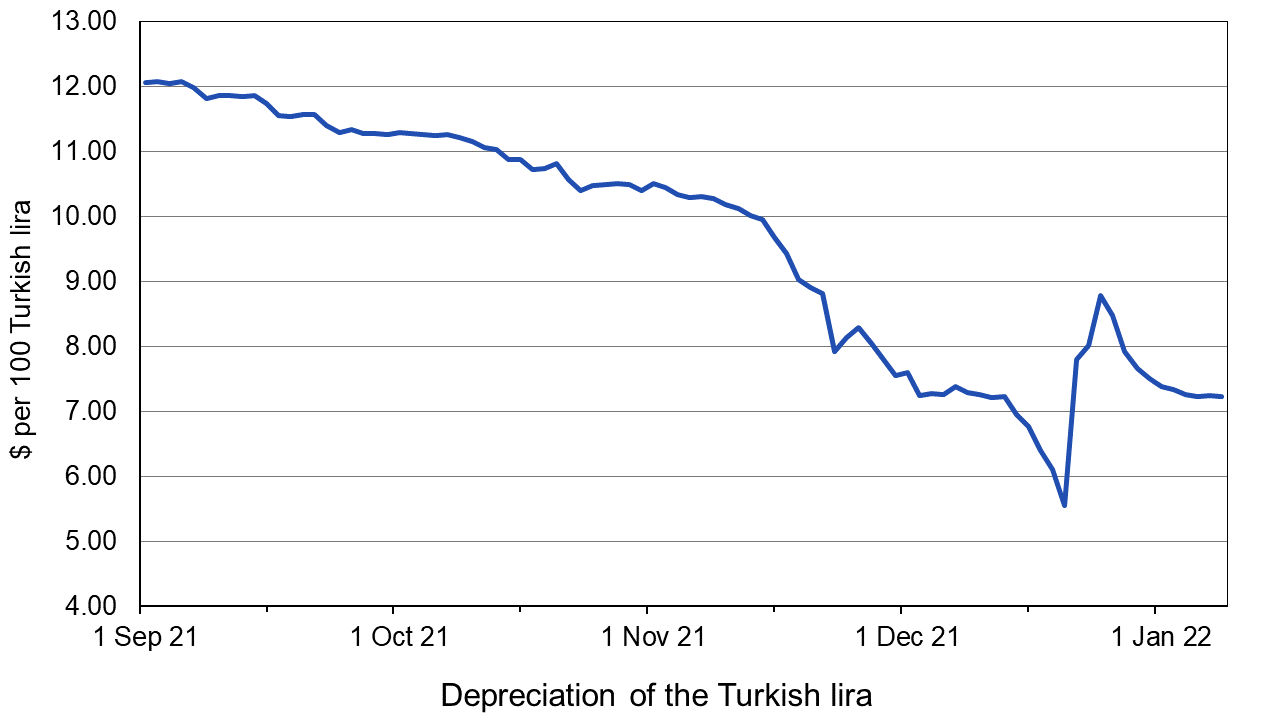
The cut in interest rates and rise in nominal aggregate demand led to a large depreciation in the exchange rate. On 1 September 2021, 100 Turkish lira exchanged for $12.05. By 11 January 2022 the rate had fallen to $7.22 – a 40.1% depreciation. This depreciation, in turn, further stoked inflation as the lower exchange rate pushed up the price of imported goods. (Click here for a PowerPoint of the chart.)
Attempts were made to stem this fall in the lira on 20 December, by which point 100 lira were trading for just $5.50 (see chart) and speculation against the lira was gathering momentum. President Erdoğan announced a scheme to protect lira deposits against currency volatility, guaranteeing lira deposits in hard currency terms. The mechanism adopted was a rise in the interest rate on lira deposits with a maturity of 3 to 12 months, thereby encouraging people to lock in deposits for the medium term and not, therefore, to use them to speculate against the lira by buying other currencies. Other interest rates would be unaffected. At the same time the central bank used foreign currency reserves to engage in large-scale purchases of the lira on the foreign exchange market.
The lira rallied. By 23 December, 100 lira were trading for $8.79. But then selling of the lira began again and, as stated above, by early January 100 lira had fallen to $7.22. The underlying problem of excess demand and high inflationary expectations had not been solved.
It remains to be seen whether the President will change his mind and decide that the central bank needs to raise interest rates to reduce inflation and restore confidence.
Videos
Articles
- Turkish Inflation Hits Highest Since 2002 Amid Lira Woes
Bloomberg, Baris Balci and Cagan Koc (3/1/22)
- Turkey’s annual inflation rate is over 82 percent, finds research group
Bianet (3/1/22)
- How Turkey can overcome its economic challenges
Arab News, Zaid M Belbagi (2/1/22)
- Turkey cuts interest rates despite spiralling inflation
BBC News, Victoria Craig (16/12/21)
- Turkey inflation surges 36% amid lira crisis, highest since 2002
CNBC (3/1/22)
- Turkey mulls new financial instruments to shield against inflation
Daily Sabah (3/1/22)
- Turkey raises minimum wage as lira crash, inflation sow hardship
Aljazeera, Umar Farooq (16/12/21)
- What to make of Turkey’s latest unorthodox currency move
Financial Times, Mohamed El-Erian (21/12/21)
- Erdoğan gambles on economy amid protests and rocketing inflation
The Guardian, Phillip Inman (24/11/21)
- Explained: How did Turkey’s economy go so wrong?
The Indian Express, Patricia Cohen (15/12/21)
Data
Questions
- Until the pandemic, the Turkish economy could be seen as a success story. Why?
- What supply-side policies did Turkey pursue?
- Use either an aggregate demand and supply diagram or a dynamic aggregate demand and supply (DAD/DAS) diagram to explain what has happened to inflation in Turkey in the past few months.
- Explain the thinking behind the successive cuts in interest rates since September 2021.
- Why did the measures introduced on 20 December 2021 only temporarily halt the depreciation of the lira?
- Choose a country with a higher rate of inflation than Turkey (see second data link above). Find out the causes of its high rate. Are they similar to those in Turkey?
 One of the major economic concerns about the COVID-19 pandemic has been the likely long-term scarring effects on economies from bankruptcies, a decline in investment, lower spending on research and development, a loss of skills, discouragement of workers, disruption to education, etc. The result would be a decline in potential output or, at best, a slower growth. These persistent effects are known as ‘hysteresis’ – an effect that persists after the original cause has disappeared.
In a speech by Dave Ramsden, the Bank of England’s Deputy Governor for Markets & Banking, he argued that, according to MPC estimates, the pandemic will have caused a loss of potential output of 1.75%. This shortfall may seem small at first sight, so does it matter? According to Ramsden:
The answer is definitely yes for two reasons. First, a 1¾% shortfall as a share of annual GDP for the UK … represents roughly £39 billion – for context, that’s about half of the education budget. And second, that 1¾% represents a permanent shortfall, or at least a very persistent one, on top of the impact of the immediate downturn. If you lose 1¾% of GDP every year for ten years, then in total you have lost 17.5% of one year’s GDP, or around £390bn in 2019 terms
However, as the IMF blog linked below argues, there may be positive supply-side effects which outweigh these scarring effects, causing a net rise in potential GDP growth. There are two possible reasons for this.
 The first is that the pandemic may have hastened the process of digitalisation and automation. Examples include ‘video conferencing and file sharing applications to drones and data-mining technologies’. According to evidence from a sample of 15 countries cited in the blog, a 10% rise in such intangible capital investment is associated with about a 4½% rise in labour productivity. ‘As COVID-19 recedes, the firms which invested in intangible assets, such as digital technologies and patents may see higher productivity as a result.’
The second is a reallocation of workers and capital to more productive sectors. Firms in some sectors, such as leisure, hospitality and retail, have relatively low labour productivity. Many parts of these industries have declined during the pandemic, especially those with high labour intensity. At the same time, there has been a rise in employment in firms where output per worker is higher. Such sectors include e-commerce and those where remote working is possible. The greater the reallocation from low labour-productivity to high labour-productivity sectors, the more will overall labour productivity rise and hence the more will potential output increase.
The size of these two effects will depend to a large extent on expectations, incentives and government policy. The blog cites four types of policy that can help investment and reallocation.
- Improved insolvency and restructuring procedures to enable capital in failed firms to be reallocated to sectors with potential for growth.
- Promoting competition to enable the exit and entry of firms into expanding sectors and to prevent powerful firms from blocking the process.
- Refocusing policy from retaining labour in existing jobs to reskilling workers for new jobs, thereby improving labour mobility from declining to expanding sectors.
- Addressing financial bottlenecks, so as to ensure adequate access to financing for viable firms.
Whether there will be a net increase or decrease in productivity from the pandemic very much depends on the extent to which firms and workers are able and willing to take advantage of new opportunities and the extent to which government supports investment in and reallocation to high-productivity sectors.
Blogs, articles and speeches
Questions
- Can actual economic growth be greater than potential economic growth (a) in the short run; (b) in the long run?
- Give some example of scarring effects from the COVID-19 pandemic.
- What effects might short-term policies to tackle the recession caused by the pandemic have on longer-term potential economic growth?
- What practical policies could governments adopt to encourage the positive supply-side effects of the pandemic? To what extent would these policies have negative short-term effects?
- Why might (endogenous) financial crises result in larger and more persistent reductions in potential output than exogenous crises, such as a pandemic or a war?
- Distinguish between interventionist and market-orientated supply-side policies to encourage the reallocation of labour and capital to higher-productivity sectors.
 The French have elected Emmanuel Macron as their new President. He claims to be from the economic centre. But just what does this imply for his vision of how the French economy should be run? What policies is he likely to put in place? Can these policies rightly be described as ‘centrist’? In practice, some of his policies are advocated by the centre right and some by the centre left.
He wants to institute policies that are pro business and will have the effect of stimulating private investment, increasing productivity and resulting in faster economic growth.
His pro-business policies include: reducing corporation tax from its current 33.3% to 25%, the hope being that firms will invest the money that this will free up; reducing labour taxes on companies for employing low-wage workers; making the current 35-hour working week less rigid by giving firms greater ability to negotiate special arrangements with trade unions.
Other policies drawn from the centre right include reducing the size of the state. Currently, general government spending in France, at 56.5% of GDP, is the highest of the G7 countries. Italy’s is the next highest at 49.6%, followed by Germany at 44.3%, Canada at 40.8%, the UK at 39.4%, Japan at 36.8% and the USA at 35.2%. President Macron wants to reduce the figure for France to 52% over his five-year term.  This will be achieved by cutting 120,000 public-sector jobs and reducing state spending by €60bn. He plans, thereby, to reduce the general government deficit from its 2016 level of 3.4% of GDP to 1% by 2022 and reduce the general government debt from 96.0% of GDP to 93.2% over the same period.
Drawing from centre-left policies he plans to increase public investment by €50bn, including €15bn on training, €15bn on green energy and €5bn each on transport, health, agriculture and the modernisation of public administration. But as this additional expenditure is less than the planned savings through greater efficiency and as GDP is projected to grow, this is still consistent with achieving a reduction in the general government deficit as a percentage of GDP. He has also pledged to extend welfare spending. This will include making the self-employed eligibile for unemployment benefits.
M Macron isalso strongly supportive of France’s membership of the EU and the euro. Nevertheless he wants the EU to be reformed to make it more efficient and achieve significant cost savings.
Articles
Macronomy: What are Emmanuel Macron’s economic plans? BBC News, Simon Atkinson (8/5/17)
Factbox: Emmanuel Macron’s presidential election policies Reuters, Brian Love (14/4/17)
What Analysts Are Saying About Macron’s Victory Bloomberg, Chris Anstey (8/5/14)
The Main Points of Emmanuel Macron’s Economic Programme NDTV, India (9/5/14)
Can Emmanuel Macron solve France’s economic riddle? The Guardian, Larry Elliott (30/4/17)
Why Emmanuel Macron’s bid to haul France out of its economic malaise will be harder than he thinks The Telegraph, Szu Ping Chan and Tim Wallace (30/4/17)
Macron’s policies on Europe, trade, immigration and defence Financial Times, Hannah Murphy (7/5/17)
French presidential election: Investors, economists and strategists react to Macron’s victory Independent, Josie Cox (8/5/17)
Questions
- Compare the performance of the French, German and UK economies over the past 10 years.
- Why does France have much lower levels of inequality and much higher productivity than the UK?
- How would (a) a neoliberal and (b) Keynesian economist explain the slow growth performance of France?
- Give some other examples of centre-right economic policies that could be pursued by a centrist government.
- Give some other examples of centre-left economic policies that could be pursued by a centrist government.
- How do M Macron’s policies differ from those of the (a) Conservative, (b) Labour and (c) Liberal Democrat parties in the manifestos for the 2017 General Election in the UK?
- What economic difficulties is M Macron likely to find in carrying out his policies?
- Would you describe M Macron’s macroeconomic policies as demand-side or supply -side policies? Explain.
- What specific economic policies does France want Germany to pursue?
 Can Andy Burnham deliver on his promise to rewire Britain’s economy?