
Inflation has been rising around the world. The main reason has been the supply shock of rising oil, fertiliser and commodity prices caused by the Iran war and the disruption to global supply chains from conflicts in the Middle East and Russia (see the blog, Why have diesel prices risen more than petrol prices?). Central banks, including the US Federal Reserve Bank, the European Central Bank and the Bank of Japan, have responded to this cost-push inflationary shock by raising interest rates. The Bank of England is likely to raise Bank rate at its next meeting on 5 November 2026.
Similar supply shocks have been experienced in recent years (see the May 2026 blog, Supply shocks – long-term gain from the short-term pain?).
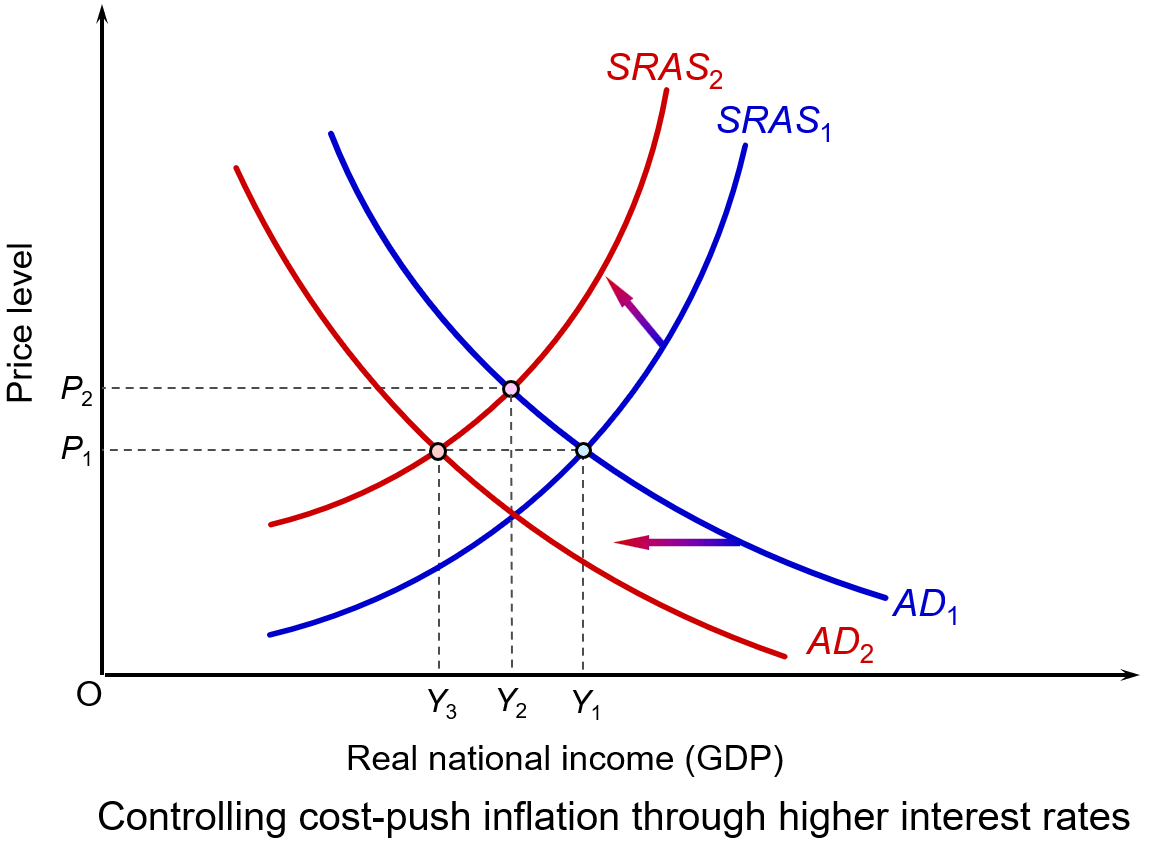 Raising interest rates reduces aggregate demand, or at least its rate of growth. This puts downward pressure on prices, or at least on the rate of inflation. This can be illustrated in the diagram. (Click here for a PowerPoint.)
It shows a country’s initial short-run aggregate supply curve (SRAS1) and initial aggregate demand curve (AD1). The price index is P1 and real GDP is Y1.
The higher costs shift the SRAS curve upwards to the left, say to SRAS2. The price index rises to P2 and real GDP falls to Y2. If, in response to the higher prices, the central bank raises the interest rate, this shifts the aggregate demand curve to the left, say to AD2. As a result, the price index falls back to P1, but the fall in demand causes real GDP to fall further, to Y3.
Policy alternatives
 So, is a rise in interest rates the appropriate response to higher costs that push inflation above, or further above, its target, which for most countries is 2%?
If the cause of inflation was excessive increases in aggregate demand from, say, large government budget deficits or a large increase in consumer demand, then a rise in interest rates would have helped reduce this unsustainable rise in demand. But if the cause of the inflation is a supply shock, is curbing aggregate demand the correct solution?
Ideally, the solution would be to tackle the cost increases directly. A rise in productivity, for example, would help to increase aggregate supply and counter the effect of rising commodity prices. But productivity increases take place over the longer term and are not a solution to a short-term supply shock. Better still, if the increase in commodity prices could be reversed, by finding a political solution that reopened the Strait of Hormuz and other choke points, then higher interest rates would not be needed.
Alternatively, some countries might be able to resort to price controls. These could be targeted at specific sectors such as energy, rent or construction. For example, the UK government has used energy price caps to limit household energy bills.
But even though this may control inflation in the short term, price controls create shortages because demand exceeds the reduced supply. This could lead to higher prices in unofficial markets as people sought to avoid the price controls. It could also create considerable problems for firms planning their logistics when supplies may simply not be available.
Alternatively, subsidies could be used to support output or prices in similar areas. Or they could be targeted at low-income households. These, however, could be costly for governments and may distort markets.
If price controls and subsidies are rejected, and in the absence of short-term increases in aggregate supply, the only solution to inflation is curbing aggregate demand to match the reduced aggregate supply. This could be achieved through fiscal policy by raising taxes or reducing government expenditure, but would prove unpopular and would probably be rejected by governments. Generally, they would prefer to pass the burden to central banks through the use of monetary policy.
The blunt instrument of monetary policy
But, raising interest rates is, indeed, a blunt instrument. Tighter monetary policy cannot increase the global supply of fuel, fix broken supply chains or lower insurance and construction costs. In other words, it cannot directly fix supply shocks, only limit their effect on prices.
 Also, by making borrowing more expensive, higher interest rates may suppress business investment and house building. This adverse supply-side effect may worsen inflation over the longer term.
The hope is that such effects will be avoided by suppressing inflation and helping thereby to maintain business confidence. It is a delicate balancing act for central bankers, who want to constrain inflation but do not want to plunge their economies into recession and damage longer-term increases in potential real GDP.
Most of all, the hope is that by suppressing nominal demand, second-round effects will be avoided. These are where higher prices encourage workers to demand higher wages to compensate for higher prices and businesses to raise prices to cover those wage increases, knowing that they can pass these price increases on to consumers as their competitors are doing the same. This risks creating a damaging wage-price spiral and embedding inflation. By raising interest rates and signalling that they will bring inflation back down to the target rate, central banks hope to anchor long-term inflation expectations. They hope that this will ensure that temporary price shocks do not become permanently embedded in the economy.
Distributional consequences
 However, the burden of higher interest rates will not be shouldered equally. They predominantly penalise a minority of the population, especially younger households with consumer debt and/or large variable-rate mortgages relative to their income or fixed rate mortgages coming the end of their term and requiring renewing. They also penalise businesses which rely on short-term debt.
Meanwhile, people who own their homes outright or wealthy savers may be largely unaffected or even benefit from higher yields on their savings deposits. Similarly, firms with low debt may hardly be affected.
Consequences for servicing public debt
Higher interest rates increase governments’ debt-servicing costs. More has to be paid on new borrowing, either to finance budget deficits or to replace government bonds and bills that are maturing. This consumes a larger share of public spending and limits the fiscal room to support vulnerable households suffering from the price and interest increases.
We examined such costs in the US context in the blog US national debt reaches $40 trillion: but does it matter?.
Fingers crossed!
By being cautious about raising interest rates, central banks hope that geopolitical developments will be favourable and that the supply constraints will diminish. For example, the hope is that there will be a settlement between the USA and Iran that allows oil to flow once more through the Strait of Hormuz. That is why, despite inflation being well above target, central banks have been raising interest rates by just a quarter of a percentage point.
Articles
- US interest rates raised for first time in three years
BBC News, Michael Race (17/9/26)
- What the Fed interest rate hike likely means for borrowers and savers
NBC4 New York, Paul Wiseman (16/9/26)
- How increasing interest rates could reduce inflation, but potentially cause a recession
CNBC, Trina Paul (21/9/26)
- Interest rates held but Bank signals rise if energy prices stay high
BBC News, Dearbail Jordan and Kevin Peachey (17/9/26)
- Bank of England defies Fed’s rate-hike lead, leaving rates unchanged
CNBC, Chloe Taylor (17/9/26)
- ECB hikes rates to 2.5% as energy shock pushes eurozone inflation higher
Euronews, Quirino Mealha (10/9/26)
- Japan raises interest rates to 31-year high to curb impact of rising prices
The Guardian, Mark Sweney (18/9/26)
- What exactly is inflation, and are interest rates the only option for dealing with it?
The Conversation, Luke Hartigan (10/2/26)
- US consumers and businesses are now facing a future of more expensive borrowing
The Conversation, John W Diamond (16/9/26)
- Inflation: raising interest rates was never the right medicine – here’s why central bankers did it anyway
The Conversation, Robert Gausden (20/10/23)
- There are three main reasons inflation is rising. Higher rates won’t fix them
ABC (Australia), Michael Janda (15/9/26)
- Higher interest rates are meant to lower inflation. US economist John Cochrane says there’s only ‘shaky’ evidence it works
ABC (Australia), Michael Janda and Alicia Barry(15/3/24)
- How Governments Fight Inflation with Monetary Policies
Investopedia, Leslie Kramer (11/3/26)
- Interest rates are not the tool to solve the inflation caused by the US’s war with Iran
The Guardian, Josh Ryan-Collins (18/3/26)
- Are higher interest rates the only tool for managing inflation?
Rethinking Economics, Tim Thornton (3/8/23)
Videos
Information
Questions
- What policies have central banks pursued during the Iran war?
- Paint an optimistic scenario for the global economy five years hence.
- Paint a pessimistic scenario for the global economy five years hence.
- Compare the reasons given by the Federal Reserve and ECB for raising interest rates with those given by the Bank of England for not raising them.
- Donald Trump argues for cutting interest rates as a stimulus to the US economy. Provide a critique of this policy.

The US national debt hit a milestone in August 2026. It reached a staggering $40 trillion. The national debt is the amount owed by the US federal government to holders of government bonds and bills (treasury securities). The debt grows each year by the size of the annual government deficit, which is the amount that government expenditure exceeds tax and other revenues. The bigger the deficit, the more the national debt grows. The $40 trillion debt represents 126% of GDP – in other words it is more that the total annual output of the USA. It represents around $118,000 per head or $290,000 per household
But does this high and rising debt matter? And how does it compare with other countries?
The comparative size of the national debt
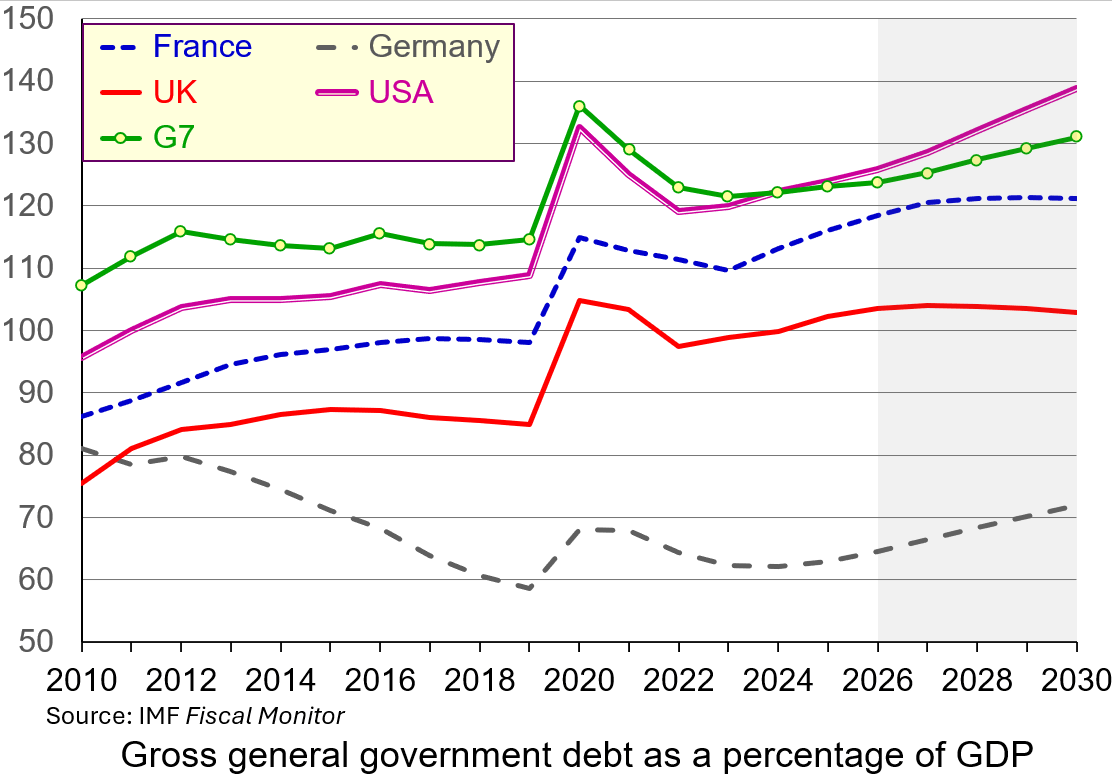 In absolute terms, the US national debt is huge, reflecting, in part, the size of the US economy. In percentage terms (126% of GDP), it is higher than Germany (65%), the UK (104%), Canada (110%) and France (118%) and slightly higher than the G7 average (124%). It is lower, however, than Italy (138%) and much lower than Japan (204%).
What is more, the IMF forecasts that the US national debt will rise from 126% of GDP in 2026 to 139% by 2030. This is because of continuing budget deficits, which require funding. The federal budget deficit is forecast to be around $2 trillion in the financial year ending September 2026 – it was $1.78 trillion in the previous financial year.
Japan’s debt percentage, by contrast, is forecast to fall from 204% in 2026 to 194% by 2030. Also, only about 10% of Japan’s debt is held by foreign investors. Around 90% is financed domestically by Japanese households, local banks, insurance companies, and the Bank of Japan. This makes Japan’s debt more sustainable than the USA’s, where around 28% is held by foreign investors (foreign governments, companies, banks and individuals).
Unlike domestic institutions (such as pension funds), which often have a structural bias to hold domestic assets, foreign investors typically view a country’s bonds as one of many global alternatives and are likely to switch faster to other countries’ assets during periods of market stress. The higher the proportion of bonds held outside the country, the more vulnerable the country is likely to be to bond market speculation.
The UK’s national debt percentage is forecast to fall slightly from 104% of GDP in 2026 to 103% in 2030. However, the UK is a global financial hub and the percentage of debt held by foreign investors (around 30%) is a little higher than in the USA. UK debt held overseas has risen from around 15% in the mid-2000s. It is likely to rise further.
Does high and rising US national debt matter?
 Servicing the debt. In February 2022, the US central bank rate (the Federal Funds rate) was 0.25%. It then rose in increments to combat rising inflation and reached 5.5% by July 2023. Although it has come down slightly since, standing at 3.75% in August 2026, US interest rates are higher now than at any time from 2008 to 2022. With higher interest rates, the USA now pays roughly $1.1 trillion annually just to service the debt. This accounts for around 15% of total federal spending – up from an historical 50-year average of just under 9%.
Upward pressure on domestic borrowing rates. To fund its deficits, the US Treasury Department must continually issue massive amounts of government bonds. This high volume of government borrowing competes for capital in global financial markets, which can push up broader interest rates. For businesses, this imposes a cost on investment and can act as a disincentive to borrow. For consumers, it adds to cost-of-living pressures by raising the cost of mortgages, car loans, credit card debt and other borrowing.
Crowding out other public spending. The money spent on servicing the debt is not available for building roads or other infrastructure, funding education, healthcare or defence, or providing social security. Annual interest payments of around $1.1 trillion now exceed national defence spending (around £960 billion), making it the third-largest item in the federal budget after healthcare and social security. As the national deficits and debt expand, so a higher proportion of current taxes is being used to fund past expenditure.
Long-term fiscal risk
The US dollar is the world’s primary reserve currency. This creates persistent global demand for US debt. However, ratings agencies and other organisations, such as the Congressional Budget Office (CBO), warn that adding $1 trillion to national debt roughly every five months is an unsustainable trajectory that could eventually erode confidence in the US economy.
 Already, many countries are seeking to expand the range of currencies used as reserves, including Chinese yuan, the euro and crypto currencies. They are also holding more gold. In 2001, the US dollar accounted for 72% of currencies held globally as reserves; by 2025 this had fallen to 57%. This process could accelerate as confidence in the USA is eroded because of the size of the debt and the capricious policies towards trade.
During periods of quantitative easing (QE), central banks, including the Fed, purchased large amounts of government bonds. But now, as central banks scale back their bond holdings in programmes of quantitative tightening (QT), foreign private investors and domestic households are being forced to absorb the majority of newly issued government debt, making pricing and yields increasingly sensitive to global investor demands. A decline in confidence can lead to a large sale of bonds, forcing down their price, thereby forcing up their yield and hence the interest that has to be paid on newly issued bonds. This is what happened in the UK in September 2022 under the short-lived administration of Liz Truss when she and her chancellor, Kwasi Kwarteng, made unfunded promises of tax cuts.
The USA is not immune to such bond market jitters. In mid-August, the yield on 30-year US Treasury bonds reached 5.3% – the highest level since 2007.
A worsening problem
 The US deficit is likely to increase, making the national debt rise more rapidly. There are various reasons.
The US population, as in many countries, is ageing and the proportion of retired people is rising. This puts increasing demands on healthcare and social security, with a proportionately smaller workforce to fund them.
The deficit has also been increased by deliberate government policies. For example, Donald Trump’s 2025 ‘One Big Beautiful Bill’ Act made substantial tax cuts, largely for the wealthy.
Congress caps the debt at a certain level and in the past this has acted as a brake on size of the deficit. However, the cap was raised by $5 trillion in 2025 and this could well happen again, allowing debt levels to expand further.
But reining in the deficit could have a contractionary effect on the economy as taxes are raised and/or expenditure is cut. Governments are reluctant to do this as it could lead to recession, or at least falling growth in the short term, and this could affect their chances or re-election. With the mid-terms approaching in the USA, and the presidential election just two years later, this is an unlikely policy for the Trump administration to pursue.
Articles
- Five charts explaining America’s $40 trillion debt
euronews, oloresz Katanich (22/8/26)
- How Much the National Debt Grew Under Trump and Biden
Time, Chantelle Lee (22/8/26)
- 7 questions about the national debt hitting $40 trillion
PBS News, Lisa Desjardins (19/8/26)
- The U.S. National Debt Officially Surpassed $40 Trillion in August: Here’s What History Says This Means for the Stock Market
Yahoo! Finance, Neil Patel, The Motley Fool (24/8/26)
- National debt reaches grim $40 trillion milestone. Here’s why that matters
CNN, Tami Luhby, John Towfighi, Matt Stiles and Amy O’Kruk (20/8/26)
- Jumpy bond markets make it clear: Trump risks driving US into debt crisis
The Guardian, Heather Stewart (23/8/26)
- Is the Trump Treasury panicking over the level of US debt?
The Guardian, Kenneth Rogoff (26/8/26)
- US debt hits $40 trillion: Who does Washington owe and why does it matter?
Aljazeera, Shola Lawal (21/8/26)
- US national debt passes $40tn after doubling in a decade
BBC News, Michael Race and Francisco Velasquez (20/8/26)
- Why the US economy is ringing alarm bells
BBC News, Michael Race (21/8/26)
- The war is raising the price of money. That’s a problem for the global economy
CNN, Matt Egan (2/9/26)
Information
Questions
- Distinguish between national debt, central government debt and general government debt.
- Would it be possible to run a budget deficit and yet for the national debt to fall as a percentage of GDP?
- Japan and Italy have a higher debt to GDP ratio than the USA or the UK. Why are they less subject to bond market pressures than the USA or the UK?
- What policy measures would you recommend to the US government to tackle the rising national debt and why?
- Could the USA ‘grow its way out of the debt problem’?

Andy Burnham is set to become UK Prime Minister on 20 July if no-one else stands to replace Keir Starmer. In a speech on 29 June, he outlined his economic vision. Central to this is devolution, where a greater number of economic decisions would be taken locally rather than by central government. This approach has been dubbed ‘Manchesterism’, in reference to his time as Mayor of Greater Manchester from 2017 to earlier this year. Under his mayoralty, Greater Manchester (GM) achieved faster economic growth than other regions or cities in the UK. From 2017 to 2023, GM’s gross value added grew by an average of 6.6% per annum and the city of Manchester’s by 8.4% – the highest of any city in the UK. The UK average was 4.9% and London’s was 4.6%.
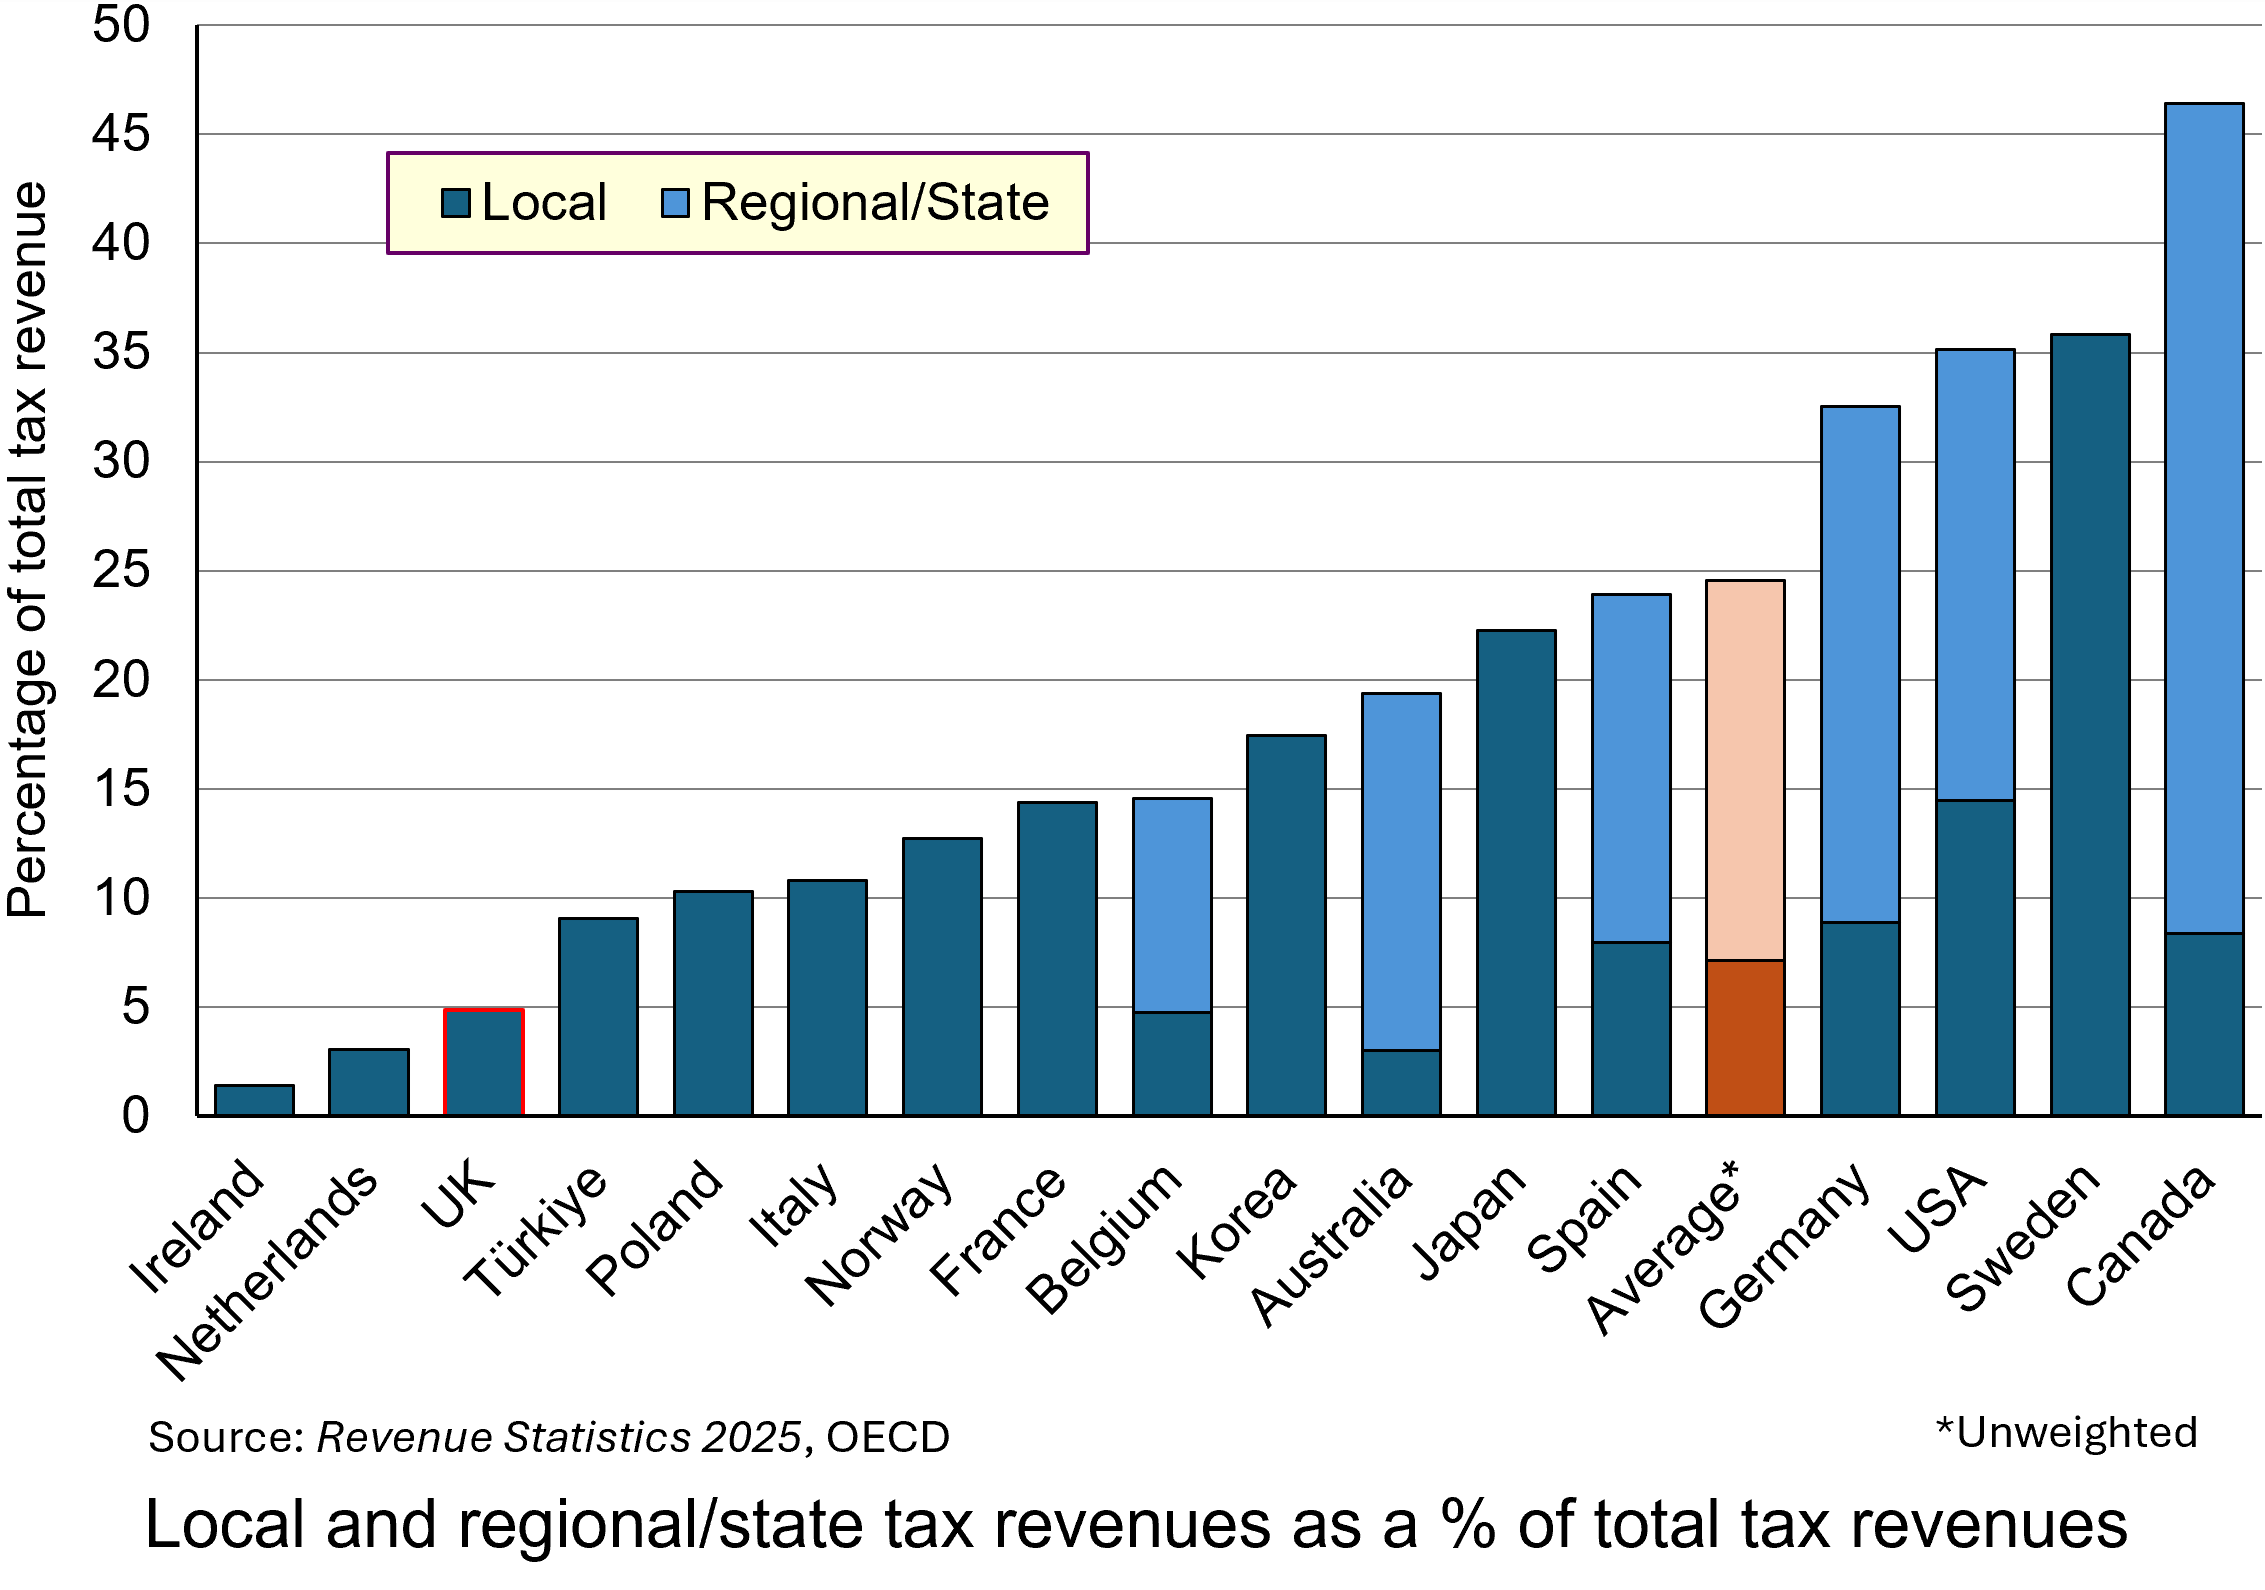 The UK, especially England, is one of the least devolved of the OECD countries. One aspect of this is taxation. The chart shows local taxes and, in the case of federal countries, state/regional/provincial taxes too. (Click here for a PowerPoint.)
Only 4.9% of UK tax revenue is in the form of local taxes (council tax and 50% of business rates) and the amount that can be raised in council tax is capped by the central government. The remainder of UK tax revenue goes to central government in the form of income taxes, social security taxes (national insurance), VAT, excise duties, etc. This compares with an average of 7.1% local taxes and 24.5% local plus regional taxes across the 17 OECD countries shown in the chart.
Andy Burnham plans to shift some of the spending and tax-raising powers from Whitehall to metro mayors and local councils. The aim is to stimulate productivity and economic growth at a regional and local level by tailoring support and incentives to local needs and strengths. Local leaders will be best positioned to understand these needs and strengths and will be able to customise spending and support appropriately.
 Examples of the types of greater autonomy over decision making would include:
- Control over adult education budgets to allow them to be tailored to provide training and apprenticeships to meet the skills requirements of existing and emerging industries in the area;
- Forming partnerships with local universities to support research and development that complements regional economic growth;
- Providing greater funding for and control over local transport infrastructure, including roads, buses, trams, trains, etc., with local consultation to make them fit for the local population and businesses;
- Tailoring business incentives to local needs and to the needs of the businesses themselves so as to attract an increase in investment;
- Greatly expanding council house building, which has virtually dried up in recent years, with mayors and/or local authorities empowered to develop local housing strategies, including affordable housing programmes, and to direct housing investment funding to particular housing developments in areas of greatest need.
Andy Burnham has pledged to stick to the government’s two existing fiscal rules:
a) The Stability Rule (Fiscal Mandate): the current (day-to-day) budget must be in balance or surplus. In other words the provision of salaries, public services, state pensions, welfare, etc. must be covered by government revenues (largely taxation). The government should borrow only to fund long-term investment.
b) The Debt Rule (Stock Mandate): each year, public-sector net financial liabilities (PSNFL) must be forecast by the OBR to be falling as a share of GDP compared to the previous year in three years’ time. This acts as a break on the amount of borrowing for long-term investment.
It is likely, therefore, that there will be little extra government money for investment. Rather, the policy involves a redistribution of public-sector investment from central government to mayoral/local authorities.
 In theory, such a policy of devolution need not see a redistribution from richer to poorer regions, but that might be part of the policy when the details are published. The UK has a bigger gap in productivity (GDP per worker) between its capital city and other large cities than in do other countries. Birmingham, Sheffield, Leeds, Newcastle, etc., as well as Cardiff, Glasgow, Edinburgh and Belfast, lag further behind London in output per head and economic growth than do other European countries lag behind their capital city. Thus the gap between Paris and Lyon, Toulouse and Marseille is narrower; as is that between Belin and Munich, Hamburg and Frankfurt. It is a similar picture in Spain and Italy. In the USA, some cities, such as San Francisco, outperform Washington DC and New York. A redistribution of government funding from London to the regions could see their incomes rise faster without having too much impact on London, which would still continue to attract large amounts of private investment.
Overall, there would be little increase in government funding. ‘Manchesterism’ is not, therefore, a demand-side policy. It is a supply-side policy – directing funds to areas where, combined with local incentives and local knowledge, the funding could yield greater returns and thereby increase potential GDP.
But this is not to say that there is no effect on aggregate demand. The hope is that devolution along the lines outlined by Andy Burnham will attract increased private investment, thereby increasing actual GDP as well as further increasing potential GDP.
We wait to see the details over the coming weeks.
Articles
- Will Andy Burnham’s devolution plan raise economic growth?
BBC Verify, Ben Chu (29/6/26)
- Burnham’s ‘Manchesterism’ could change the UK, but is not yet a full economic plan
BBC News, Faisal Islam (29/6/26)
- Burnham’s ‘Manchesterism’ got him to No 10 – but will it work for the UK?
BBC News, Faisal Islam (17/7/26)
- Burnham says there is some room for movement on tax
BBC News, Kate Wannel and Joshua Nevett (3/7/26)
- England’s mayors should be given sweeping new powers, says devolution expert
The Guardian, Kiran Stacey (2/7/26)
- What is Andy Burnham’s economic and political blueprint for Britain?
The Guardian, Richard Partington and Jessica Elgot (29/6/26)
- Why Andy Burnham’s radical plan relies on the Treasury being a friend of devolution
The Conversation, Dave Richards and Sam Warner (26/6/26)
- How Andy Burnham may try to give the UK economy a boost in his ‘10‑year plan’
The Conversation, Steve Schifferes (29/6/26)
- Could Andy Burnham let mayors raise more taxes?
House of Commons Research Briefing, Mark Sandford (2/7/26)
- Andy Burnham sets out policy plans in first major speech in PM leadership bid: Legal comments
Browne Jacobson, Dan Robinson (29/6/26)
- What does Andy Burnham think ‘Good Growth’ is?
Centre for Cities, Jess Tulasiewicz (30/6/26)
- Manchester’s digital transformation could be a blueprint for other parts of the UK
The Conversation, Richard Whittle (21/7/26)
Videos
Data
Questions
- Use an aggregate demand and supply diagram (simple or dynamic) to illustrate the effects on real GDP of a successful devolution strategy.
- Find out the details of the last Conservative government’s ‘levelling up’ policy. Was it similar in aims to that of ‘Manchesterism’?
- How could a policy of devolution as outlined by Andy Burnham affect income distribution within regions?
- Find out about the approach to regional policy in the EU. Is it similar to that being advocated by Andy Burnham?
- What is meant by ‘regional multipliers’? Why might they differ from the national multiplier?
 With relentless bombing of Iran by Israel and the USA, and with Iranian counterattacks on Gulf states, the costs of the war are mounting. The most obvious are in terms of human lives, injuries and suffering. But there are significant economic costs too. Some of these are immediate, such as the rising price of oil and hence the costs of fuel, or the fall in stock market prices. Some will be longer term, depending on how the war develops. For example, prices could rise more generally as supply chains are disrupted.
 The impacts will vary across the world and across markets. The most obvious markets to be affected are those where significant supply comes from the Persian Gulf. Approximately 20% of total global oil consumption passes through the Strait of Hormuz, which connects the Persian Gulf with the Arabian Sea and the Indian Ocean.
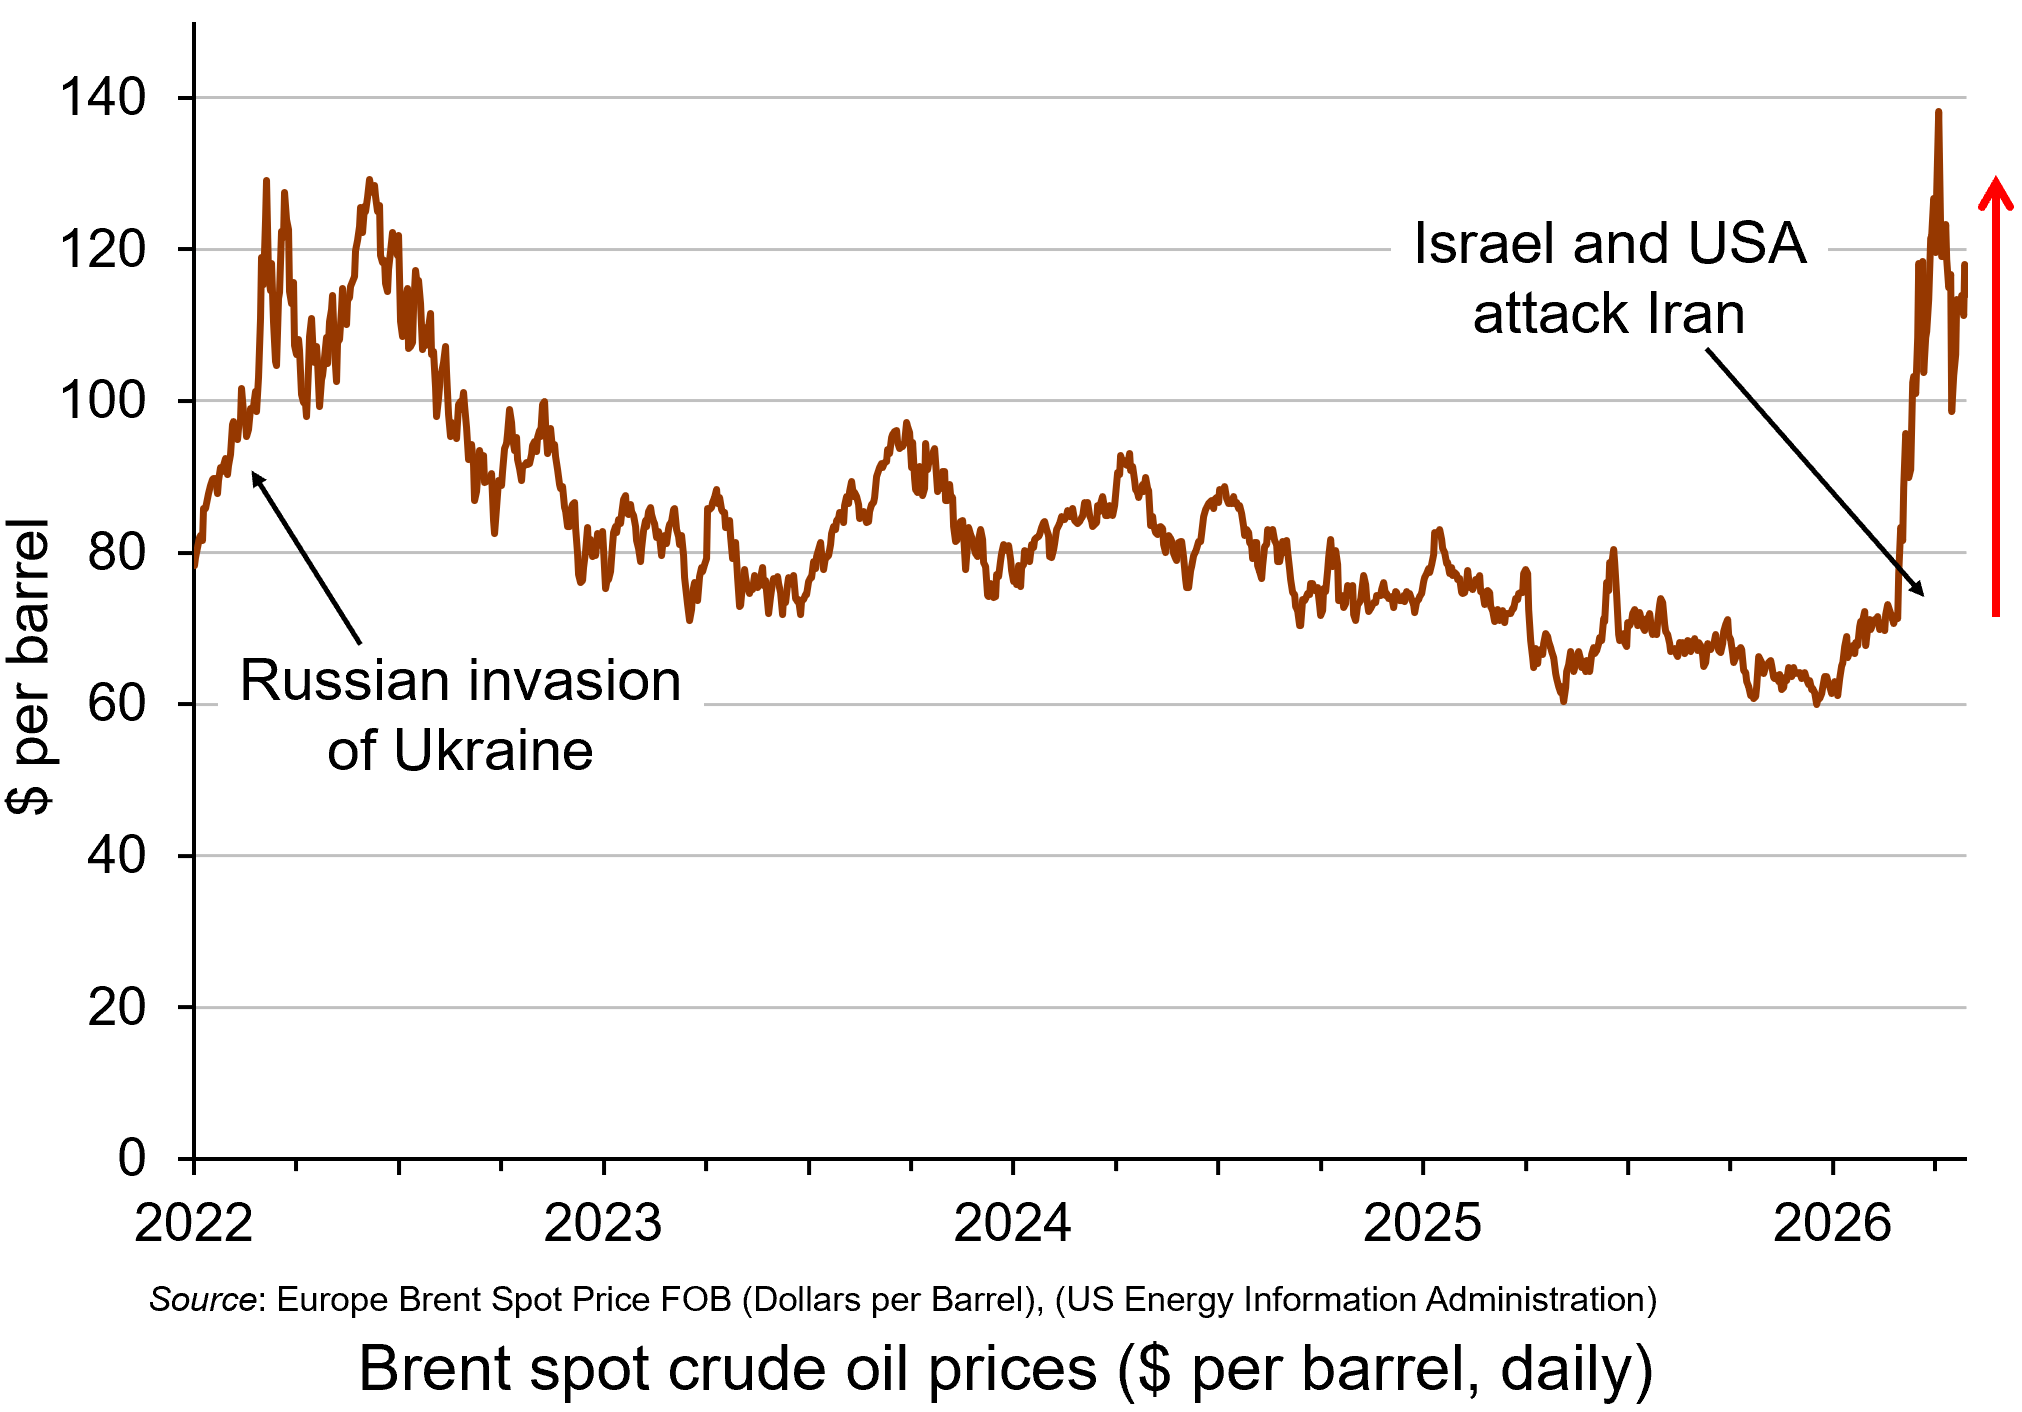
Oil prices rose considerably in the days following the start of the war on 28 February, with Brent crude, a key measure of international oil prices, rising from $71.3 on 27 February to a peak of $119.4 per barrel by the morning of 9 March – a rise of 67%. It was possible that they would rise even further in the short term. However, prices fell back substantially later on 9 March after G7 finance ministers declared that the group ‘stands ready’ to release oil from strategic reserves if needed. By late in the day, the price had fallen to below $85. (Click here for a PowerPoint of the chart.)
However, despite the announcement on 11 March that 32 countries had agreed to release 400m barrels of oil reserves, oil prices began rising again and reached $100 on 12 March after three tankers had been struck in the Gulf, two of them close to the Strait of Hormuz. With Iran pledging to keep the Strait closed, there were worries that the release of oil reserves would provide only temporary relief. Just over 20m barrels of oil normally pass through the Strait of Hormuz. The 400m barrels released from storage is the equivalent, therefore, of only 20 days’ worth of lost oil from the Gulf.
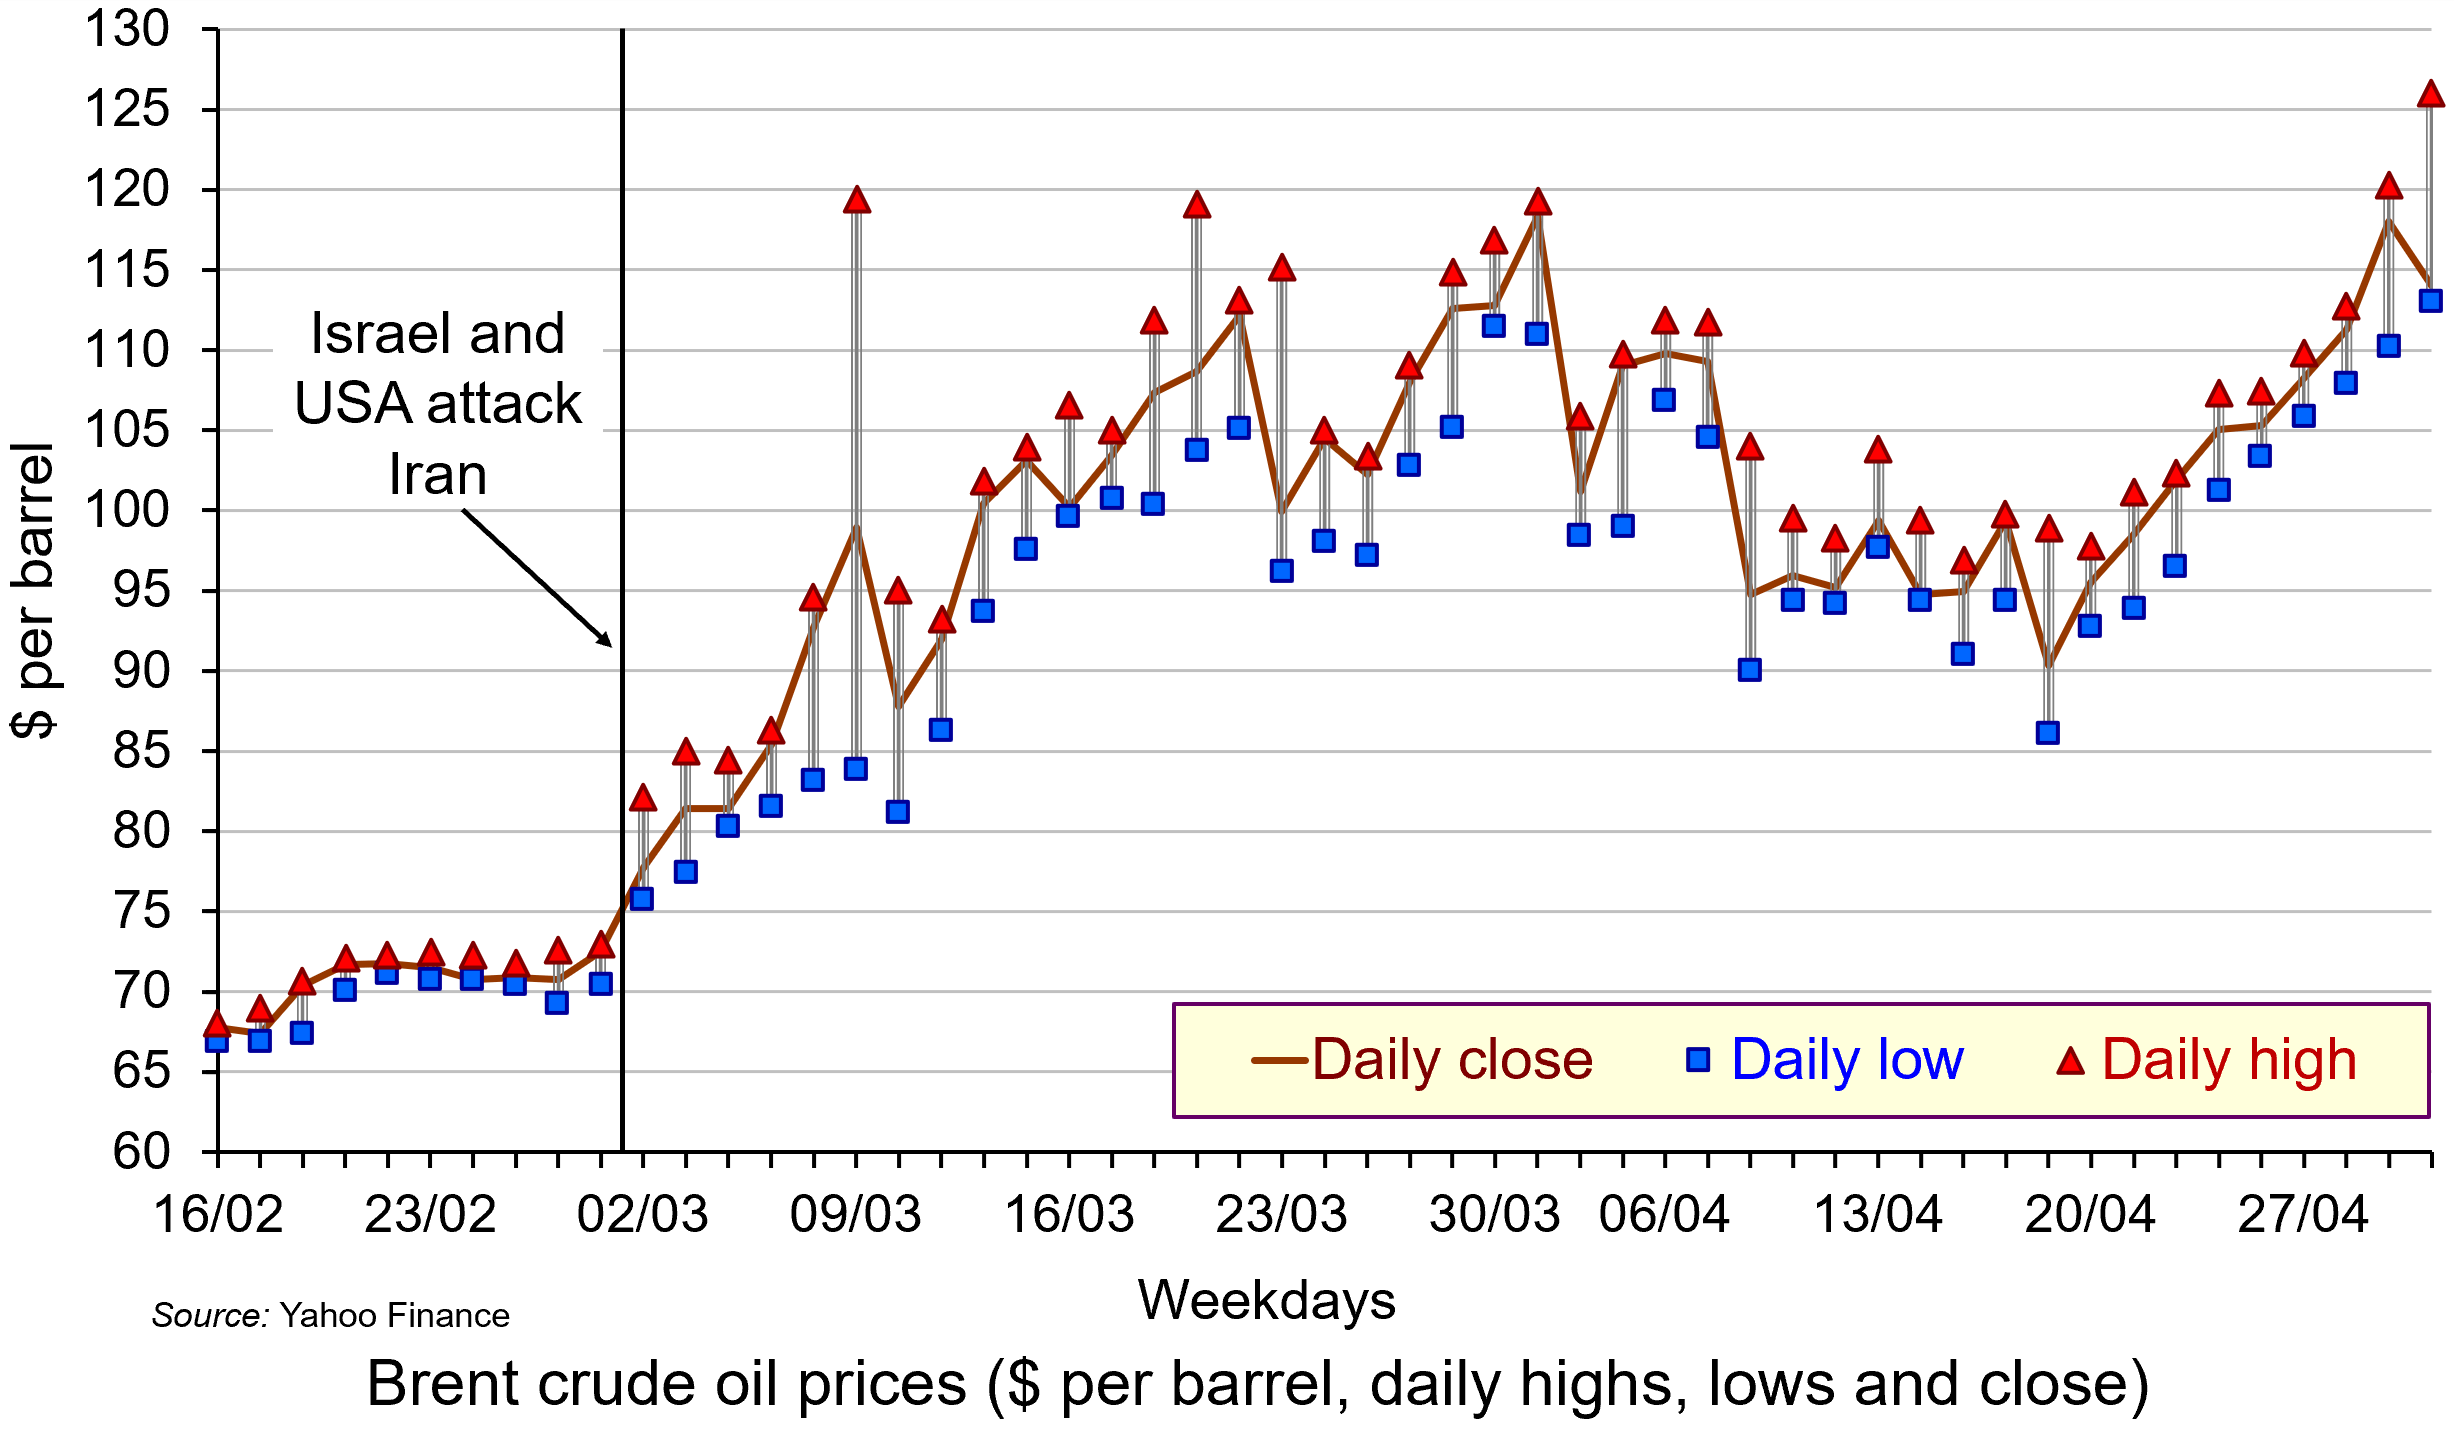
Not only did oil prices rise, but the price became much more volatile as markets reacted to the news on a continuous basis. Intra-day fluctuations in oil prices of several percentage points became typical, reflecting shifting expectations. The second chart shows daily fluctuations, with the highest and lowest prices for each day shown, along with the closing price. (Click here for a PowerPoint.)
The biggest fluctuation had been on 9 March when fears of the closing of the Strait of Hormuz saw the price of Brent crude rising to nearly $120 but falling to around $84 later in the day (a fall of around 30%) after the G7 announcement about releasing reserves.
There was another big fluctuation on 23 March. The previous day (Sunday), President Trump threatened to bomb Iran’s power plants if Iran did not allow free passage of ships through the Strait of Hormuz. Iran threatened to retaliate by striking Gulf countries’ energy and water systems. In early trading on Monday 23rd, Brent crude rose to over $115 per barrel. But later that day, Trump said that there had been constructive talks between the USA and Iran. The oil price immediately dropped to around $96 – a fall of 17% – before settling at around $100.
 Rising oil prices will drive up inflation. For those countries with a heavy dependence on Gulf oil, particularly countries in Asia, there could be significant supply problems. For oil exporters in the Persian Gulf, with tankers unable to traverse the Strait of Hormuz, the economic impact is huge. Oil exporters outside the Gulf, such as Russia, Norway and Canada, however, will gain from the higher prices. Clearly the size of these effects will depend on how long the conflict continues and how long the Strait of Hormuz remains closed.
And it is not just oil that is affected. Other products, such as liquified natural gas (LNG), petrochemicals, industrial materials, fertilizers for food production, medicines, helium for microchip production, metals and minerals are transported through the Strait of Hormuz. Gulf countries import much of their food through the Strait. On 18 March, Israel struck Iran’s huge South Pars gas field off the Gulf coast. This is the largest gas field in the world and is a major source of export revenue for Iran. Iran responded by striking the Qatari gas hub in Ras Laffan. Donald Trump responded by threatening to ‘blow up’ the entire Iranian South Pars gas field if Iran made further strikes on Qatar. The effect of this escalation was to drive oil and gas prices up further. By the week ending 20 March, the oil price closed at just over $112 per barrel.
Cuts in supplies of oil and other products represent an adverse supply shock. Such shocks push up prices (cost-push inflation), while adversely affecting aggregate output. This can lead to stagflation – a combination of higher inflation and stagnation or even falling output. Central banks with a simple mandate to keep inflation to a target are likely to raise interest rates, or at least delay in reducing them. In the USA, with a dual mandate of controlling inflation but also maximising employment, the response may be less deflationary, depending on the judgement of the Federal Reserve.
Uncertainty
 There is great uncertainty about how long the conflict will last. There is also a lack of clarity and consistency from the US administration about its war aims. This uncertainty has affected financial markets, which have seen considerable volatility. Stock markets have seen widespread falls, with airline, travel and AI-heavy stocks being particularly vulnerable.
If the war is concluded relatively swiftly, the economic effects could be relatively small. If the war continues, and especially if the Gulf countries are drawn further into the conflict and if the conflict spreads to other countries, the economic effects could be much more substantial. A prolonged conflict could see oil prices remaining above $100 per barrel, potentially increasing global inflation by 1 percentage point or more. This would slow or halt the move by central banks to cut rates and thereby reduce global economic growth – potentially, as we have seen, leading to stagflation.
The uncertainty was reflected in the decision of the Fed to keep interest rates unchanged at its meeting on 17/18 March. The Fed has the twin targets of keeping inflation close to 2% and maximising employment. Fed Chair, Jay Powell, acknowledged the current tension between the two goals: ‘upward risks for inflation and downward risks for employment, and that puts us in a difficult situation’. He also recognised that the future for inflation and the economy was highly uncertain as the war developed. This made interest rate setting difficult.
Then there is the issue of a potential new international refugee crisis. If the economic and political system in Iran deteriorates rapidly, this could trigger a wave of migration to neighbouring countries, such as Turkey, already hosting large numbers of refugees. Many could seek sanctuary further afield in Europe, with several countries already facing a backlash against immigration. The political and economic effects of this on host countries could be significant – but as yet, highly uncertain.
Articles
- Assessing the global economic impact of the Middle East war
ING, Carsten Brzeski, Warren Patterson, James Knightley and Deepali Bhargava (5/3/26)
- How the Hormuz closure could affect food, medicines and smartphones
BBC News Verify, Ben Chu (27/3/26)
- How will the Iran war affect the global economy?
Chatham House, Neil Shearing (6/3/26)
- ‘The stakes are enormous’: how a prolonged Iran war could shock the global economy
The Guardian, Richard Partington (22/3/26)
- Iran war is latest threat to a global economy rattled by Trump
Aljazeera, John Power (7/3/26)
- Why an Iran war inflation shock could wreck global economic recovery
The Guardian, Phillip Inman and Kalyeena Makortoff (8/3/26)
- Why has the Iran war sparked fears of stagflation for the global economy?
The Guardian, Luca Ittimani (9/2/26)
- Why the price of oil matters more than you might think
BBC News, Natalie Sherman and Mitchell Labiak (10/3/26)
- Strait of Hormuz: Factsheet
IEA (February 2026)
- Could this energy crisis be worse for the global economy than COVID?
The Conversation, Adi Imsirovic (26/3/26)
- Faisal Islam: Oil price spiral may be slowed but not stopped by G7 emergency move
BBC News, Faisal Islam (9/3/26)
- What on earth is going on with the oil price?
BBC News, Jemma Crew (12/3/26)
- Asia scrambles to confront energy crisis unleashed by Iran war – with no end in sight
The Guardian, Callum Jones (12/3/26)
- The grim choice facing the Trump administration: Economic or naval collapse?
CNN, Phil Mattingly and Zachary Cohen (9/3/26)
- Israel strikes Iran’s South Pars gasfield hours after forces kill intelligence minister
The Guardian, Lorenzo Tondo and William Christou (18/3/26)
- What Fed Chair Jerome Powell said — and didn’t say — about the oil crisis
Yahoo Finance, Jake Conley (19/3/26)
- What strikes on the world’s largest natural gas sites could do to the global economy
CNN, Hanna Ziady (19/3/26)
- How the Iran Conflict May Fuel a New International Refugee Crisis
Forbes, Andy J Semotiuk (5/3/26)
- Iran’s neighbours brace for fallout as war threatens new refugee crisis
Aljazeera, Abid Hussain (17/3/26)
- Two months into the Iran war, almost everybody is a loser
CNN, Ivana Kottasová (2/5/26)
Data
Report
Questions
- Who are the biggest gainers and losers from disruption to oil supplies from the Persian Gulf?
- Illustrate the effect of the current oil price shock on an aggregate demand and supply diagram (either static or dynamic).
- Why is the Iranian war likely to be less damaging to the European economy than the Ukrainian war has been?
- Why have AI-related stock prices been vulnerable to the uncertainty caused by the Iranian war?
- How have the Bank of England and the Federal Reserve Bank responded to higher oil prices and the broader economic effects of the war? Why might their responses be different in the coming months?
- What is the likely impact of the Iranian war on global economic recovery?
- How might the Iranian war affect global economic alliances?
- How is the current oil price shock likely to affect the eurozone? Will it be different from the oil price shock that followed the Russian invasion of Ukraine?
- What are the likely economic effects of large-scale migration caused by the war?
 Wobbles in the private credit market in the fourth quarter of 2025 spooked those retail investors with investments in private credit funds – a significant segment of the growing shadow banking sector. These funds use investors’ money to finance lending to businesses and individuals who struggle to, or do not want to, access credit from banks and the public market. Therefore, the risks are higher.
The failures of two auto parts suppliers in the USA last year have highlighted the risks involved. Retail investors are exiting such funds in significant numbers. Bcred, Blackstone’s $82 billion private credit fund, saw money equivalent to 8% of its net asset value (NAV) withdrawn. The firm, and employees, put $400m in to maintain confidence.
Blue Owl, another credit manager, closed investors’ usual quarterly redemption window, largely due to unprecedented demand. The fund’s managers have decided that they will wind down the fund and return money back to investors over time, whether that want it or not.
Several other listed funds run by big names, such as Blackrock and KKR, have slashed dividends and written down asset values. This week, both Morgan Stanley and Cliffwater limited withdrawals from their credit funds.
So, what has happened? In recent years, there has been a big growth in private credit funds in the USA aimed at individual retail investors. With interest margins low and fees from public investment products diminishing due to the shift to passive investing, financial institutions spied an opportunity for chunky fees by offering private credit investment to retail investors.
The liquidity–return trade-off
 Such investors are attracted by the potential for higher returns that private credit funds offered compared to public funds. The need to provide higher returns was related partly to the higher credit risk associated with the lending, but also to the illiquidity of the private credit assets that the funds invested in.
While much attention in the financial media has focused on the heightened credit risk in private funds, less attention has been given to the liquidity issue. At the heart of the private credit business model is a level of illiquidity that individual retail investors would not be comfortable with. The liquidity–return trade-off is one of the fundamental concepts in finance. Investors must be prepared to trade-off liquidity for higher returns, and vice versa. They cannot have both.
This blog will discuss that trade-off in the context of private credit funds and its lessons for retail investors, particularly in Europe where institutions are gearing up to offer such investment products.
Liquidity preference
One of the fundamental concepts in finance is the maturity mismatch between the preferences of ultimate lenders (typically households) and the requirements of ultimate borrowers (typically firms, but also households and governments too). Typically, lenders want to ‘lend short’ while borrowers want to ‘borrow long’. The financial system reconciles this mismatch by providing two important economic functions – maturity transformation and liquidity provision.
 Banks offer maturity transformation by offering current and other accounts to individuals where deposits can be redeemed at short notice. These institutions use the deposits to finance long-term lending for a variety of purposes; examples include property, investment in capital or day-to-day spending. Their effective management of this process is important economically for the smooth running of the payments mechanism and for economic growth.
But, to fulfil this, banks have to hold a mixture of assets with varying degrees of liquidity – some highly liquid, such as cash and short-term government debt instruments, and some illiquid, such as long-term loans. Liquidity is such an important issue for banks that their assets are listed on their balance sheet in order of liquidity – from most liquid to least liquid.
However, there is an inverse relationship between liquidity and expected return. Banks and their customers have to sacrifice return if they want higher liquidity. Therefore, liquid assets tend to offer a low rate of return and illiquid assets a higher rate of return. Consequently, in order to retain sufficient liquidity, the overall return banks can generate is limited compared to a situation where they invest wholly in illiquid assets.
If individuals want to invest directly in long-term financial assets, such as debt and equity, there must be a secondary market where these can be bought and sold – the stock market. Without this mechanism providing liquidity, individuals are less likely to invest in these assets in the first place. Few would want to wait for a debt security to mature or hold a share in perpetuity. Secondary markets mean they don’t have to.
Liquidity and private credit
Private credit funds have existed for a long time as part of the shadow banking sector and have grown in scale. Such funds invest in non-tradable, long-term illiquid loans as a parallel to the better-known private equity sector. Traditionally they have been targeted at institutional investors, who are more comfortable with the higher credit risk and illiquidity involved.
However, while institutions are prepared to forgo liquidity for many years in expectation of higher returns, individual retail investors are not – they have a higher liquidity preference. Funds tailoring private credit funds acknowledged that individual investors required a liquidity incentive to invest. Since there is no liquid secondary market to facilitate liquidation, private funds aimed at such retail investors offered quarterly redemption opportunities. The industry standard settled on around 5% of a fund’s value.
However, offering these ‘liquidity windows’ creates a tension in the private credit business model. Private credit operates on the basis of illiquidity in return for higher returns. This includes borrowers prepared to pay a higher interest rate on debt to avoid exposure to the glare of public market scrutiny.
Further, the prices of private loans are not ‘marked-to-the-market’ like publicly traded debt, so they are not correlated with public markets. This enables fund managers to work out credit problems over time rather than be forced into fire sales to meet the liquidity needs of investors.
 Offering liquidity confounds that. To do so, private credit funds end up operating like quasi-public funds. They have to hold sufficient liquid assets to cover redemptions. Indeed, regulations for such funds in Europe are proposing a minimum of 20% of assets in liquid investments so there is a reserve to meet redemptions. But, by doing so, funds will not be able to generate the promised returns. Indeed, returns may be not much higher that that offered by public traded funds.
Further, providing quarterly redemption windows requires fair and timely valuations of the fund. Irrespective of perceptions around credit risk, if investors feel that the valuation is generous then many will want to take advantage of the liquidity window to redeem and no limit on withdrawals, be it 5%, 10% or whatever, is sufficient. However, with no secondary market mechanism to remove the excess demand, those told they cannot redeem their investment will only increase their demands for liquidity further and exit at the next available opportunity.
This irreconcilable tension in offering private credit funds to retail investors is being recognised. Not only are funds like Blue Owl being wound up, but the share prices of providers in the USA have fallen sharply as markets realise that the anticipated returns from selling private credit to retail investors are unlikely to be realised. Blackstone’s market capitalisation has halved from $250 billion at the end of 2024 to $134 billion on 11 March 2026.
But this is the moment when private credit funds are being offered to retail investors in Europe. The lesson for European retail investors from the US experience is that you can’t have high liquidity and high return. As with most allocation decisions, there is a trade-off.
Articles
Questions
- What is maturity transformation? Explain how banks conduct maturity transformation.
- What is liquidity provision? Explain how secondary financial markets provide liquidity.
- Explain why private credit funds offer a higher expected return than public ones?
- Analyse the pressures on profit margins in public markets which led financial institutions to offer private credit funds. In doing so, consider the ethics around offering such a product to retail investors.
- Explain why offering such funds to individual (retail) investors has not worked.
 US hikes interest rates as fears grow of global oil shock over Iran War