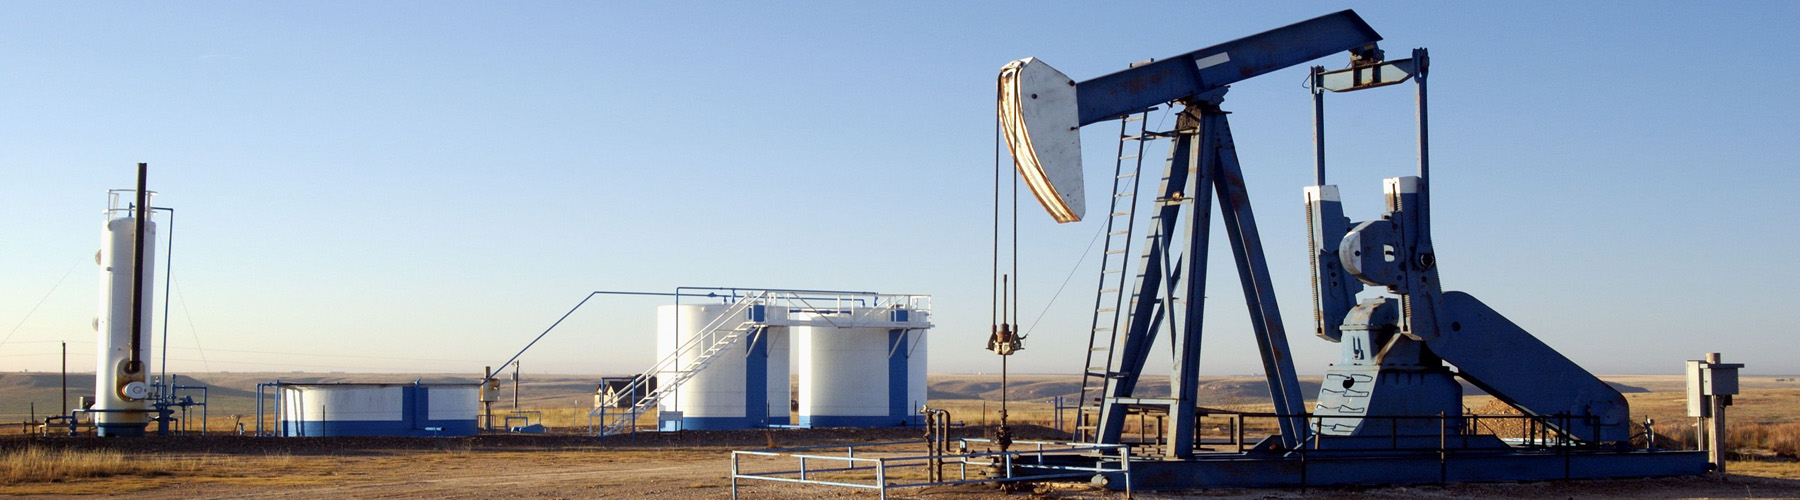
From the start of the American and Israeli war with Iran on 28 February 2026 to 30 September – a period of just seven months – the retail price of petrol in the UK has risen by approximately 43p, from around 132p to 175p per litre – a rise of 33%. In contrast, the price of diesel has risen by approximately 59p, from around 142p to 201p per litre – a rise of 42%.
In several other countries the percentage difference is greater still, particularly in countries where fuel taxes are lower and thus the wholesale cost of the fuel is a larger percentage of the pump price. In the USA, for example, petrol (gasoline) prices have risen by around 38%, whereas diesel prices have risen by around 73%.
But why have diesel prices risen by more than petrol prices? The answer has to do with supply and demand.
Supply
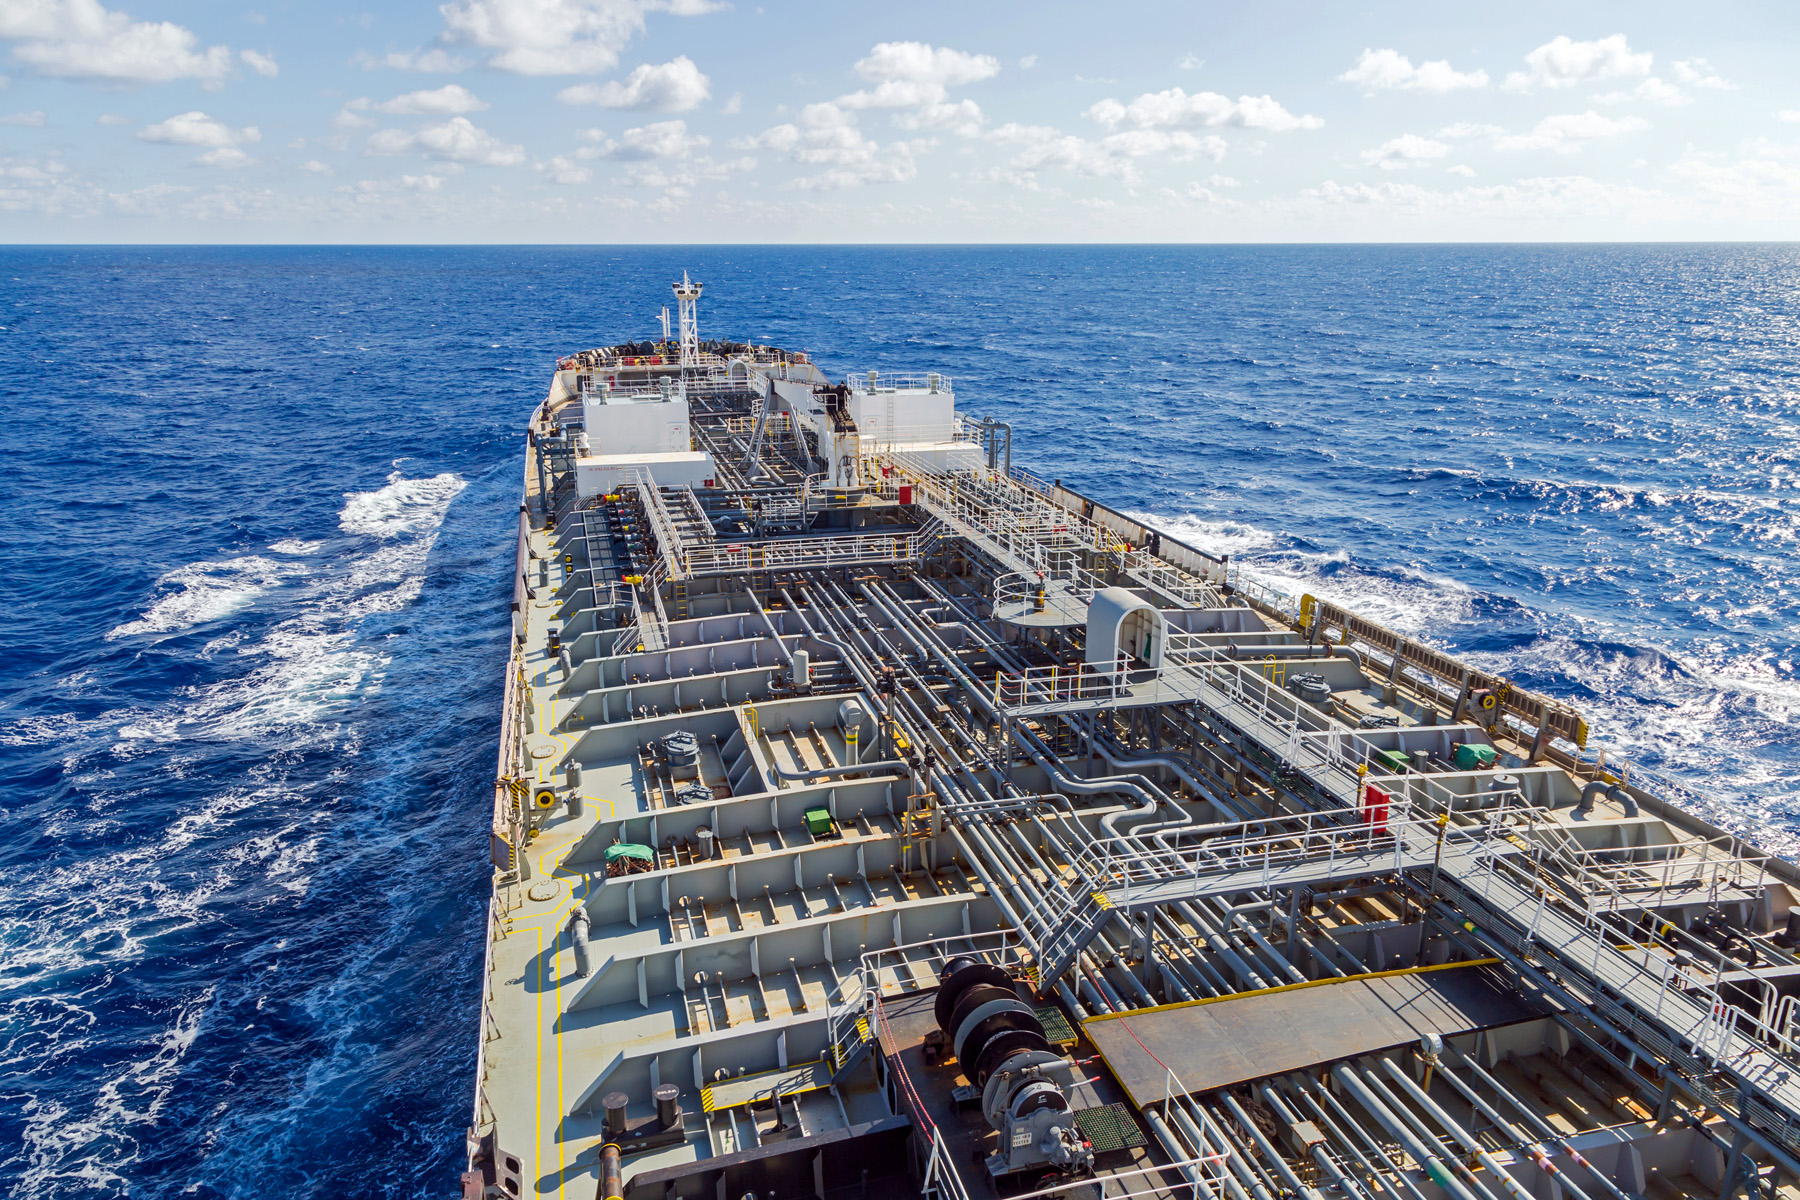 Greater effect of the Iran war on diesel supplies. The closing of the Strait of Hormuz has drastically cut the supply of oil from the Gulf states. This is being compounded by the Houthi attacks on Saudi shipping in the Red Sea. This has forced Saudi oil that is transported by pipeline to the Red Sea and destined for countries east of Saudi Arabia to be transported north via the Suez canal rather than south through the Bab al-Mandab Strait. This has been made worse by attacks launched from Iraq on the Saudi oil pipeline.
Middle Eastern crude oil’s composition is the most efficient for refining high-quality diesel. The restriction on exports, both of crude oil and of diesel from Gulf refineries, has thus affected diesel supplies more than petrol supplies.
Effect of Ukraine war. Ukraine has been launching drone attacks on Russian refineries, mainly producing diesel. The resulting shortage of diesel within Russia has led it to impose a ban on diesel exports, extended at least to the end of 2026, to limit the effects on supplies for the military and for domestic users. Russia has historically been the world’s second-largest diesel exporter and the ban has reduced the world’s supply of seaborne diesel by around 12%.
Low diesel stocks. Stocks of diesel have been run down and this has meant that there is little flexibility to draw them down further.
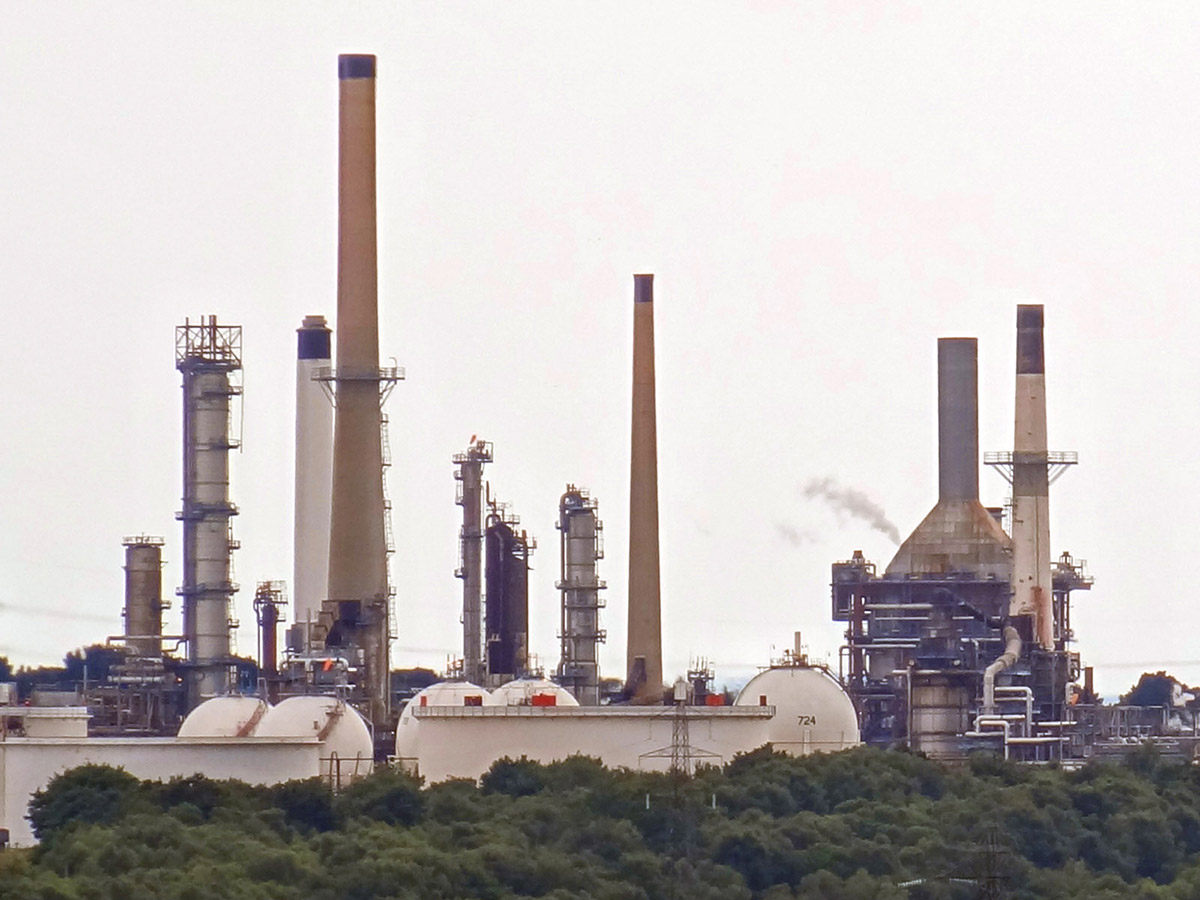 Refinery constraints. Refineries cannot instantly alter their output to produce more diesel. Furthermore, diesel has become more expensive to produce in recent years due to the transition to ultra-low sulphur diesel to meet stricter environmental standards. This makes the supply of diesel relatively price inelastic, exaggerating the effect on price.
UK refineries produce more petrol than the domestic market requires, making the UK a net exporter of petrol. This higher self-sufficiency partially shields domestic petrol prices from global shocks. However, the UK does not refine enough diesel to meet domestic demand. It relies heavily on foreign imports to cover the shortfall. Thus diesel prices in the UK are more subject to global price increases.
Demand
Seasonal demand spikes. The demand for diesel tends to rise in late summer due to extra agricultural demand for autumn crop harvests.
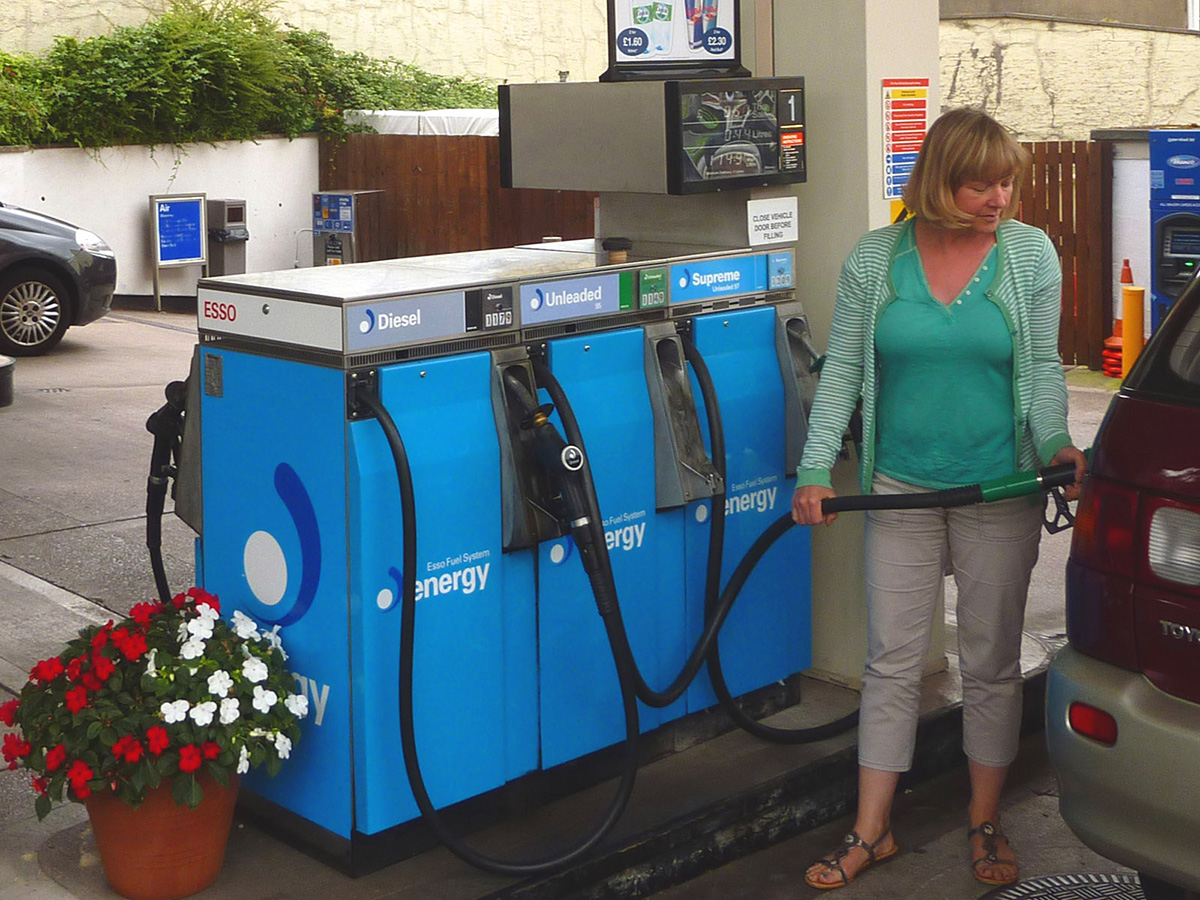 Low price elasticity of demand. Unlike petrol, which is primarily consumed by individuals who can choose to drive less when prices rise, diesel is essential to industrial economies. It powers lorries, ships, buses, trains, agricultural machinery, mining equipment and many industrial machines. Because businesses must keep moving goods, farming crops and running machines, global demand for diesel is little affected by rising prices. This low price elasticity of demand results in a bigger price rise for every reduction in supply than is the case for petrol.
What is more, the transition to EVs has been greater for cars than for lorries, although many buses and vans are now electric. The electrification of the railways, however, is too long-term a project to affect short-term diesel prices and electric lorries are still in their infancy. But with rapid development of electric alternatives underway in the haulage and industrial machinery sectors, they may become less reliant on diesel in the relatively near future.
Articles
- Petrol and diesel prices hit highest since 2022
BBC News (14/9/26)
- Diesel prices hit new record in September 2026: What that means for inflation, shipping costs and your portfolio
J.P.Morgan, Sergei Klebnikov (15/9/26)
- Iran war pushes diesel – the economy’s lifeblood – to record high prices, with no relief on the horizon
The Conversation, Morgan Bazilian and Jamie Webster (18/9/26)
- Diesel costs more than $6 a gallon for the first time. Here’s how that affects you
CNN, Chris Isidore and Matt Egan (12/9/26)
- Why is diesel more expensive than petrol in Australia?
NRMA, Sam Charlwood (9/4/26)
- Diesel Prices Surge as Global Supplies Tighten
Farm Bureau Intel, Faith Parum (17/9/26)
- Why has diesel increased so much more than unleaded?
PetrolPrices (11/3/26)
- Disparity between diesel and petrol prices reaches record-breaking levels
FleetNews, Gareth Roberts (30/3/26)
- Diesel and petrol hit four-year high fuelling inflation concerns
FleetNews, Gareth Roberts (15/9/26)
- EU says Trump plan to ban US diesel exports would ‘negatively impact both sides’
The Guardian, Jillian Ambrose (25/9/26)
Videos
Questions
- Draw a demand and supply diagram for diesel and petrol to illustrate the effects discussed in this blog.
- Is the demand for diesel likely to be more elastic over the longer term? Explain.
- Compare the effects on diesel prices in the UK with one other country of your choice. How similar are the factors affecting the relative price increases in diesel and petrol in the two countries?
- Would cutting taxes on diesel solve the problem of higher prices for diesel users?
- How has the cost of heating oil and aircraft fuel changed compared to that of petrol and diesel? Explain.
- What would be the effects on diesel prices in the UK and the USA if Donald Trump carried out his potential plan to ban US exports of diesel?
 The world has suffered from a number of adverse supply shocks in recent years. First there was the credit supply shock of 2007–9 that led to a default on mortgages, a collapse in confidence in the banking system, the drying up of the inter-bank market, the freezing of lending and a global economic contraction. Then there was the COVID-19 pandemic. This shock to the the global economy led to a a fall in output and breaks in supply chains. As recovery took place, supply-side difficulties led to a surge in inflation.
Then there was the Russian invasion of Ukraine. This shock to energy and grain supplies led to rises in fuel and food prices: a cost-push inflationary shock. More recently, the closing of the Strait of Hormuz has cut off an important supply route and again sent fuel and other other prices rising.
These supply-side shocks create a dilemma for central banks. They push up inflation, but push output and employment down – a situation of ‘stagflation’.
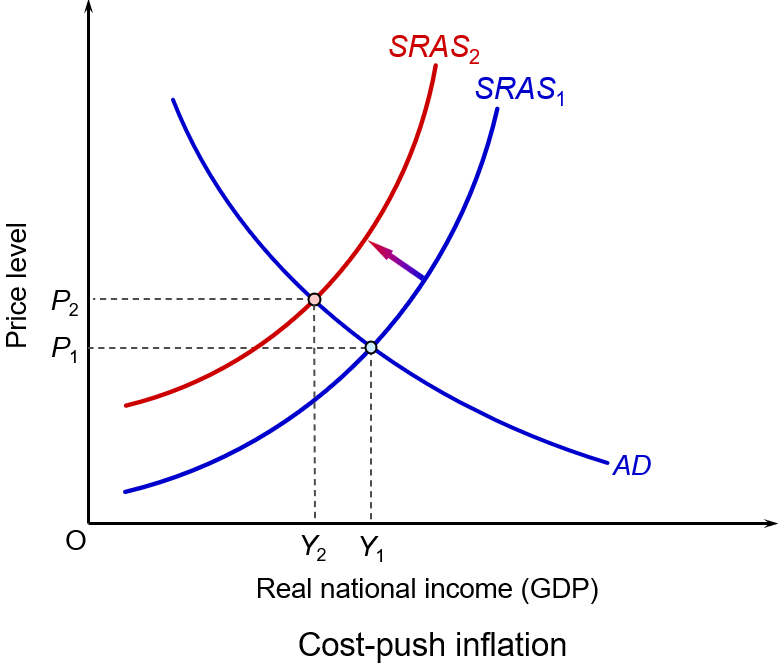 This can be illustrated with a simple aggregate demand and supply diagram. The shock shifts the aggregate supply curve upwards to the left, illustrated by the move from SRAS1 to SRAS2. The price level rises to P2 and GDP falls to Y2.
But central bank policy is designed to affect aggregate demand, not aggregate supply. If it raises interest rates, aggregate demand will shift to the left. The price level will fall (or at least the rate of inflation will fall), but output will fall further. If it cuts interest rates, aggregate demand will shift to the right. This will help to curtail, or even reverse, the fall in GDP, but will lead to even higher prices.
For countries where their central bank has a simple inflation mandate (e.g. keeping inflation close to 2%), sticking to this target in the short term would result in higher interest rates, lower economic growth and higher unemployment – and possibly even a recession. In such cases, central banks tend to project forward beyond the short-term shock and set interest rates to target inflation in a few months’ time. Indeed, many central banks do explicitly target inflation in the medium term (1 or 2 years) rather than the short term.
 Central banks, such as the US Federal Reserve Bank, which have a dual mandate of targeting inflation but also maximising employment, the trade-off between these two objectives can be stark. Getting the inflation down requires a higher rate of interest; maximising employment in the face of an adverse supply shock requires a lower rate of interest.
The short-term economic costs, let alone the human costs if the shock involves a war, can be great. People may suffer extreme hardship. The cost to the US Treasury of the first six weeks of the Iran war were estimated by the Pentagon to be some $29bn1 – which translates into higher taxes for US residents, lower government spending on non-war related items, higher government borrowing or some combination of the three. Other estimates put the cost to the US taxpayer as much higher – up to $1 trillion over the longer term.2 Then there are the costs to consumers of higher fuel and other prices, estimated at around $410 per month.3
The costs to Iranian citizens will be much higher in terms of war damage and loss of livelihood, let alone the suffering and loss of life. Then there are the costs to the rest of the world from higher prices of fuel, fertilisers and various industrial materials that are normally shipped through the Strait of Hormuz.
Long-term economic gain?
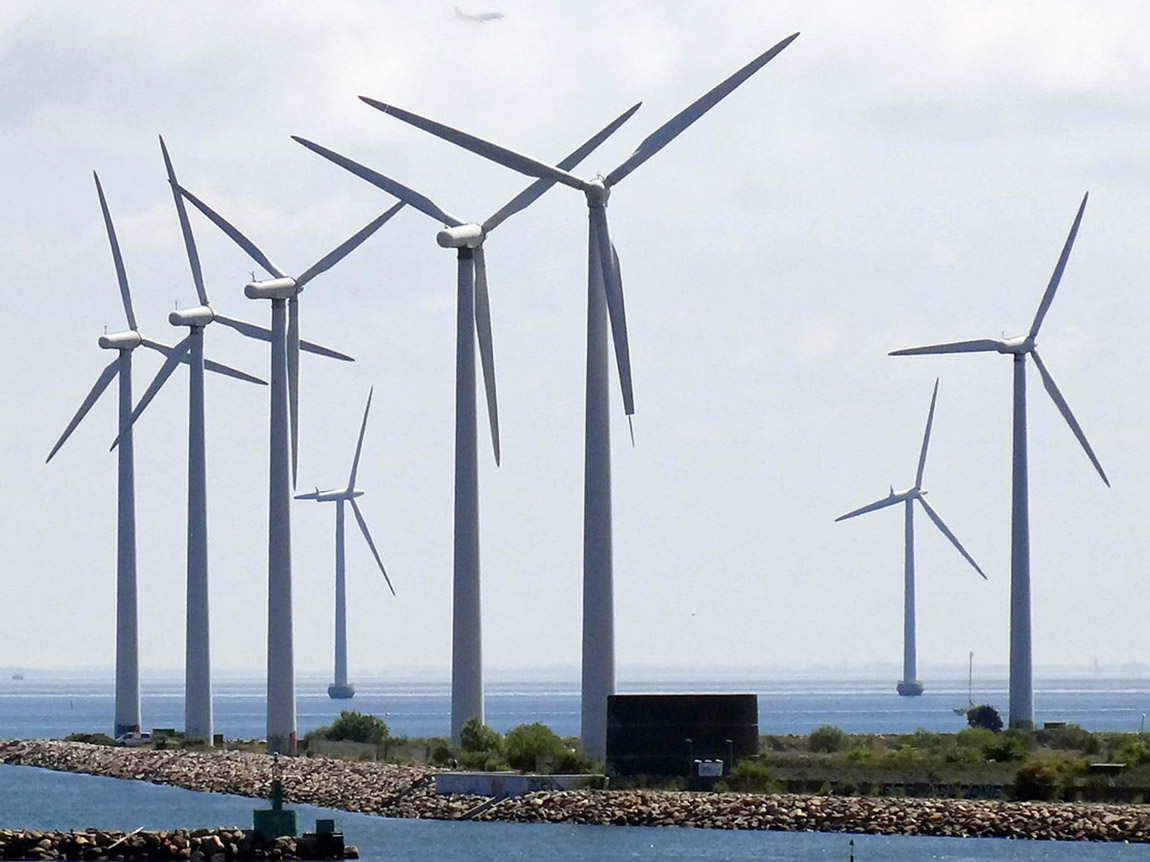 Supply shocks often expose economic vulnerabilities that can later be addressed, making supply chains more diverse and more resilient. They can give a boost to alternative technologies, such as a switch from fossil-fuels to green energy.
After the 2007–9 financial crisis, banking systems were made more robust under the Basel III system. Capital and liquidity requirements were increased and bank leverage was decreased. Many countries, such as the UK, introduced ‘ringfencing’ to separate retail banking from the riskier investment banking. This increased confidence in the banking system.
The COVID-19 pandemic gave a boost to working remotely and the establishment of more flexible work patterns. What was a necessity during lockdowns, was seen as an effective model by many companies. Fully remote or hybrid working became commonplace for many jobs that were previously done in the office. Time has allowed employers to find the best balance of in-office and remote working, with the optimum balance often varying by type of job being performed.
The rising price of oil and gas following the Russian invasion of Ukraine in February 2022, saw many countries that had been reliant on imports from Russia, accelerating their efforts to switch to renewable energy. Supply chains were re-examined and there was a move towards ‘re-shoring’, ‘near-shoring’, or ‘friend-shoring’: that is, obtaining supplies from countries that are nearer and/or more reliable as trading partners.
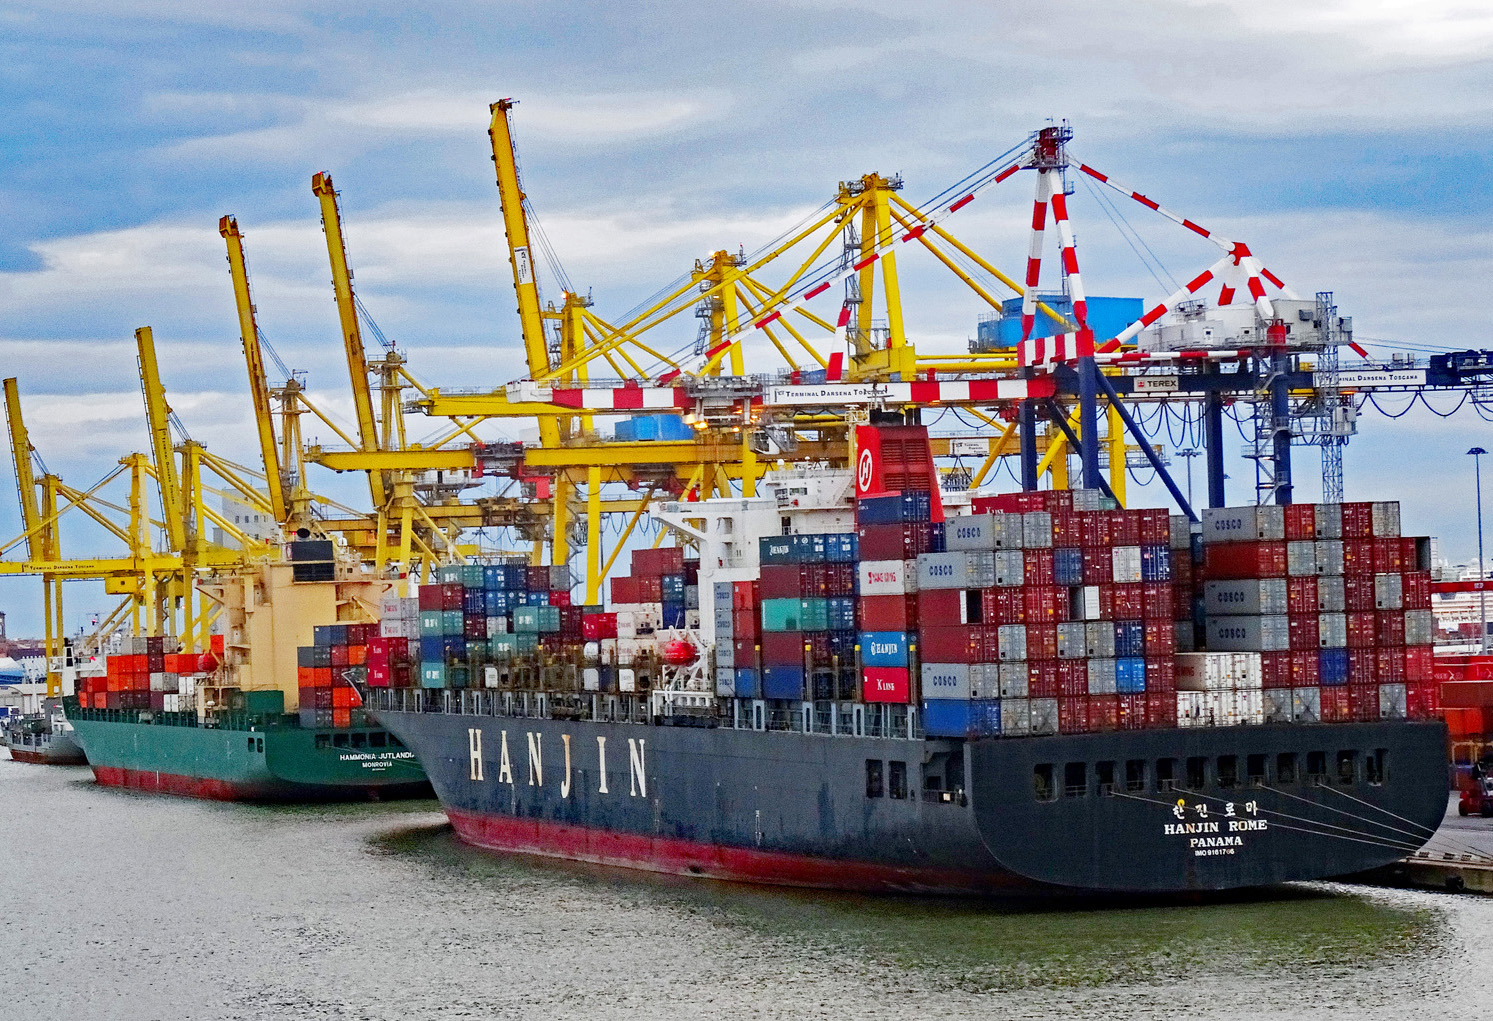 This approach was further boosted by the extensive tariffs imposed by the Trump second administration. One of the responses to the higher tariffs was to seek markets, both for exports and imports, away from the USA. To the extent that there is ‘re-shoring’ (substituting exports and imports for production and consumption within the country), then this amounts to deglobalisation. If this represents a move from low-cost to high-cost production and is contrary to the law of comparative advantage, then there will be a net economic loss. If, however, the reduction in risk of disruption and the boost to domestic industries allows a reduction in costs, there could be a net gain.
The most recent example of the Iran war has led many countries to reconsider sources of supply and to make their supply chains more robust and less risky. Gulf countries are considering expanding their pipeline network to avoid the Strait of Hormuz. For other countries, it is providing a further boost to green energy. Increased investment in the renewable sector will help to bring down costs and make countries less vulnerable to future conflicts involving oil-producing countries or sea passages.
To summarise: if initially adverse supply-side shocks cause a diversification and strengthening of supply chains, a diversification of energy sources, accelerated technological innovation and the adoption of new more efficient techniques, the long-term supply-side effects could be positive. Pain today for gain tomorrow?
But the short run comes before the long run and today’s costs are real and mounting. A shock may stimulate a positive response, but the current shock is persisting, and forecasts are getting more dire by the day. And even when the Iran war is over, there may be more shocks around the corner – ‘unknown unknowns’. As Keynes said: ‘In the long run we’re all dead’.
References
- Pentagon’s estimate for Iran war grows to $29B
Politico, Mark Sweney (12/5/26)
- World Politics The Iran war could cost the American taxpayer $1 trillion, says Harvard academic
CNBC, Joseph Wilkins (14/4/26)
- The Economic Costs of the Iran War
American Enterprise Institute, Roger Pielke Jr. (2/4/26)
Articles
Questions
- What policies have central banks pursued during the Iran war?
- Paint an optimistic scenario for the global economy five years hence.
- Paint a pessimistic scenario for the global economy five years hence.
- Compare the sources of supply of oil and gas for Europe directly prior to the Iran war with those directly prior to the Russian invasion of Ukraine.
- Compare the relative merits of globalisation and deglobalisation. Does this depend on the nature of globalisation and deglobalisation?
With relentless bombing of Iran by Israel and the USA, and with Iranian counterattacks on Gulf states, the costs of the war are mounting. The most obvious are in terms of human lives, injuries and suffering. But there are significant economic costs too. Some of these are immediate, such as the rising price of oil and hence the costs of fuel, or the fall in stock market prices. Some will be longer term, depending on how the war develops. For example, prices could rise more generally as supply chains are disrupted.
 The impacts will vary across the world and across markets. The most obvious markets to be affected are those where significant supply comes from the Persian Gulf. Approximately 20% of total global oil consumption passes through the Strait of Hormuz, which connects the Persian Gulf with the Arabian Sea and the Indian Ocean.
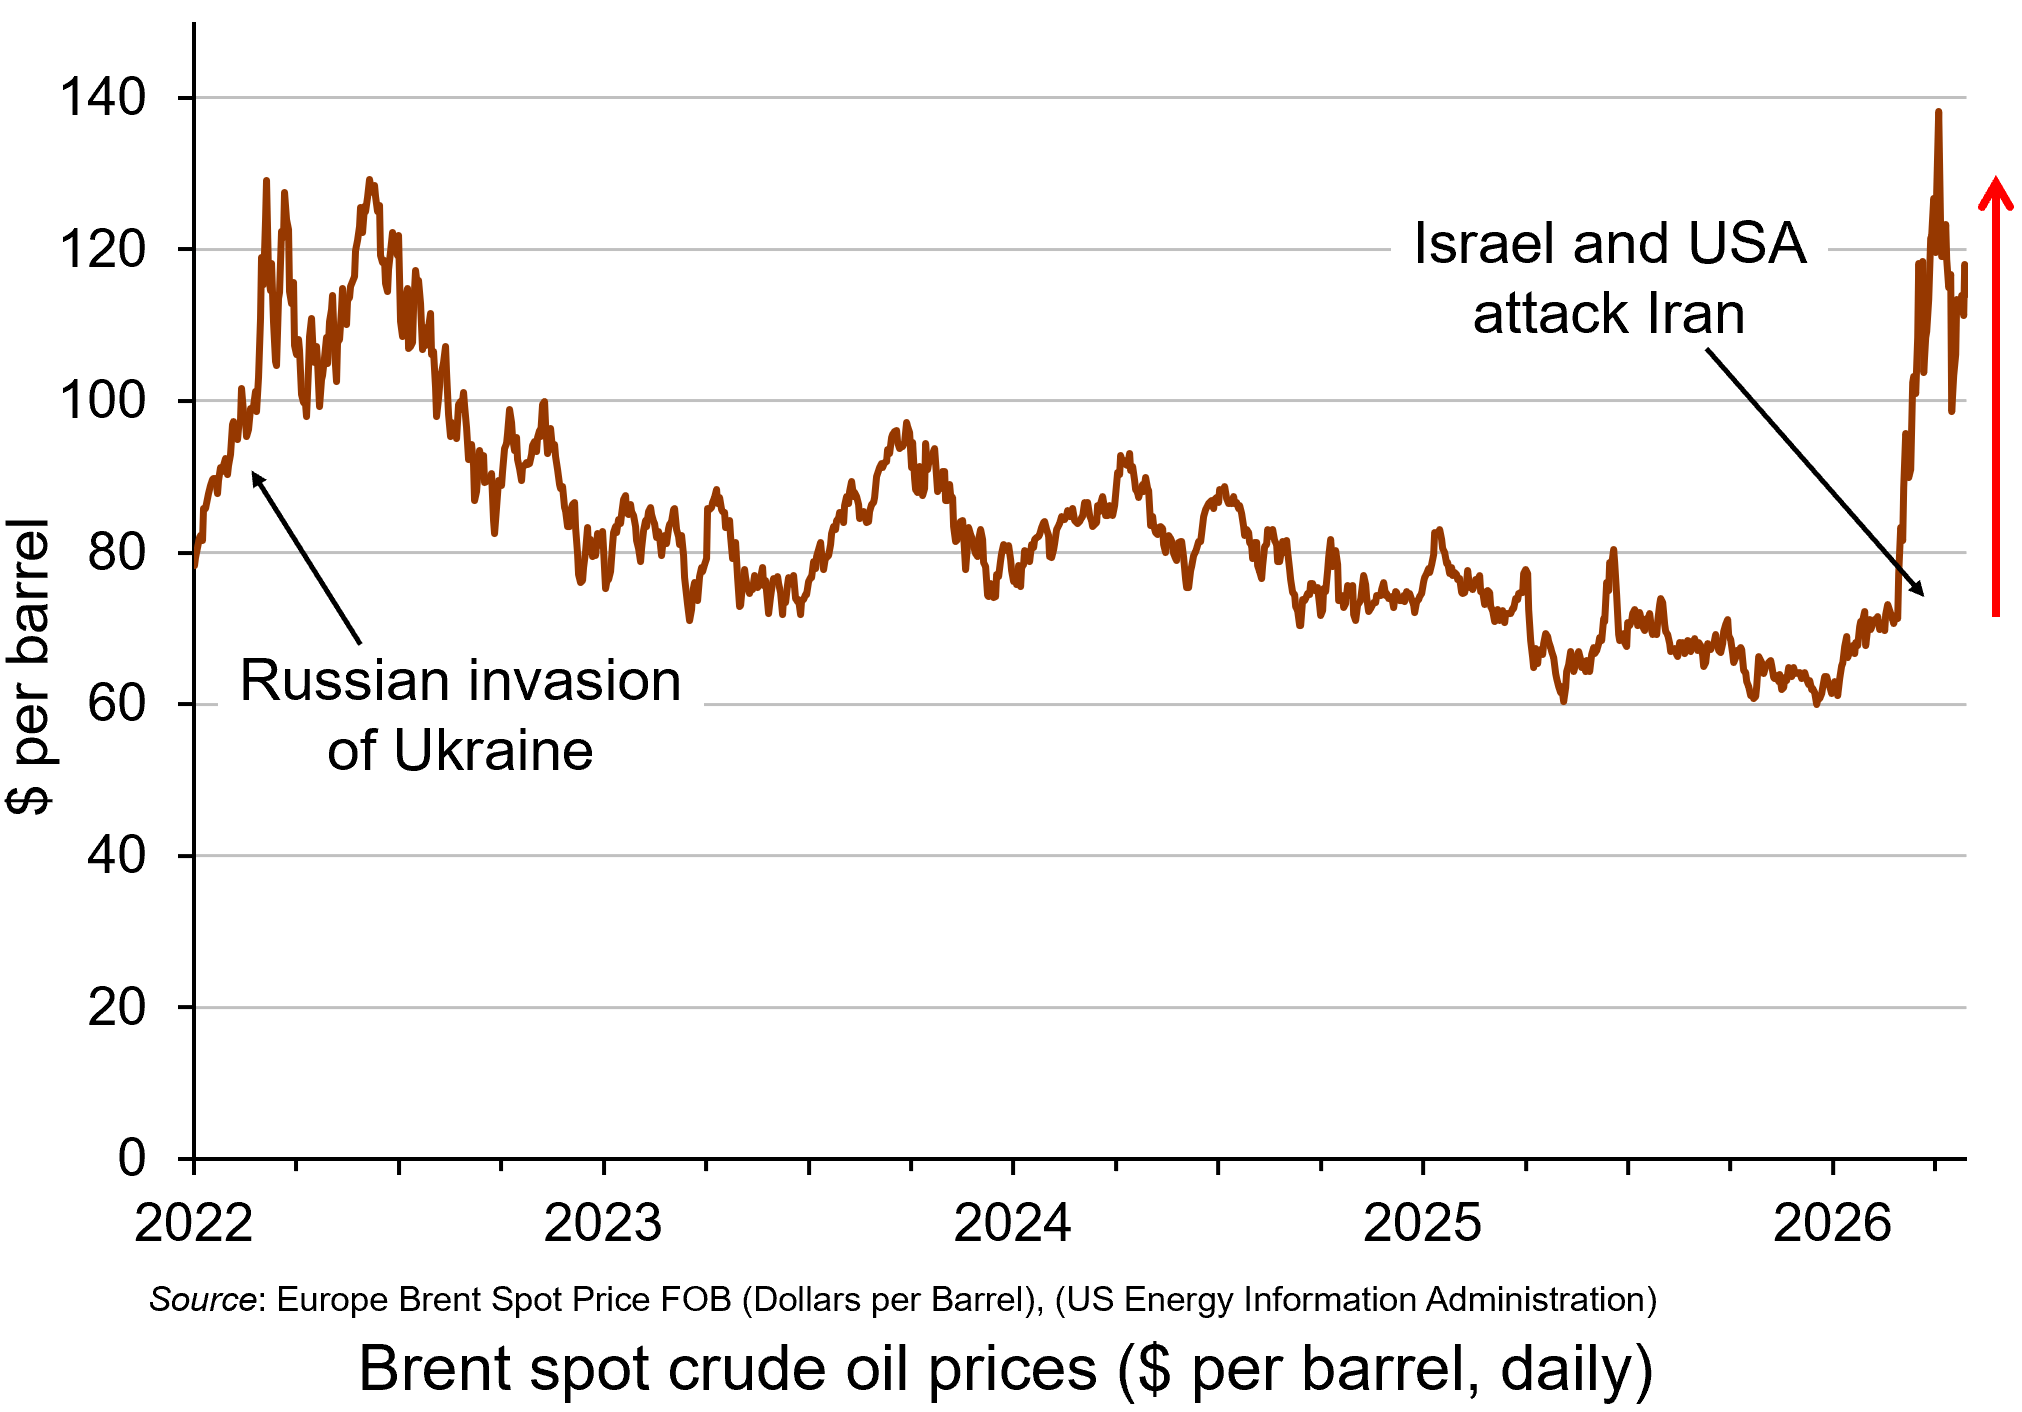
Oil prices rose considerably in the days following the start of the war on 28 February, with Brent crude, a key measure of international oil prices, rising from $71.3 on 27 February to a peak of $119.4 per barrel by the morning of 9 March – a rise of 67%. It was possible that they would rise even further in the short term. However, prices fell back substantially later on 9 March after G7 finance ministers declared that the group ‘stands ready’ to release oil from strategic reserves if needed. By late in the day, the price had fallen to below $85. (Click here for a PowerPoint of the chart.)
However, despite the announcement on 11 March that 32 countries had agreed to release 400m barrels of oil reserves, oil prices began rising again and reached $100 on 12 March after three tankers had been struck in the Gulf, two of them close to the Strait of Hormuz. With Iran pledging to keep the Strait closed, there were worries that the release of oil reserves would provide only temporary relief. Just over 20m barrels of oil normally pass through the Strait of Hormuz. The 400m barrels released from storage is the equivalent, therefore, of only 20 days’ worth of lost oil from the Gulf.
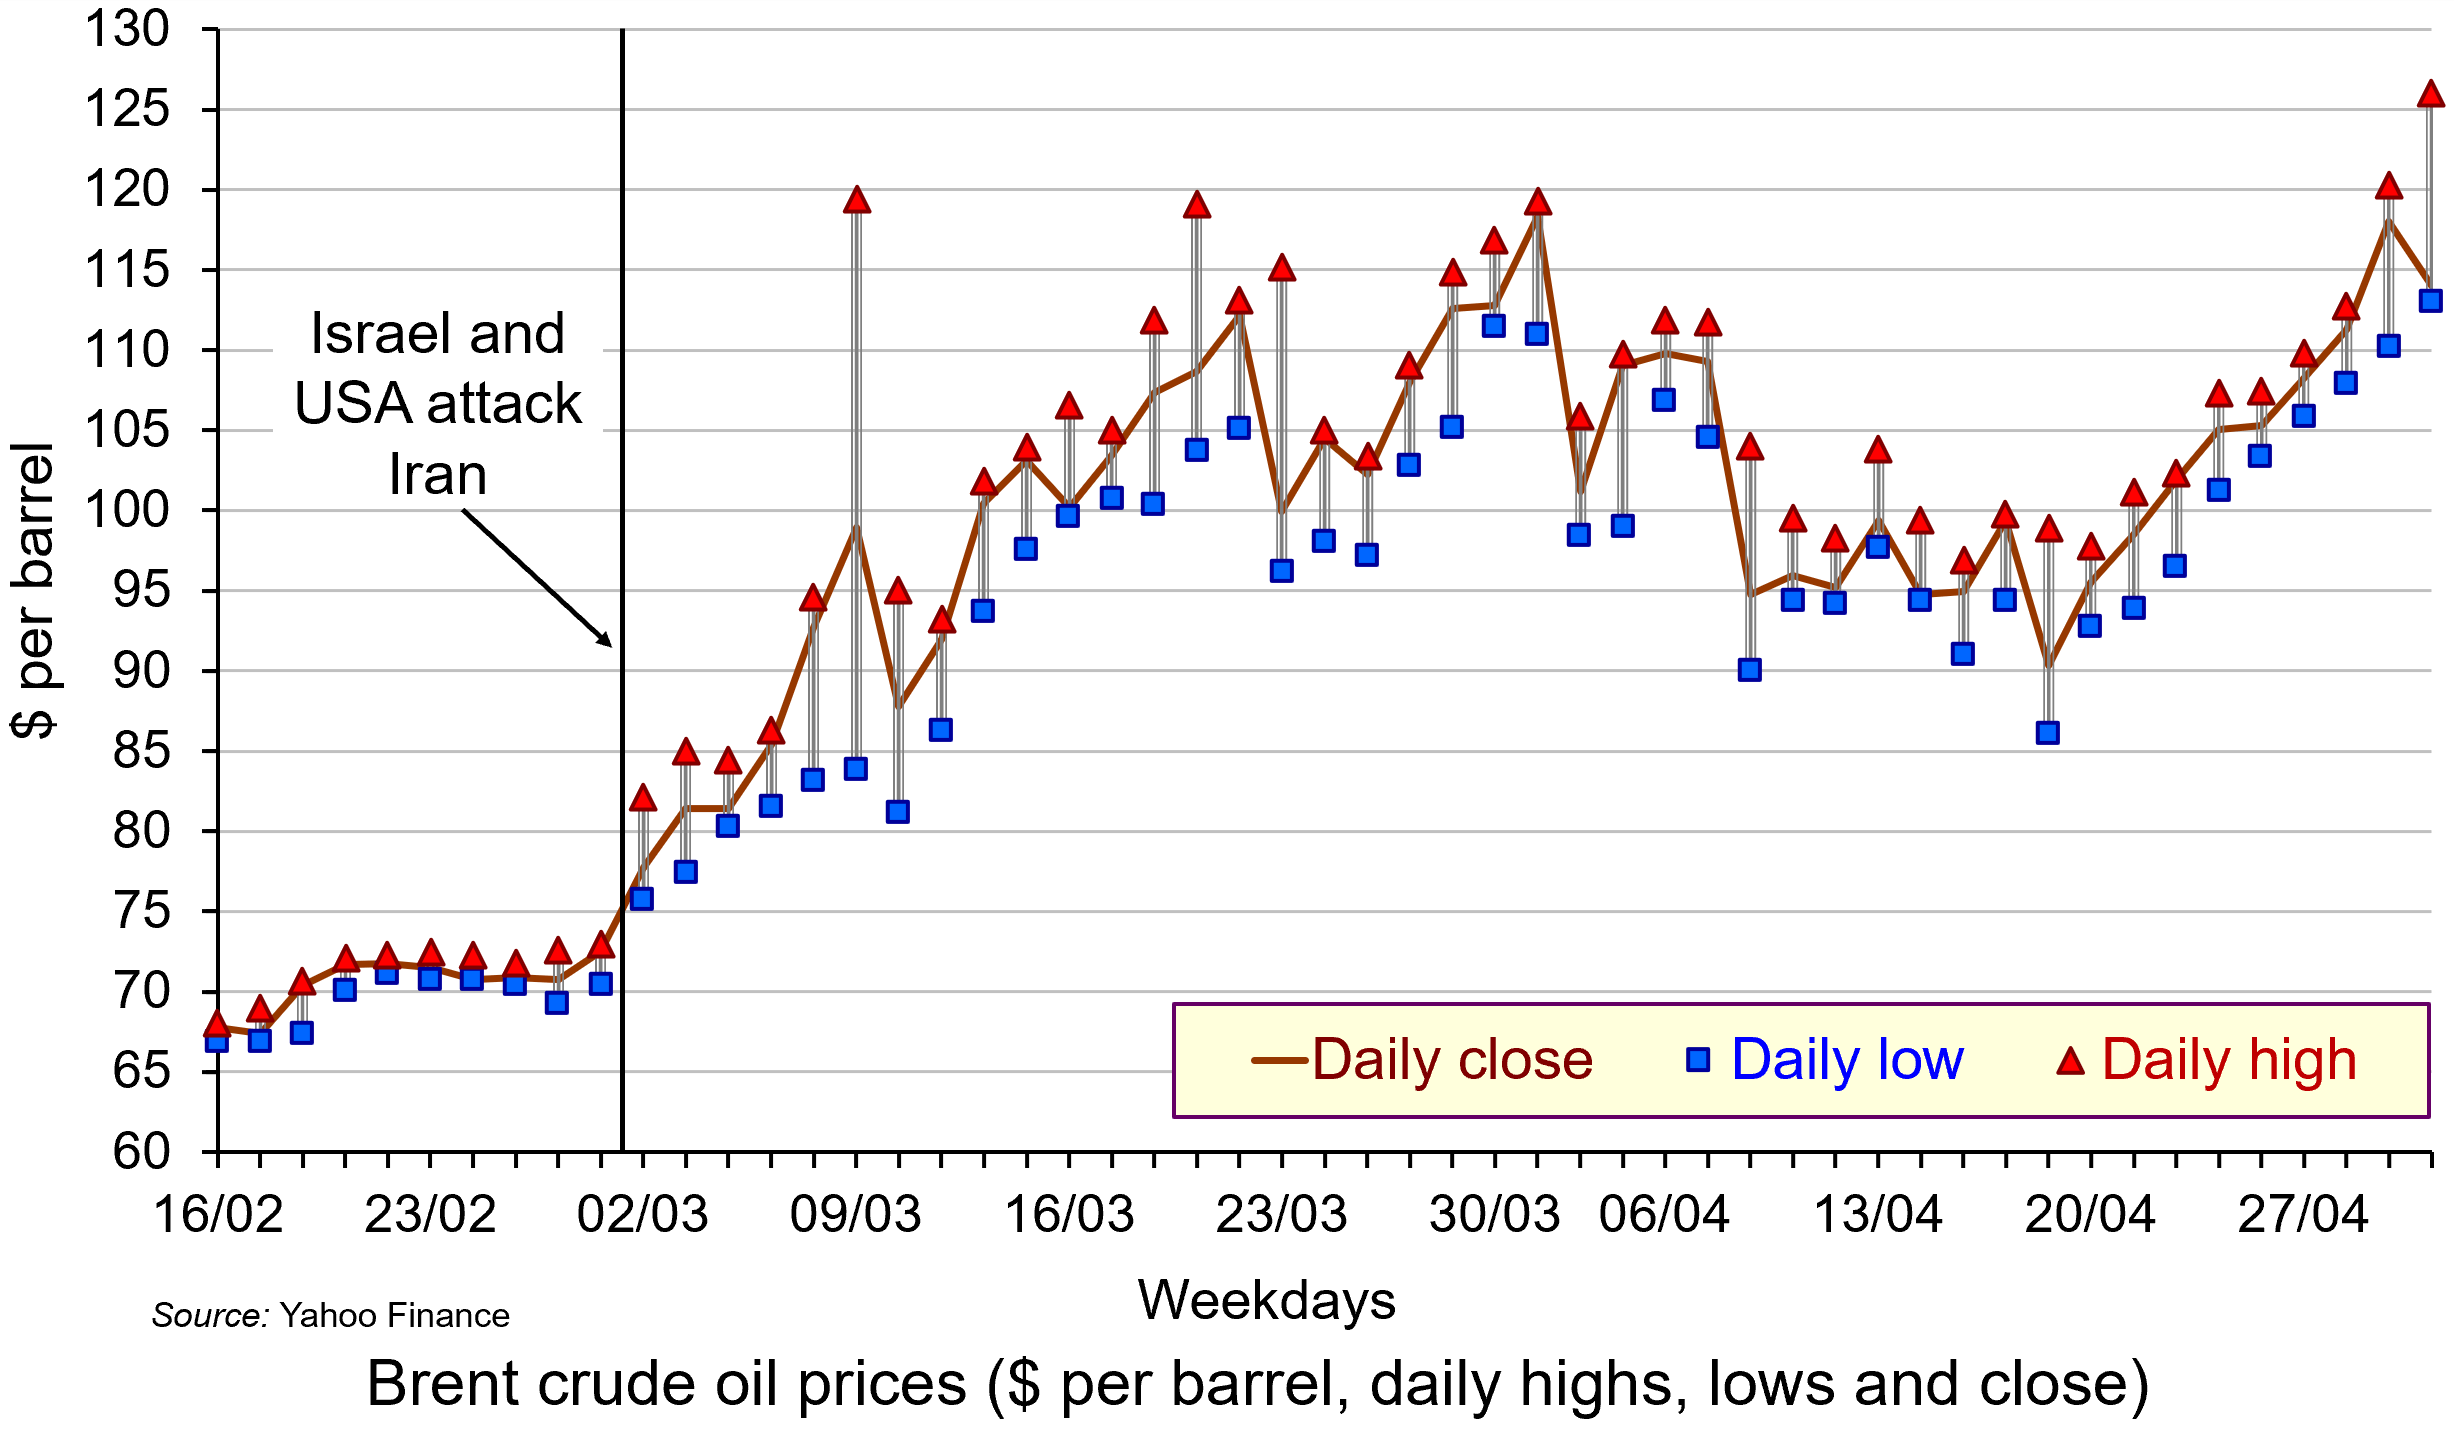
Not only did oil prices rise, but the price became much more volatile as markets reacted to the news on a continuous basis. Intra-day fluctuations in oil prices of several percentage points became typical, reflecting shifting expectations. The second chart shows daily fluctuations, with the highest and lowest prices for each day shown, along with the closing price. (Click here for a PowerPoint.)
The biggest fluctuation had been on 9 March when fears of the closing of the Strait of Hormuz saw the price of Brent crude rising to nearly $120 but falling to around $84 later in the day (a fall of around 30%) after the G7 announcement about releasing reserves.
There was another big fluctuation on 23 March. The previous day (Sunday), President Trump threatened to bomb Iran’s power plants if Iran did not allow free passage of ships through the Strait of Hormuz. Iran threatened to retaliate by striking Gulf countries’ energy and water systems. In early trading on Monday 23rd, Brent crude rose to over $115 per barrel. But later that day, Trump said that there had been constructive talks between the USA and Iran. The oil price immediately dropped to around $96 – a fall of 17% – before settling at around $100.
Rising oil prices will drive up inflation. For those countries with a heavy dependence on Gulf oil, particularly countries in Asia, there could be significant supply problems. For oil exporters in the Persian Gulf, with tankers unable to traverse the Strait of Hormuz, the economic impact is huge. Oil exporters outside the Gulf, such as Russia, Norway and Canada, however, will gain from the higher prices. Clearly the size of these effects will depend on how long the conflict continues and how long the Strait of Hormuz remains closed.
And it is not just oil that is affected. Other products, such as liquified natural gas (LNG), petrochemicals, industrial materials, fertilizers for food production, medicines, helium for microchip production, metals and minerals are transported through the Strait of Hormuz. Gulf countries import much of their food through the Strait. On 18 March, Israel struck Iran’s huge South Pars gas field off the Gulf coast. This is the largest gas field in the world and is a major source of export revenue for Iran. Iran responded by striking the Qatari gas hub in Ras Laffan. Donald Trump responded by threatening to ‘blow up’ the entire Iranian South Pars gas field if Iran made further strikes on Qatar. The effect of this escalation was to drive oil and gas prices up further. By the week ending 20 March, the oil price closed at just over $112 per barrel.
Cuts in supplies of oil and other products represent an adverse supply shock. Such shocks push up prices (cost-push inflation), while adversely affecting aggregate output. This can lead to stagflation – a combination of higher inflation and stagnation or even falling output. Central banks with a simple mandate to keep inflation to a target are likely to raise interest rates, or at least delay in reducing them. In the USA, with a dual mandate of controlling inflation but also maximising employment, the response may be less deflationary, depending on the judgement of the Federal Reserve.
Uncertainty
 There is great uncertainty about how long the conflict will last. There is also a lack of clarity and consistency from the US administration about its war aims. This uncertainty has affected financial markets, which have seen considerable volatility. Stock markets have seen widespread falls, with airline, travel and AI-heavy stocks being particularly vulnerable.
If the war is concluded relatively swiftly, the economic effects could be relatively small. If the war continues, and especially if the Gulf countries are drawn further into the conflict and if the conflict spreads to other countries, the economic effects could be much more substantial. A prolonged conflict could see oil prices remaining above $100 per barrel, potentially increasing global inflation by 1 percentage point or more. This would slow or halt the move by central banks to cut rates and thereby reduce global economic growth – potentially, as we have seen, leading to stagflation.
The uncertainty was reflected in the decision of the Fed to keep interest rates unchanged at its meeting on 17/18 March. The Fed has the twin targets of keeping inflation close to 2% and maximising employment. Fed Chair, Jay Powell, acknowledged the current tension between the two goals: ‘upward risks for inflation and downward risks for employment, and that puts us in a difficult situation’. He also recognised that the future for inflation and the economy was highly uncertain as the war developed. This made interest rate setting difficult.
Then there is the issue of a potential new international refugee crisis. If the economic and political system in Iran deteriorates rapidly, this could trigger a wave of migration to neighbouring countries, such as Turkey, already hosting large numbers of refugees. Many could seek sanctuary further afield in Europe, with several countries already facing a backlash against immigration. The political and economic effects of this on host countries could be significant – but as yet, highly uncertain.
Articles
- Assessing the global economic impact of the Middle East war
ING, Carsten Brzeski, Warren Patterson, James Knightley and Deepali Bhargava (5/3/26)
- How the Hormuz closure could affect food, medicines and smartphones
BBC News Verify, Ben Chu (27/3/26)
- How will the Iran war affect the global economy?
Chatham House, Neil Shearing (6/3/26)
- ‘The stakes are enormous’: how a prolonged Iran war could shock the global economy
The Guardian, Richard Partington (22/3/26)
- Iran war is latest threat to a global economy rattled by Trump
Aljazeera, John Power (7/3/26)
- Why an Iran war inflation shock could wreck global economic recovery
The Guardian, Phillip Inman and Kalyeena Makortoff (8/3/26)
- Why has the Iran war sparked fears of stagflation for the global economy?
The Guardian, Luca Ittimani (9/2/26)
- Why the price of oil matters more than you might think
BBC News, Natalie Sherman and Mitchell Labiak (10/3/26)
- Strait of Hormuz: Factsheet
IEA (February 2026)
- Could this energy crisis be worse for the global economy than COVID?
The Conversation, Adi Imsirovic (26/3/26)
- Faisal Islam: Oil price spiral may be slowed but not stopped by G7 emergency move
BBC News, Faisal Islam (9/3/26)
- What on earth is going on with the oil price?
BBC News, Jemma Crew (12/3/26)
- Asia scrambles to confront energy crisis unleashed by Iran war – with no end in sight
The Guardian, Callum Jones (12/3/26)
- The grim choice facing the Trump administration: Economic or naval collapse?
CNN, Phil Mattingly and Zachary Cohen (9/3/26)
- Israel strikes Iran’s South Pars gasfield hours after forces kill intelligence minister
The Guardian, Lorenzo Tondo and William Christou (18/3/26)
- What Fed Chair Jerome Powell said — and didn’t say — about the oil crisis
Yahoo Finance, Jake Conley (19/3/26)
- What strikes on the world’s largest natural gas sites could do to the global economy
CNN, Hanna Ziady (19/3/26)
- How the Iran Conflict May Fuel a New International Refugee Crisis
Forbes, Andy J Semotiuk (5/3/26)
- Iran’s neighbours brace for fallout as war threatens new refugee crisis
Aljazeera, Abid Hussain (17/3/26)
- Two months into the Iran war, almost everybody is a loser
CNN, Ivana Kottasová (2/5/26)
Data
Report
Questions
- Who are the biggest gainers and losers from disruption to oil supplies from the Persian Gulf?
- Illustrate the effect of the current oil price shock on an aggregate demand and supply diagram (either static or dynamic).
- Why is the Iranian war likely to be less damaging to the European economy than the Ukrainian war has been?
- Why have AI-related stock prices been vulnerable to the uncertainty caused by the Iranian war?
- How have the Bank of England and the Federal Reserve Bank responded to higher oil prices and the broader economic effects of the war? Why might their responses be different in the coming months?
- What is the likely impact of the Iranian war on global economic recovery?
- How might the Iranian war affect global economic alliances?
- How is the current oil price shock likely to affect the eurozone? Will it be different from the oil price shock that followed the Russian invasion of Ukraine?
- What are the likely economic effects of large-scale migration caused by the war?
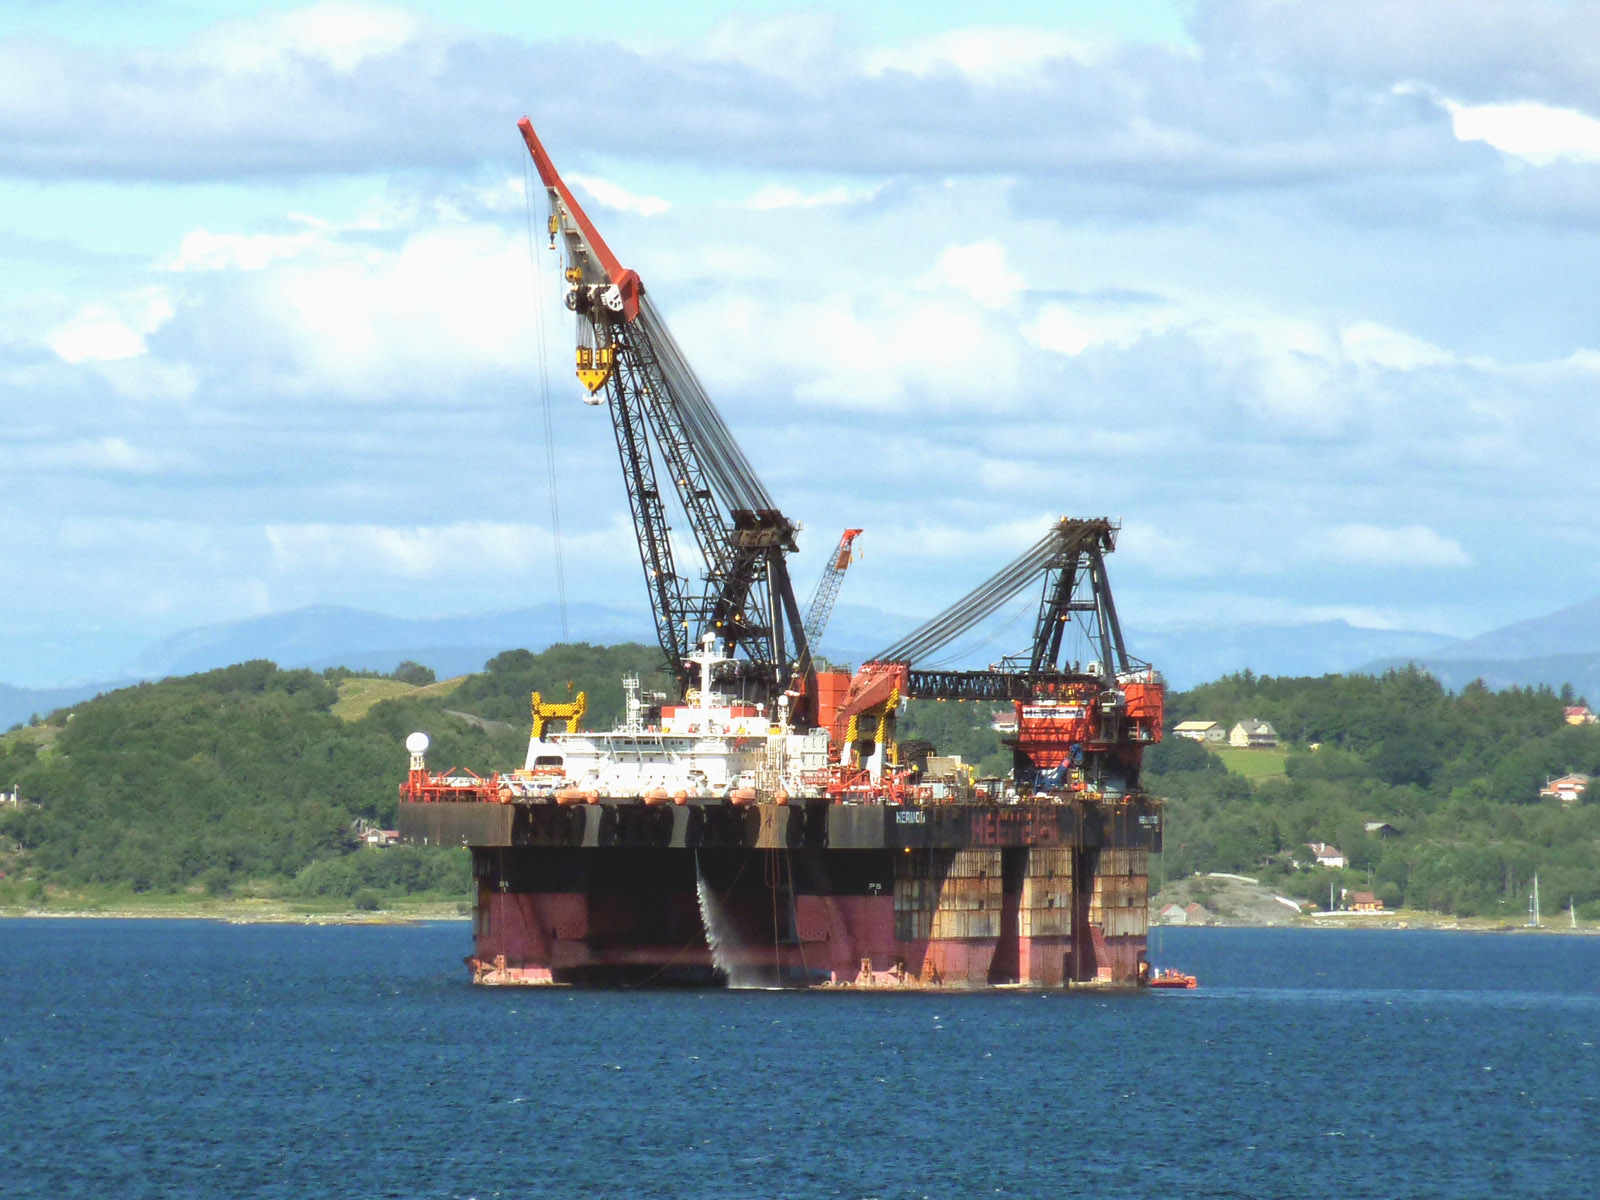 The market for crude oil is usually a volatile one. Indeed, in the last few months, the market has seen prices rise and fall due to various supply and demand influences. Crude oil is coined the ‘King of Commodities’ due to the impact it has on consumers, producers and both the micro and macro economy. The price of crude oil affects everything from the cost of producing plastics, transportation, and food at the supermarket.
This makes the market for crude oil an economic powerhouse which is closely watched by businesses, traders, and governments. To gain a full understanding of the movements in this market, it is important to identify how demand and supply affect the price of crude oil.
What influences the demand and supply of crude oil?
The law of demand and supply states that if demand increases, prices will rise, and if supply increases, prices will fall. This is exactly what happens in the market for crude oil. The consumer side of the market consists of various companies and hundreds of millions of people. The producer side of the market is made up of oil-producing countries. Collectively, both consumers and producers influence the market price.
However, the demand and supply of crude oil, and therefore the price, is also affected by global economic conditions and geopolitical tensions. What happens in the world impacts the price of oil, especially since a large proportion of the world’s biggest oil producers are in politically unstable areas.
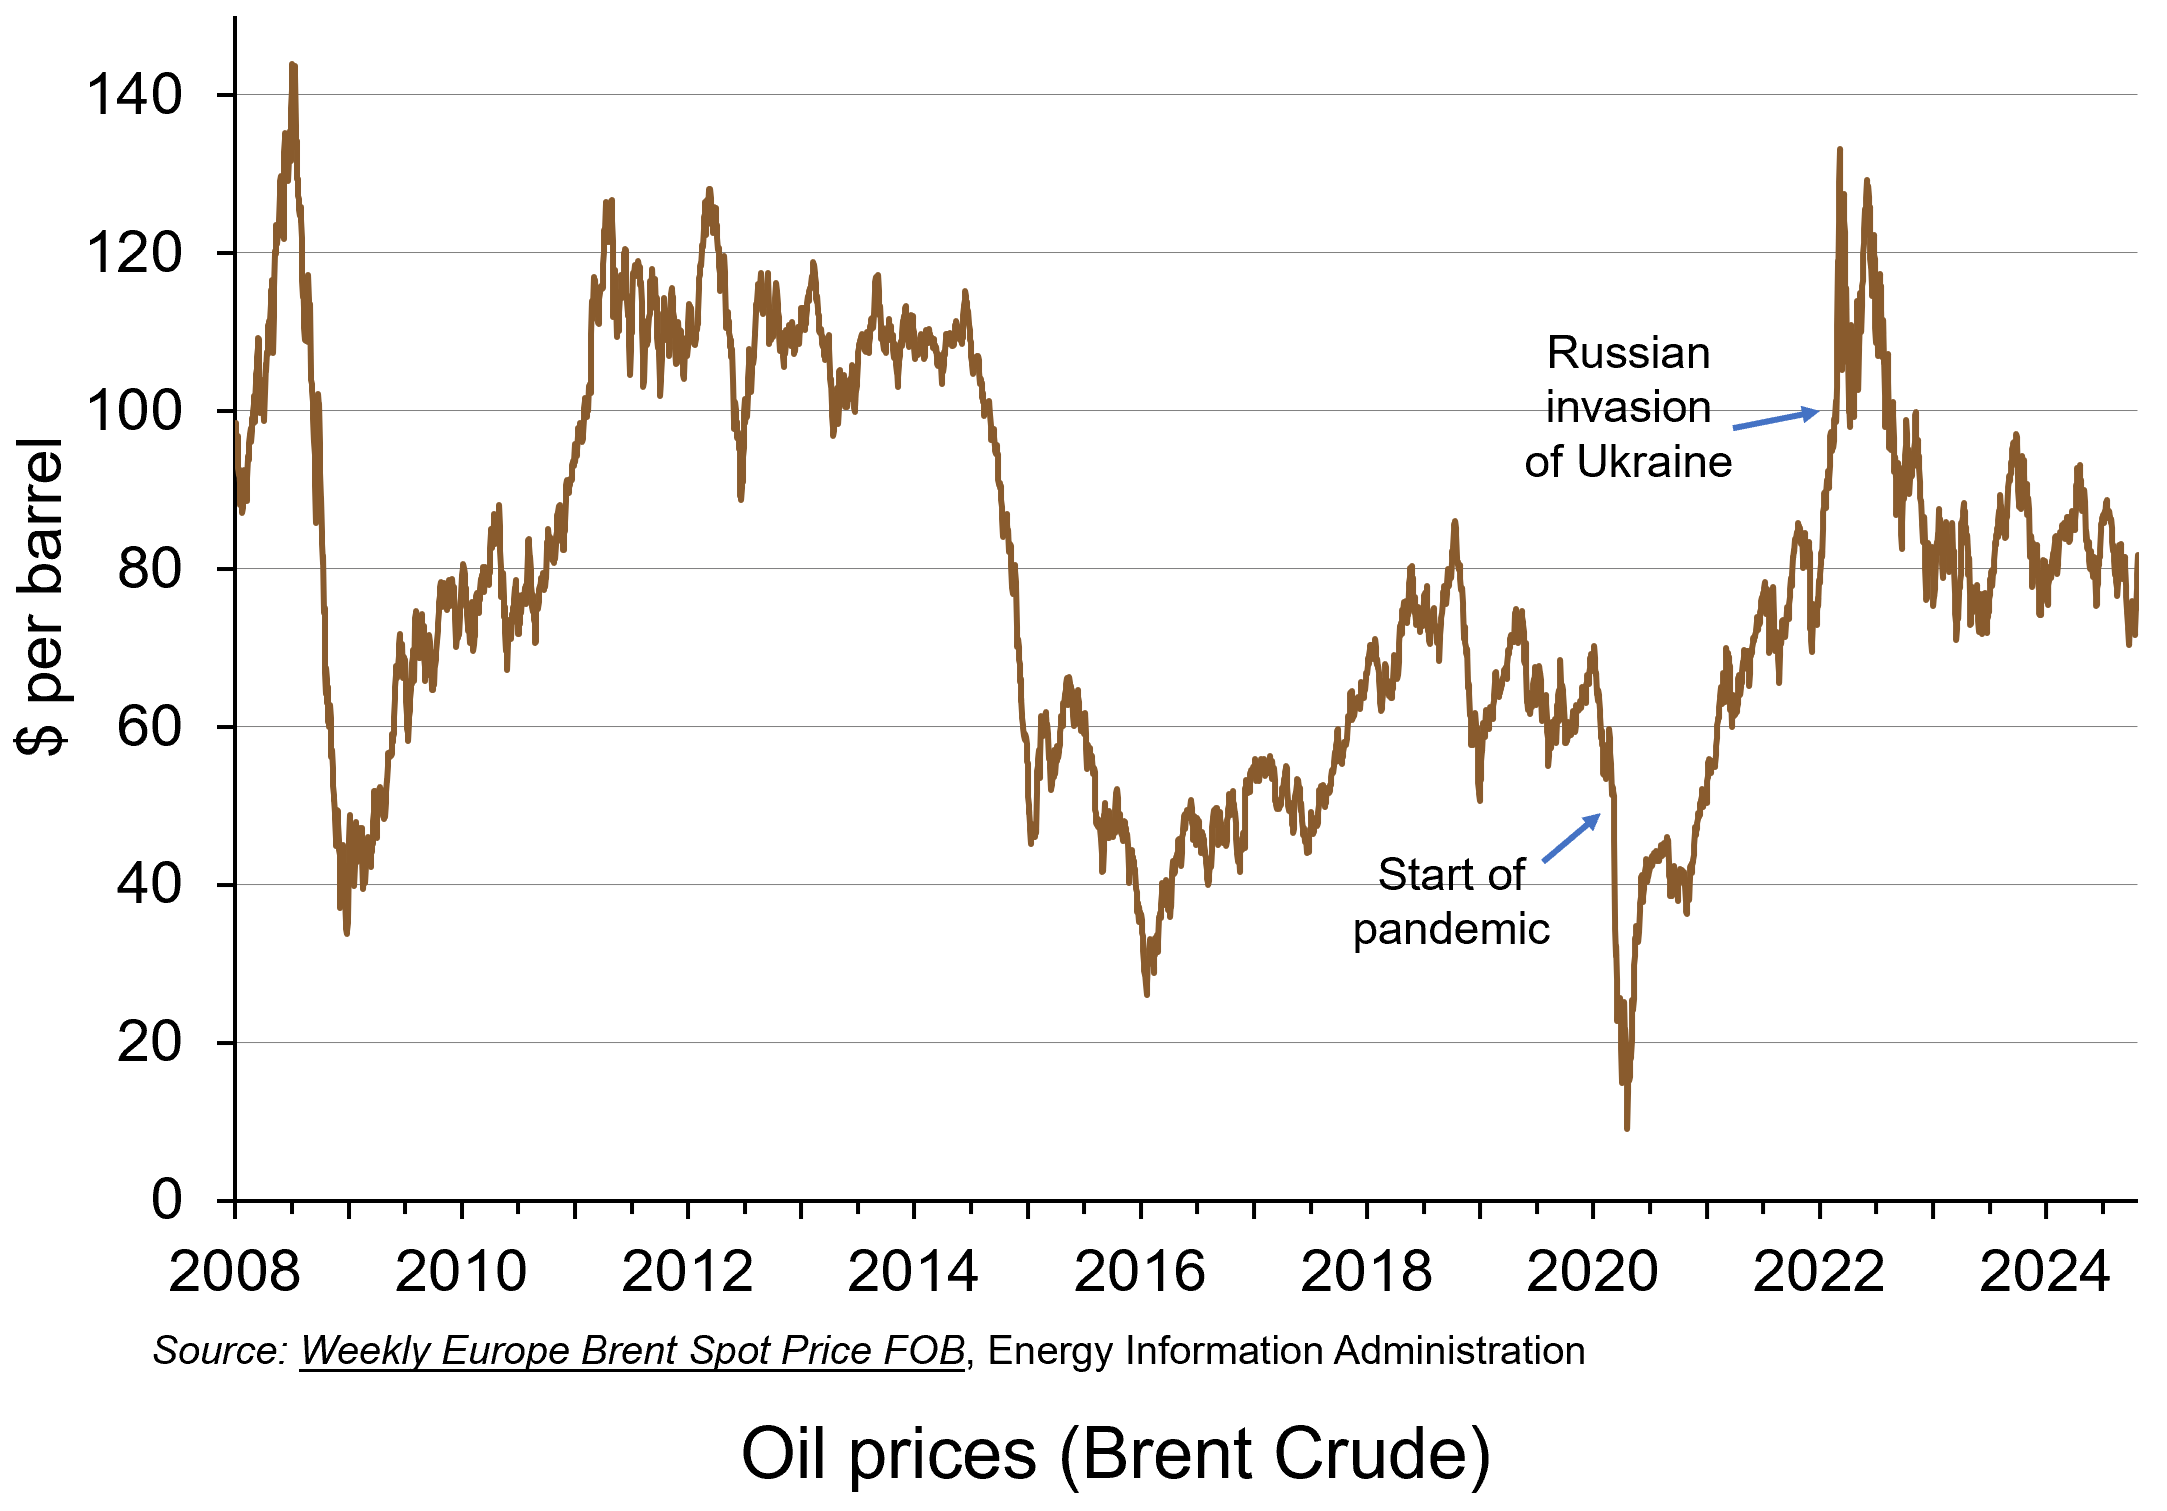 Over the past five years, global events have had a major impact on the price of oil. The economic conditions created by the impact of the COVID pandemic saw prices plummet from around $55 per barrel just before the pandemic in February 2020 to around $15 per barrel in April 2020. By mid-2021 they had recovered to around $75 per barrel. Then, in the aftermath of Russia’s invasion of Ukraine in February 2022, the price surged to reach $133 in June 2022. More recently, geopolitical tensions in the Middle East and concerns about China’s economic outlook have intensified concerns about the future direction of the market. (Click here for a PowerPoint of the chart.)
Geopolitical tensions
In the first week of October 2024, the price of crude oil rose by almost 10% to around $78 per barrel as the conflict in the Middle East intensified. It unfortunately comes at a time when many countries are starting to recover from the rise in oil prices caused by the pandemic and the war in Ukraine. Any increase in prices will affect the price that consumers pay to fill up their vehicles with fuel, just when prices of diesel and petrol had reached their lowest level for three years.
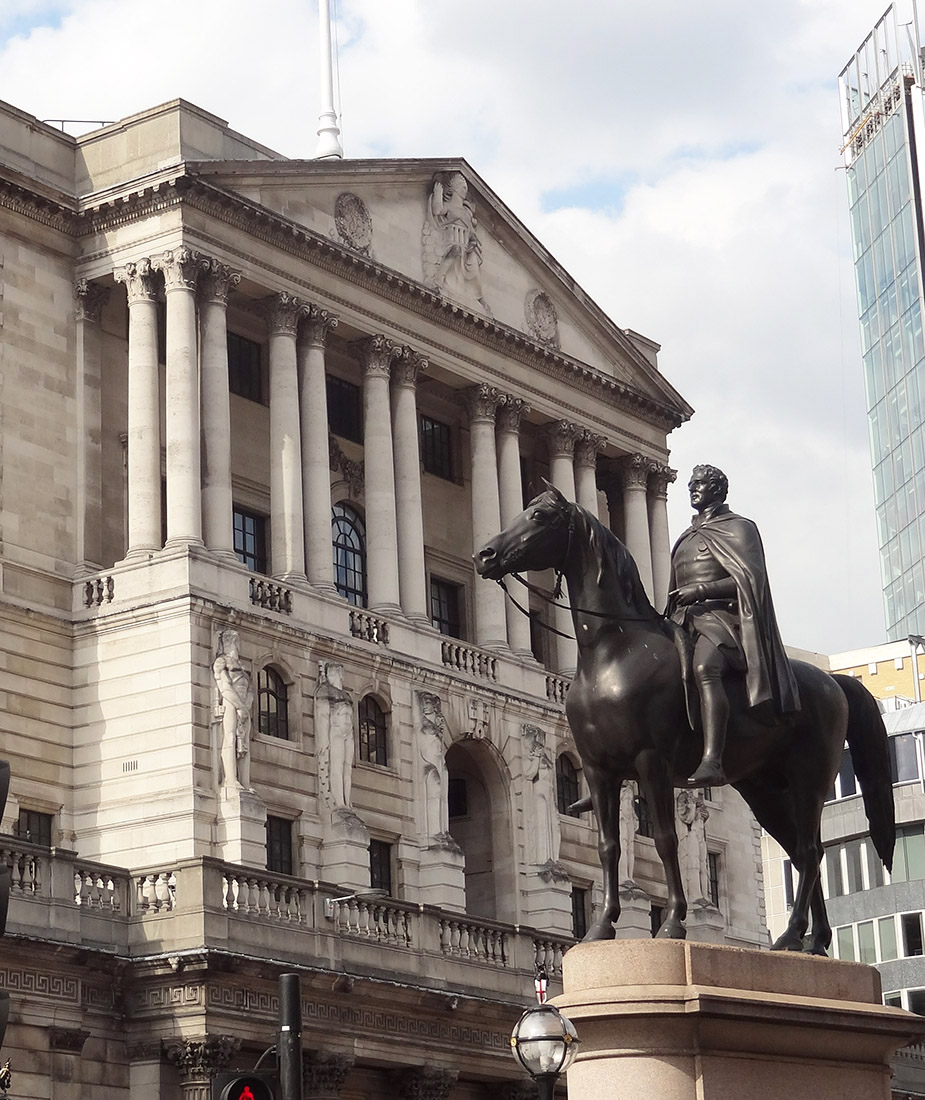 The Governor of the Bank of England, Andrew Bailey, has said that the Bank is monitoring developments in the Middle East ‘extremely closely’, as the conflict has the potential to have serious impacts in the UK. The Bank of England will therefore be watching for any movement in oil prices that could fuel inflation.
The main concerns stem from further escalation in the conflict between Israel and the Iran-backed armed group, Hezbollah, in Lebanon. If Israel decides to attack Iran’s oil sector, this is likely to cause a sharp rise in the price of oil. Iran is the world’s seventh largest oil exporter and exports over half of its production to China. If the oilfields of a medium-sized supplier, like Iran, were attacked, this could threaten general inflation in the UK, which could in turn influence any decision by the Bank of England to lower interest rates next month.
Supply deficits
This week (2nd week of October 2024) saw the price of crude oil surge above $81 per barrel to hit its highest level since August. This rise means that prices increased by 12% in a week. However, this surge in price also means that prices rose by almost 21% between the start September and the start of October alone. Yet it was only in early September when crude oil hit a year-to-date low, highlighting the volatility in the market.
As the Middle-East war enters a new and more energy-related phase, the loss of Iranian oil would leave the market in a supply deficit. The law of supply implies that such a deficit would lead to an increase in prices. This also comes at a time when the US Strategic Petroleum Reserve has also been depleted, causing further concerns about global oil supply.
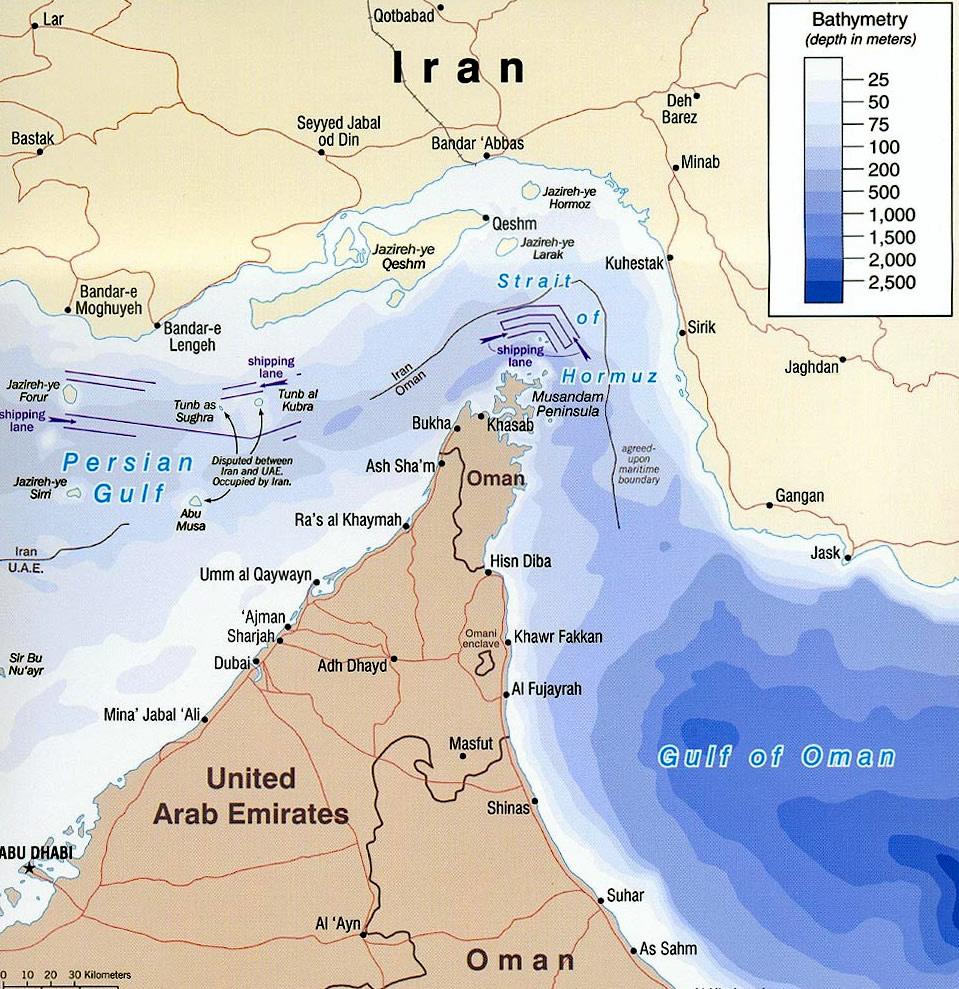 However, the biggest and most significant impact would be a disruption to flows through the Strait of Hormuz. This is a relatively narrow channel at the east end of the Persian Gulf through which a huge amount of oil tanker traffic passes – about a third of total seaborne-traded oil. It is therefore known as the world’s most important oil transit chokepoint. The risk that escalation could block the Strait of Hormuz could technically see a halt in about a fifth of the world’s oil supply. This would include exports from big Gulf producers, including Saudi Arabia, UAE, Kuwait and Iraq. In a worst-case scenario of a full closure of the Strait, a barrel of oil could very quickly rise to well above $100.
Disruption to shipments would also lead to higher gas prices and therefore lead to a rise in household gas and electricity bills. As with oil, gas prices filter down supply chains, affecting the cost of virtually all goods, resulting in a further rise in the cost of living. With energy bills in the UK having already risen by 10% for this winter, an escalation to the conflict could see prices rise further still.
China’s economic outlook

Despite the concern for the future supply of oil, there is also a need to consider how the demand for oil could impact price changes in the market. The price of oil declined on 14 October 2024 in light of concerns over China’s struggling economy. As China is the world’s largest importer of crude oil, there are emerging fears about the potential limits on fuel demand. This fall in price reversed increases made the previous week as investors become concerned about worsening deflationary pressures in China.
Any reduced demand from China could indicate an oversupply of crude oil and therefore potential price declines. Official data from China reveal a sharp year-on-year drop in the producer price index of 2.8% – the fastest decline in six months. These disappointing results have stirred uncertainty about the Chinese government’s economic stimulus plans. Prices could fall further if there are continuing doubts about the government’s ability to implement effective fiscal measures to promote consumer spending and, in turn, economic growth.
As a result of the 2% price fall in oil prices on 14 October, OPEC (the Organization of the Petroleum Exporting Countries) has lowered its 2024 and 2025 global oil demand growth. This negative news outweighed market concerns over the possibility that an Israeli response to Iran’s missile attack could disrupt oil production.
What is the future for oil prices?
 It is expected that the market for oil will remain a volatile one. Indeed, the current uncertainties around the globe only highlight this. It is never a simple task to predict what will happen in a market that is influenced by so many global factors, and the current global landscape only adds to the complexity.
There’s a wide spectrum of predictions about what could come next in the market for crude oil. Given the changes in the first two weeks of October alone, supply and demand factors from separate parts of the globe have made the future of oil prices particularly uncertain. Callum Macpherson, head of commodities at Investec, stated in early October that ‘there is really no way of telling where we will be this time next week’ (see the first BBC News article linked below).
Despite the predominately negative outlook, this is all based on potential scenarios. Caroline Bain, chief commodities economist at Capital Economics suggests that if the ‘worst-case scenario’ of further escalation in the Middle East conflict does not materialise, oil prices are likely to ‘ease back quite quickly’. Even if Iran’s supplies were disrupted, China could turn to Russia for its oil. Bain says that there is ‘more than enough capacity’ globally to cover the gap if Iranian production is lost. However, this does then raise the question of where the loyalty of Saudi Arabia, the world’s second largest oil producer, lies and whether it will increase or restrict further production.
What is certain is that the market for crude oil will continue to be a market that is closely observed. It doesn’t take much change in global activity for prices to move. Therefore, in the current political and macroeconomic environment, the coming weeks and months will be critical in determining oil prices and, in turn, their economic effects.
Articles
- How worried should I be about rising oil prices?
BBC News, Michael Race (4/10/24)
- Interest rates could fall more quickly, hints Bank
BBC News, Dearbail Jordan (3/10/24)
- Oil Prices Eye $100 A Barrel As War Risk Premium Returns
FX Empire, Phil Carr (8/10/24)
- Crude oil futures reverse previous gains following disappointing economic data from China
London Loves Business, Hamza Zraimek (14/10/24)
- Oil falls 2% as OPEC cuts oil demand growth view, China concerns
Reuters, Arathy Somasekhar (14/10/24)
- Could war in the Gulf push oil to $100 a barrel?
The Economist (7/10/24)
- The Commodities Feed: Oil remains volatile
ING Think, Ewa Manthey and Warren Patterson (8/10/24)
- Who and what is driving oil price volatility
FT Alphaville, George Steer (9/10/24)
- Brent crude surges above $80 as conflict and storm spark supply fears
Financial Times, Rafe Uddin and Jamie Smyth (7/10/24)
Questions
- Use a demand and supply diagram to illustrate what has happened to oil prices in the main two scenarios:
(a) Conflict in the Middle East;
(b) Concerns about China’s economic performance.
- How are the price elasticities of demand and supply relevant to the size of any oil price change?
- What policy options do the governments have to deal with the potential of increasing energy prices?
- What are oil futures? What determines oil future prices?
- How does speculation affect oil prices?
 We have examined inflation in several blogs in recent months. With inflation at levels not seen for 40 years, this is hardly surprising. One question we’ve examined is whether the policy response has been correct. For example, in July, we asked whether the Bank of England had raised interest rates too much, too late. In judging policy, one useful distinction is between demand-pull inflation and cost-push inflation. Do they require the same policy response? Is raising interest rates to get inflation down to the target rate equally applicable to inflation caused by excessive demand and inflation caused by rising costs, where those rising costs are not caused by rising demand?
In terms of aggregate demand and supply, demand-pull inflation is shown by continuing rightward shifts in aggregate demand (AD); cost-push inflation is shown by continuing leftward/upward shifts in short-run aggregate supply (SRAS). This is illustrated in the following diagram, which shows a single shift in aggregate demand or short-run aggregate supply. For inflation to continue, rather than being a single rise in prices, the curves must continue to shift.
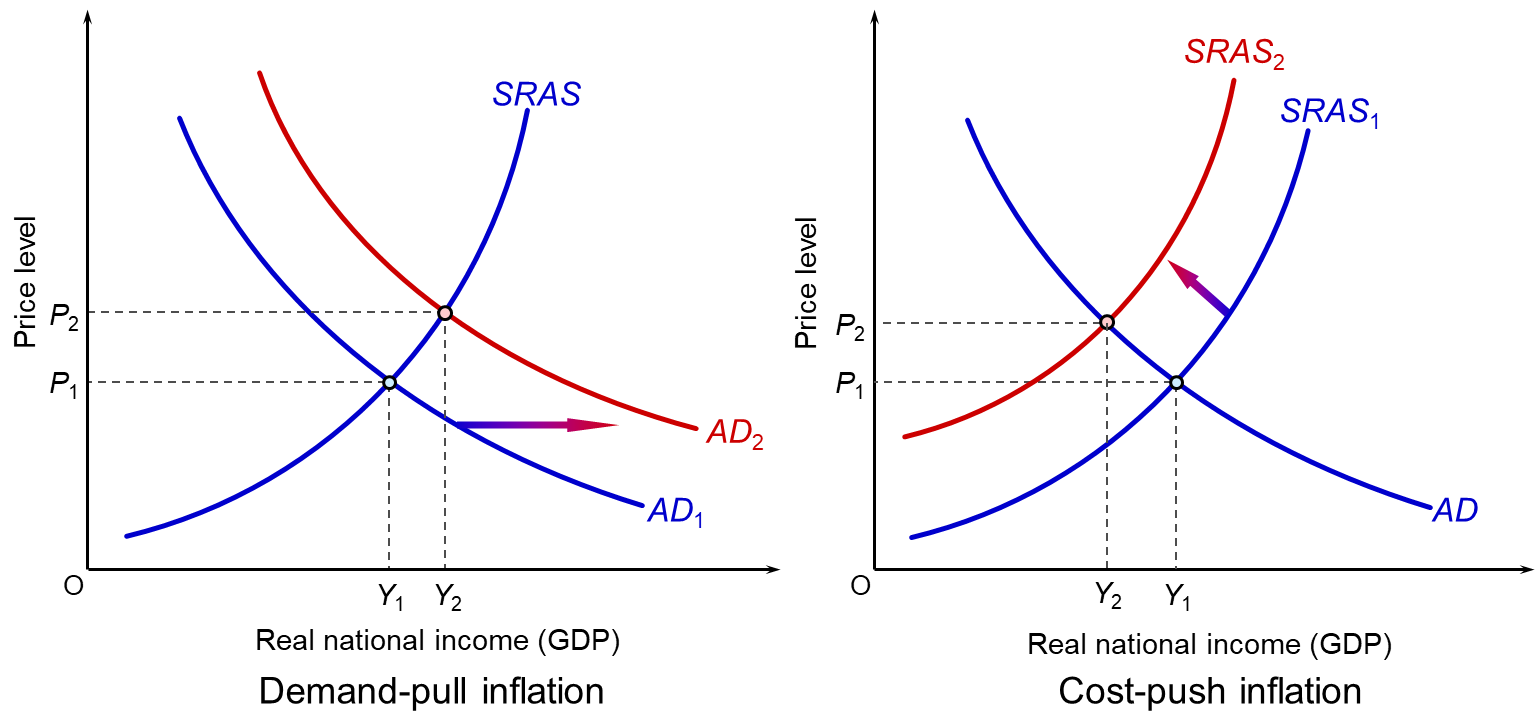
As you can see, the effects on real GDP (Y) are quite different. A rise in aggregate demand will tend to increase GDP (as long as capacity constraints allow). A rise in costs, and hence an upward shift in short-run aggregate supply, will lead to a fall in GDP as firms cut output in the face of rising costs and as consumers consume less as the cost of living rises.
The inflation experienced by the UK and other countries in recent months has been largely of the cost-push variety. Causes include: supply-chain bottlenecks as economies opened up after COVID-19; the war in Ukraine and its effects on oil and gas supplies and various grains; and avian flu and poor harvests from droughts and floods associated with global warming resulting in a fall in food supplies. These all led to a rise in prices. In the UK’s case, this was compounded by Brexit, which added to firms’ administrative costs and, according to the Bank of England, was estimated to cause a long-term fall in productivity of around 3 to 4 per cent.
The rise in costs had the effect of shifting short-run aggregate supply upwards to the left. As well as leading to a rise in prices and a cost-of-living squeeze, the rising costs dampened expenditure.
This was compounded by a tightening of fiscal policy as governments attempted to tackle public-sector deficits and debt, which had soared with the support measures during the pandemic. It was also compounded by rising interest rates as central banks attempted to bring inflation back to target.
Monetary policy response
 Central banks are generally charged with keeping inflation in the medium term at a target rate set by the government or the central bank itself. For most developed countries, this is 2% (see table in the blog, Should central bank targets be changed?). So is raising interest rates the correct policy response to cost-push inflation?
One argument is that monetary policy is inappropriate in the face of supply shocks. The supply shocks themselves have the effect of dampening demand. Raising interest rates will compound this effect, resulting in lower growth or even a recession. If the supply shocks are temporary, such as supply-chain disruptions caused by lockdowns during the pandemic, then it might be better to ride out the problem and not raise interest rates or raise them by only a small amount. Already cost pressures are easing in some areas as supplies have risen.
If, however, the fall in aggregate supply is more persistent, such as from climate-related declines in harvests or the Ukraine war dragging on, or new disruptions to supply associated with the Israel–Gaza war, or, in the UK’s case, with Brexit, then real aggregate demand may need to be reduced in order to match the lower aggregate supply. Or, at the very least, the growth in aggregate demand may need to be slowed to match the slower growth in aggregate supply.
Huw Pill, the Chief Economist at the Bank of England, in a podcast from the Columbia Law School (see links below), argued that people should recognise that the rise in costs has made them poorer. If they respond to the rising costs by seeking higher wages, or in the case of businesses, by putting up prices, this will simply stoke inflation. In these circumstances, raising interest rates to cool aggregate demand may reduce people’s ability to gain higher wages or put up prices.
Another argument for raising interest rates in the face of cost-push inflation is when those cost increases are felt more than in other countries. The USA has suffered less from cost pressures than the UK. On the other hand, its growth rate is higher, suggesting that its inflation, albeit lower than in the UK, is more of the demand-pull variety. Despite its inflation rate being lower than in the UK, the problem of excess demand has led the Fed to adopt an aggressive interest rate policy. Its target rate is 5.25% to 5.50%, while the Bank of England’s is 5.25%. In order to prevent short-term capital outflows and a resulting depreciation in the pound, further stoking inflation, the Bank of England has been under pressure to mirror interest rate rises in the USA, the eurozone and elsewhere.
Articles
Blogs on this site
Information and data
Questions
- How may monetary policy affect inflationary expectations?
- If cost-push inflation makes people generally poorer, what role does the government have in making the distribution of a cut in real income a fair one?
- In the context of cost-push inflation, how might the authorities prevent a wage–price spiral?
- With reference to the second article above, explain the ‘monetary policy conundrum’ faced by the Bank of Japan.
- If central banks have a single policy instrument, namely changes in interest rates, how may conflicts arise when there is more than one macroeconomic objective?
- Is Russia’s rise in inflation the result of cost or demand pressures, or a mixture of the two (see articles above)?
 How is Iran war affecting petrol and diesel prices in UK?