
Inflation has been rising around the world. The main reason has been the supply shock of rising oil, fertiliser and commodity prices caused by the Iran war and the disruption to global supply chains from conflicts in the Middle East and Russia (see the blog, Why have diesel prices risen more than petrol prices?). Central banks, including the US Federal Reserve Bank, the European Central Bank and the Bank of Japan, have responded to this cost-push inflationary shock by raising interest rates. The Bank of England is likely to raise Bank rate at its next meeting on 5 November 2026.
Similar supply shocks have been experienced in recent years (see the May 2026 blog, Supply shocks – long-term gain from the short-term pain?).
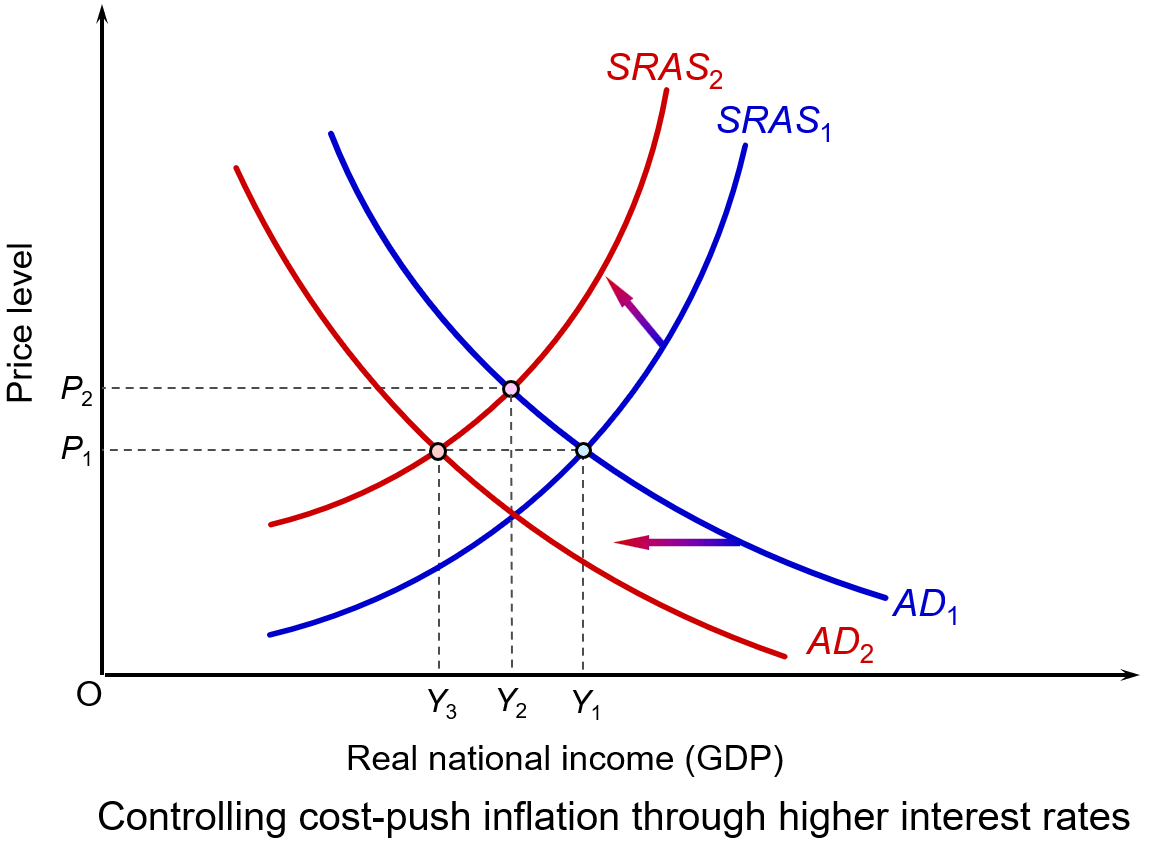 Raising interest rates reduces aggregate demand, or at least its rate of growth. This puts downward pressure on prices, or at least on the rate of inflation. This can be illustrated in the diagram. (Click here for a PowerPoint.)
It shows a country’s initial short-run aggregate supply curve (SRAS1) and initial aggregate demand curve (AD1). The price index is P1 and real GDP is Y1.
The higher costs shift the SRAS curve upwards to the left, say to SRAS2. The price index rises to P2 and real GDP falls to Y2. If, in response to the higher prices, the central bank raises the interest rate, this shifts the aggregate demand curve to the left, say to AD2. As a result, the price index falls back to P1, but the fall in demand causes real GDP to fall further, to Y3.
Policy alternatives
 So, is a rise in interest rates the appropriate response to higher costs that push inflation above, or further above, its target, which for most countries is 2%?
If the cause of inflation was excessive increases in aggregate demand from, say, large government budget deficits or a large increase in consumer demand, then a rise in interest rates would have helped reduce this unsustainable rise in demand. But if the cause of the inflation is a supply shock, is curbing aggregate demand the correct solution?
Ideally, the solution would be to tackle the cost increases directly. A rise in productivity, for example, would help to increase aggregate supply and counter the effect of rising commodity prices. But productivity increases take place over the longer term and are not a solution to a short-term supply shock. Better still, if the increase in commodity prices could be reversed, by finding a political solution that reopened the Strait of Hormuz and other choke points, then higher interest rates would not be needed.
Alternatively, some countries might be able to resort to price controls. These could be targeted at specific sectors such as energy, rent or construction. For example, the UK government has used energy price caps to limit household energy bills.
But even though this may control inflation in the short term, price controls create shortages because demand exceeds the reduced supply. This could lead to higher prices in unofficial markets as people sought to avoid the price controls. It could also create considerable problems for firms planning their logistics when supplies may simply not be available.
Alternatively, subsidies could be used to support output or prices in similar areas. Or they could be targeted at low-income households. These, however, could be costly for governments and may distort markets.
If price controls and subsidies are rejected, and in the absence of short-term increases in aggregate supply, the only solution to inflation is curbing aggregate demand to match the reduced aggregate supply. This could be achieved through fiscal policy by raising taxes or reducing government expenditure, but would prove unpopular and would probably be rejected by governments. Generally, they would prefer to pass the burden to central banks through the use of monetary policy.
The blunt instrument of monetary policy
But, raising interest rates is, indeed, a blunt instrument. Tighter monetary policy cannot increase the global supply of fuel, fix broken supply chains or lower insurance and construction costs. In other words, it cannot directly fix supply shocks, only limit their effect on prices.
 Also, by making borrowing more expensive, higher interest rates may suppress business investment and house building. This adverse supply-side effect may worsen inflation over the longer term.
The hope is that such effects will be avoided by suppressing inflation and helping thereby to maintain business confidence. It is a delicate balancing act for central bankers, who want to constrain inflation but do not want to plunge their economies into recession and damage longer-term increases in potential real GDP.
Most of all, the hope is that by suppressing nominal demand, second-round effects will be avoided. These are where higher prices encourage workers to demand higher wages to compensate for higher prices and businesses to raise prices to cover those wage increases, knowing that they can pass these price increases on to consumers as their competitors are doing the same. This risks creating a damaging wage-price spiral and embedding inflation. By raising interest rates and signalling that they will bring inflation back down to the target rate, central banks hope to anchor long-term inflation expectations. They hope that this will ensure that temporary price shocks do not become permanently embedded in the economy.
Distributional consequences
 However, the burden of higher interest rates will not be shouldered equally. They predominantly penalise a minority of the population, especially younger households with consumer debt and/or large variable-rate mortgages relative to their income or fixed rate mortgages coming the end of their term and requiring renewing. They also penalise businesses which rely on short-term debt.
Meanwhile, people who own their homes outright or wealthy savers may be largely unaffected or even benefit from higher yields on their savings deposits. Similarly, firms with low debt may hardly be affected.
Consequences for servicing public debt
Higher interest rates increase governments’ debt-servicing costs. More has to be paid on new borrowing, either to finance budget deficits or to replace government bonds and bills that are maturing. This consumes a larger share of public spending and limits the fiscal room to support vulnerable households suffering from the price and interest increases.
We examined such costs in the US context in the blog US national debt reaches $40 trillion: but does it matter?.
Fingers crossed!
By being cautious about raising interest rates, central banks hope that geopolitical developments will be favourable and that the supply constraints will diminish. For example, the hope is that there will be a settlement between the USA and Iran that allows oil to flow once more through the Strait of Hormuz. That is why, despite inflation being well above target, central banks have been raising interest rates by just a quarter of a percentage point.
Articles
- US interest rates raised for first time in three years
BBC News, Michael Race (17/9/26)
- What the Fed interest rate hike likely means for borrowers and savers
NBC4 New York, Paul Wiseman (16/9/26)
- How increasing interest rates could reduce inflation, but potentially cause a recession
CNBC, Trina Paul (21/9/26)
- Interest rates held but Bank signals rise if energy prices stay high
BBC News, Dearbail Jordan and Kevin Peachey (17/9/26)
- Bank of England defies Fed’s rate-hike lead, leaving rates unchanged
CNBC, Chloe Taylor (17/9/26)
- ECB hikes rates to 2.5% as energy shock pushes eurozone inflation higher
Euronews, Quirino Mealha (10/9/26)
- Japan raises interest rates to 31-year high to curb impact of rising prices
The Guardian, Mark Sweney (18/9/26)
- What exactly is inflation, and are interest rates the only option for dealing with it?
The Conversation, Luke Hartigan (10/2/26)
- US consumers and businesses are now facing a future of more expensive borrowing
The Conversation, John W Diamond (16/9/26)
- Inflation: raising interest rates was never the right medicine – here’s why central bankers did it anyway
The Conversation, Robert Gausden (20/10/23)
- There are three main reasons inflation is rising. Higher rates won’t fix them
ABC (Australia), Michael Janda (15/9/26)
- Higher interest rates are meant to lower inflation. US economist John Cochrane says there’s only ‘shaky’ evidence it works
ABC (Australia), Michael Janda and Alicia Barry(15/3/24)
- How Governments Fight Inflation with Monetary Policies
Investopedia, Leslie Kramer (11/3/26)
- Interest rates are not the tool to solve the inflation caused by the US’s war with Iran
The Guardian, Josh Ryan-Collins (18/3/26)
- Are higher interest rates the only tool for managing inflation?
Rethinking Economics, Tim Thornton (3/8/23)
Videos
Information
Questions
- What policies have central banks pursued during the Iran war?
- Paint an optimistic scenario for the global economy five years hence.
- Paint a pessimistic scenario for the global economy five years hence.
- Compare the reasons given by the Federal Reserve and ECB for raising interest rates with those given by the Bank of England for not raising them.
- Donald Trump argues for cutting interest rates as a stimulus to the US economy. Provide a critique of this policy.
From the start of the American and Israeli war with Iran on 28 February 2026 to 30 September – a period of just seven months – the retail price of petrol in the UK has risen by approximately 43p, from around 132p to 175p per litre – a rise of 33%. In contrast, the price of diesel has risen by approximately 59p, from around 142p to 201p per litre – a rise of 42%.
In several other countries the percentage difference is greater still, particularly in countries where fuel taxes are lower and thus the wholesale cost of the fuel is a larger percentage of the pump price. In the USA, for example, petrol (gasoline) prices have risen by around 38%, whereas diesel prices have risen by around 73%.
But why have diesel prices risen by more than petrol prices? The answer has to do with supply and demand.
Supply
 Greater effect of the Iran war on diesel supplies. The closing of the Strait of Hormuz has drastically cut the supply of oil from the Gulf states. This is being compounded by the Houthi attacks on Saudi shipping in the Red Sea. This has forced Saudi oil that is transported by pipeline to the Red Sea and destined for countries east of Saudi Arabia to be transported north via the Suez canal rather than south through the Bab al-Mandab Strait. This has been made worse by attacks launched from Iraq on the Saudi oil pipeline.
Middle Eastern crude oil’s composition is the most efficient for refining high-quality diesel. The restriction on exports, both of crude oil and of diesel from Gulf refineries, has thus affected diesel supplies more than petrol supplies.
Effect of Ukraine war. Ukraine has been launching drone attacks on Russian refineries, mainly producing diesel. The resulting shortage of diesel within Russia has led it to impose a ban on diesel exports, extended at least to the end of 2026, to limit the effects on supplies for the military and for domestic users. Russia has historically been the world’s second-largest diesel exporter and the ban has reduced the world’s supply of seaborne diesel by around 12%.
Low diesel stocks. Stocks of diesel have been run down and this has meant that there is little flexibility to draw them down further.
 Refinery constraints. Refineries cannot instantly alter their output to produce more diesel. Furthermore, diesel has become more expensive to produce in recent years due to the transition to ultra-low sulphur diesel to meet stricter environmental standards. This makes the supply of diesel relatively price inelastic, exaggerating the effect on price.
UK refineries produce more petrol than the domestic market requires, making the UK a net exporter of petrol. This higher self-sufficiency partially shields domestic petrol prices from global shocks. However, the UK does not refine enough diesel to meet domestic demand. It relies heavily on foreign imports to cover the shortfall. Thus diesel prices in the UK are more subject to global price increases.
Demand
Seasonal demand spikes. The demand for diesel tends to rise in late summer due to extra agricultural demand for autumn crop harvests.
 Low price elasticity of demand. Unlike petrol, which is primarily consumed by individuals who can choose to drive less when prices rise, diesel is essential to industrial economies. It powers lorries, ships, buses, trains, agricultural machinery, mining equipment and many industrial machines. Because businesses must keep moving goods, farming crops and running machines, global demand for diesel is little affected by rising prices. This low price elasticity of demand results in a bigger price rise for every reduction in supply than is the case for petrol.
What is more, the transition to EVs has been greater for cars than for lorries, although many buses and vans are now electric. The electrification of the railways, however, is too long-term a project to affect short-term diesel prices and electric lorries are still in their infancy. But with rapid development of electric alternatives underway in the haulage and industrial machinery sectors, they may become less reliant on diesel in the relatively near future.
Articles
- Petrol and diesel prices hit highest since 2022
BBC News (14/9/26)
- Diesel prices hit new record in September 2026: What that means for inflation, shipping costs and your portfolio
J.P.Morgan, Sergei Klebnikov (15/9/26)
- Iran war pushes diesel – the economy’s lifeblood – to record high prices, with no relief on the horizon
The Conversation, Morgan Bazilian and Jamie Webster (18/9/26)
- Diesel costs more than $6 a gallon for the first time. Here’s how that affects you
CNN, Chris Isidore and Matt Egan (12/9/26)
- Why is diesel more expensive than petrol in Australia?
NRMA, Sam Charlwood (9/4/26)
- Diesel Prices Surge as Global Supplies Tighten
Farm Bureau Intel, Faith Parum (17/9/26)
- Why has diesel increased so much more than unleaded?
PetrolPrices (11/3/26)
- Disparity between diesel and petrol prices reaches record-breaking levels
FleetNews, Gareth Roberts (30/3/26)
- Diesel and petrol hit four-year high fuelling inflation concerns
FleetNews, Gareth Roberts (15/9/26)
- EU says Trump plan to ban US diesel exports would ‘negatively impact both sides’
The Guardian, Jillian Ambrose (25/9/26)
Videos
Questions
- Draw a demand and supply diagram for diesel and petrol to illustrate the effects discussed in this blog.
- Is the demand for diesel likely to be more elastic over the longer term? Explain.
- Compare the effects on diesel prices in the UK with one other country of your choice. How similar are the factors affecting the relative price increases in diesel and petrol in the two countries?
- Would cutting taxes on diesel solve the problem of higher prices for diesel users?
- How has the cost of heating oil and aircraft fuel changed compared to that of petrol and diesel? Explain.
- What would be the effects on diesel prices in the UK and the USA if Donald Trump carried out his potential plan to ban US exports of diesel?
 The UK’s poor record on productivity since the 2008 financial crisis is well documented, not least in this blog series. Output per worker has flatlined over the 17 years since the crisis. As was noted in the blog, The UK’s poor productivity record, low UK productivity is caused by a number of factors, including the lack of investment in training, the poor motivation of many workers and the feeling of being overworked, short-termism among politicians and management, and generally poor management practices.
One of the most significant issues identified by analysts and commentators is the lack of investment in physical capital, both by private companies and by the government in infrastructure. Gross fixed capital formation (a measure of investment) has been much lower in the UK compared to international competitors.
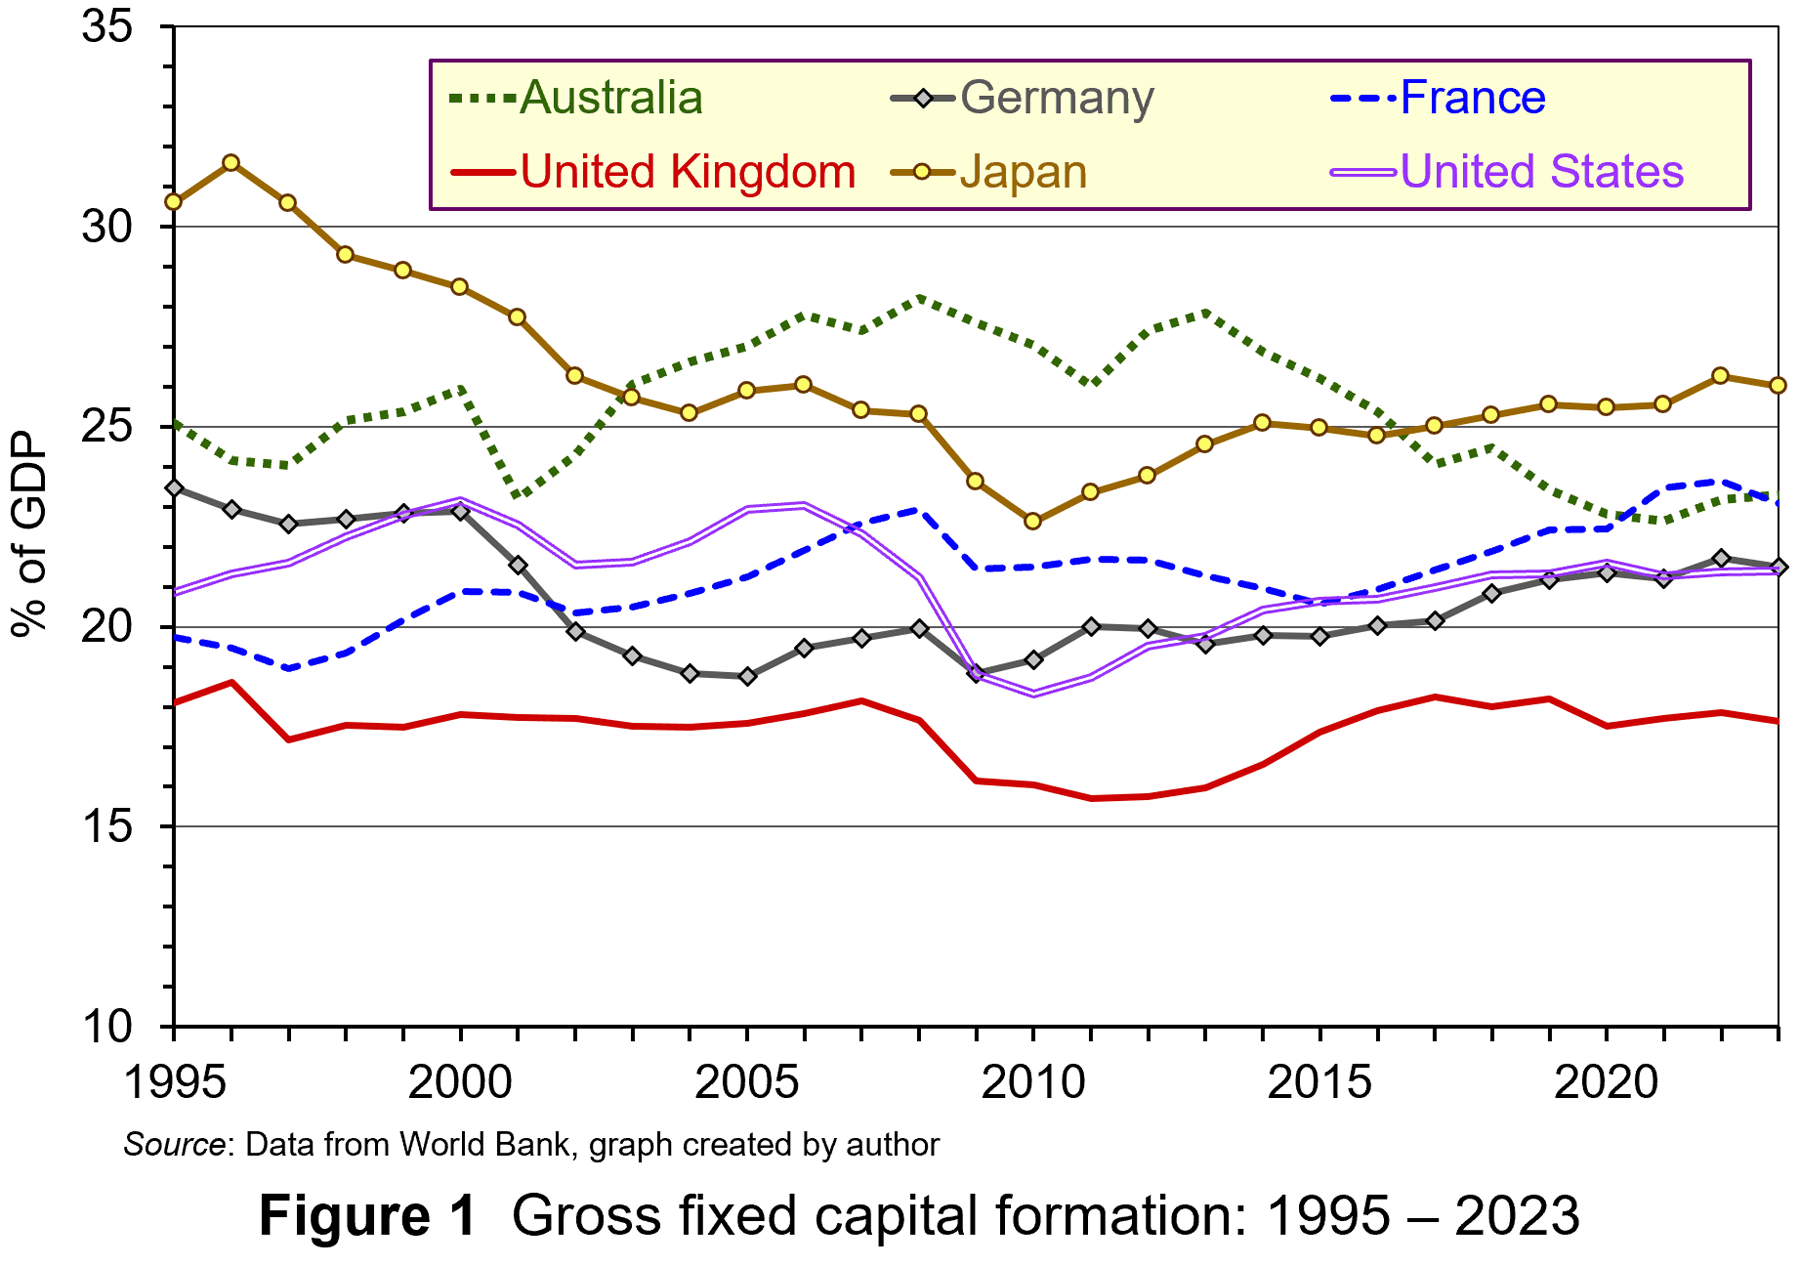 From Figure 1 it can be observed that, since the mid-1990s, the UK has consistently had lower investment as a percentage of GDP compared to other significant developed market economies. The cumulative effect of this gap has contributed to lower productivity and lower economic growth.
Interestingly, since the financial crisis, UK firms have had high profitability and associated high cash holdings. This suggests that firms have had a lot of financial resources to reinvest. However, data from the OECD suggests that reinvestment rates in the UK, typically 40–50% of profit, are much lower than in many other OECD countries. In the USA the rate is 50%, in Germany 60–70% and in Japan 70%+. There is much greater emphasis in the UK on returning funds to shareholders through dividends and share buybacks. However, the reinvestment of much of this cash within firms could have gone some way to addressing the UK’s investment gap – but, it hasn’t been done.
 Analysis by the OECD suggest that, while the cost of financing investment has declined since the financial crisis, the gap between this and the hurdle rate used to appraise investments has widened. Between 2010 and 2021 the difference nearly doubled to 4%. This increase in the hurdle rate can be related to increases in the expected rate of return by UK companies and their investors.
In this blog we will analyse (re)investment decisions by firms, discussing how increases in the expected rate of return in the UK raise the hurdle rate used to appraise investments. This reduces the incentive to engage in long-term investment. We also discuss policy prescriptions to improve reinvestment rates in the UK.
Investment and the expected rate of return
Investment involves the commitment of funds today to reap rewards in the future. This includes spending on tangible and intangible resources to improve the productive capacity of firms. Firms must decide whether the commitment of funds is worthwhile. To do so, economic theory suggests that they need to consider the compensation required by their provider of finance – namely, investors.
What rewards do investors require to keep their funds invested with the firm?
When conducting investment appraisal, firms compare the estimated rate of return from an investment with the minimum return investors are prepared to receive (termed the ‘expected return’). Normally this is expressed as a percentage of the initial outlay. Firms have to offer returns to investors which are equal to or greater than the minimum expected return – the return that is sufficient to keep funds invested in the firm. Therefore, returns above this minimum expected level are termed ‘excess returns’.
When firms conduct appraisals of potential investments, be it in tangible or intangible capital, they need to take into account the fact that net benefits, expressed as cash flows, will accrue over the life of the investment, not all at once. To do this, they use discounted cash flow (DCF) analysis. This converts future values of the net benefits to their present value. This is expressed as follows:

Where:
NPV = Net present value (discounted net cash flows);
K = Capital outlay (incurred at the present time);
C = Net cash flows (occur through the life of the investment project);
r = Minimum expected rate of return.
In this scenario, the investment involves an initial cash outlay (K), followed in subsequent periods by net cash inflows each period over the life of the investment, which in this case is 25 years. All the cash flows are discounted back to the present so that they can be compared at the same point in time.
The discount rate (r) used in appraisals to determine the present value of net cash flows is determined by the minimum expected return demanded by investors. If at that hurdle rate there are positive net cash flows (+NPV), the investment is worthwhile and should be pursued. Conversely, if at that hurdle rate there are negative net cash flows (–NPV), the investment is not worthwhile and should not be pursued.
According to economic theory, if a firm cannot find any investment projects that produce a positive NPV, and therefore satisfy the minimum expected return, it should return funds to shareholders through dividends or share buybacks so that they can invest the finance more productively.
Firm-level data from the OECD suggest that UK firms have had higher profits and this has been associated with increased cash holdings. But, due to the higher hurdle rate, less investment is perceived to be viable and thus firms distribute more of their profits through dividends and share buybacks. These payouts represent lost potential investment and cumulatively produce a significant dent in the potential output of the UK economy.
Why are expected rates of return higher in the UK?
This higher minimum rate of expected return can be explained by factors influencing its determinants; opportunity cost and risk/uncertainty.
Higher opportunity cost. Opportunity cost relates to the rate of return offered by alternatives. Investors and, by implication firms, will have to consider the rate of return offered by alternative investment opportunities. Typically, investors have focused on interest rates as a measure of opportunity cost. Higher interest rates raise the opportunity cost of an investment and increase the minimum expected rate of return (and vice versa with lower interest rates).
 However, it is not interest rates that have increased the opportunity cost, and hence the minimum expected rate of return associated with investment, in the UK since the financial crisis. For most of the period since 2008, interest rates have been extremely low, sitting at below 1%, only rising significantly during the post-pandemic inflationary surge in 2022. This indicates that this source of opportunity cost for the commitment of business investment has been extremely low.
However, there may be alternative sources of opportunity cost which are pushing up the expected rate of return. UK investors are not restricted to investing in the UK and can move their funds between international markets determined by the rate of return offered. The following table illustrates the returns (in terms of percentage stock market index gain) from investing in a sample of UK, US, French and German stock markets between August 2010 and August 2025.
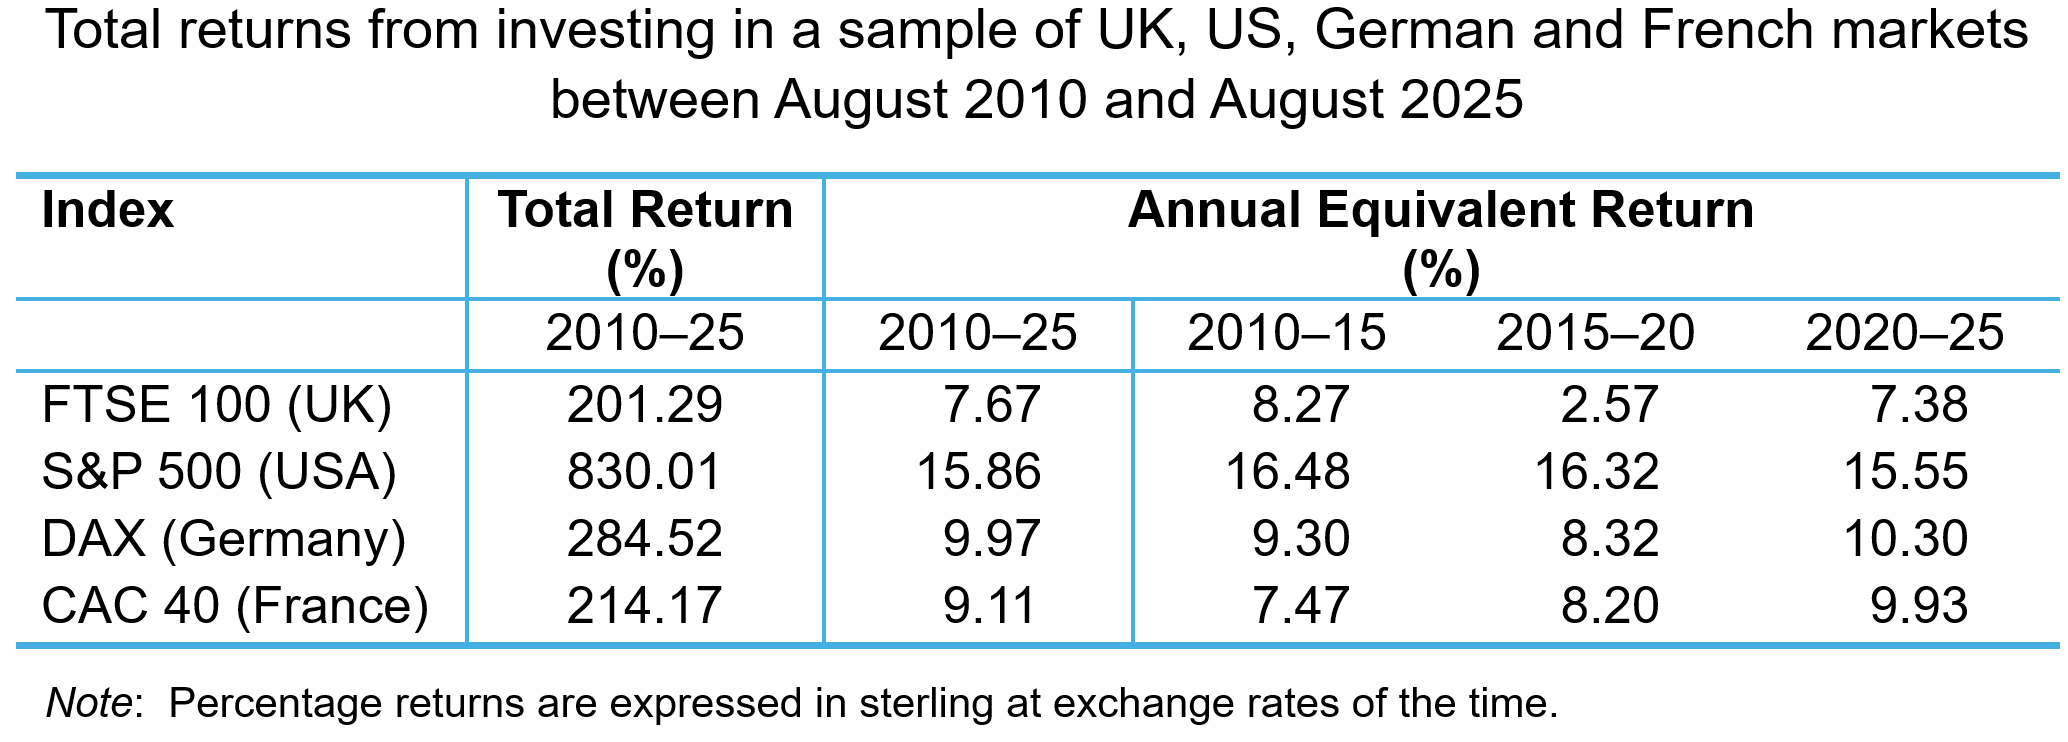
When expressed in sterling, returns offered by UK-listed companies are lower across the whole period and in most of the five-yearly sub-periods. Indeed, the annual equivalent rate of return (AER) for the FTSE 100 index across the whole period is less than half that of the S&P 500. The index offered a paltry annual return of 2.57% between 2015 and 2020, while the US index offered a return of 16.48%. Both the French and German indices offered higher rates of return, in the latter part of the period particularly. This represents a higher opportunity cost for UK investors and may have increased their expectations about the return they require for UK investments.
Greater perceived risk/uncertainty. Expected rates of return are also determined by perceptions of risk and uncertainty – the compensation investors need to bear the perceived risk associated with an investment. Investors are risk averse. They demand higher expected return as compensation for higher perceived risk. Higher levels of risk aversion increase the expected rate of return and related investment hurdle rates.
 There has been much discussion of increased uncertainty and risk aversion among global investors and firms (see the blogs Rising global uncertainty and its effects, World Uncertainty Index, The Chancellor’s fiscal dilemma and Investment set to fall as business is baffled by Trump). The COVID-19 pandemic, inflation shocks, the war in Ukraine, events across the Middle East and the trade policies adopted by the USA in 2025 have combined to produce a very uncertain business environment.
While these have been relatively recent factors influencing world-wide business uncertainty, perceptions of risk and uncertainty concerning the UK economy seem to be longer established. To measure policy-related economic uncertainty in the UK, Baker, Bloom and Davis at www.PolicyUncertainty.com construct an index based on the content analysis of newspaper articles mentioning terms reflecting policy uncertainty.
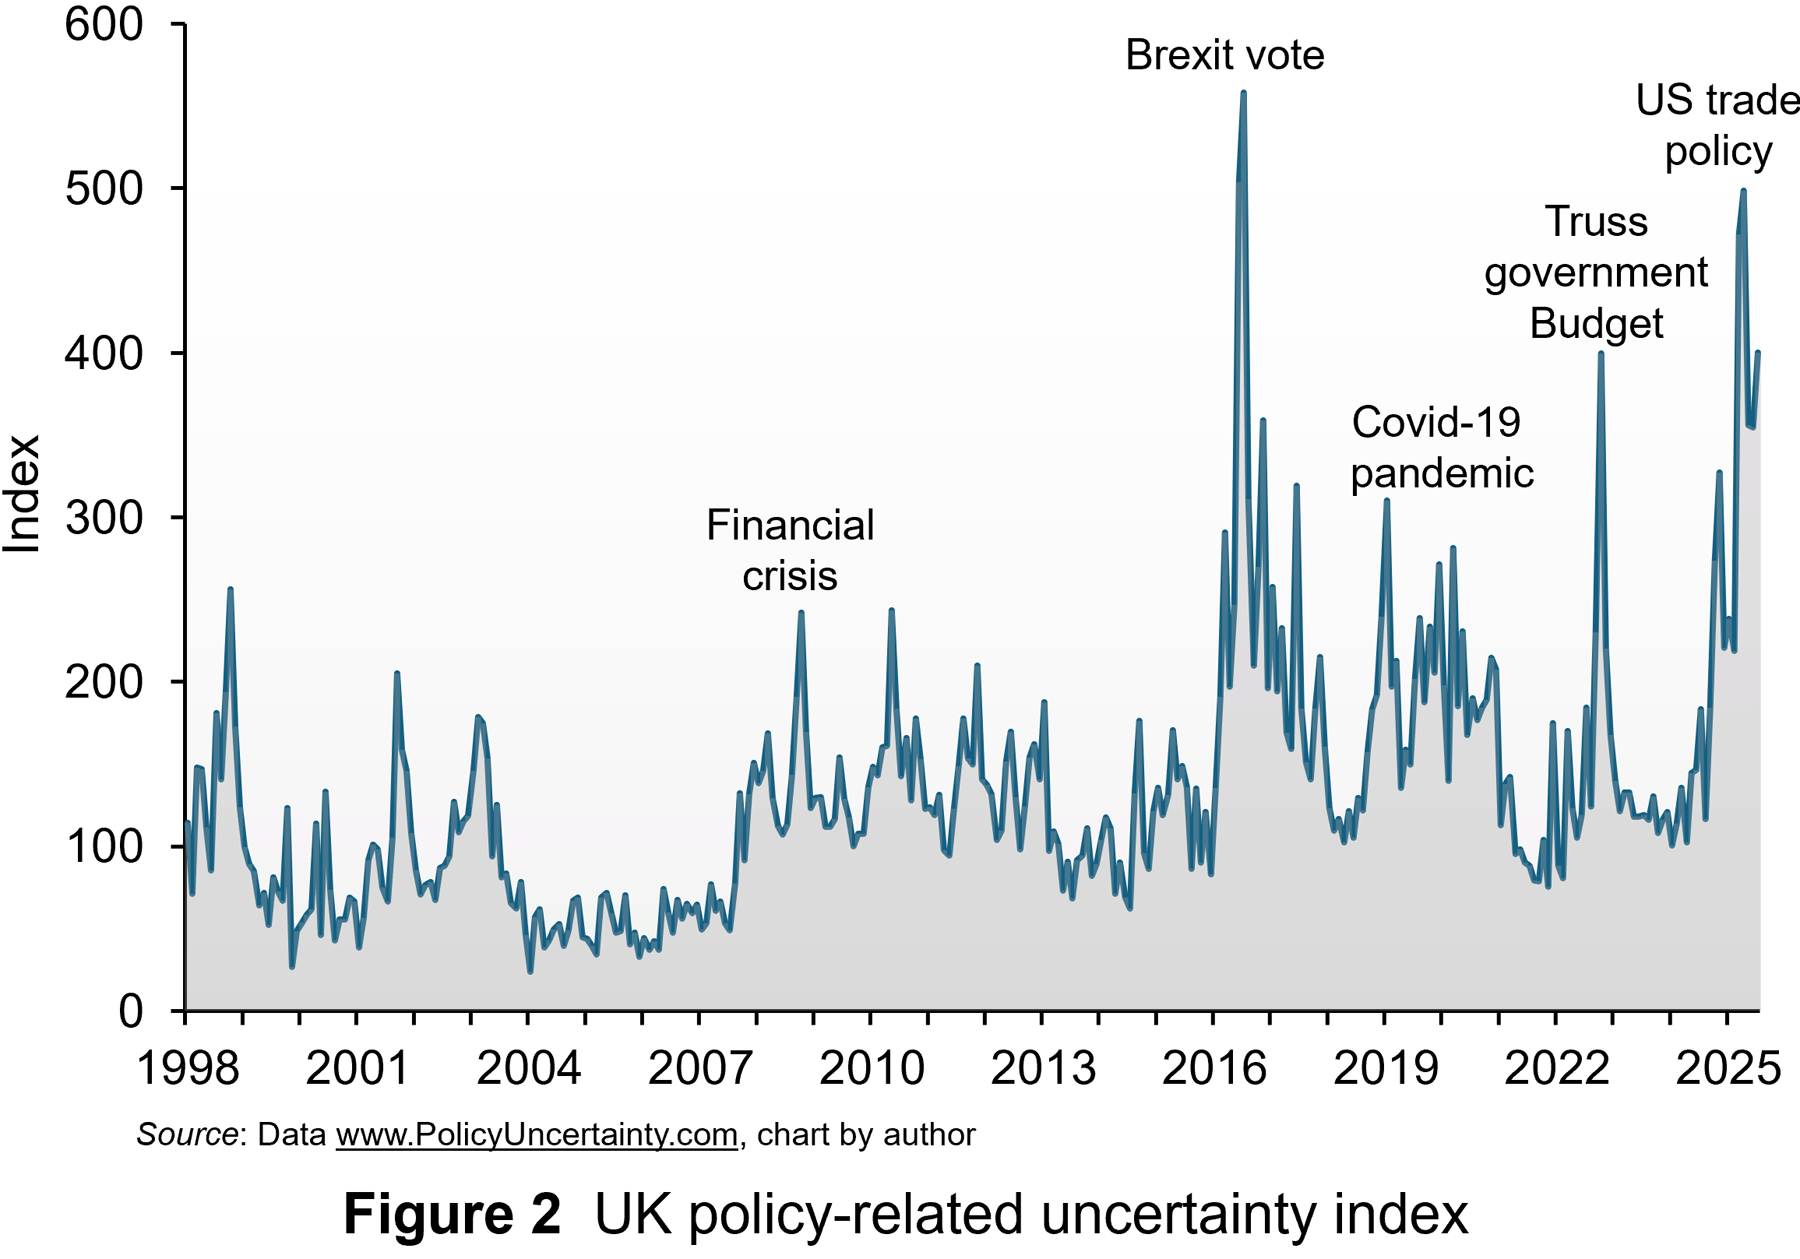 Figure 2 illustrates the monthly index from 1998 to July 2025. The series is normalised to standard deviation 1 prior to 2011 and then summed across papers, by month. Then, the series is normalised to mean 100 prior to 2011.
Some of the notable spikes in uncertainty in the UK since 2008 have been labelled. Beginning with the global financial crisis, investors and firms became much more uncertain. This was exacerbated by a series of economic shocks that hit the economy, one of which, the narrow vote to leave the European Union in 2016, was specific to the UK. This led to political turmoil and protracted negotiations over the terms of the trade deal after the UK left. This uncertainty has been exacerbated recently by the series of global shocks highlighted above and also the budget uncertainty of Liz Truss’s short-lived premiership and now the growing pressure to reduce government borrowing.
While spikes in uncertainty occurred before the financial crises, the average level of uncertainty, as measured by the index, has been much higher since the crisis. From 1998 to 2008, the average value was 89. Since 2008, the average value has been 163. Since the Brexit vote, the average value has been 185. This indicates a much higher perception of risk and uncertainty over the past 15 year and this translates into higher minimum expected return as compensation. Consequently, this makes many long-term investment projects less viable because of higher hurdle rates. This produces less productive investment in capital, contributing significantly to lower productivity.
Policy proposals
There has been much debate in the UK about promoting greater long-term investment. Reforms have been proposed to improve public participation in long-term investment through the stock market. To boost investment, this would require the investing public to be prepared to accept lower expected returns for a given level of risk or accept higher risk for a given level of returns.
Evidence suggests that the appetite for this may be very low. UK savers tend to favour less risky and more liquid cash deposits. It may be difficult to encourage them to accept higher levels of risk. In any case, even if they did, many may invest outside the UK where the risk-return trade-off is more favourable.
 Over the past 10 years, policy uncertainty has played a significant role in deterring investment. So, if there is greater continuity, this may then promote higher levels of investment.
The Labour government has proposed policies which aim to share or reduce the risk/uncertainty around long-term investment for UK businesses. For instance, a National Wealth Fund (NWF) has been established to finance strategic investment in areas such as clean energy, gigafactories and carbon capture. Unfortunately, the Fund is financed by borrowing through financial markets and the amount expected to be committed over the life of the current Parliament is only £29 billion, assuming that private capital matches public commitments in the ratio expected. It is questionable whether the Fund’s commitment will be sufficient to attract private capital.
Alternatively, Invest 2035 is a proposal to create a stable, long-term policy environment for business investment. It aims to establish an Industrial Strategy Council for policy continuity and to tackle issues like improving infrastructure, reducing energy costs and addressing skills gaps. Unfortunately, even if there is some attempt at domestic policy stability, the benefits may be more than offset by perceptions around global uncertainty, which may mean that UK investors’ minimum expected rates of return remain high and long-term investment low for the foreseeable future.
Articles
Data
Questions
- Use the marginal efficiency of capital framework to illustrate the ‘lost’ investment spending in the UK due to the investment hurdle rate being higher than the cost of capital.
- Explain the arbitrage process which produces the differences in valuations of UK securities and foreign ones due to differences in the expected rate of return.
- Sketch an indifference curve for a risk-averse investor, treating expected return and risk as two characteristics of a financial instrument.
- How does higher uncertainty affect the slope of an indifference curve for such an investor? How does this affect their investment hurdle rate?
- Analyse the extent to which the proposed polices can reduce the investment hurdle rate for UK companies and encourage greater levels of investment.
 We have examined inflation in several blogs in recent months. With inflation at levels not seen for 40 years, this is hardly surprising. One question we’ve examined is whether the policy response has been correct. For example, in July, we asked whether the Bank of England had raised interest rates too much, too late. In judging policy, one useful distinction is between demand-pull inflation and cost-push inflation. Do they require the same policy response? Is raising interest rates to get inflation down to the target rate equally applicable to inflation caused by excessive demand and inflation caused by rising costs, where those rising costs are not caused by rising demand?
In terms of aggregate demand and supply, demand-pull inflation is shown by continuing rightward shifts in aggregate demand (AD); cost-push inflation is shown by continuing leftward/upward shifts in short-run aggregate supply (SRAS). This is illustrated in the following diagram, which shows a single shift in aggregate demand or short-run aggregate supply. For inflation to continue, rather than being a single rise in prices, the curves must continue to shift.
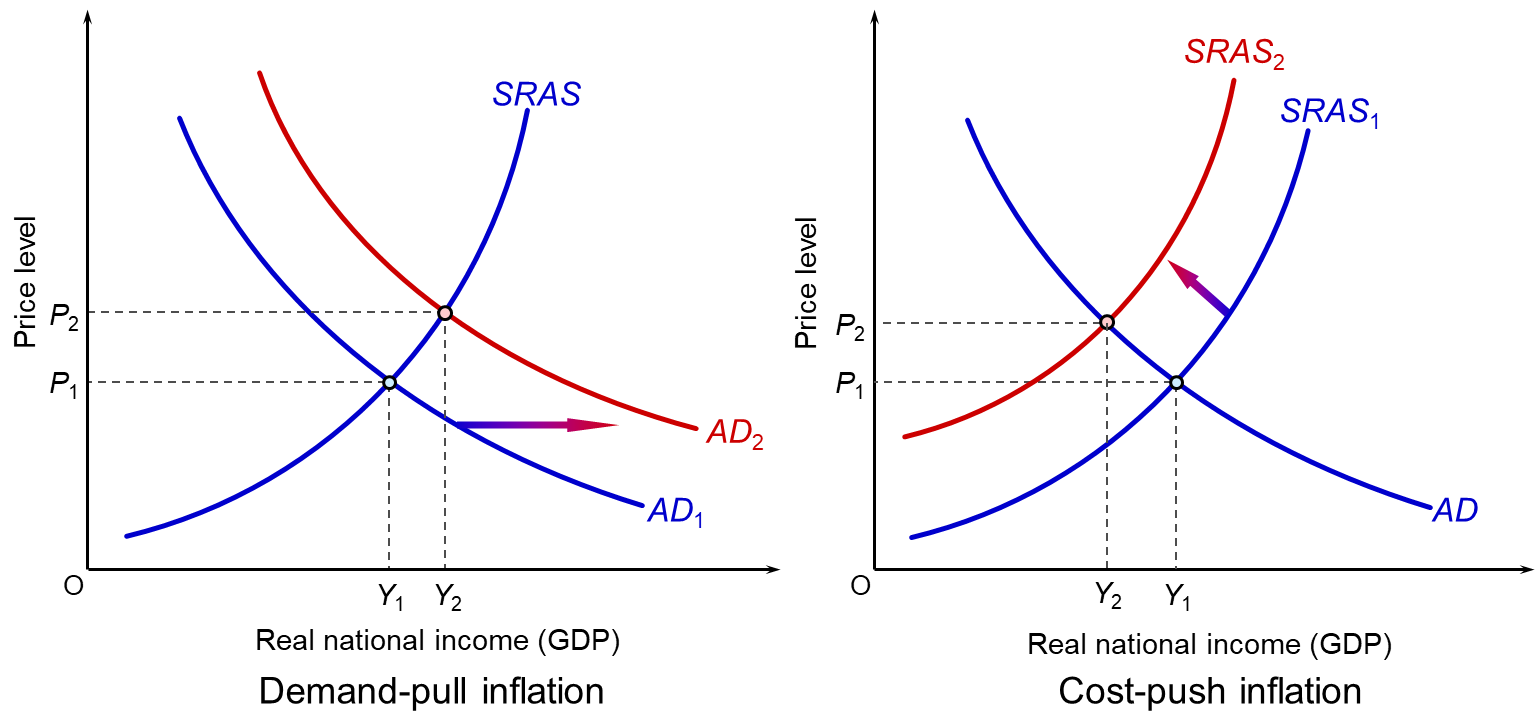
As you can see, the effects on real GDP (Y) are quite different. A rise in aggregate demand will tend to increase GDP (as long as capacity constraints allow). A rise in costs, and hence an upward shift in short-run aggregate supply, will lead to a fall in GDP as firms cut output in the face of rising costs and as consumers consume less as the cost of living rises.
The inflation experienced by the UK and other countries in recent months has been largely of the cost-push variety. Causes include: supply-chain bottlenecks as economies opened up after COVID-19; the war in Ukraine and its effects on oil and gas supplies and various grains; and avian flu and poor harvests from droughts and floods associated with global warming resulting in a fall in food supplies. These all led to a rise in prices. In the UK’s case, this was compounded by Brexit, which added to firms’ administrative costs and, according to the Bank of England, was estimated to cause a long-term fall in productivity of around 3 to 4 per cent.
The rise in costs had the effect of shifting short-run aggregate supply upwards to the left. As well as leading to a rise in prices and a cost-of-living squeeze, the rising costs dampened expenditure.
This was compounded by a tightening of fiscal policy as governments attempted to tackle public-sector deficits and debt, which had soared with the support measures during the pandemic. It was also compounded by rising interest rates as central banks attempted to bring inflation back to target.
Monetary policy response
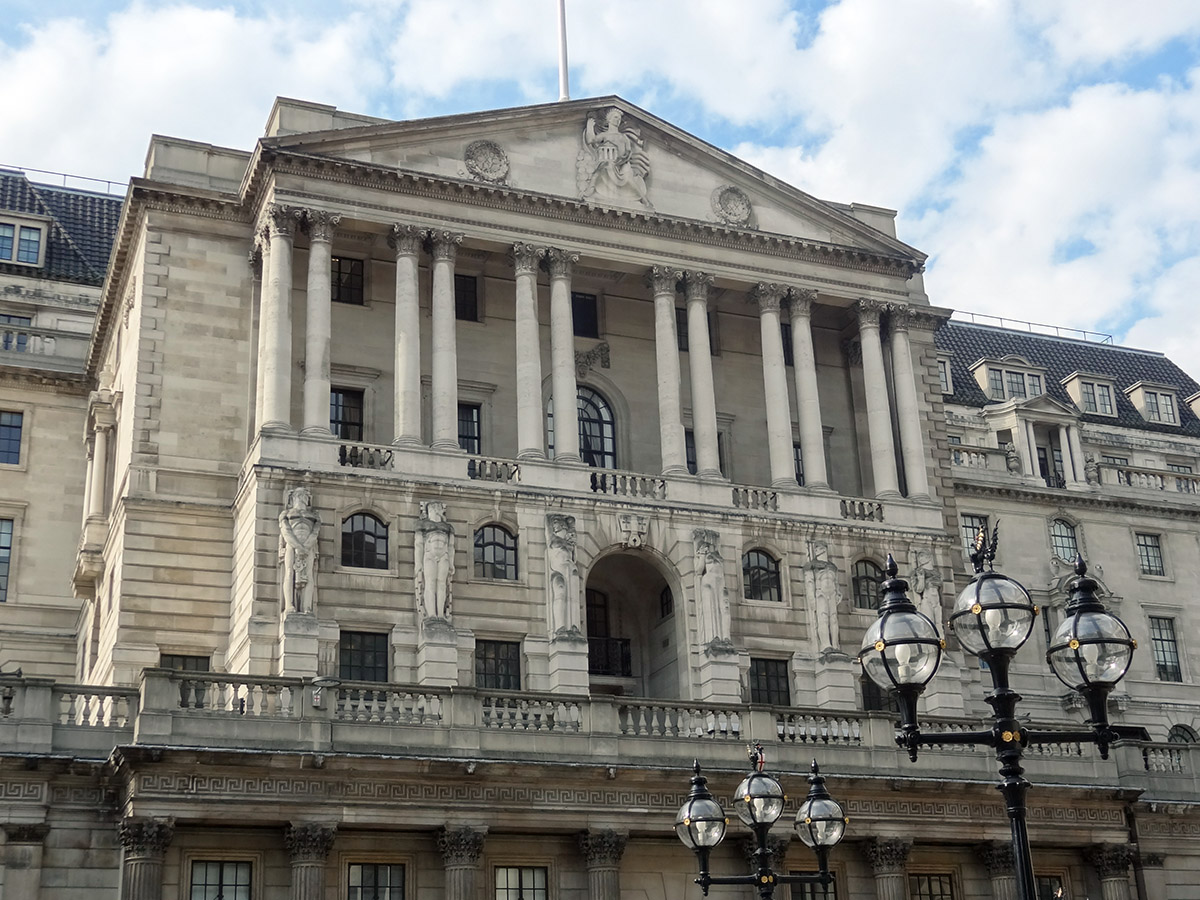 Central banks are generally charged with keeping inflation in the medium term at a target rate set by the government or the central bank itself. For most developed countries, this is 2% (see table in the blog, Should central bank targets be changed?). So is raising interest rates the correct policy response to cost-push inflation?
One argument is that monetary policy is inappropriate in the face of supply shocks. The supply shocks themselves have the effect of dampening demand. Raising interest rates will compound this effect, resulting in lower growth or even a recession. If the supply shocks are temporary, such as supply-chain disruptions caused by lockdowns during the pandemic, then it might be better to ride out the problem and not raise interest rates or raise them by only a small amount. Already cost pressures are easing in some areas as supplies have risen.
If, however, the fall in aggregate supply is more persistent, such as from climate-related declines in harvests or the Ukraine war dragging on, or new disruptions to supply associated with the Israel–Gaza war, or, in the UK’s case, with Brexit, then real aggregate demand may need to be reduced in order to match the lower aggregate supply. Or, at the very least, the growth in aggregate demand may need to be slowed to match the slower growth in aggregate supply.
Huw Pill, the Chief Economist at the Bank of England, in a podcast from the Columbia Law School (see links below), argued that people should recognise that the rise in costs has made them poorer. If they respond to the rising costs by seeking higher wages, or in the case of businesses, by putting up prices, this will simply stoke inflation. In these circumstances, raising interest rates to cool aggregate demand may reduce people’s ability to gain higher wages or put up prices.
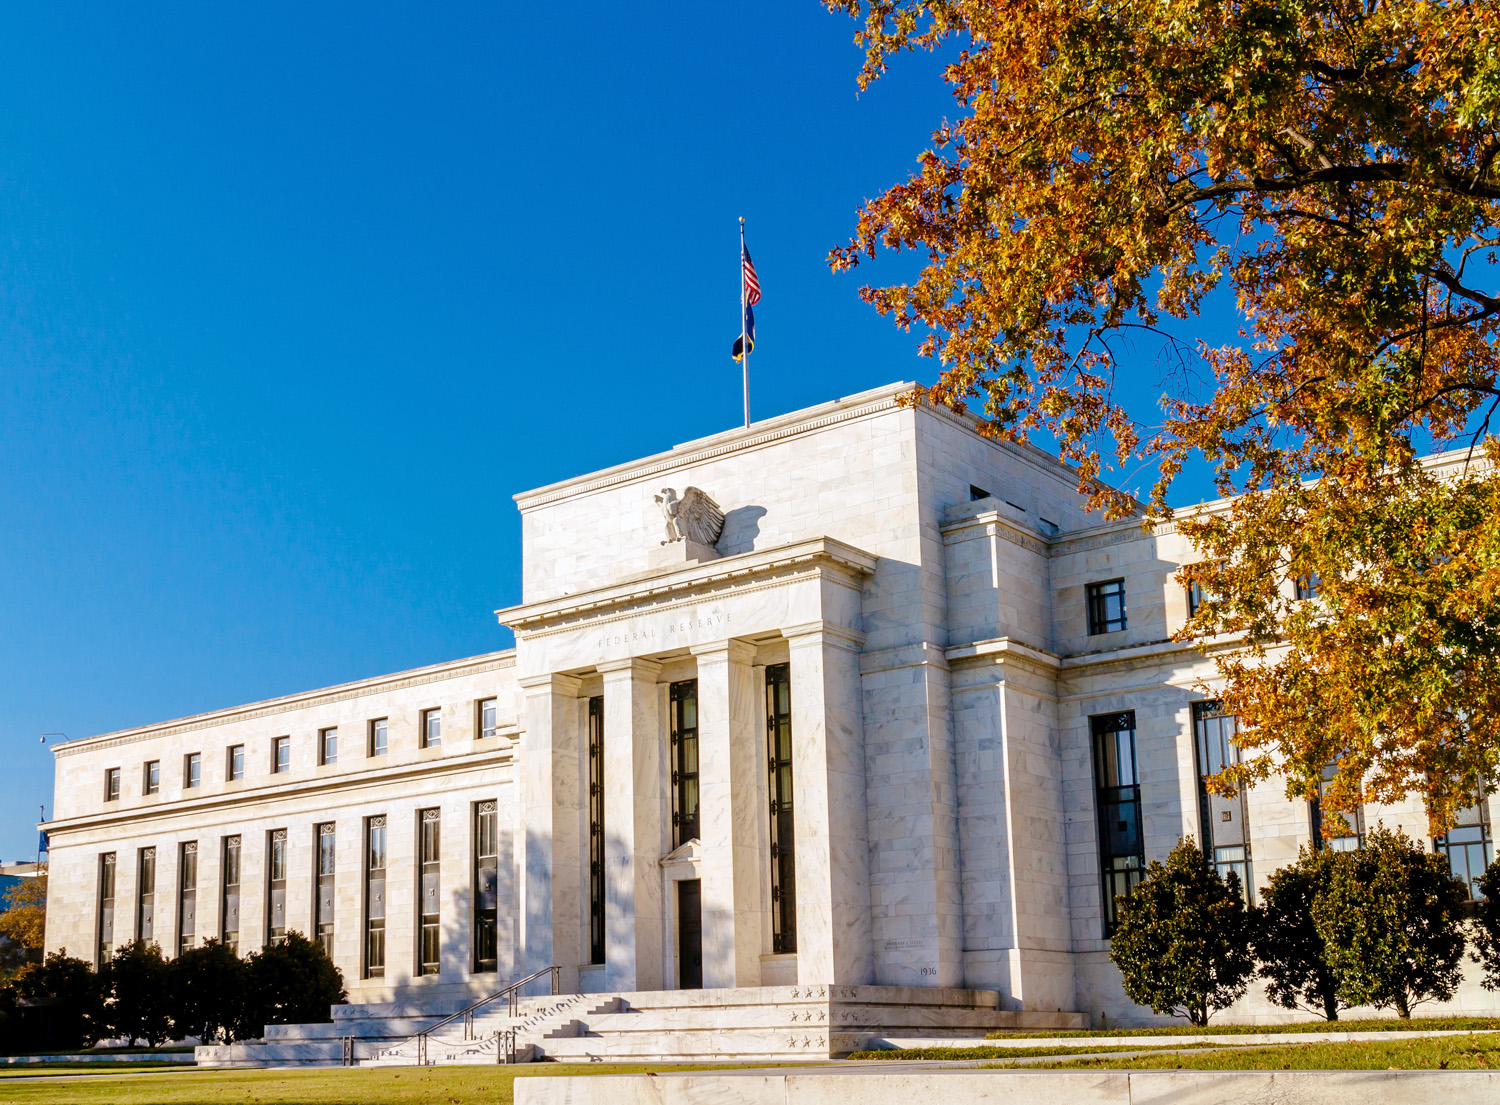 Another argument for raising interest rates in the face of cost-push inflation is when those cost increases are felt more than in other countries. The USA has suffered less from cost pressures than the UK. On the other hand, its growth rate is higher, suggesting that its inflation, albeit lower than in the UK, is more of the demand-pull variety. Despite its inflation rate being lower than in the UK, the problem of excess demand has led the Fed to adopt an aggressive interest rate policy. Its target rate is 5.25% to 5.50%, while the Bank of England’s is 5.25%. In order to prevent short-term capital outflows and a resulting depreciation in the pound, further stoking inflation, the Bank of England has been under pressure to mirror interest rate rises in the USA, the eurozone and elsewhere.
Articles
Blogs on this site
Information and data
Questions
- How may monetary policy affect inflationary expectations?
- If cost-push inflation makes people generally poorer, what role does the government have in making the distribution of a cut in real income a fair one?
- In the context of cost-push inflation, how might the authorities prevent a wage–price spiral?
- With reference to the second article above, explain the ‘monetary policy conundrum’ faced by the Bank of Japan.
- If central banks have a single policy instrument, namely changes in interest rates, how may conflicts arise when there is more than one macroeconomic objective?
- Is Russia’s rise in inflation the result of cost or demand pressures, or a mixture of the two (see articles above)?
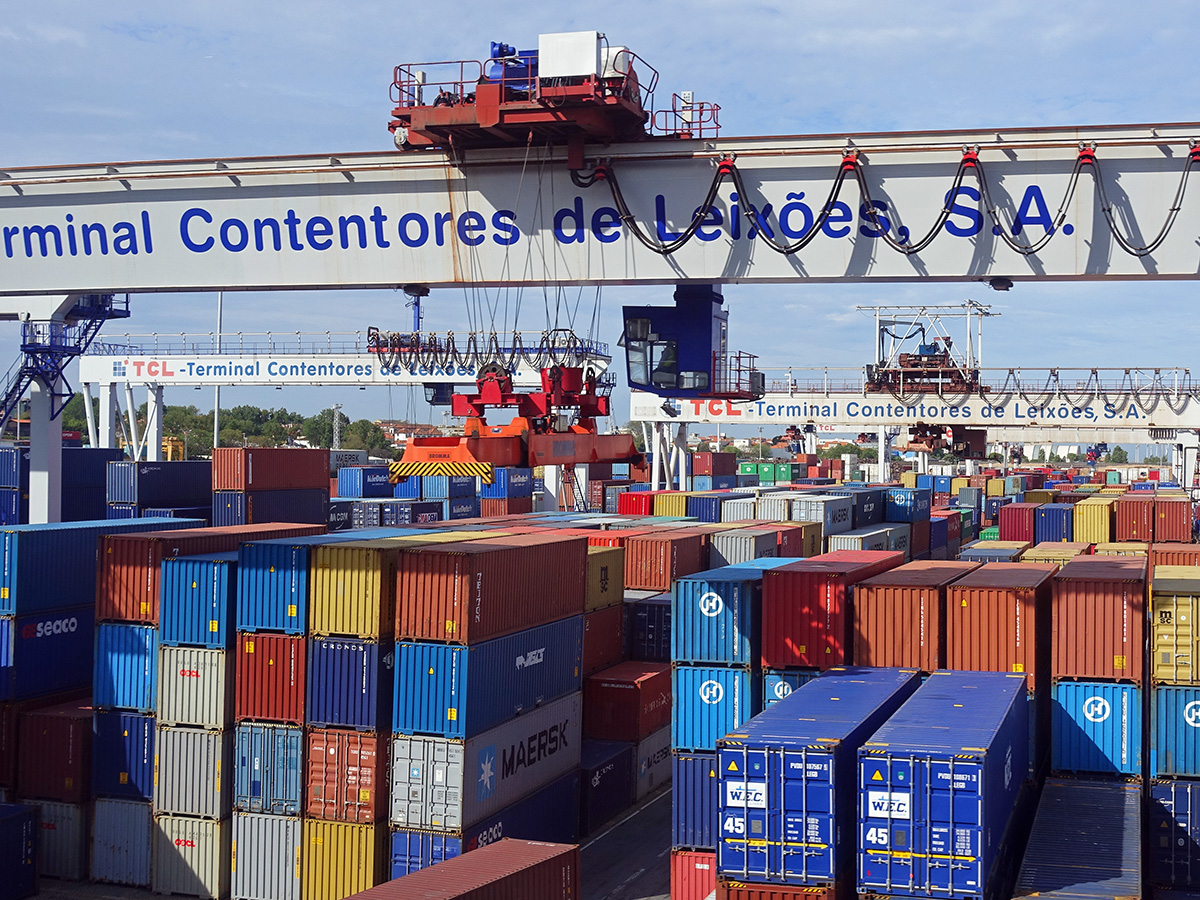 Over the decades, economies have become increasingly interdependent. This process of globalisation has involved a growth in international trade, the spread of technology, integrated financial markets and international migration.
When the global economy is growing, globalisation spreads the benefits around the world. However, when there are economic problems in one part of the world, this can spread like a contagion to other parts. This was clearly illustrated by the credit crunch of 2007–8. A crisis that started in the sub-prime market in the USA soon snowballed into a worldwide recession. More recently, the impact of Covid-19 on international supply chains has highlighted the dangers of relying on a highly globalised system of production and distribution. And more recently still, the war in Ukraine has shown the dangers of food and fuel dependency, with rapid rises in prices of basic essentials having a disproportionate effect on low-income countries and people on low incomes in richer countries.
Moves towards autarky
So is the answer for countries to become more self-sufficient – to adopt a policy of greater autarky? Several countries have moved in this direction. The USA under President Trump pursued a much more protectionist agenda than his predecessors. The UK, although seeking new post-Brexit trade relationships, has seen a reduction in trade as new barriers with the EU have reduced UK exports and imports as a percentage of GDP. 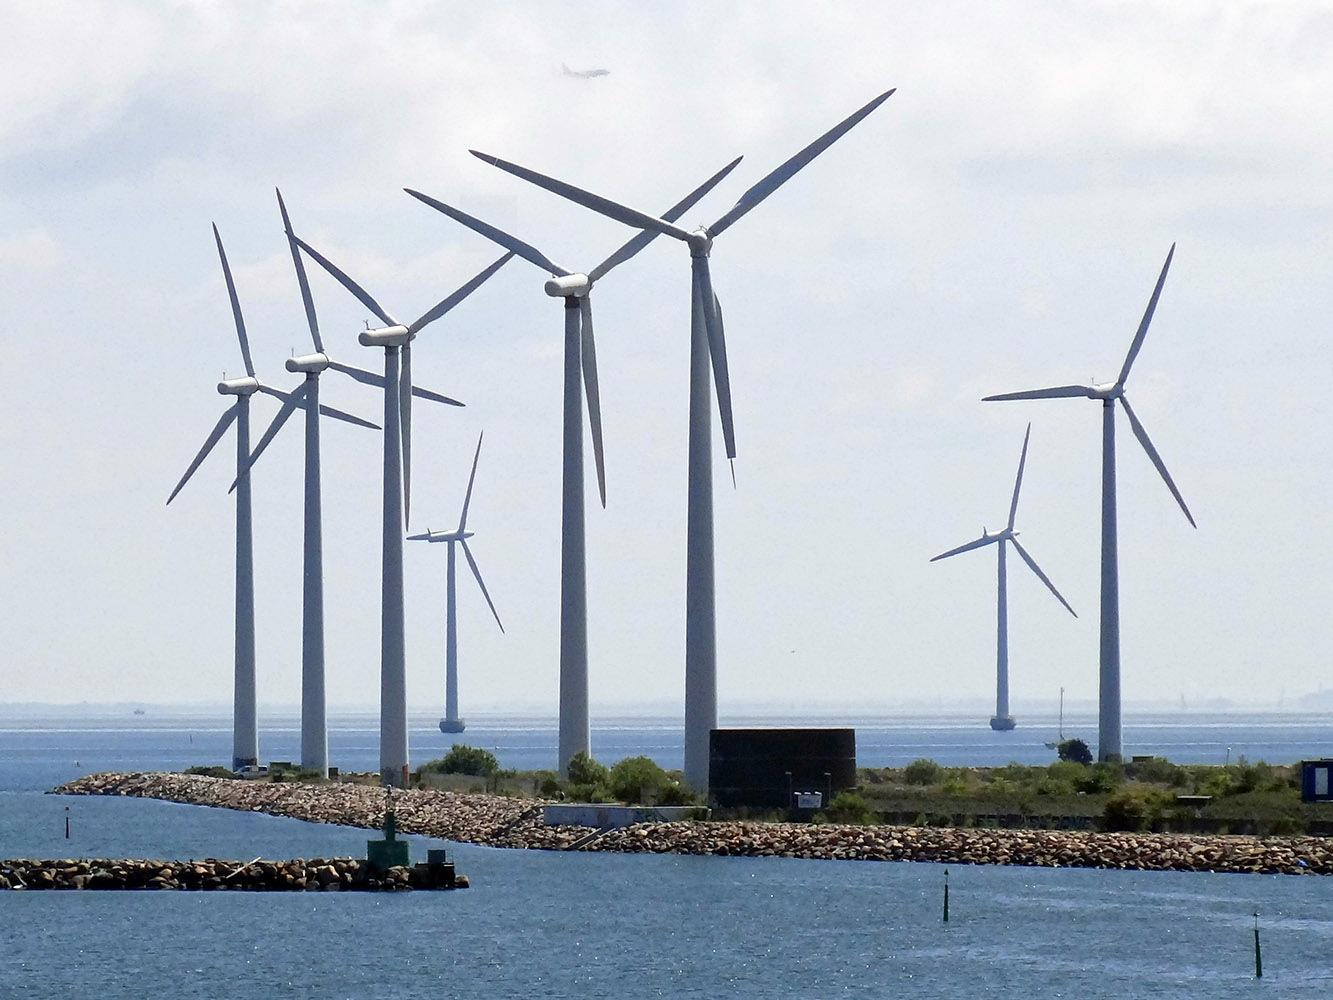 According to the Office for Budget Responsibility’s November 2022 Economic and Fiscal Outlook, Brexit will result in the UK’s trade intensity being 15 per cent lower in the long run than if it had remained in the EU.
Many European countries are seeking to achieve greater energy self-sufficiency, both as a means of reducing reliance on Russian oil and gas, but also in pursuit of a green agenda, where a greater proportion of energy is generated from renewables. More generally, countries and companies are considering how to reduce the risks of relying on complex international supply chains.
Limits to the gains from trade
The gains from international trade stem partly from the law of comparative advantage, which states that greater levels of production can be achieved by countries specialising in and exporting those goods that can be produced at a lower opportunity cost and importing those in which they have a comparative disadvantage. Trade can also lead to the transfer of technology and a downward pressure on costs and prices through greater competition.
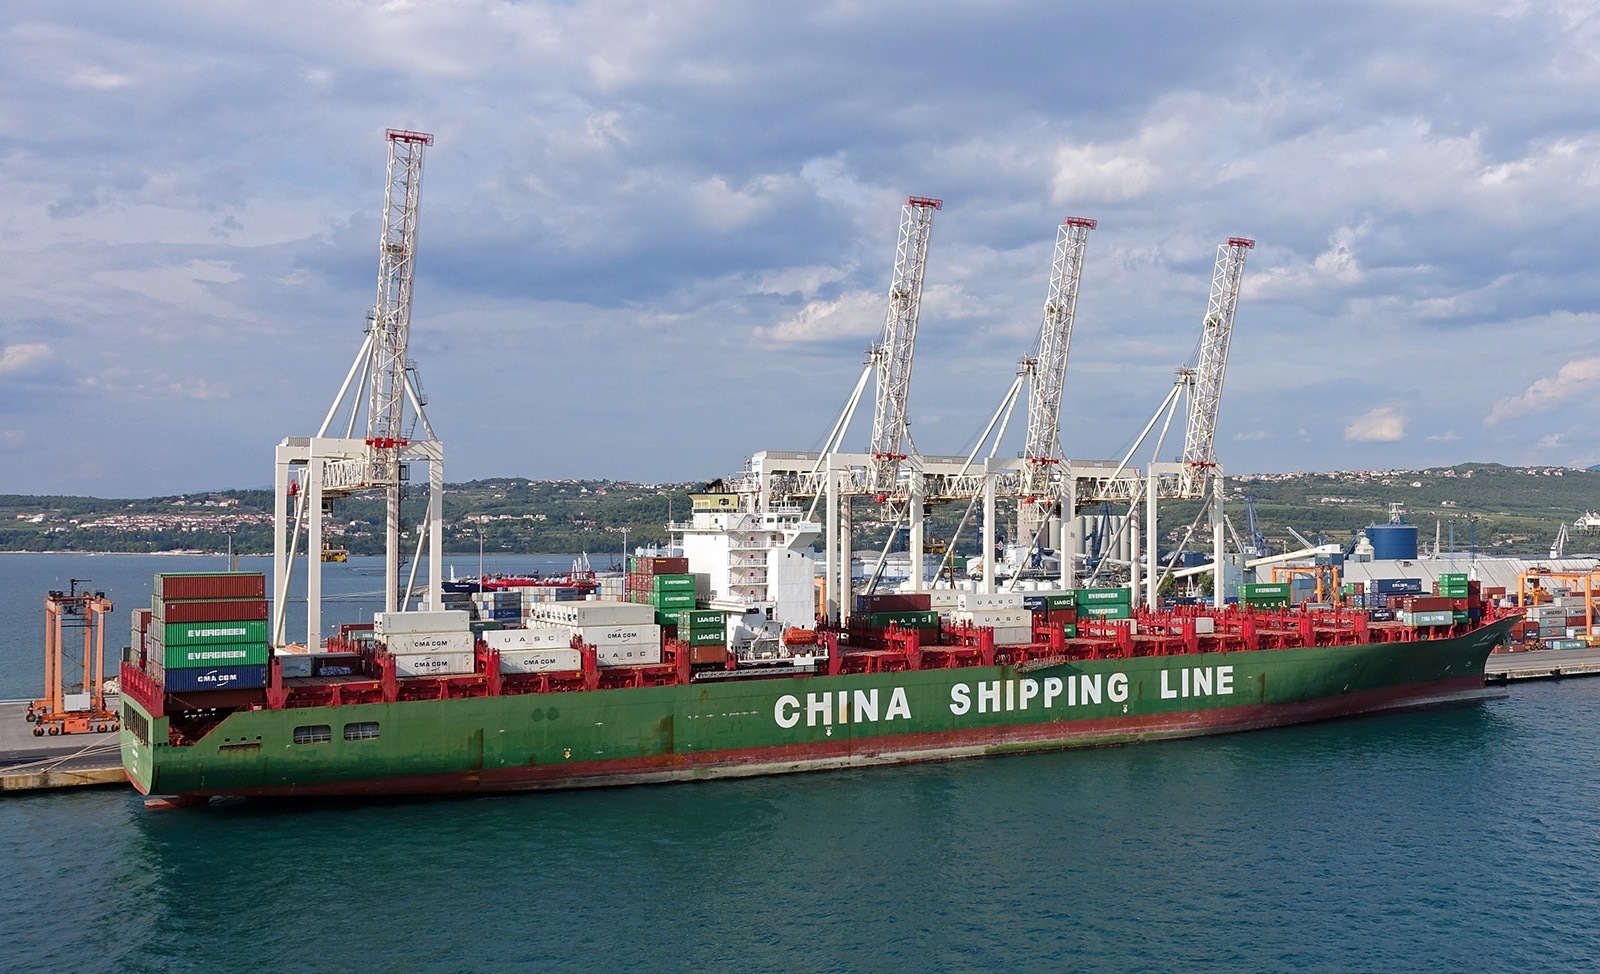 But trade can increase dependence on unreliable supply sources. For example, at present, some companies are seeking to reduce their reliance on Taiwanese parts, given worries about possible Chinese actions against Taiwan.
Also, governments have been increasingly willing to support domestic industries with various non-tariff barriers to imports, especially since the 2007–8 financial crisis. Such measures include subsidies, favouring domestic firms in awarding government contracts and using regulations to restrict imports. These protectionist measures are often justified in terms of achieving security of supply. The arguments apply particularly starkly in the case of food. In the light of large price increases in the wake of the Ukraine war, many countries are considering how to increase food self-sufficiency, despite it being more costly.
Also, trade in goods involves negative environmental externalities, as freight transport, whether by sea, air or land, involves emissions and can add to global warming. In 2021, shipping emitted over 830m tonnes of CO2, which represents some 3% of world total CO2 emissions. In 2019 (pre-pandemic), the figure was 800m tonnes. The closer geographically the trading partner, the lower these environmental costs are likely to be.
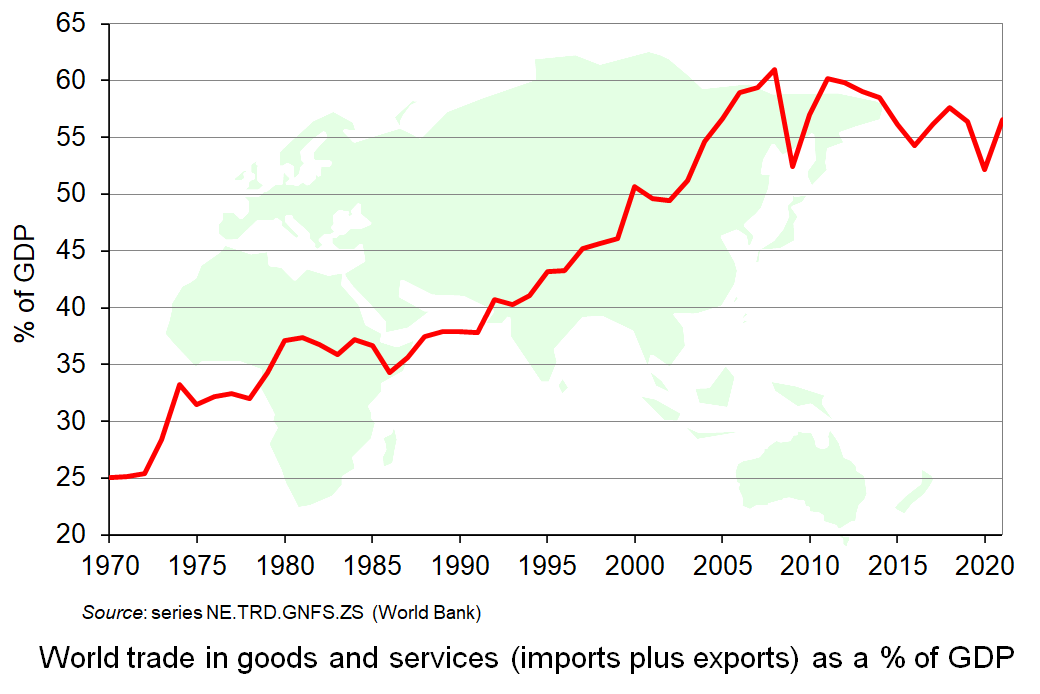 The problems with a globally interdependent world have led to world trade growing more slowly than world GDP in recent years after decades of trade growth considerably outstripping GDP growth. Trade (imports plus exports) as a percentage of GDP peaked at just over 60% in 2008. In 2019 and 2021 it was just over 56%. This is illustrated in the chart (click here for a PowerPoint). Although trade as a percentage of GDP rose slightly from 2020 to 2021 as economies recovered from the pandemic, it is expected to have fallen back again in 2022 and possibly further in 2023.
But despite this reduction in trade as a percentage of GDP, with de-globalisation likely to continue for some time, the world remains much more interdependent than in the more distant past (as the chart shows). Greater autarky may be seen as desirable by many countries as a response to the greater economic and political risks of the current world, but greater autarky is a long way from complete self-sufficiency. The world is likely to remain highly interdependent for the foreseeable future. Reports of the ‘death of globalisation’ are premature!
Podcasts
Articles
Report
Questions
- Explain the law of comparative advantage and demonstrate how trade between two countries can lead to both countries gaining.
- What are the main economic problems arising from globalisation?
- Is the answer to the problems of globalisation to move towards greater autarky?
- Would the expansion/further integration of trading blocs be a means of exploiting the benefits of globalisation while reducing the risks?
- Is the role of the US dollar likely to decline over time and, if so, why?
- Summarise Karl Polanyi’s arguments in The Great Transformation (see the Daniel W. Drezner article linked below). How well do they apply to the current world situation?
 US hikes interest rates as fears grow of global oil shock over Iran War