
Inflation has been rising around the world. The main reason has been the supply shock of rising oil, fertiliser and commodity prices caused by the Iran war and the disruption to global supply chains from conflicts in the Middle East and Russia (see the blog, Why have diesel prices risen more than petrol prices?). Central banks, including the US Federal Reserve Bank, the European Central Bank and the Bank of Japan, have responded to this cost-push inflationary shock by raising interest rates. The Bank of England is likely to raise Bank rate at its next meeting on 5 November 2026.
Similar supply shocks have been experienced in recent years (see the May 2026 blog, Supply shocks – long-term gain from the short-term pain?).
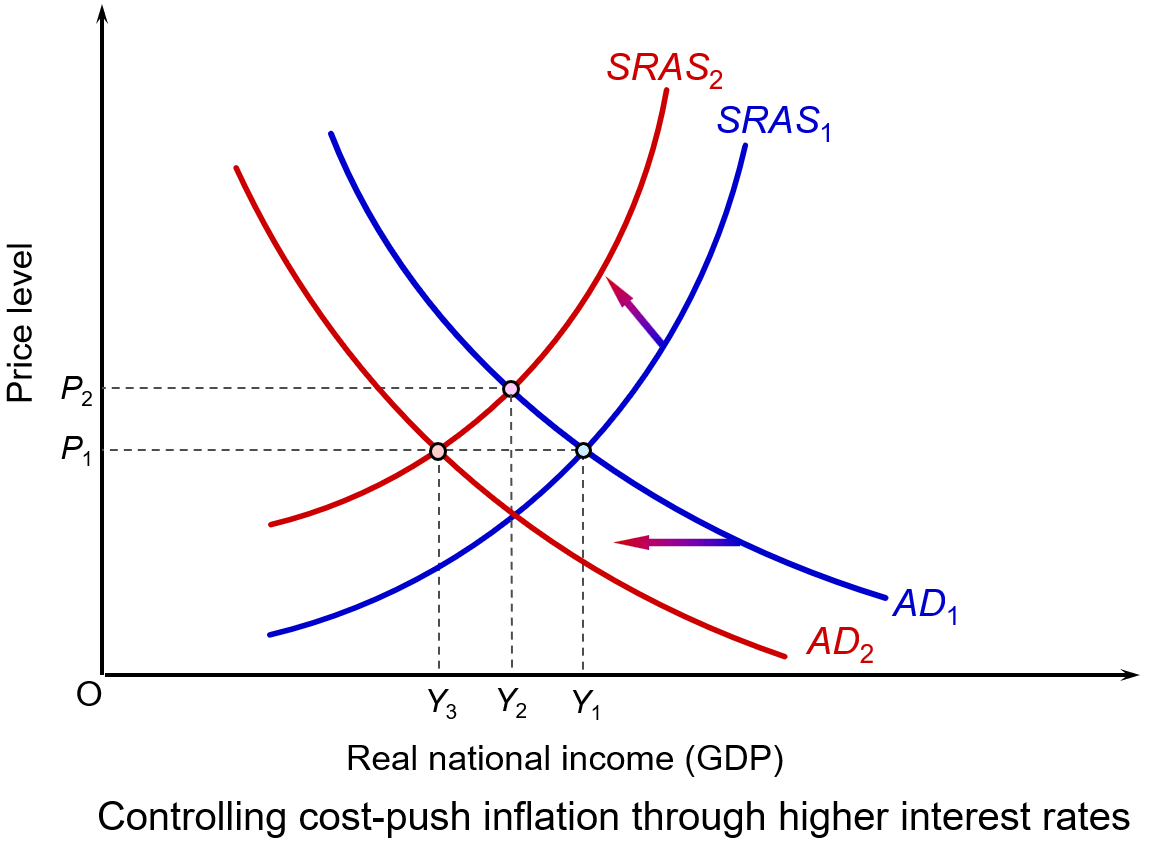 Raising interest rates reduces aggregate demand, or at least its rate of growth. This puts downward pressure on prices, or at least on the rate of inflation. This can be illustrated in the diagram. (Click here for a PowerPoint.)
It shows a country’s initial short-run aggregate supply curve (SRAS1) and initial aggregate demand curve (AD1). The price index is P1 and real GDP is Y1.
The higher costs shift the SRAS curve upwards to the left, say to SRAS2. The price index rises to P2 and real GDP falls to Y2. If, in response to the higher prices, the central bank raises the interest rate, this shifts the aggregate demand curve to the left, say to AD2. As a result, the price index falls back to P1, but the fall in demand causes real GDP to fall further, to Y3.
Policy alternatives
 So, is a rise in interest rates the appropriate response to higher costs that push inflation above, or further above, its target, which for most countries is 2%?
If the cause of inflation was excessive increases in aggregate demand from, say, large government budget deficits or a large increase in consumer demand, then a rise in interest rates would have helped reduce this unsustainable rise in demand. But if the cause of the inflation is a supply shock, is curbing aggregate demand the correct solution?
Ideally, the solution would be to tackle the cost increases directly. A rise in productivity, for example, would help to increase aggregate supply and counter the effect of rising commodity prices. But productivity increases take place over the longer term and are not a solution to a short-term supply shock. Better still, if the increase in commodity prices could be reversed, by finding a political solution that reopened the Strait of Hormuz and other choke points, then higher interest rates would not be needed.
Alternatively, some countries might be able to resort to price controls. These could be targeted at specific sectors such as energy, rent or construction. For example, the UK government has used energy price caps to limit household energy bills.
But even though this may control inflation in the short term, price controls create shortages because demand exceeds the reduced supply. This could lead to higher prices in unofficial markets as people sought to avoid the price controls. It could also create considerable problems for firms planning their logistics when supplies may simply not be available.
Alternatively, subsidies could be used to support output or prices in similar areas. Or they could be targeted at low-income households. These, however, could be costly for governments and may distort markets.
If price controls and subsidies are rejected, and in the absence of short-term increases in aggregate supply, the only solution to inflation is curbing aggregate demand to match the reduced aggregate supply. This could be achieved through fiscal policy by raising taxes or reducing government expenditure, but would prove unpopular and would probably be rejected by governments. Generally, they would prefer to pass the burden to central banks through the use of monetary policy.
The blunt instrument of monetary policy
But, raising interest rates is, indeed, a blunt instrument. Tighter monetary policy cannot increase the global supply of fuel, fix broken supply chains or lower insurance and construction costs. In other words, it cannot directly fix supply shocks, only limit their effect on prices.
 Also, by making borrowing more expensive, higher interest rates may suppress business investment and house building. This adverse supply-side effect may worsen inflation over the longer term.
The hope is that such effects will be avoided by suppressing inflation and helping thereby to maintain business confidence. It is a delicate balancing act for central bankers, who want to constrain inflation but do not want to plunge their economies into recession and damage longer-term increases in potential real GDP.
Most of all, the hope is that by suppressing nominal demand, second-round effects will be avoided. These are where higher prices encourage workers to demand higher wages to compensate for higher prices and businesses to raise prices to cover those wage increases, knowing that they can pass these price increases on to consumers as their competitors are doing the same. This risks creating a damaging wage-price spiral and embedding inflation. By raising interest rates and signalling that they will bring inflation back down to the target rate, central banks hope to anchor long-term inflation expectations. They hope that this will ensure that temporary price shocks do not become permanently embedded in the economy.
Distributional consequences
 However, the burden of higher interest rates will not be shouldered equally. They predominantly penalise a minority of the population, especially younger households with consumer debt and/or large variable-rate mortgages relative to their income or fixed rate mortgages coming the end of their term and requiring renewing. They also penalise businesses which rely on short-term debt.
Meanwhile, people who own their homes outright or wealthy savers may be largely unaffected or even benefit from higher yields on their savings deposits. Similarly, firms with low debt may hardly be affected.
Consequences for servicing public debt
Higher interest rates increase governments’ debt-servicing costs. More has to be paid on new borrowing, either to finance budget deficits or to replace government bonds and bills that are maturing. This consumes a larger share of public spending and limits the fiscal room to support vulnerable households suffering from the price and interest increases.
We examined such costs in the US context in the blog US national debt reaches $40 trillion: but does it matter?.
Fingers crossed!
By being cautious about raising interest rates, central banks hope that geopolitical developments will be favourable and that the supply constraints will diminish. For example, the hope is that there will be a settlement between the USA and Iran that allows oil to flow once more through the Strait of Hormuz. That is why, despite inflation being well above target, central banks have been raising interest rates by just a quarter of a percentage point.
Articles
- US interest rates raised for first time in three years
BBC News, Michael Race (17/9/26)
- What the Fed interest rate hike likely means for borrowers and savers
NBC4 New York, Paul Wiseman (16/9/26)
- How increasing interest rates could reduce inflation, but potentially cause a recession
CNBC, Trina Paul (21/9/26)
- Interest rates held but Bank signals rise if energy prices stay high
BBC News, Dearbail Jordan and Kevin Peachey (17/9/26)
- Bank of England defies Fed’s rate-hike lead, leaving rates unchanged
CNBC, Chloe Taylor (17/9/26)
- ECB hikes rates to 2.5% as energy shock pushes eurozone inflation higher
Euronews, Quirino Mealha (10/9/26)
- Japan raises interest rates to 31-year high to curb impact of rising prices
The Guardian, Mark Sweney (18/9/26)
- What exactly is inflation, and are interest rates the only option for dealing with it?
The Conversation, Luke Hartigan (10/2/26)
- US consumers and businesses are now facing a future of more expensive borrowing
The Conversation, John W Diamond (16/9/26)
- Inflation: raising interest rates was never the right medicine – here’s why central bankers did it anyway
The Conversation, Robert Gausden (20/10/23)
- There are three main reasons inflation is rising. Higher rates won’t fix them
ABC (Australia), Michael Janda (15/9/26)
- Higher interest rates are meant to lower inflation. US economist John Cochrane says there’s only ‘shaky’ evidence it works
ABC (Australia), Michael Janda and Alicia Barry(15/3/24)
- How Governments Fight Inflation with Monetary Policies
Investopedia, Leslie Kramer (11/3/26)
- Interest rates are not the tool to solve the inflation caused by the US’s war with Iran
The Guardian, Josh Ryan-Collins (18/3/26)
- Are higher interest rates the only tool for managing inflation?
Rethinking Economics, Tim Thornton (3/8/23)
Videos
Information
Questions
- What policies have central banks pursued during the Iran war?
- Paint an optimistic scenario for the global economy five years hence.
- Paint a pessimistic scenario for the global economy five years hence.
- Compare the reasons given by the Federal Reserve and ECB for raising interest rates with those given by the Bank of England for not raising them.
- Donald Trump argues for cutting interest rates as a stimulus to the US economy. Provide a critique of this policy.

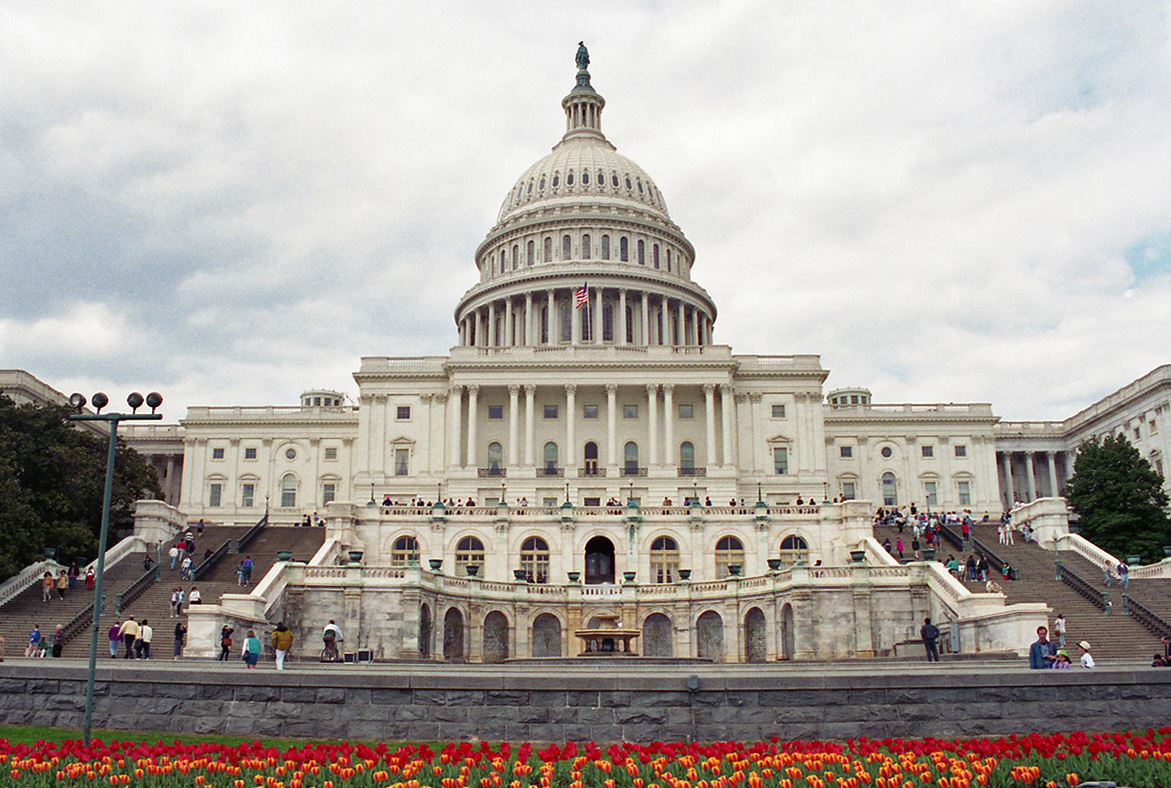
The US national debt hit a milestone in August 2026. It reached a staggering $40 trillion. The national debt is the amount owed by the US federal government to holders of government bonds and bills (treasury securities). The debt grows each year by the size of the annual government deficit, which is the amount that government expenditure exceeds tax and other revenues. The bigger the deficit, the more the national debt grows. The $40 trillion debt represents 126% of GDP – in other words it is more that the total annual output of the USA. It represents around $118,000 per head or $290,000 per household
But does this high and rising debt matter? And how does it compare with other countries?
The comparative size of the national debt
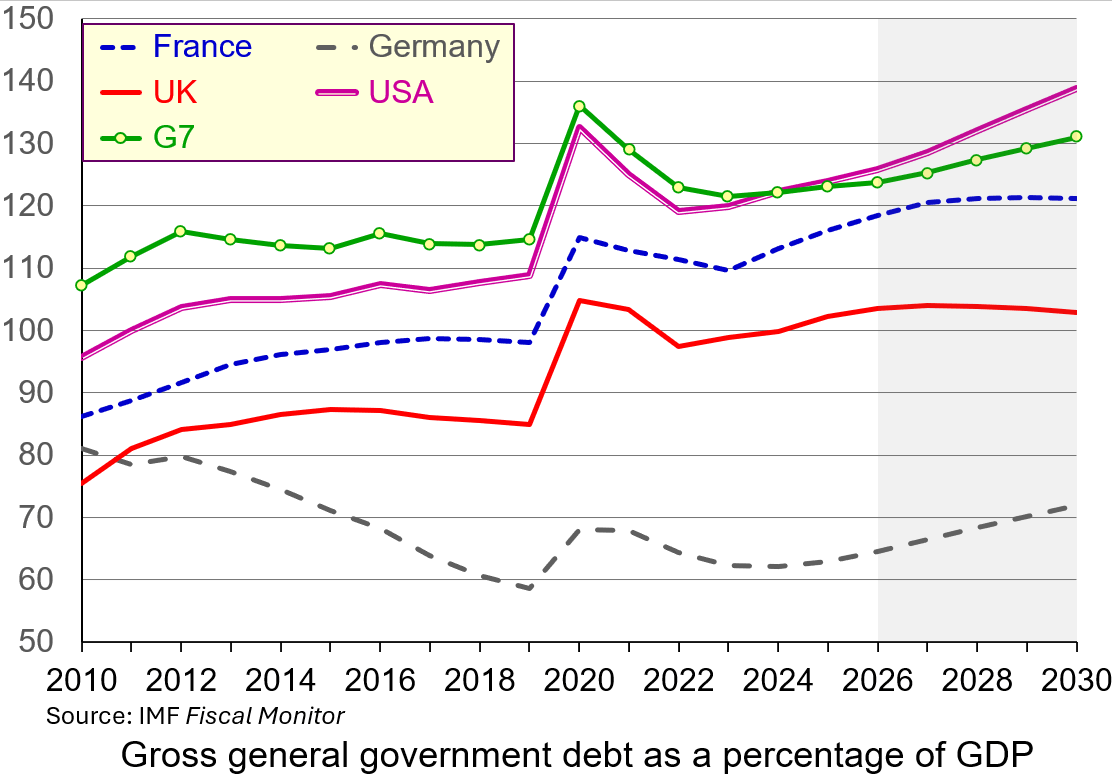 In absolute terms, the US national debt is huge, reflecting, in part, the size of the US economy. In percentage terms (126% of GDP), it is higher than Germany (65%), the UK (104%), Canada (110%) and France (118%) and slightly higher than the G7 average (124%). It is lower, however, than Italy (138%) and much lower than Japan (204%).
What is more, the IMF forecasts that the US national debt will rise from 126% of GDP in 2026 to 139% by 2030. This is because of continuing budget deficits, which require funding. The federal budget deficit is forecast to be around $2 trillion in the financial year ending September 2026 – it was $1.78 trillion in the previous financial year.
Japan’s debt percentage, by contrast, is forecast to fall from 204% in 2026 to 194% by 2030. Also, only about 10% of Japan’s debt is held by foreign investors. Around 90% is financed domestically by Japanese households, local banks, insurance companies, and the Bank of Japan. This makes Japan’s debt more sustainable than the USA’s, where around 28% is held by foreign investors (foreign governments, companies, banks and individuals).
Unlike domestic institutions (such as pension funds), which often have a structural bias to hold domestic assets, foreign investors typically view a country’s bonds as one of many global alternatives and are likely to switch faster to other countries’ assets during periods of market stress. The higher the proportion of bonds held outside the country, the more vulnerable the country is likely to be to bond market speculation.
The UK’s national debt percentage is forecast to fall slightly from 104% of GDP in 2026 to 103% in 2030. However, the UK is a global financial hub and the percentage of debt held by foreign investors (around 30%) is a little higher than in the USA. UK debt held overseas has risen from around 15% in the mid-2000s. It is likely to rise further.
Does high and rising US national debt matter?
 Servicing the debt. In February 2022, the US central bank rate (the Federal Funds rate) was 0.25%. It then rose in increments to combat rising inflation and reached 5.5% by July 2023. Although it has come down slightly since, standing at 3.75% in August 2026, US interest rates are higher now than at any time from 2008 to 2022. With higher interest rates, the USA now pays roughly $1.1 trillion annually just to service the debt. This accounts for around 15% of total federal spending – up from an historical 50-year average of just under 9%.
Upward pressure on domestic borrowing rates. To fund its deficits, the US Treasury Department must continually issue massive amounts of government bonds. This high volume of government borrowing competes for capital in global financial markets, which can push up broader interest rates. For businesses, this imposes a cost on investment and can act as a disincentive to borrow. For consumers, it adds to cost-of-living pressures by raising the cost of mortgages, car loans, credit card debt and other borrowing.
Crowding out other public spending. The money spent on servicing the debt is not available for building roads or other infrastructure, funding education, healthcare or defence, or providing social security. Annual interest payments of around $1.1 trillion now exceed national defence spending (around £960 billion), making it the third-largest item in the federal budget after healthcare and social security. As the national deficits and debt expand, so a higher proportion of current taxes is being used to fund past expenditure.
Long-term fiscal risk
The US dollar is the world’s primary reserve currency. This creates persistent global demand for US debt. However, ratings agencies and other organisations, such as the Congressional Budget Office (CBO), warn that adding $1 trillion to national debt roughly every five months is an unsustainable trajectory that could eventually erode confidence in the US economy.
 Already, many countries are seeking to expand the range of currencies used as reserves, including Chinese yuan, the euro and crypto currencies. They are also holding more gold. In 2001, the US dollar accounted for 72% of currencies held globally as reserves; by 2025 this had fallen to 57%. This process could accelerate as confidence in the USA is eroded because of the size of the debt and the capricious policies towards trade.
During periods of quantitative easing (QE), central banks, including the Fed, purchased large amounts of government bonds. But now, as central banks scale back their bond holdings in programmes of quantitative tightening (QT), foreign private investors and domestic households are being forced to absorb the majority of newly issued government debt, making pricing and yields increasingly sensitive to global investor demands. A decline in confidence can lead to a large sale of bonds, forcing down their price, thereby forcing up their yield and hence the interest that has to be paid on newly issued bonds. This is what happened in the UK in September 2022 under the short-lived administration of Liz Truss when she and her chancellor, Kwasi Kwarteng, made unfunded promises of tax cuts.
The USA is not immune to such bond market jitters. In mid-August, the yield on 30-year US Treasury bonds reached 5.3% – the highest level since 2007.
A worsening problem
 The US deficit is likely to increase, making the national debt rise more rapidly. There are various reasons.
The US population, as in many countries, is ageing and the proportion of retired people is rising. This puts increasing demands on healthcare and social security, with a proportionately smaller workforce to fund them.
The deficit has also been increased by deliberate government policies. For example, Donald Trump’s 2025 ‘One Big Beautiful Bill’ Act made substantial tax cuts, largely for the wealthy.
Congress caps the debt at a certain level and in the past this has acted as a brake on size of the deficit. However, the cap was raised by $5 trillion in 2025 and this could well happen again, allowing debt levels to expand further.
But reining in the deficit could have a contractionary effect on the economy as taxes are raised and/or expenditure is cut. Governments are reluctant to do this as it could lead to recession, or at least falling growth in the short term, and this could affect their chances or re-election. With the mid-terms approaching in the USA, and the presidential election just two years later, this is an unlikely policy for the Trump administration to pursue.
Articles
- Five charts explaining America’s $40 trillion debt
euronews, oloresz Katanich (22/8/26)
- How Much the National Debt Grew Under Trump and Biden
Time, Chantelle Lee (22/8/26)
- 7 questions about the national debt hitting $40 trillion
PBS News, Lisa Desjardins (19/8/26)
- The U.S. National Debt Officially Surpassed $40 Trillion in August: Here’s What History Says This Means for the Stock Market
Yahoo! Finance, Neil Patel, The Motley Fool (24/8/26)
- National debt reaches grim $40 trillion milestone. Here’s why that matters
CNN, Tami Luhby, John Towfighi, Matt Stiles and Amy O’Kruk (20/8/26)
- Jumpy bond markets make it clear: Trump risks driving US into debt crisis
The Guardian, Heather Stewart (23/8/26)
- Is the Trump Treasury panicking over the level of US debt?
The Guardian, Kenneth Rogoff (26/8/26)
- US debt hits $40 trillion: Who does Washington owe and why does it matter?
Aljazeera, Shola Lawal (21/8/26)
- US national debt passes $40tn after doubling in a decade
BBC News, Michael Race and Francisco Velasquez (20/8/26)
- Why the US economy is ringing alarm bells
BBC News, Michael Race (21/8/26)
- The war is raising the price of money. That’s a problem for the global economy
CNN, Matt Egan (2/9/26)
Information
Questions
- Distinguish between national debt, central government debt and general government debt.
- Would it be possible to run a budget deficit and yet for the national debt to fall as a percentage of GDP?
- Japan and Italy have a higher debt to GDP ratio than the USA or the UK. Why are they less subject to bond market pressures than the USA or the UK?
- What policy measures would you recommend to the US government to tackle the rising national debt and why?
- Could the USA ‘grow its way out of the debt problem’?

The yen has been depreciating against the dollar and other currencies for several months. It fell from 100 yen = $0.97 in January 2021 to $0.61 by the end of July 2026 – a fall of 37%. This marked a 40-year low. But then, at the end of July it rallied and by 3 August the rate was 100 yen = $0.64 – a rise of nearly 5%. But why did this happen and what will be the implications for Japan and the wider world economy?
Why has the yen fallen so much since 2021?
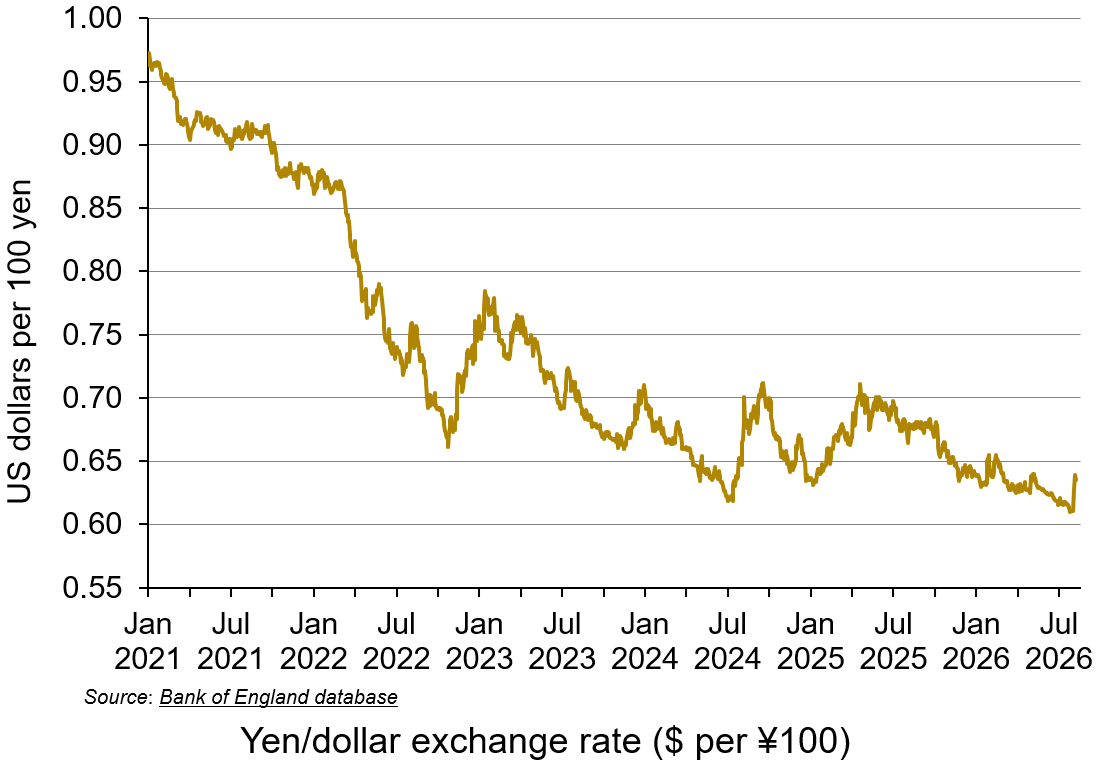 There have been two main drivers.
The first is fiscal policy. For many years, Japan has been pursuing expansionary fiscal policy in an attempt to stimulate the sluggish economy. This has led to large budget deficits and public-sector debt. Since 2020, general government gross debt has been around 255% of GDP, the largest of any high-income economy.
Recently, the Japanese government has adopted aggressive supplementary budgets to fund, among other things, fuel subsidies and public-private investment initiatives. This has involved the issuance of more government bonds to fund the necessary borrowing.
 Fiscal pressures have also increased becase of demography. A rapidly aging population and declining birth rates have required substantial public spending on healthcare, social security and pensions. Meanwhile, the tax-paying working-age population has declined as a proportion of total population.
On the plus side, unlike most highly indebted nations, over 90% of Japan’s debt is held domestically by Japanese residents, Japanese institutional investors, banks and the Bank of Japan (BoJ). This lowers the risk of default and hence the risk premium on Japanese bonds.
 The second driver is monetary policy. Interest rates have been kept low over many years, including periods of negative rates, as the BoJ has attempted to stimulate the economy. Low interest rates have sometimes been backed up with quantitative easing to increase money supply.
Since March 2024, however, there have been four interest rate increases. The latest was in June 2026 when the BoJ raised the short-term policy rate from 0.75% to 1.0% – the highest level since 1995. Despite this, interest rates have remained below those in other countries, and this contributed to the continuing fall of the yen.
A falling yen has helped to increase Japanese exports by making them more competitive, but more expensive imports have contributed to rising Japanese inflation.
Low interest rates have also stimulated the yen-dollar carry trade. This is where investors borrow money in yen at low interest rates, convert it into US dollars and invest it in higher-yielding US assets, typically US government bonds (‘Treasury bonds’). This borrowing in yen to buy dollars further contributed to the depreciation of the yen against the dollar.
Co-ordinated intervention
 In an attempt to raise the value of the yen, the Bank of Japan and the US Federal Reserve acted together – their first joint currency rescue operation since 2011. The BoJ spent tens of billions of dollars to buy yen; the US Treasury bought yen by selling euros. Prior to the intervention, global hedge funds held near-record short positions against the yen, meaning that they sold yen at a current price, agreeing to buy them back at a particular later date, hoping that the yen would fall in the meantime and that they would therefore make a profit. The sudden joint intervention forced these traders to buy back the yen to cut their losses before the rate rose further. This accelerated the yen’s appreciation.
But why did the USA join Japan in intervening? Japan is the largest foreign holder of US Treasuries ($1.1 trillion). The USA intervened to discourage Japanese investors from selling US Treasuries in order to raise cash, thereby pushing up US borrowing costs.
The rise in the yen was also encouraged by speculators who are expecting further interest rate rises from the BoJ to counter inflation and support public finances, driving domestic bond yields higher. This will lead to a narrowing of interest rates between Japan and other countries.
Effects on the Japanese economy
 If the yen continues to appreciate, this will help to reduce inflation by making imports cheaper and will help to ease cost-of-living pressures on Japanese consumers. Japan is heavily reliant on imported energy and raw materials.
However, the decline in the yen over recent years has provided a large boost to Japanese exports. A sharp reversal in this could severely affect exporters’ profits and have a serious negative impact on economic growth.
If the appreciation continues, it would lead to an unwinding of the carry trade. To prevent mounting currency losses, highly leveraged institutional investors would be forced to sell assets, such as US and other countries’ shares and bonds to buy back yen and pay off their debts. This potentially massive unwinding would be likely to create global market volatility and drive up interest rates.
Articles
- Yen holds gains after Japan, US confirm joint intervention, signal more action
Reuters, Makiko Yamazaki and Leika Kihara (3/8/26)
- Yen surges to three-month peak, dollar pares losses after intervention
Reuters, Chibuike Oguh (3/8/26)
- US dollar weakens sharply against the Japanese yen after officials intervene in markets
ABC7 Eyewitness News, Mayuko Ono and Elaine Kurtenbach (3/8/26)
- Yen hits three-month high after Trump helps prop up currency
The Guardian, Graeme Wearden (3/8/26)
- Why has Trump stepped in to prop up Japan’s currency?
The Guardian, Jonathan Yerushalmy (3/8/26)
- Why the U.S. stepped in after decades to prop up Japan’s yen — and what’s at stake
CNBC, Lee Ying Shan (3/8/26)
- Politics & Policy Analysis: How Bessent is pushing Warsh’s Fed to expand backstop for Japan’s yen defense
CNBC, Matt Peterson (3/8/26)
- Why Japan is propping up the yen – and why the US helped
The Straits Times (4/8/26)
- The Pros and Cons of a Strong Dollar
Johnston Investment Counsel (3/8/26)
- Why the U.S. Stepped In to Prop Up Japan’s Yen Currency
Yahoo!Finance, Tiago Ventura (3/8/26)
- Why the U.S. Is Helping Prop Up Japan’s Weak Currency
The New York Times, Eshe Nelson (3/8/26)
- U.S.-Japan Intervention Triggers Yen Carry Trade Fears
The Chosun Daily, Lee Hai-woon (3/8/26)
- What top minds in markets are saying about the US intervention to prop up Japan’s currency
Business Insider, Jennifer Sor (3/8/26)
Data
Questions
- What have been the benefits and costs to Japan of a depreciating exchange rate?
- Explain the carry trade.
- Why might the yen-dollar carry trade unwind and what would be the consequences for Japan and the USA?
- Find out what has happened to the exchange rate between the yen and the euro. Has this been driven by the carry trade?
- For what reasons might the yen (a) now continue rising; (b) resume depreciating?
- Find out what has happened to the yen/dollar exchange rate since this blog was written. Explain your findings.
 With relentless bombing of Iran by Israel and the USA, and with Iranian counterattacks on Gulf states, the costs of the war are mounting. The most obvious are in terms of human lives, injuries and suffering. But there are significant economic costs too. Some of these are immediate, such as the rising price of oil and hence the costs of fuel, or the fall in stock market prices. Some will be longer term, depending on how the war develops. For example, prices could rise more generally as supply chains are disrupted.
 The impacts will vary across the world and across markets. The most obvious markets to be affected are those where significant supply comes from the Persian Gulf. Approximately 20% of total global oil consumption passes through the Strait of Hormuz, which connects the Persian Gulf with the Arabian Sea and the Indian Ocean.
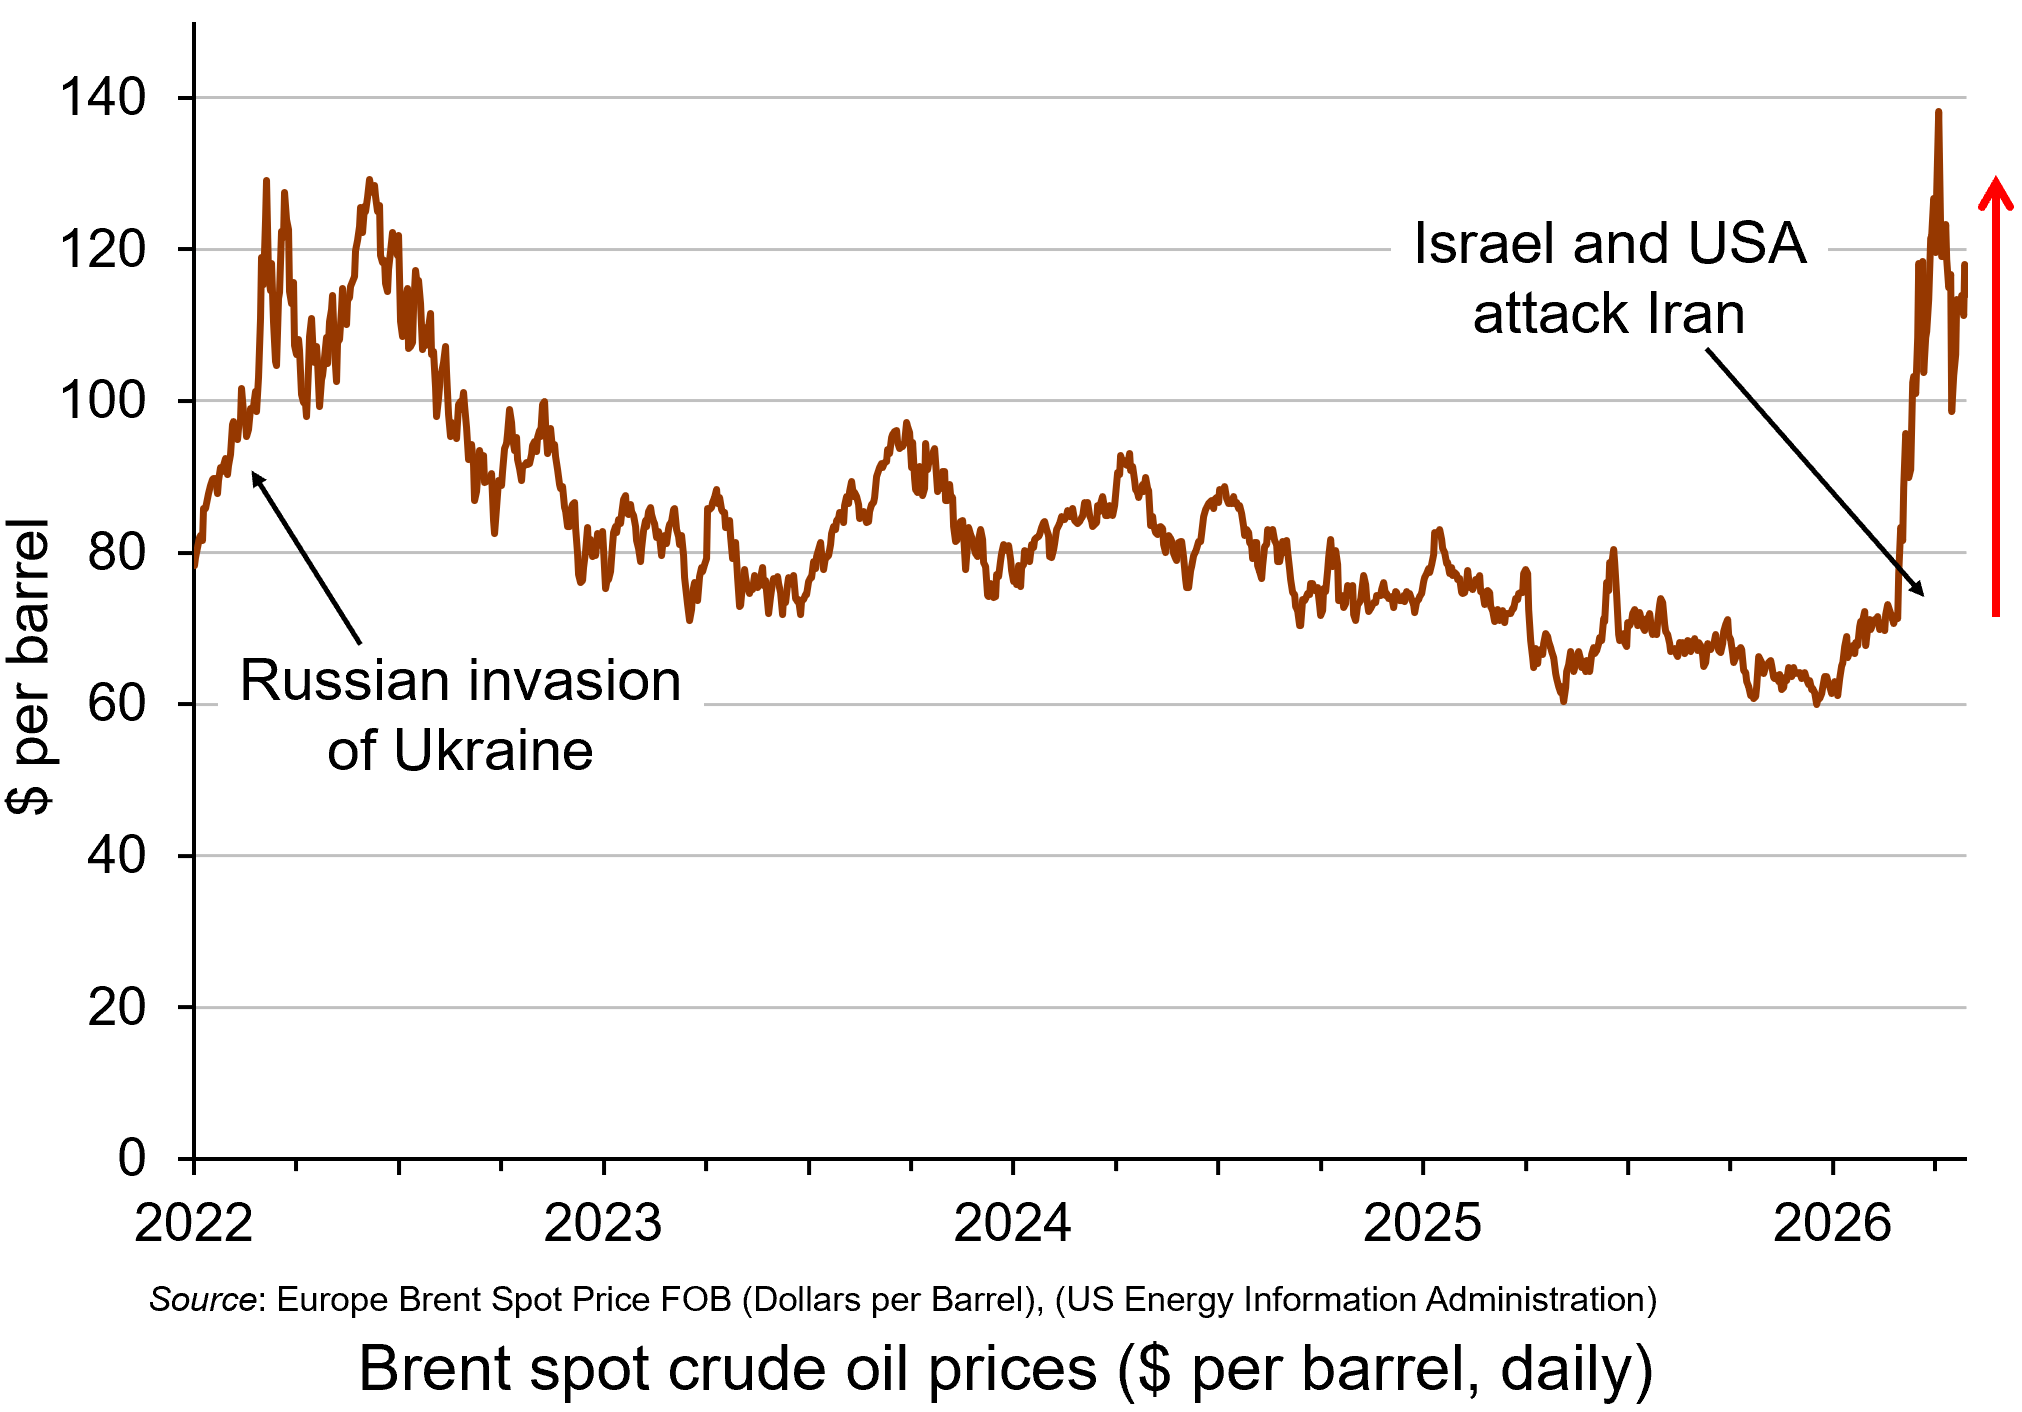
Oil prices rose considerably in the days following the start of the war on 28 February, with Brent crude, a key measure of international oil prices, rising from $71.3 on 27 February to a peak of $119.4 per barrel by the morning of 9 March – a rise of 67%. It was possible that they would rise even further in the short term. However, prices fell back substantially later on 9 March after G7 finance ministers declared that the group ‘stands ready’ to release oil from strategic reserves if needed. By late in the day, the price had fallen to below $85. (Click here for a PowerPoint of the chart.)
However, despite the announcement on 11 March that 32 countries had agreed to release 400m barrels of oil reserves, oil prices began rising again and reached $100 on 12 March after three tankers had been struck in the Gulf, two of them close to the Strait of Hormuz. With Iran pledging to keep the Strait closed, there were worries that the release of oil reserves would provide only temporary relief. Just over 20m barrels of oil normally pass through the Strait of Hormuz. The 400m barrels released from storage is the equivalent, therefore, of only 20 days’ worth of lost oil from the Gulf.
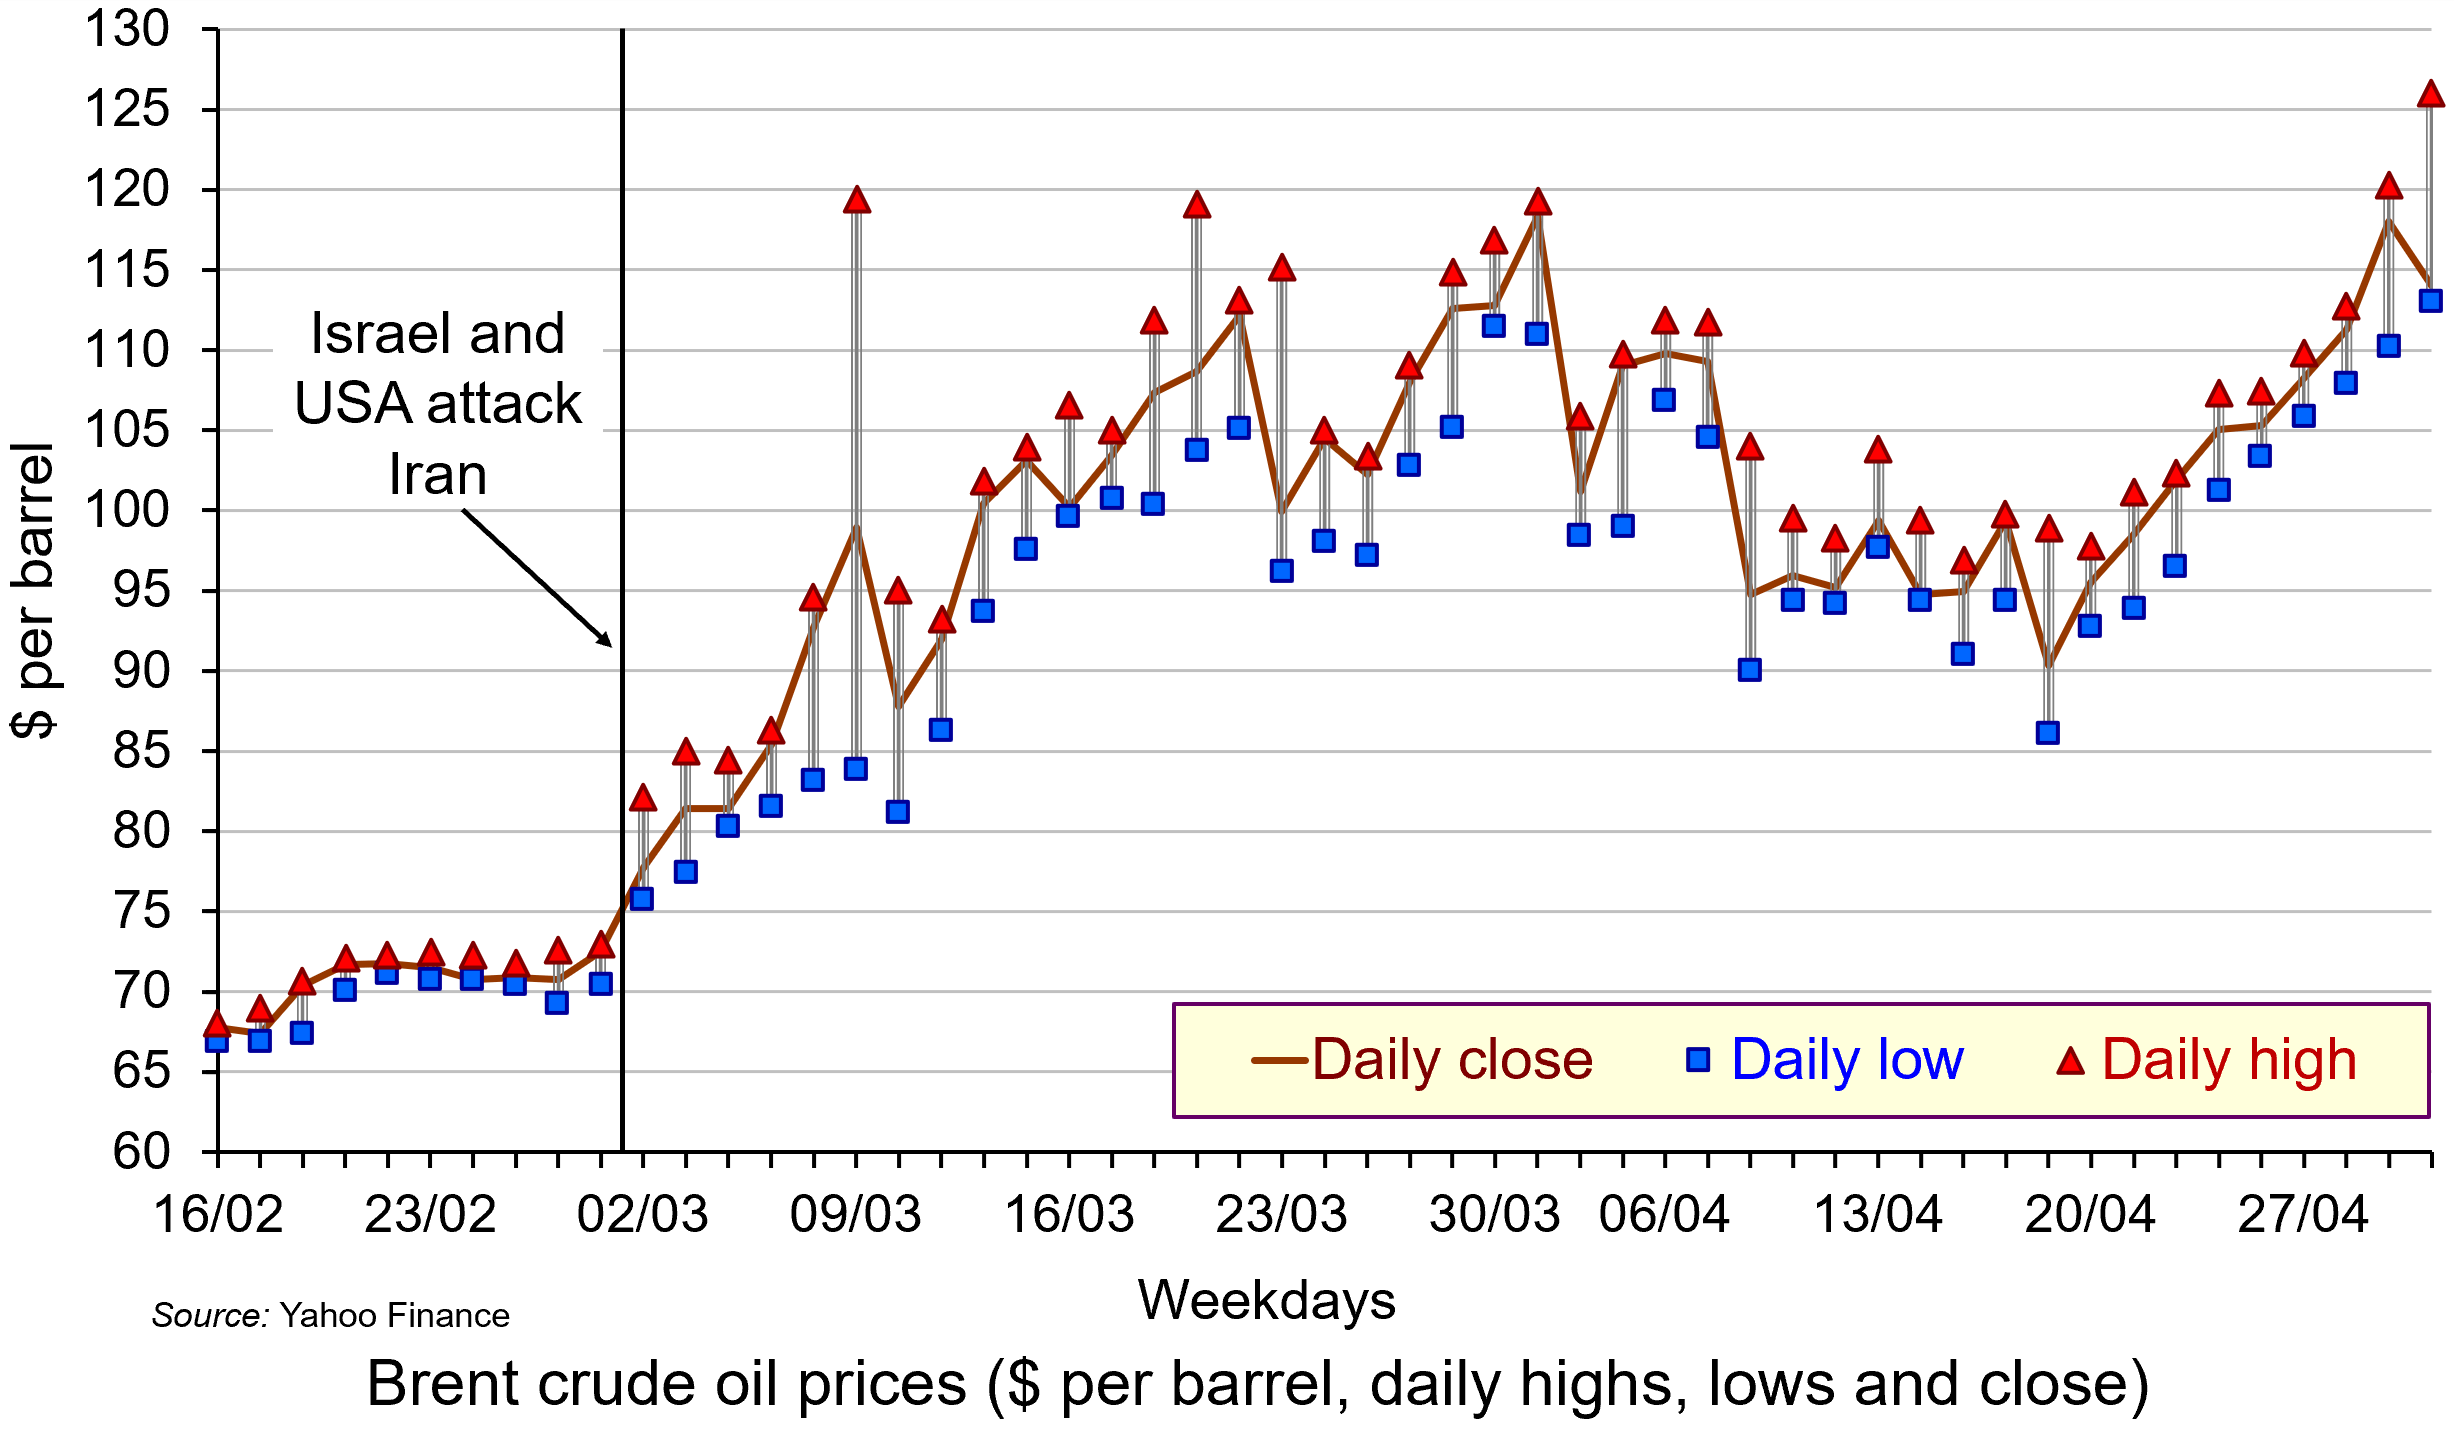
Not only did oil prices rise, but the price became much more volatile as markets reacted to the news on a continuous basis. Intra-day fluctuations in oil prices of several percentage points became typical, reflecting shifting expectations. The second chart shows daily fluctuations, with the highest and lowest prices for each day shown, along with the closing price. (Click here for a PowerPoint.)
The biggest fluctuation had been on 9 March when fears of the closing of the Strait of Hormuz saw the price of Brent crude rising to nearly $120 but falling to around $84 later in the day (a fall of around 30%) after the G7 announcement about releasing reserves.
There was another big fluctuation on 23 March. The previous day (Sunday), President Trump threatened to bomb Iran’s power plants if Iran did not allow free passage of ships through the Strait of Hormuz. Iran threatened to retaliate by striking Gulf countries’ energy and water systems. In early trading on Monday 23rd, Brent crude rose to over $115 per barrel. But later that day, Trump said that there had been constructive talks between the USA and Iran. The oil price immediately dropped to around $96 – a fall of 17% – before settling at around $100.
 Rising oil prices will drive up inflation. For those countries with a heavy dependence on Gulf oil, particularly countries in Asia, there could be significant supply problems. For oil exporters in the Persian Gulf, with tankers unable to traverse the Strait of Hormuz, the economic impact is huge. Oil exporters outside the Gulf, such as Russia, Norway and Canada, however, will gain from the higher prices. Clearly the size of these effects will depend on how long the conflict continues and how long the Strait of Hormuz remains closed.
And it is not just oil that is affected. Other products, such as liquified natural gas (LNG), petrochemicals, industrial materials, fertilizers for food production, medicines, helium for microchip production, metals and minerals are transported through the Strait of Hormuz. Gulf countries import much of their food through the Strait. On 18 March, Israel struck Iran’s huge South Pars gas field off the Gulf coast. This is the largest gas field in the world and is a major source of export revenue for Iran. Iran responded by striking the Qatari gas hub in Ras Laffan. Donald Trump responded by threatening to ‘blow up’ the entire Iranian South Pars gas field if Iran made further strikes on Qatar. The effect of this escalation was to drive oil and gas prices up further. By the week ending 20 March, the oil price closed at just over $112 per barrel.
Cuts in supplies of oil and other products represent an adverse supply shock. Such shocks push up prices (cost-push inflation), while adversely affecting aggregate output. This can lead to stagflation – a combination of higher inflation and stagnation or even falling output. Central banks with a simple mandate to keep inflation to a target are likely to raise interest rates, or at least delay in reducing them. In the USA, with a dual mandate of controlling inflation but also maximising employment, the response may be less deflationary, depending on the judgement of the Federal Reserve.
Uncertainty
 There is great uncertainty about how long the conflict will last. There is also a lack of clarity and consistency from the US administration about its war aims. This uncertainty has affected financial markets, which have seen considerable volatility. Stock markets have seen widespread falls, with airline, travel and AI-heavy stocks being particularly vulnerable.
If the war is concluded relatively swiftly, the economic effects could be relatively small. If the war continues, and especially if the Gulf countries are drawn further into the conflict and if the conflict spreads to other countries, the economic effects could be much more substantial. A prolonged conflict could see oil prices remaining above $100 per barrel, potentially increasing global inflation by 1 percentage point or more. This would slow or halt the move by central banks to cut rates and thereby reduce global economic growth – potentially, as we have seen, leading to stagflation.
The uncertainty was reflected in the decision of the Fed to keep interest rates unchanged at its meeting on 17/18 March. The Fed has the twin targets of keeping inflation close to 2% and maximising employment. Fed Chair, Jay Powell, acknowledged the current tension between the two goals: ‘upward risks for inflation and downward risks for employment, and that puts us in a difficult situation’. He also recognised that the future for inflation and the economy was highly uncertain as the war developed. This made interest rate setting difficult.
Then there is the issue of a potential new international refugee crisis. If the economic and political system in Iran deteriorates rapidly, this could trigger a wave of migration to neighbouring countries, such as Turkey, already hosting large numbers of refugees. Many could seek sanctuary further afield in Europe, with several countries already facing a backlash against immigration. The political and economic effects of this on host countries could be significant – but as yet, highly uncertain.
Articles
- Assessing the global economic impact of the Middle East war
ING, Carsten Brzeski, Warren Patterson, James Knightley and Deepali Bhargava (5/3/26)
- How the Hormuz closure could affect food, medicines and smartphones
BBC News Verify, Ben Chu (27/3/26)
- How will the Iran war affect the global economy?
Chatham House, Neil Shearing (6/3/26)
- ‘The stakes are enormous’: how a prolonged Iran war could shock the global economy
The Guardian, Richard Partington (22/3/26)
- Iran war is latest threat to a global economy rattled by Trump
Aljazeera, John Power (7/3/26)
- Why an Iran war inflation shock could wreck global economic recovery
The Guardian, Phillip Inman and Kalyeena Makortoff (8/3/26)
- Why has the Iran war sparked fears of stagflation for the global economy?
The Guardian, Luca Ittimani (9/2/26)
- Why the price of oil matters more than you might think
BBC News, Natalie Sherman and Mitchell Labiak (10/3/26)
- Strait of Hormuz: Factsheet
IEA (February 2026)
- Could this energy crisis be worse for the global economy than COVID?
The Conversation, Adi Imsirovic (26/3/26)
- Faisal Islam: Oil price spiral may be slowed but not stopped by G7 emergency move
BBC News, Faisal Islam (9/3/26)
- What on earth is going on with the oil price?
BBC News, Jemma Crew (12/3/26)
- Asia scrambles to confront energy crisis unleashed by Iran war – with no end in sight
The Guardian, Callum Jones (12/3/26)
- The grim choice facing the Trump administration: Economic or naval collapse?
CNN, Phil Mattingly and Zachary Cohen (9/3/26)
- Israel strikes Iran’s South Pars gasfield hours after forces kill intelligence minister
The Guardian, Lorenzo Tondo and William Christou (18/3/26)
- What Fed Chair Jerome Powell said — and didn’t say — about the oil crisis
Yahoo Finance, Jake Conley (19/3/26)
- What strikes on the world’s largest natural gas sites could do to the global economy
CNN, Hanna Ziady (19/3/26)
- How the Iran Conflict May Fuel a New International Refugee Crisis
Forbes, Andy J Semotiuk (5/3/26)
- Iran’s neighbours brace for fallout as war threatens new refugee crisis
Aljazeera, Abid Hussain (17/3/26)
- Two months into the Iran war, almost everybody is a loser
CNN, Ivana Kottasová (2/5/26)
Data
Report
Questions
- Who are the biggest gainers and losers from disruption to oil supplies from the Persian Gulf?
- Illustrate the effect of the current oil price shock on an aggregate demand and supply diagram (either static or dynamic).
- Why is the Iranian war likely to be less damaging to the European economy than the Ukrainian war has been?
- Why have AI-related stock prices been vulnerable to the uncertainty caused by the Iranian war?
- How have the Bank of England and the Federal Reserve Bank responded to higher oil prices and the broader economic effects of the war? Why might their responses be different in the coming months?
- What is the likely impact of the Iranian war on global economic recovery?
- How might the Iranian war affect global economic alliances?
- How is the current oil price shock likely to affect the eurozone? Will it be different from the oil price shock that followed the Russian invasion of Ukraine?
- What are the likely economic effects of large-scale migration caused by the war?
 Unemployment in the UK reached its highest level in nearly five years at the close of 2025, according to new data from the Office for National Statistics. Figures show the unemployment rate rising to 5.2% in the three months to December, up slightly from 5.1% in the preceding quarter.
This marks the highest unemployment level since the pandemic, coinciding with a slowdown in wage growth and increasing speculation that interest rates may soon be lowered.
Youth unemployment
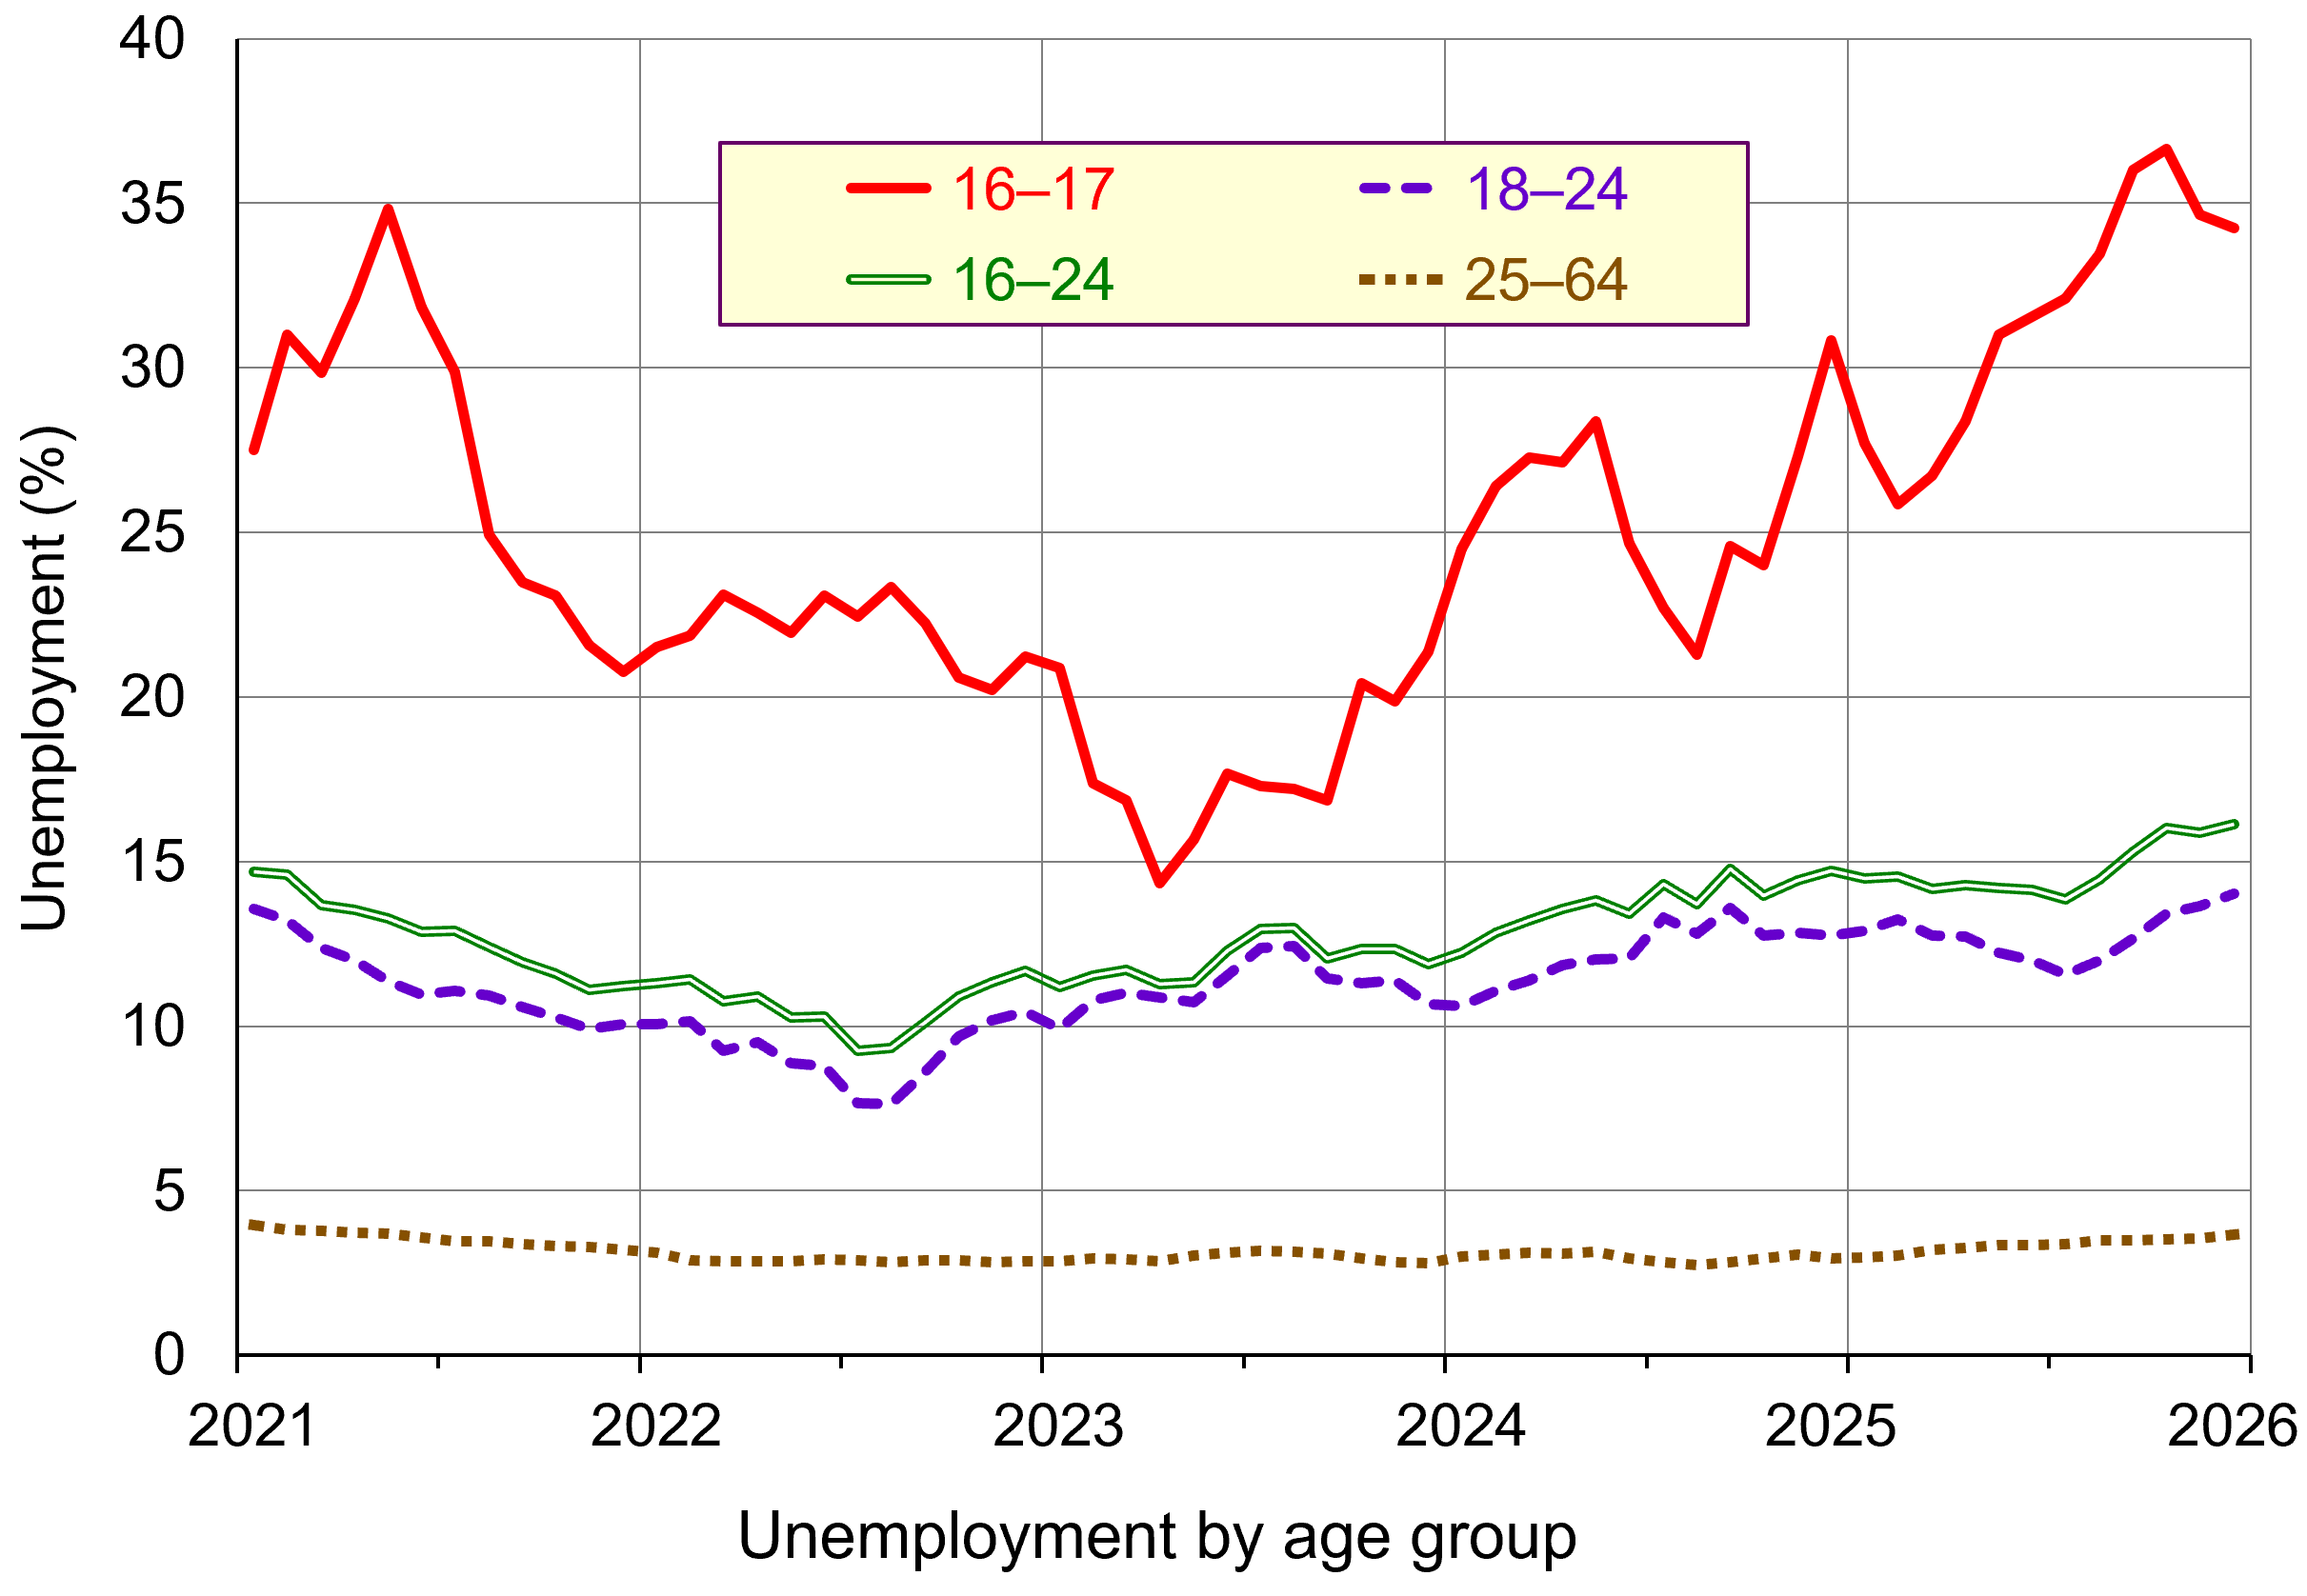 However, young people are taking the heaviest hit, with unemployment climbing to 16.1% among those aged 16 to 24. (Click here for a PowerPoint of the chart.) This is the highest level in more than a decade, including the spike seen during the pandemic. Economists largely attribute this trend to rising payroll costs, which they say are discouraging employers from offering entry level roles. Long-term youth unemployment is also worsening, with recent data showing that a growing share of unemployed young people have been out of work for over 12 months, highlighting deeper and more persistent barriers to re entry.
At the same time, although wages for those in work continue to grow faster than prices, the pace of wage growth is steadily slowing, adding further pressure on young people already facing the most challenging labour market conditions in years. According to ONS data, the annual growth in average weekly wages, excluding bonuses, slowed to 4.2% in the last three months of 2025. Private-sector wage growth eased to 3.4%, bringing it closer to the 3.25% rate that the Bank of England believes is consistent with its 2% inflation target.
The impact on interest rates
 The Bank of England is watching the slowdown in the UK jobs market closely as it gauges when next to lower its interest rates. In February 2026, the Monetary Policy Committee voted to hold the base rate (Bank Rate) at 3.75%. However, the committee voted with a majority of 5-4, with four members voting to reduce the rate to 3.5%.
The Bank of England uses interest rates as a policy tool to control inflation, the rate at which general prices rise in the economy. The current rate of inflation of 3.4% is above the Bank of England’s target of 2%.
In addition to the split vote, some economists believe that the easing in pay growth makes it likely that Bank Rate will be cut at the next meeting on 19th March. Paul Dales, chief UK economist at Capital Economics, said the fall in wage growth ‘supports the idea that the Bank of England has at least a couple more interest rate cuts in its locker’. A decrease in interest rates will be welcomed by investors.
What is behind the increase in youth unemployment?
Young people always tend to be the most impacted by a downturn in hiring. But economists warned that the rise in youth unemployment was a sign that employers are being more cautious about hiring younger workers. Openings for low-skilled entry-level roles and for new graduates have dropped steeply. Many businesses have slowed hiring due to an increase in costs because of measures in Chancellor Rachel Reeves’s last two Budgets. Businesses claim that the combination of increases in employer National Insurance contributions and a rise in the minimum wage mean they are facing higher payroll costs.
Peter Dixon at the National Institute for Economic and Social Research said, ‘there are indications that younger workers in particular are being priced out of the market’, supporting the explanation that raising the minimum wage might also be disincentivising the hiring of young people.
The ONS reported that the retail and wholesale sector saw the biggest fall in the number of workers on company payrolls, with 65,000 jobs lost in the sector since January last year. Meanwhile, health and social work saw the biggest rise in payrolled workers of any sector, adding 39,000 jobs in the year to January. Financial analyst at AJ Bell, Danni Hewson, suggested that those leaving the retail sector were now entering healthcare, with both sectors employing large numbers of women. However, she also warned that a recent surge in investment in artificial intelligence could hit young people the hardest as it could result ‘in a scarcity of entry level posts’ (see the blog Will AI make the world less equal?.
Job vacancies
 Job vacancy data across the UK indicates a significant cooling in labour demand. According to the latest ONS figures, vacancies fell from 736,000 in the three months to December to 726,000 in January, signalling continued weakening in hiring activity. According to the job search site, Adzuna, the number of vacant positions has dropped to its lowest level in five years, with job listings sliding 3% in January to 695,000, marking the first time vacancies have dipped below 700,000 since early 2021. Notably, graduate opportunities have fallen below 10,000 for the first time since Adzuna started tracking in 2016, underscoring the deepening challenges for new entrants to the workforce.
This downward trend in job openings extends patterns seen throughout late 2025, with vacancies down 16% from the previous January and nearly 20% lower than six months earlier. This coincides with a rise in unemployment to 5.2%, slower wage growth, and a growing concern that young people are disproportionately affected as hiring slows. As opportunities shrink, competition has intensified: there are now 2.4 jobseekers per vacancy, up from 2.27 in December, with the most sought-after roles including warehouse staff, healthcare support workers, lorry drivers, labourers and kitchen assistants.
How can the situation be improved?
Pat McFadden, Secretary for Work and Pensions, has commissioned the former Health Secretary Alan Milburn to lead a review into the causes of rising youth inactivity. There will be a particular focus on mental health issues that are pushing young people out of education and employment. This initiative responds to the growing number of young people not in education, employment, or training (NEETs), many of whom are now classified as inactive rather than unemployed. Some receive health-related benefits and are therefore not required to look for work, while others fall outside the benefits system entirely, making them harder to identify and support.
However, Pat McFadden said there was ‘more to do to get people into jobs’, and that tackling youth unemployment is a key government priority. He added that Labour was working to make it easier for young people to find and secure an apprenticeship, supported by a wider package of reforms. The reforms announced by McFadden include creating 50,000 additional apprenticeships. The government will also expand support for 350,000 people to move into work or training in sectors such as care and construction, with the risk of losing benefits if they refuse. They also include the provision of 55,000 state-funded, six-month work placements for the long-term unemployed.
While these measures are widely seen as necessary, campaign groups argue the government should go further by extending its ‘Youth Guarantee’ to cover all young people up to age 24, rather than ending at 22.
 However, as Alice Martin, head of research at Lancaster University’s Work Foundation, notes, initiatives designed to help people return to the labour market have limited impact ‘if the jobs aren’t out there.’ Even graduates are finding that opportunities are scarce, and for those leaving education with few qualifications, the situation is even more challenging. Sectors such as retail, once a reliable source of first jobs, have been in long-term structural decline, a trend that is now accelerating and further narrowing the pathways available to young people entering the workforce.
The situation has prompted government discussions about postponing the planned rise in the minimum wage for 18- to 20-year-olds to address employers’ concerns and encourage more youth employment. However, on Wednesday, Keir Starmer stressed that Labour remains committed to its manifesto pledge to align the pay of younger workers with that of older employees. The Prime Minister confirmed that the promise to ‘remove the discriminatory age bands’ in the minimum wage system still stands, and that the increase scheduled for April will proceed as planned.
Starmer said ‘We’ve made commitments to young people in our manifesto, and we will keep to those commitments, including the commitment that we would make sure that the living wage and minimum wage will go up this April, which we can absolutely confirm to you will happen.’
Unemployment outlook
Multiple economic forecasts predict that unemployment will to continue to rise in 2026. The most frequently cited projection places the 2026 unemployment rate around 5.2%–5.5%. However, some economists expect businesses to regain confidence and begin hiring again later in the year, supporting a gradual stabilisation in job markets.
Yet risks remain significant: if that recovery fails to materialise, unemployment could edge toward 6% by the end of the year, with forecasts from JP Morgan suggesting unemployment may reach 2 million in the first half as firms delay recruitment following the recent rise in the employers’ National Insurance rate. This environment is proving especially challenging for young people, with early career opportunities among the first to disappear and delayed entry into work potentially limiting long-term earnings and progression.
As hiring becomes more cautious and entry-level roles tighten, the path into the labour market risks becoming narrower, underscoring the need for policies and conditions that support both employer confidence and opportunities for new entrants.
Articles
FT Articles (subscribers only)
Data
Questions
- Explain why youth unemployment has risen more sharply than overall unemployment at the end of 2025.
- What are the costs to the individual of being unemployed?
- What are the wider non-monetary costs to society?
- Explain the main financial costs to the wider economy of a rising unemployment rate.
- Assess the likely impact of slowing wage growth on the Bank of England’s decision about whether or not to cut interest rates in early 2026.
- Discuss how falling job vacancies, particularly graduate and entry‑level opportunities, might affect long‑term labour market outcomes for young people.
- Evaluate the effectiveness of government policies such as expanding apprenticeships, increasing work placements, and reviewing youth inactivity in reducing youth unemployment.
 US hikes interest rates as fears grow of global oil shock over Iran War