As we saw in a recent post, Why have diesel prices risen more than petrol prices?, diesel prices have soared since the outbreak of the Iran war at the end of February this year. In the UK, they rose from around 142p just before the US/Israeli attack on Iran to over 200p by the start of October – a rise of around 42%. The rise has been aggravated by threats of Houthi attacks on oil tankers in the Red Sea, Ukrainian attacks on Russian refineries leading to a Russian diesel export ban, a Chinese diesel export ban, refinery shortages in several countries and buoyant industrial, transport and agricultural demand.
 The hope was that the gradual reopening of the Strait of Hormuz would ease oil prices. But despite oil flows increasing from the Gulf, prices have not eased. And with the November mid-term elections approaching in the USA, the Trump administration has been threatening to cut off US diesel exports and divert diesel supplies to the domestic market, thereby reducing diesel prices in the USA. The threats were to put pressure on European countries to tap into their own emergency stocks to ease global diesel prices. By the beginning of October, diesel futures were at record prices.
Then on Friday 2 October, the Group of Seven (G7) nations gave in to pressure from the USA (one of the G7). Co-ordinated by the International Energy Agency (IEA), the G7 announced the release over the next four months of 100 million barrels from reserves, partly of diesel and partly of crude oil. The release would be front loaded to put immediate downward pressure on diesel prices. President Trump stated that a major proportion would be from European stockpiles.
 The IEA had already organised the release of 400 million barrels from stockpiles back in March. However, not all were released because, at the time, the USA was flooding the market with its own diesel to keep the market price down. By the beginning of October, 75 million barrels had yet to be released, but were still considered ‘available’. The new G7 announcement did not make clear whether the 100 million barrels would be in addition to the March agreement or would involve only an additional 25 million barrels.
This promise of an increase in supply had an immediate effect, with US diesel futures falling by around 4.5% and European diesel futures by around 6.5%. But, within a week futures prices were rising again. The extra diesel promised was seen as too little.
Then, on Friday 9 October, in an attempt to drive down diesel prices in the USA, President Trump announced a deal with President Putin. Russia would immediately supply 300,000 tonnes of diesel to the American and global markets, followed by 500,000 tonnes by the end of the month, followed by 1 million and then 3 million more tonnes shortly thereafter. To achieve this, US sanctions against Russian oil exports would be suspended until 7 April 2027.
 This was widely condemned by US Democrats and US allies as providing financial support to Russia for its war against Ukraine. But it was also criticised for being unlikely to bring diesel prices down.
First, there were the logistical difficulties of shipping the Russian oil, let alone Russia’s depleted stocks. In fact, Russia had already instituted a total domestic export ban on diesel to protect its own supplies. There are serious doubts, therefore, as to whether Russia can deliver these additional volumes.
Then there was the size of the deal. The world consumes roughly 840 million to 900 million barrels of diesel per month. In the US context, the initial 300,000 tonnes represents just three-quarters of a single day’s US consumption.
Unless the conflicts and other causes of the underlying shortage of diesel are resolved, the extra diesel will provide only a temporary relief from high prices. Indeed, when markets opened on Monday 12 October, diesel futures prices did not fall but edged upwards and then rose more rapidly the next day.
Articles
 UK diesel prices top £2 a litre for first time, RAC says
BBC News, Lucy Hooker and Archie Mitchell (2/10/26)
- G7 to release millions of barrels of oil and diesel after Trump threat
BBC News, Archie Mitchell and Lucy Hooker (3/10/26)
- Will diesel prices go down? Trump says Europe to draw on reserves
USA Today, Miles J Herszenhorn (2/10/26)
- G7 countries agree on release of diesel and oil stocks after US pressure
Reuters, Kate Abnett and Jarrett Renshaw (2/10/26)
- IEA says 325 million barrels of emergency oil released, with 75 million still to come
Euronews, Simon Ormiston (3/10/26)
- Europe to release ‘massive amount of diesel’ after Trump’s supply threat
Independent, Athena Stavrou (3/10/26)
- Diesel price set to fall after Europe releases supplies
Daily Business, Terry Murden (3/10/26)
- Exclusive: Trump’s Diesel Price Dilemma Isn’t About Supply — Expert Says It’s Because ‘Fuel is in the Wrong Place’
Trading View (3/10/26)
- Trump-Putin Diesel Deal Unlikely To Reduce Prices
Forbes, Ariel Cohen (12/10/26)
- Trump turns to Russian diesel ahead of midterms, but analysts see little price relief
CNBC, Mike Sheen (12/10/26)
- Diesel futures jump, signaling higher prices to come despite Trump’s Russia deal
NBC News, Steve Kopack (13/10/26)
Videos
Data
Questions
- What will determine the size of the effect of the G7’s decision to release stocks of diesel and crude oil?
- How do expectations affect diesel prices – both spot and future prices?
- Why would a diesel export ban by the Trump administration have only a minimal effect on diesel prices in much of the USA?
- Why is lifting sanctions against Russian diesel exports likely to have only a minimal effect on diesel prices?
- What determines the price elasticity of demand for diesel in (a) the short run; (b) over a few years?
The grocery retail market in New Zealand is worth billions of dollars each year and is one of the most concentrated supermarket sectors in the world. The industry is dominated by two large groups: Foodstuffs and Woolworths New Zealand. Together, these firms account for around 80–90 per cent of grocery sales, with Foodstuffs operating brands such as Pak’nSave, New World and Four Square, while Woolworths operates the Woolworths supermarket chain.
The market displays many of the characteristics of an oligopoly. The two dominant firms compete through store location, loyalty schemes, advertising and product range, and to some extent through pricing. At the same time, they benefit from substantial economies of scale, extensive distribution networks and strong relationships with suppliers. These factors mean that there are significant barriers to entry in the market and this can prevent new firms from entering the market and surviving.
Competition concerns
Concern about competition in the sector has led to investigations by New Zealand’s Commerce Commission. The Commission concluded that although there was competition in the market, it was less than optimal and both firms were earning higher profits than they would have been able to earn had they been in operating in a more competitive market.
 It identified various barriers to entry that limited competition, including access to suitable retail sites, ownership of distribution networks and the difficulty of establishing large-scale supply chains in a country with a relatively small population.
Despite the market being dominated by these two big firms, there are also many smaller retailers operating within the market, including independent grocery stores, convenience stores and specialist food retailers. However, they lack the scale that is needed to challenge the dominance of Foodstuffs and Woolworths at a national level.
Potential international entrants, such as Aldi and Lidl, have often been suggested as possible competitors, but the costs of establishing a nationwide network of stores and distribution facilities in New Zealand are significant. There have been examples of large and dominant supermarkets in one country attempting to enter the market in other countries but failing to survive or deciding to exit the market early. For example, Tesco entered the Chinese market in 2004 but, despite its efforts, exited the market in 2020.
Response by the New Zealand government
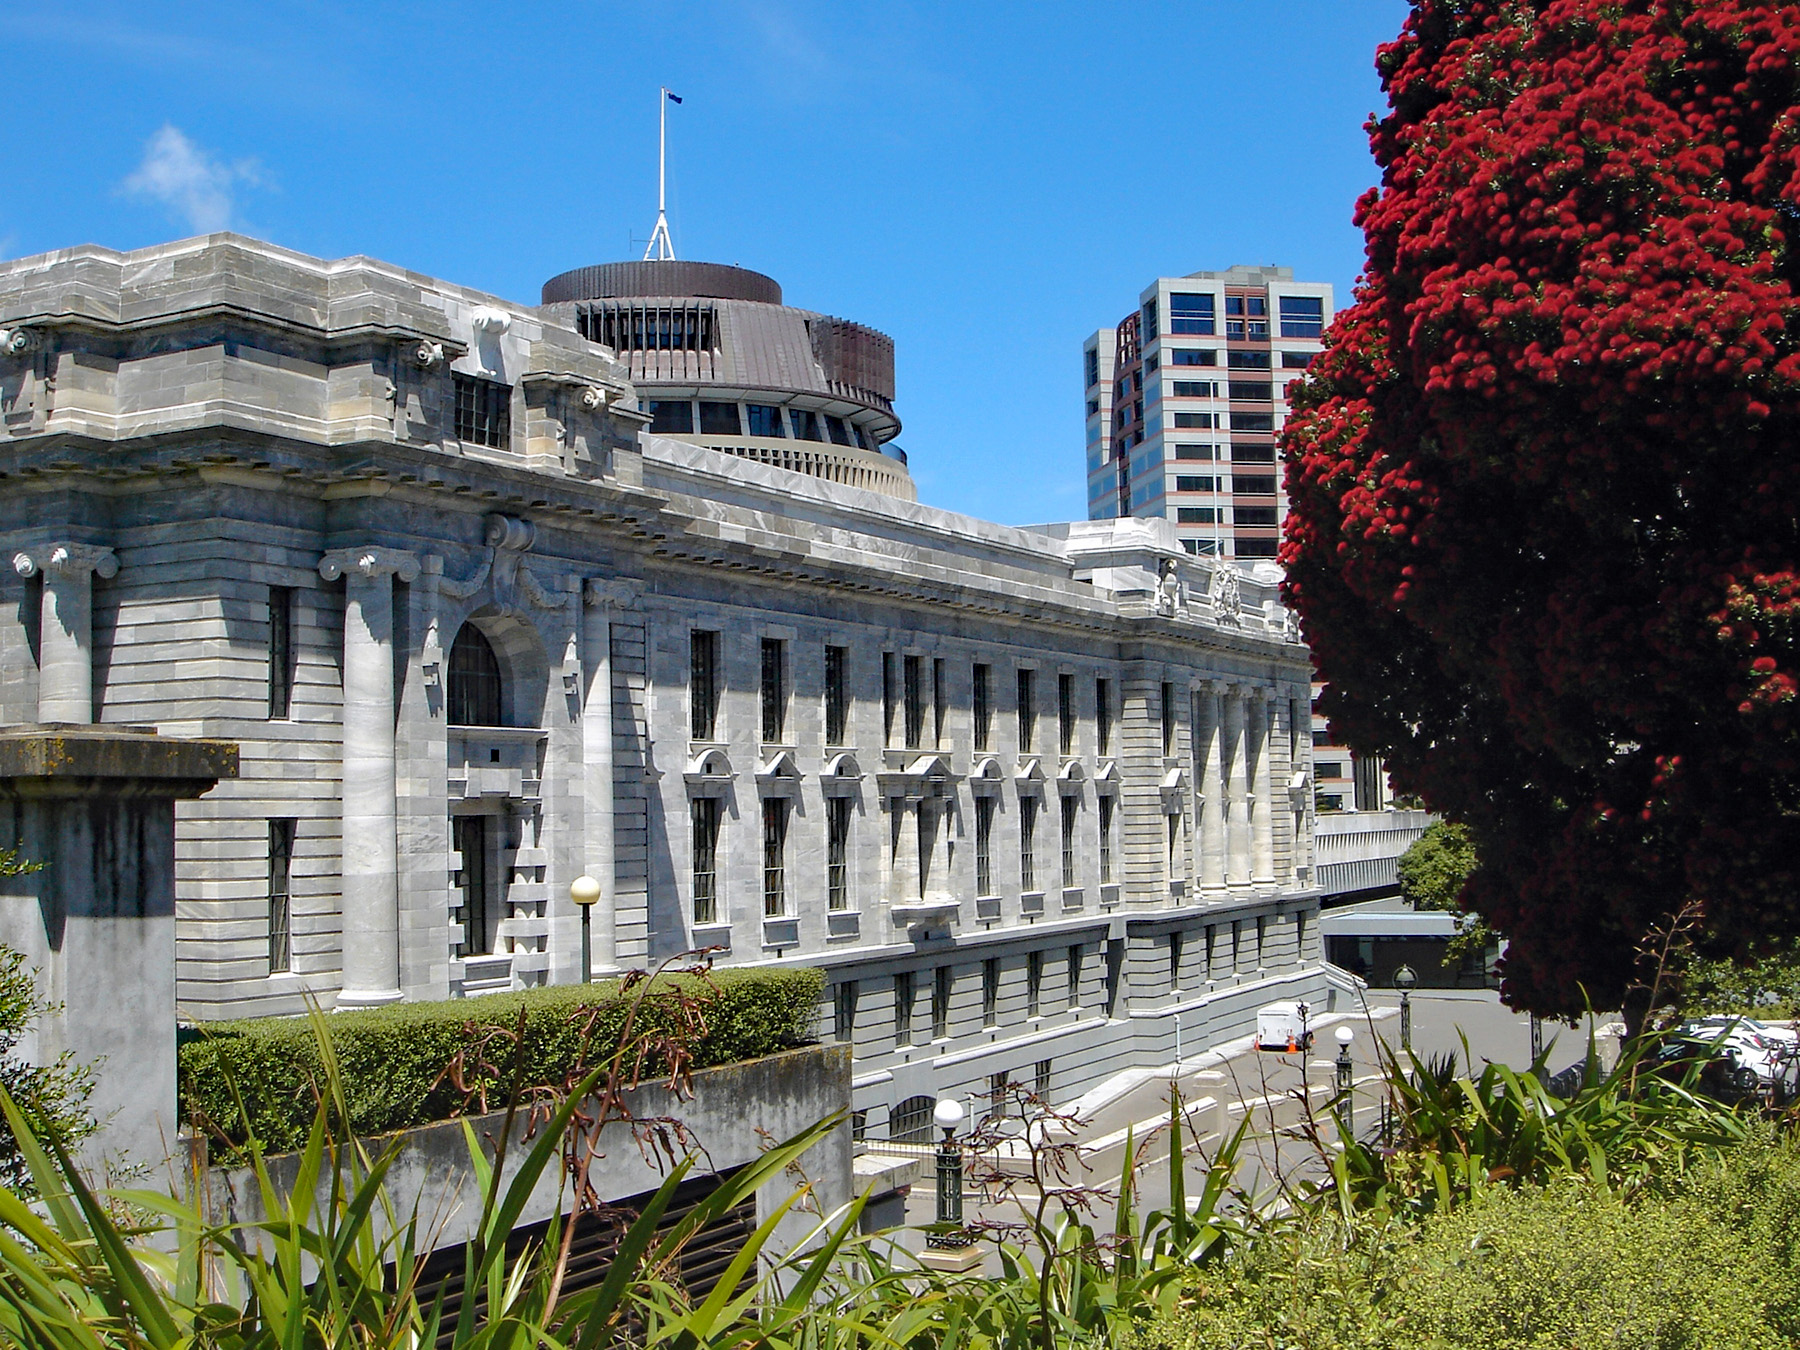 In response to concerns about competition, the New Zealand government has introduced a series of measures designed to make market entry easier. These include restrictions on anti-competitive land covenants, the introduction of a Grocery Commissioner and changes intended to improve access to wholesale grocery supply.
But, despite these measures, recent reports suggest that the overall market structure has changed little, with the two major firms continuing to dominate grocery retailing.
The public interest
Supporters of the current market structure argue that large supermarket chains deliver lower costs through economies of scale and provide consumers with extensive product choice.
Critics counter that limited competition leads to higher prices, reduced innovation and weaker bargaining power for suppliers.
The debate illustrates the difficulties faced by policymakers when attempting to balance efficiency against the promotion of competition.
Whether greater competition will emerge in the future remains uncertain. Much will depend on whether existing reforms can encourage new entrants or whether the structural advantages enjoyed by Foodstuffs and Woolworths continue to deter potential rivals.
Articles
- ‘Substantive, potentially systemic’ supermarket concerns raised by Commerce Commission
RNZ News, Susan Edmunds (7/7/26)
- Supermarkets aren’t the problem. This issue is a far bigger deal
Money Stuff, Rupert Carlyon (23/9/26)
- This may be as good as it gets: NZ and Australia face a complicated puzzle when it comes to supermarket prices
The Conversation, Richard Meade (23/4/25)
- Every party has pitched its own supermarket fix. What if we combined the best ideas?
The Conversation, Jonathan Baker (21/9/26)
- NZ regulator eyes ‘problematic’ supermarket supplier fees
Inside FMCG, Sean Cao (7/7/26)
- Australia vs NZ: Supermarket competition compared
Consumer NZ, Vanessa Pratley (27/3/25)
- Grocery Commissioner puts supermarkets on notice
RNZ News, Susan Edmunds (18/3/26)
- High margins, double the normal returns – does NZ’s supermarket duopoly drive prices up?
The Press, Susan Edmunds (22/9/26)
- Everyone wants to break up the supermarkets. How would it actually work?
The Spinoff, Joel MacManus (22/9/26)
Questions
- What are the characteristics of the New Zealand supermarket industry that create barriers to entry for new firms?
- To what extent is the New Zealand grocery market consistent with the characteristics of an oligopoly?
- Evaluate the likely effectiveness of government measures designed to increase competition in the supermarket sector.
- Australia too has two main supermarket chains: Coles and Woolworths. However, Aldi has entered the Australian market and in some parts of the country had provided significant competition to the two major chians. Why may Aldi have more difficulty in entering the New Zealnd market
- Investigate the grocery retail market in another country (not the UK). Who are the major competitors and what is their market share? What barriers to entry exist? Has the competition authority expressed concerns about the market and if so, what are they?

Artificial intelligence (AI) has become a key technology in the 21st Century. Businesses use AI systems to analyse data, automate routine tasks, improve customer service, write software, create content and even assist with decision-making. As AI improves and becomes even more capable, governments, economists, businesses and society are debating its effects on productivity, employment and economic growth – and also its potentially extreme dangers.
Some commentators compare AI to earlier technological revolutions such as the steam engine, electricity and the Internet. They argue that AI will continue to increase productivity, create new industries and improve living standards. Others worry that AI may eliminate a large numbers of jobs, increase inequality, concentrate economic power in a few firms and, in the most extreme scenarios, pose a threat to humanity itself.
These debates raise important questions including how society should evaluate the potential risks of a technology whose benefits may be enormous but whose long-term consequences remain uncertain.
AI and the labour market
 Historically, technological change has had both positive and negative effects on employment. Automation reduced the demand for many agricultural workers, while creating jobs in manufacturing. Computers automated clerical tasks but generated entirely new industries in software, telecommunications and digital services.
AI appears likely to follow a similar pattern. According to the World Economic Forum, advances in AI, robotics and information-processing technologies are expected to transform labour markets significantly during the second half of the 2020s, creating demand for new skills while reducing demand for others. The fastest-growing skills are expected to include AI and big data, technological literacy and cybersecurity.
The potential benefits
AI may benefit labour markets in several ways:
- Higher productivity: Workers can complete tasks more quickly with AI assistance.
- New occupations: Demand has emerged for AI engineers, prompt specialists, data scientists and AI governance professionals.
- Better decision-making: Firms can use AI to improve forecasting, inventory management and customer service.
- Complementing human skills: AI may perform repetitive tasks, allowing employees to focus on creativity, problem-solving and interpersonal activities.
- Economic growth: Higher productivity can increase profits, wages and living standards over time.
Many economists argue that AI will not simply replace workers but will change the tasks they perform. Research from the OECD suggests that even highly AI-exposed occupations continue to require management, communication, collaboration and social skills that technologies struggle to replicate.
The potential costs
 At the same time, AI may create significant labour-market challenges. Many white-collar occupations previously considered relatively safe from automation are becoming vulnerable. Generative AI systems can draft reports, analyse legal documents, write computer code and create marketing content. This means that some professional and administrative roles may face considerable disruption.
The World Economic Forum reports that business leaders have differing expectations about the effects of AI. In a 2026 survey (see link below), around 54 per cent expected AI to displace existing jobs, while only 24 per cent expected it to create new jobs within their organisations. Economists have identified several potential problems:
- Structural unemployment: workers in industries that are in decline may struggle to find employment requiring their existing skills.
- Increased income inequality: there may be a growing income disparity between highly skilled and less-skilled workers.
- Growing market power: the largest technology firms that own the most advanced AI systems may see their market power grow further creating dominance in certain areas.
- Regional inequalities: AI-related investment may become concentrated in particular cities and countries, exacerbating regional inequalities within and between countries.
- Pressure on governments: to address issues of structural unemployment and increasing inequality, governments may be forced to expand retraining and social-support programmes.
AI and catastrophic risk
 Most economic discussion around AI focuses on employment and productivity. However, some researchers argue that the most significant risks from AI may be much broader.
Economists distinguish between ordinary risks and catastrophic risks. Catastrophic risks involve events with a very low probability of occurring but potentially enormous consequences. Examples include nuclear accidents, pandemics and certain climate-related disasters.
AI raises similar concerns. Advanced AI systems could potentially be used to conduct cyberattacks, spread misinformation, disrupt critical infrastructure or support the development of dangerous technologies. Some researchers have even suggested that highly advanced AI systems could pose an existential risk to humanity if they become sufficiently powerful and are not properly controlled.
This became a widely discussed topic in the media in September 2026 following the resignation of an employee, Jacob Coxon, from AI firm, Anthropic. He said that people working on AI were ‘genuinely frightened’ about how quickly AI was advancing and what it might mean for the future of humanity. He said:
I believe that if we don’t slow down at the current rate of progress, there is a strong chance that we could all die in the immediate future.
Other researchers have raised similar concerns and there have since been calls from some of the biggest AI companies for regulation of AI to prevent this.
The policy debate and CBA
 All of this creates a challenge for cost-benefit analysis. Suppose AI generates trillions of pounds of economic benefits. But, if there is also a very small probability of catastrophic harm, how should policymakers weigh up the two?
Traditional cost-benefit analysis values risk by multiplying the size of a potential outcome by its probability. However, this approach becomes problematic when both the probability and the consequences are highly uncertain. The risks may be extremely difficult to estimate, while the potential costs could be vast and affect future generations. For this reason, governments and firms increasingly use scenario analysis, stress testing and AI safety assessments to evaluate potential risks. These approaches attempt to prepare for extreme outcomes rather than relying solely on probability calculations.
Supporters of AI argue that technological progress has historically improved living standards and that restricting AI too heavily could reduce innovation and economic growth. Critics argue that uncertainty about potentially catastrophic outcomes justifies a more cautious approach.
The debate therefore extends beyond labour economics to the wider issue of managing catastrophic risk. As with nuclear power or climate change, policymakers must decide how much risk society is willing to accept in exchange for potentially large economic benefits.
Articles
- Why are there concerns AI could threaten humanity, and how real are they?
BBC News, Liv McMahon (17/9/26)
- Two dire warnings, one from Terence Tao, the other from someone who just quit Anthropic
Marcus on AI, Gary Marcus (9/9/26)
- AI insiders fear extinction. Security experts see a familiar fight
Scientific American, Peter Hall (11/9/26)
- US rejects pleas from OpenAI, Anthropic for global AI standards
BBC News, Kali Hays (24/9/26)
- How would AI actually kill all humans? Here are the top 5 scenarios
The Conversation, Toby Walsh (22/9/26)
- Who’s Who In The Fight Over Whether AI Will Kill Us
Forbes, Andréa Morris (24/9/26)
- Why this AI doomsday warning from former Anthropic researcher broke through
The Guardian, Blake Montgomery (15/9/26)
 As AI behavior raises concerns, ex-researcher Jacob Coxon warns what may lie ahead
PBS News
- ‘A setup’: Elon Musk fuels wild theory about Anthropic whistleblower Jacob Coxon
ABC News, Harrison Christian (11/9/26)
- Sam Altman, Dario Amodei urge UN Security Council to adopt international AI standards
CNN, Hadas Gold (24/9/26)
- Not everyone thinks AI will kill us all
CNN, Hadas Gold and Clare Duffy (24/9/26)
- The turbulent AI era is here. The choices we make now are critical.
Gates Notes, Bill Gates (26/8/26)
Reports
Questions
- How might AI increase productivity while also causing unemployment in some sectors? Which sectors are likely to be affected the most?
- Why is it difficult to estimate the costs and benefits of advanced AI?
- Assume that a disaster is estimated to cost society £1000 billion (£1 000 000 000 000). The chances of the disaster occurring are said to be minute, however. Estimates vary from a probability of one in a million to one in a billion. What estimate of this cost would you include in a cost–benefit analysis?
- Why are many low-income countries apparently prepared to accept riskier projects than are high-income ones?
- Discuss whether the greatest economic challenge posed by AI is (a) job displacement; (b) increased inequality; (c) market concentration and the power of large technology firms; or (d) catastrophic long-term risks.
- Read the article by Bill Gates, The turbulent AI era is here. The choices we make now are critical. According to him, what steps should the world take to ensure that ‘AI will be a force for good and leave everyone better off’?

Inflation has been rising around the world. The main reason has been the supply shock of rising oil, fertiliser and commodity prices caused by the Iran war and the disruption to global supply chains from conflicts in the Middle East and Russia (see the blog, Why have diesel prices risen more than petrol prices?). Central banks, including the US Federal Reserve Bank, the European Central Bank and the Bank of Japan, have responded to this cost-push inflationary shock by raising interest rates. The Bank of England is likely to raise Bank rate at its next meeting on 5 November 2026.
Similar supply shocks have been experienced in recent years (see the May 2026 blog, Supply shocks – long-term gain from the short-term pain?).
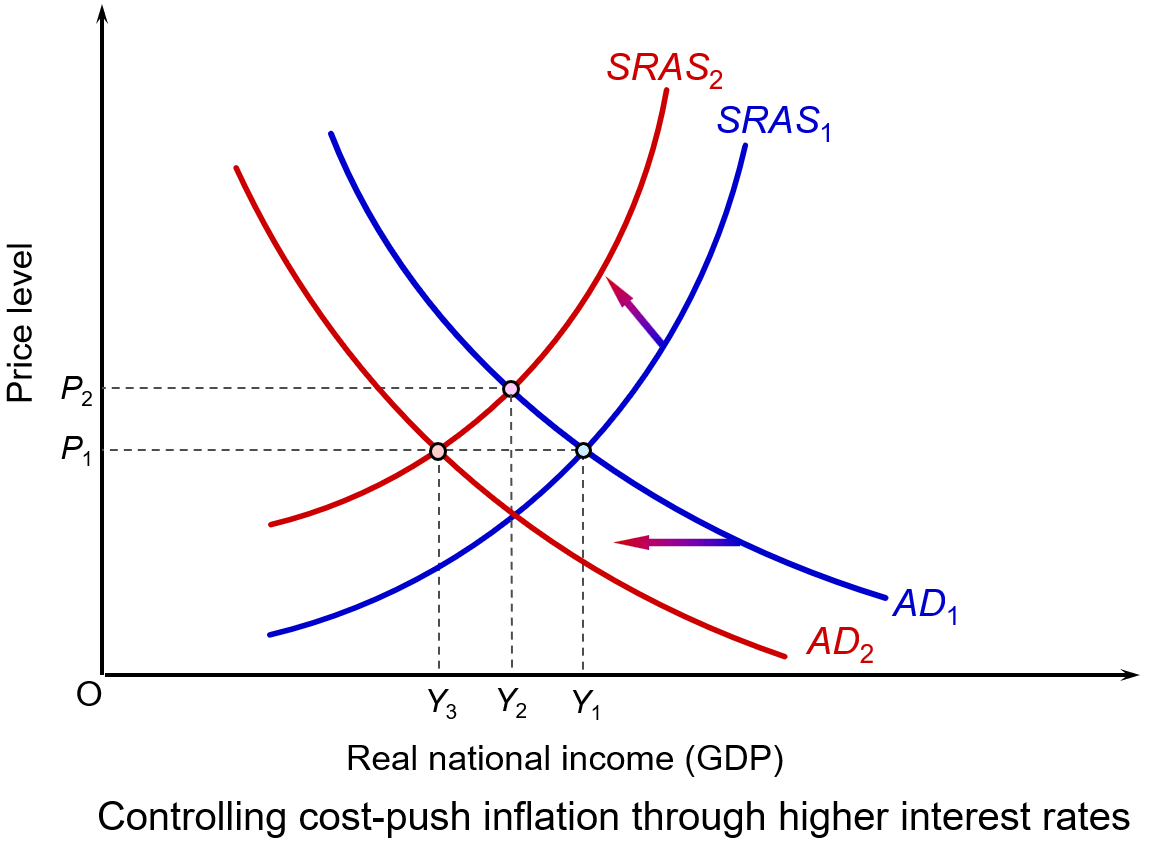 Raising interest rates reduces aggregate demand, or at least its rate of growth. This puts downward pressure on prices, or at least on the rate of inflation. This can be illustrated in the diagram. (Click here for a PowerPoint.)
It shows a country’s initial short-run aggregate supply curve (SRAS1) and initial aggregate demand curve (AD1). The price index is P1 and real GDP is Y1.
The higher costs shift the SRAS curve upwards to the left, say to SRAS2. The price index rises to P2 and real GDP falls to Y2. If, in response to the higher prices, the central bank raises the interest rate, this shifts the aggregate demand curve to the left, say to AD2. As a result, the price index falls back to P1, but the fall in demand causes real GDP to fall further, to Y3.
Policy alternatives
 So, is a rise in interest rates the appropriate response to higher costs that push inflation above, or further above, its target, which for most countries is 2%?
If the cause of inflation was excessive increases in aggregate demand from, say, large government budget deficits or a large increase in consumer demand, then a rise in interest rates would have helped reduce this unsustainable rise in demand. But if the cause of the inflation is a supply shock, is curbing aggregate demand the correct solution?
Ideally, the solution would be to tackle the cost increases directly. A rise in productivity, for example, would help to increase aggregate supply and counter the effect of rising commodity prices. But productivity increases take place over the longer term and are not a solution to a short-term supply shock. Better still, if the increase in commodity prices could be reversed, by finding a political solution that reopened the Strait of Hormuz and other choke points, then higher interest rates would not be needed.
Alternatively, some countries might be able to resort to price controls. These could be targeted at specific sectors such as energy, rent or construction. For example, the UK government has used energy price caps to limit household energy bills.
But even though this may control inflation in the short term, price controls create shortages because demand exceeds the reduced supply. This could lead to higher prices in unofficial markets as people sought to avoid the price controls. It could also create considerable problems for firms planning their logistics when supplies may simply not be available.
Alternatively, subsidies could be used to support output or prices in similar areas. Or they could be targeted at low-income households. These, however, could be costly for governments and may distort markets.
If price controls and subsidies are rejected, and in the absence of short-term increases in aggregate supply, the only solution to inflation is curbing aggregate demand to match the reduced aggregate supply. This could be achieved through fiscal policy by raising taxes or reducing government expenditure, but would prove unpopular and would probably be rejected by governments. Generally, they would prefer to pass the burden to central banks through the use of monetary policy.
The blunt instrument of monetary policy
But, raising interest rates is, indeed, a blunt instrument. Tighter monetary policy cannot increase the global supply of fuel, fix broken supply chains or lower insurance and construction costs. In other words, it cannot directly fix supply shocks, only limit their effect on prices.
 Also, by making borrowing more expensive, higher interest rates may suppress business investment and house building. This adverse supply-side effect may worsen inflation over the longer term.
The hope is that such effects will be avoided by suppressing inflation and helping thereby to maintain business confidence. It is a delicate balancing act for central bankers, who want to constrain inflation but do not want to plunge their economies into recession and damage longer-term increases in potential real GDP.
Most of all, the hope is that by suppressing nominal demand, second-round effects will be avoided. These are where higher prices encourage workers to demand higher wages to compensate for higher prices and businesses to raise prices to cover those wage increases, knowing that they can pass these price increases on to consumers as their competitors are doing the same. This risks creating a damaging wage-price spiral and embedding inflation. By raising interest rates and signalling that they will bring inflation back down to the target rate, central banks hope to anchor long-term inflation expectations. They hope that this will ensure that temporary price shocks do not become permanently embedded in the economy.
Distributional consequences
 However, the burden of higher interest rates will not be shouldered equally. They predominantly penalise a minority of the population, especially younger households with consumer debt and/or large variable-rate mortgages relative to their income or fixed rate mortgages coming the end of their term and requiring renewing. They also penalise businesses which rely on short-term debt.
Meanwhile, people who own their homes outright or wealthy savers may be largely unaffected or even benefit from higher yields on their savings deposits. Similarly, firms with low debt may hardly be affected.
Consequences for servicing public debt
Higher interest rates increase governments’ debt-servicing costs. More has to be paid on new borrowing, either to finance budget deficits or to replace government bonds and bills that are maturing. This consumes a larger share of public spending and limits the fiscal room to support vulnerable households suffering from the price and interest increases.
We examined such costs in the US context in the blog US national debt reaches $40 trillion: but does it matter?.
Fingers crossed!
By being cautious about raising interest rates, central banks hope that geopolitical developments will be favourable and that the supply constraints will diminish. For example, the hope is that there will be a settlement between the USA and Iran that allows oil to flow once more through the Strait of Hormuz. That is why, despite inflation being well above target, central banks have been raising interest rates by just a quarter of a percentage point.
Articles
- US interest rates raised for first time in three years
BBC News, Michael Race (17/9/26)
- What the Fed interest rate hike likely means for borrowers and savers
NBC4 New York, Paul Wiseman (16/9/26)
- How increasing interest rates could reduce inflation, but potentially cause a recession
CNBC, Trina Paul (21/9/26)
- Interest rates held but Bank signals rise if energy prices stay high
BBC News, Dearbail Jordan and Kevin Peachey (17/9/26)
- Bank of England defies Fed’s rate-hike lead, leaving rates unchanged
CNBC, Chloe Taylor (17/9/26)
- ECB hikes rates to 2.5% as energy shock pushes eurozone inflation higher
Euronews, Quirino Mealha (10/9/26)
- Japan raises interest rates to 31-year high to curb impact of rising prices
The Guardian, Mark Sweney (18/9/26)
- What exactly is inflation, and are interest rates the only option for dealing with it?
The Conversation, Luke Hartigan (10/2/26)
- US consumers and businesses are now facing a future of more expensive borrowing
The Conversation, John W Diamond (16/9/26)
- Inflation: raising interest rates was never the right medicine – here’s why central bankers did it anyway
The Conversation, Robert Gausden (20/10/23)
- There are three main reasons inflation is rising. Higher rates won’t fix them
ABC (Australia), Michael Janda (15/9/26)
- Higher interest rates are meant to lower inflation. US economist John Cochrane says there’s only ‘shaky’ evidence it works
ABC (Australia), Michael Janda and Alicia Barry(15/3/24)
- How Governments Fight Inflation with Monetary Policies
Investopedia, Leslie Kramer (11/3/26)
- Interest rates are not the tool to solve the inflation caused by the US’s war with Iran
The Guardian, Josh Ryan-Collins (18/3/26)
- Are higher interest rates the only tool for managing inflation?
Rethinking Economics, Tim Thornton (3/8/23)
Videos
Information
Questions
- What policies have central banks pursued during the Iran war?
- Paint an optimistic scenario for the global economy five years hence.
- Paint a pessimistic scenario for the global economy five years hence.
- Compare the reasons given by the Federal Reserve and ECB for raising interest rates with those given by the Bank of England for not raising them.
- Donald Trump argues for cutting interest rates as a stimulus to the US economy. Provide a critique of this policy.
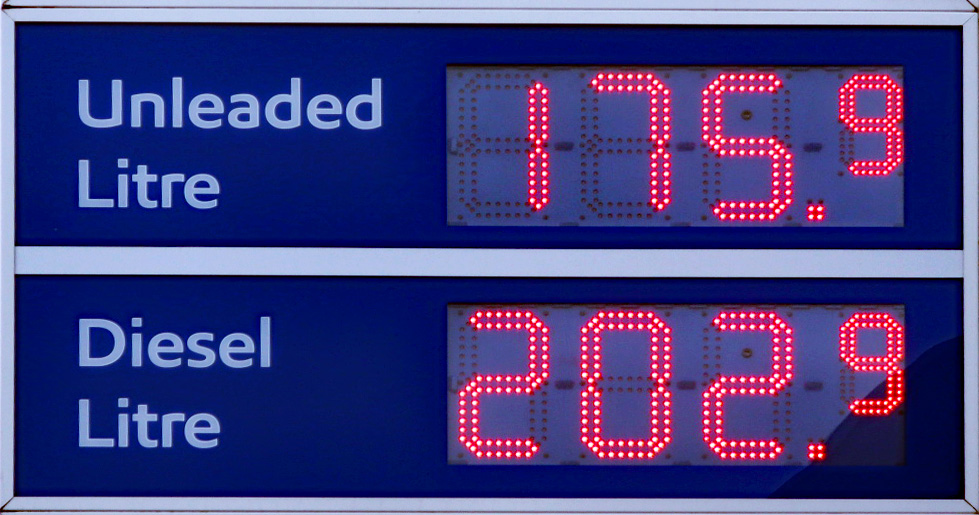
From the start of the American and Israeli war with Iran on 28 February 2026 to 30 September – a period of just seven months – the retail price of petrol in the UK has risen by approximately 43p, from around 132p to 175p per litre – a rise of 33%. In contrast, the price of diesel has risen by approximately 59p, from around 142p to 201p per litre – a rise of 42%. (See also the October 12 post, Diesel prices: an update)
In several other countries the percentage difference is greater still, particularly in countries where fuel taxes are lower and thus the wholesale cost of the fuel is a larger percentage of the pump price. In the USA, for example, petrol (gasoline) prices have risen by around 38%, whereas diesel prices have risen by around 73%.
But why have diesel prices risen by more than petrol prices? The answer has to do with supply and demand.
Supply
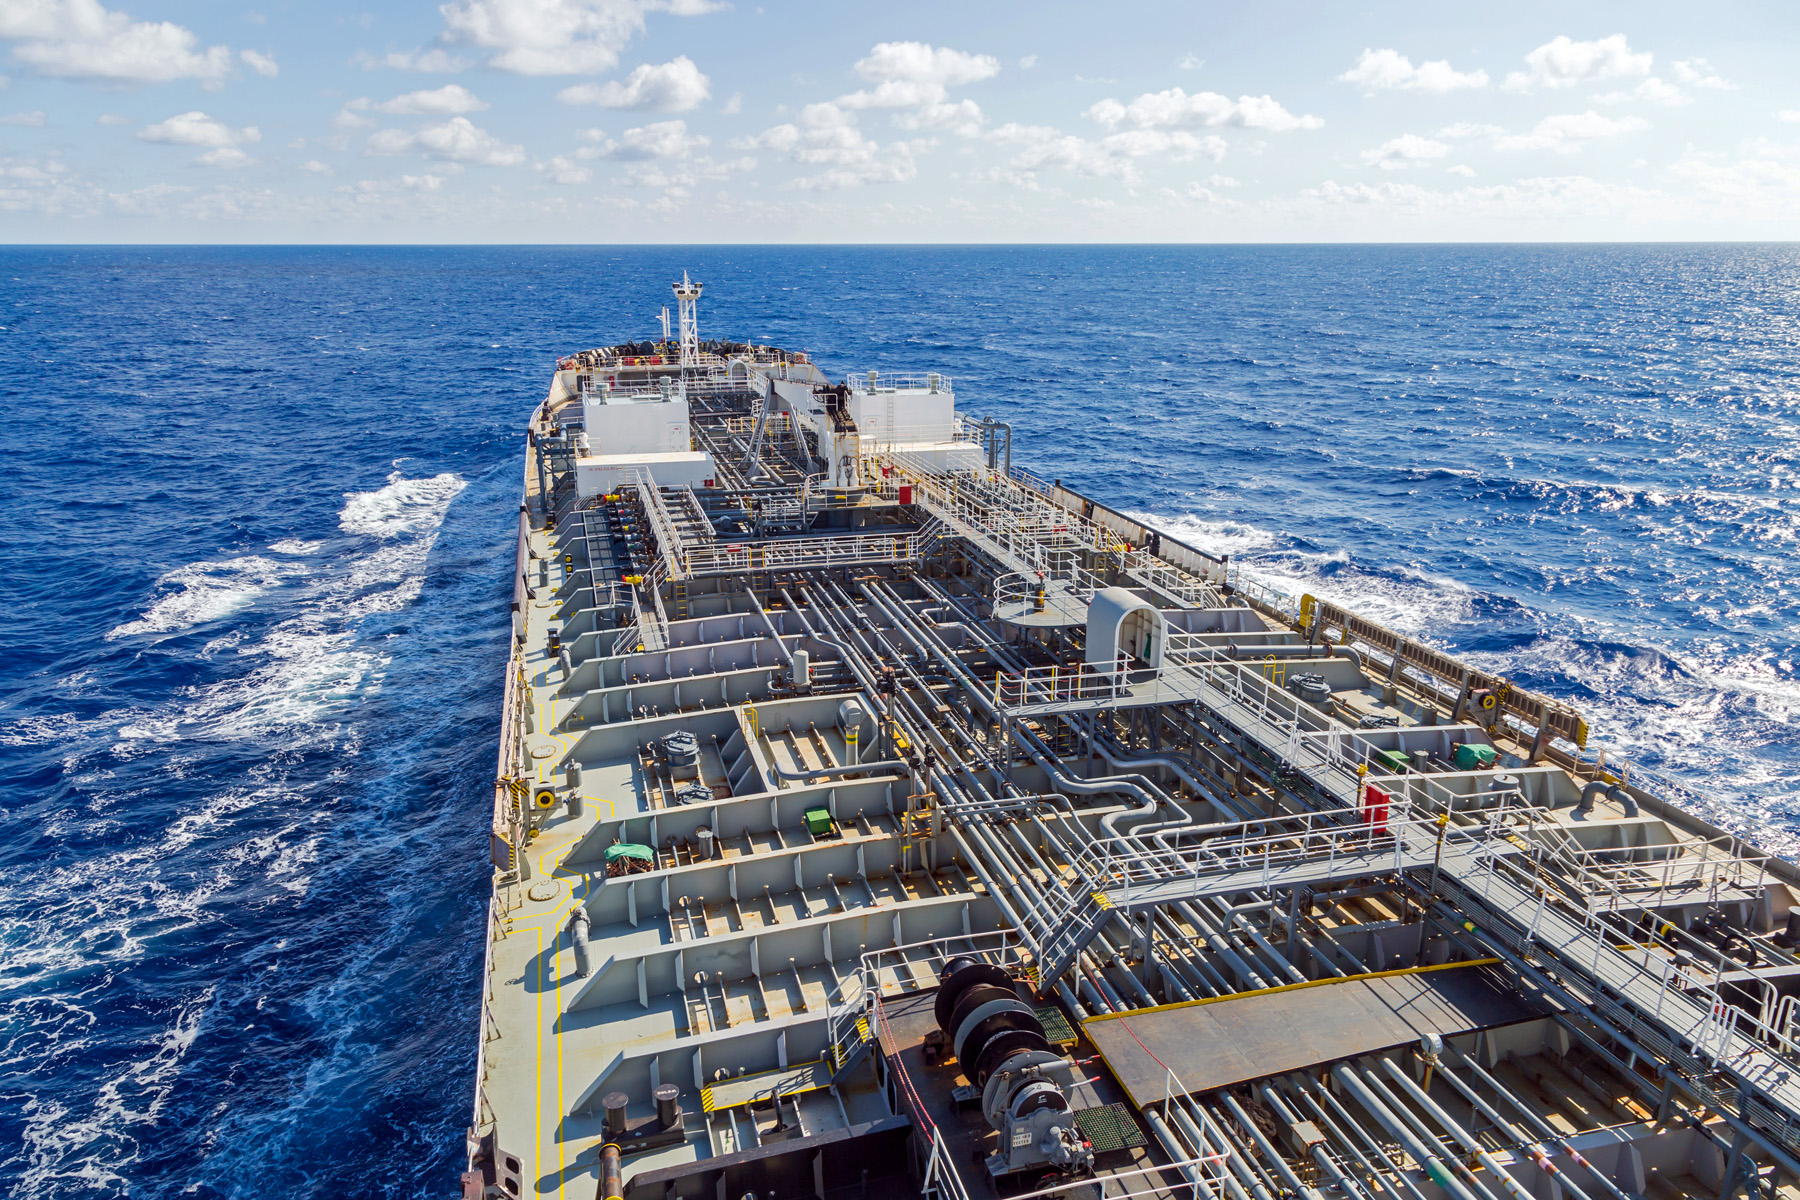 Greater effect of the Iran war on diesel supplies. The closing of the Strait of Hormuz has drastically cut the supply of oil from the Gulf states. This is being compounded by the Houthi attacks on Saudi shipping in the Red Sea. This has forced Saudi oil that is transported by pipeline to the Red Sea and destined for countries east of Saudi Arabia to be transported north via the Suez canal rather than south through the Bab al-Mandab Strait. This has been made worse by attacks launched from Iraq on the Saudi oil pipeline.
Middle Eastern crude oil’s composition is the most efficient for refining high-quality diesel. The restriction on exports, both of crude oil and of diesel from Gulf refineries, has thus affected diesel supplies more than petrol supplies.
Effect of Ukraine war. Ukraine has been launching drone attacks on Russian refineries, mainly producing diesel. The resulting shortage of diesel within Russia has led it to impose a ban on diesel exports, extended at least to the end of 2026, to limit the effects on supplies for the military and for domestic users. Russia has historically been the world’s second-largest diesel exporter and the ban has reduced the world’s supply of seaborne diesel by around 12%.
Low diesel stocks. Stocks of diesel have been run down and this has meant that there is little flexibility to draw them down further.
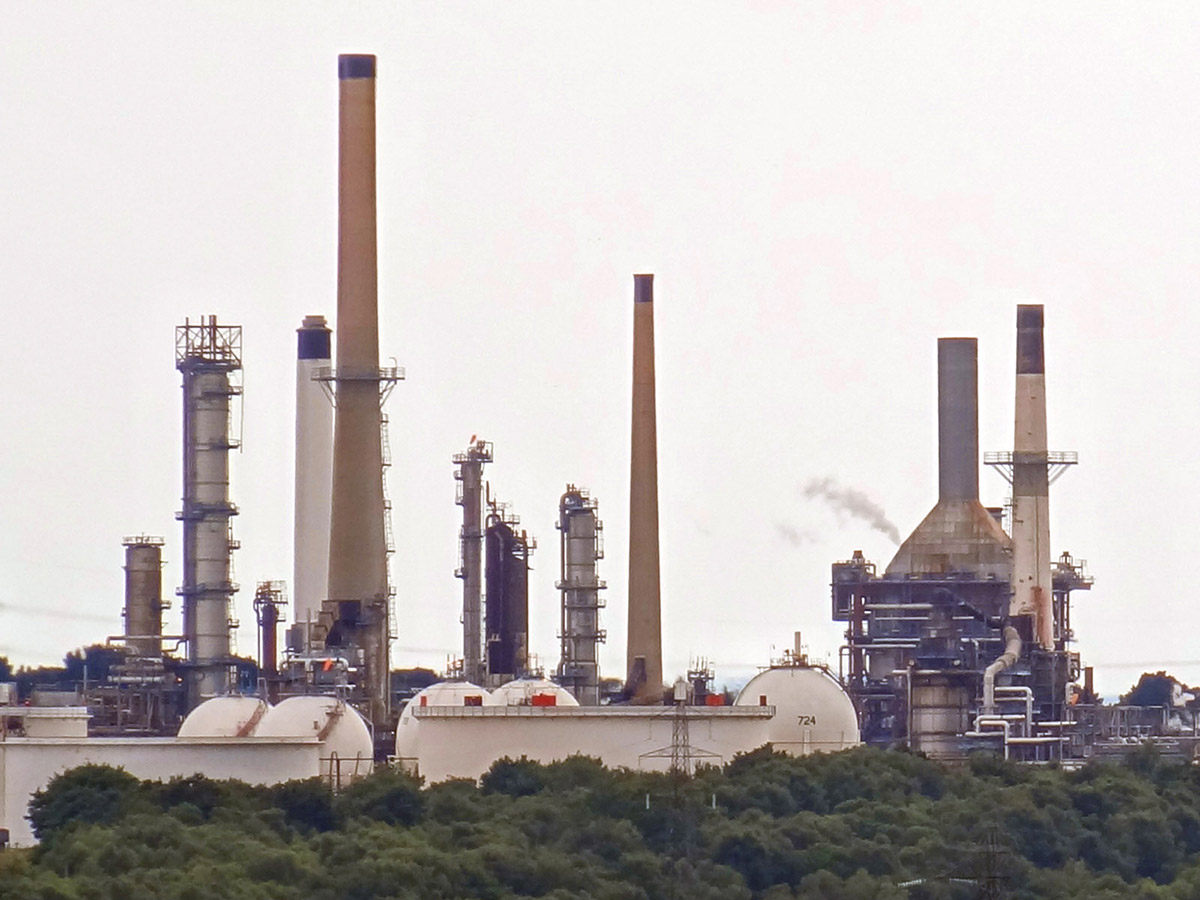 Refinery constraints. Refineries cannot instantly alter their output to produce more diesel. Furthermore, diesel has become more expensive to produce in recent years due to the transition to ultra-low sulphur diesel to meet stricter environmental standards. This makes the supply of diesel relatively price inelastic, exaggerating the effect on price.
UK refineries produce more petrol than the domestic market requires, making the UK a net exporter of petrol. This higher self-sufficiency partially shields domestic petrol prices from global shocks. However, the UK does not refine enough diesel to meet domestic demand. It relies heavily on foreign imports to cover the shortfall. Thus diesel prices in the UK are more subject to global price increases.
Demand
Seasonal demand spikes. The demand for diesel tends to rise in late summer due to extra agricultural demand for autumn crop harvests.
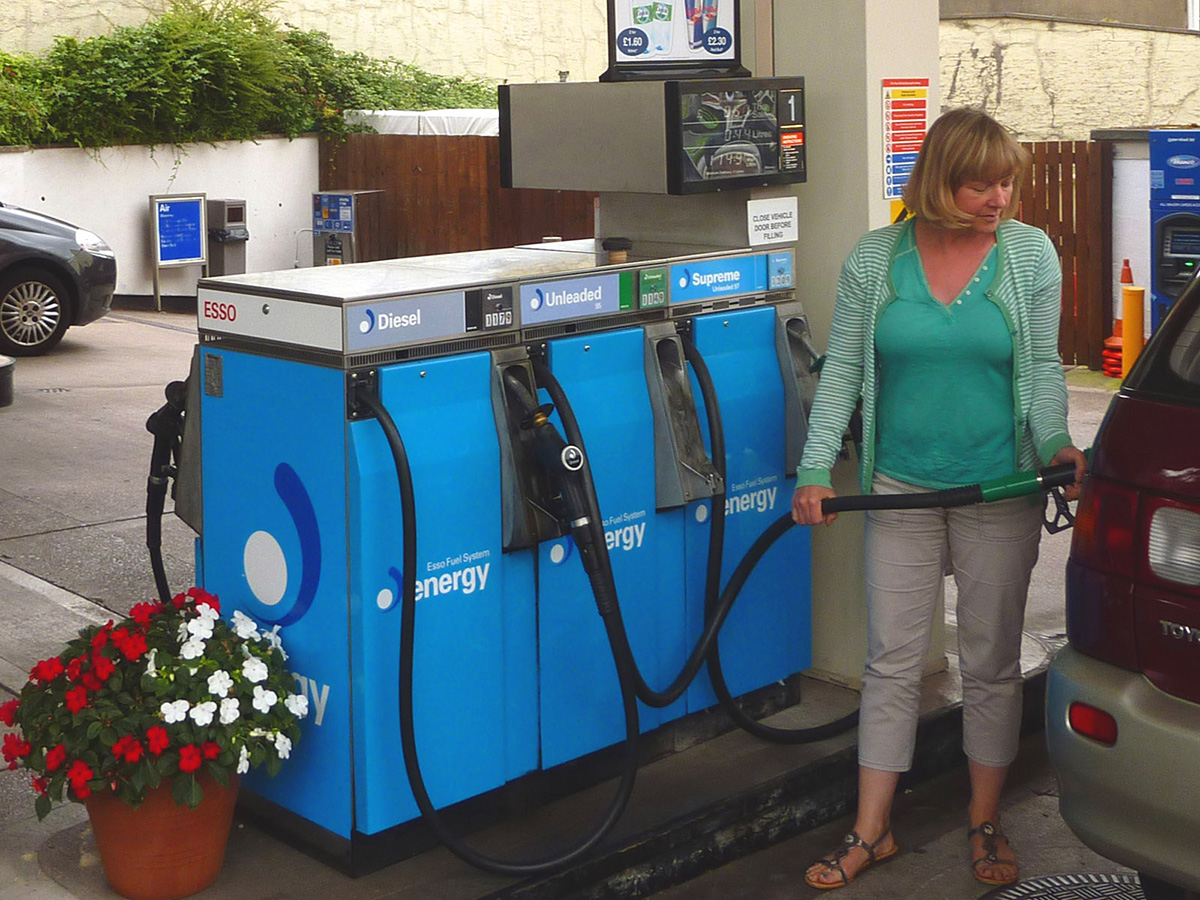 Low price elasticity of demand. Unlike petrol, which is primarily consumed by individuals who can choose to drive less when prices rise, diesel is essential to industrial economies. It powers lorries, ships, buses, trains, agricultural machinery, mining equipment and many industrial machines. Because businesses must keep moving goods, farming crops and running machines, global demand for diesel is little affected by rising prices. This low price elasticity of demand results in a bigger price rise for every reduction in supply than is the case for petrol.
What is more, the transition to EVs has been greater for cars than for lorries, although many buses and vans are now electric. The electrification of the railways, however, is too long-term a project to affect short-term diesel prices and electric lorries are still in their infancy. But with rapid development of electric alternatives underway in the haulage and industrial machinery sectors, they may become less reliant on diesel in the relatively near future.
Articles
- Petrol and diesel prices hit highest since 2022
BBC News (14/9/26)
- Diesel prices hit new record in September 2026: What that means for inflation, shipping costs and your portfolio
J.P.Morgan, Sergei Klebnikov (15/9/26)
- Iran war pushes diesel – the economy’s lifeblood – to record high prices, with no relief on the horizon
The Conversation, Morgan Bazilian and Jamie Webster (18/9/26)
- Diesel costs more than $6 a gallon for the first time. Here’s how that affects you
CNN, Chris Isidore and Matt Egan (12/9/26)
- Why is diesel more expensive than petrol in Australia?
NRMA, Sam Charlwood (9/4/26)
- Diesel Prices Surge as Global Supplies Tighten
Farm Bureau Intel, Faith Parum (17/9/26)
- Why has diesel increased so much more than unleaded?
PetrolPrices (11/3/26)
- Disparity between diesel and petrol prices reaches record-breaking levels
FleetNews, Gareth Roberts (30/3/26)
- Diesel and petrol hit four-year high fuelling inflation concerns
FleetNews, Gareth Roberts (15/9/26)
- EU says Trump plan to ban US diesel exports would ‘negatively impact both sides’
The Guardian, Jillian Ambrose (25/9/26)
Videos
Questions
- Draw a demand and supply diagram for diesel and petrol to illustrate the effects discussed in this blog.
- Is the demand for diesel likely to be more elastic over the longer term? Explain.
- Compare the effects on diesel prices in the UK with one other country of your choice. How similar are the factors affecting the relative price increases in diesel and petrol in the two countries?
- Would cutting taxes on diesel solve the problem of higher prices for diesel users?
- How has the cost of heating oil and aircraft fuel changed compared to that of petrol and diesel? Explain.
- What would be the effects on diesel prices in the UK and the USA if Donald Trump carried out his potential plan to ban US exports of diesel?