
Artificial intelligence (AI) has become a key technology in the 21st Century. Businesses use AI systems to analyse data, automate routine tasks, improve customer service, write software, create content and even assist with decision-making. As AI improves and becomes even more capable, governments, economists, businesses and society are debating its effects on productivity, employment and economic growth – and also its potentially extreme dangers.
Some commentators compare AI to earlier technological revolutions such as the steam engine, electricity and the Internet. They argue that AI will continue to increase productivity, create new industries and improve living standards. Others worry that AI may eliminate a large numbers of jobs, increase inequality, concentrate economic power in a few firms and, in the most extreme scenarios, pose a threat to humanity itself.
These debates raise important questions including how society should evaluate the potential risks of a technology whose benefits may be enormous but whose long-term consequences remain uncertain.
AI and the labour market
 Historically, technological change has had both positive and negative effects on employment. Automation reduced the demand for many agricultural workers, while creating jobs in manufacturing. Computers automated clerical tasks but generated entirely new industries in software, telecommunications and digital services.
AI appears likely to follow a similar pattern. According to the World Economic Forum, advances in AI, robotics and information-processing technologies are expected to transform labour markets significantly during the second half of the 2020s, creating demand for new skills while reducing demand for others. The fastest-growing skills are expected to include AI and big data, technological literacy and cybersecurity.
The potential benefits
AI may benefit labour markets in several ways:
- Higher productivity: Workers can complete tasks more quickly with AI assistance.
- New occupations: Demand has emerged for AI engineers, prompt specialists, data scientists and AI governance professionals.
- Better decision-making: Firms can use AI to improve forecasting, inventory management and customer service.
- Complementing human skills: AI may perform repetitive tasks, allowing employees to focus on creativity, problem-solving and interpersonal activities.
- Economic growth: Higher productivity can increase profits, wages and living standards over time.
Many economists argue that AI will not simply replace workers but will change the tasks they perform. Research from the OECD suggests that even highly AI-exposed occupations continue to require management, communication, collaboration and social skills that technologies struggle to replicate.
The potential costs
 At the same time, AI may create significant labour-market challenges. Many white-collar occupations previously considered relatively safe from automation are becoming vulnerable. Generative AI systems can draft reports, analyse legal documents, write computer code and create marketing content. This means that some professional and administrative roles may face considerable disruption.
The World Economic Forum reports that business leaders have differing expectations about the effects of AI. In a 2026 survey (see link below), around 54 per cent expected AI to displace existing jobs, while only 24 per cent expected it to create new jobs within their organisations. Economists have identified several potential problems:
- Structural unemployment: workers in industries that are in decline may struggle to find employment requiring their existing skills.
- Increased income inequality: there may be a growing income disparity between highly skilled and less-skilled workers.
- Growing market power: the largest technology firms that own the most advanced AI systems may see their market power grow further creating dominance in certain areas.
- Regional inequalities: AI-related investment may become concentrated in particular cities and countries, exacerbating regional inequalities within and between countries.
- Pressure on governments: to address issues of structural unemployment and increasing inequality, governments may be forced to expand retraining and social-support programmes.
AI and catastrophic risk
 Most economic discussion around AI focuses on employment and productivity. However, some researchers argue that the most significant risks from AI may be much broader.
Economists distinguish between ordinary risks and catastrophic risks. Catastrophic risks involve events with a very low probability of occurring but potentially enormous consequences. Examples include nuclear accidents, pandemics and certain climate-related disasters.
AI raises similar concerns. Advanced AI systems could potentially be used to conduct cyberattacks, spread misinformation, disrupt critical infrastructure or support the development of dangerous technologies. Some researchers have even suggested that highly advanced AI systems could pose an existential risk to humanity if they become sufficiently powerful and are not properly controlled.
This became a widely discussed topic in the media in September 2026 following the resignation of an employee, Jacob Coxon, from AI firm, Anthropic. He said that people working on AI were ‘genuinely frightened’ about how quickly AI was advancing and what it might mean for the future of humanity. He said:
I believe that if we don’t slow down at the current rate of progress, there is a strong chance that we could all die in the immediate future.
Other researchers have raised similar concerns and there have since been calls from some of the biggest AI companies for regulation of AI to prevent this.
The policy debate and CBA
 All of this creates a challenge for cost-benefit analysis. Suppose AI generates trillions of pounds of economic benefits. But, if there is also a very small probability of catastrophic harm, how should policymakers weigh up the two?
Traditional cost-benefit analysis values risk by multiplying the size of a potential outcome by its probability. However, this approach becomes problematic when both the probability and the consequences are highly uncertain. The risks may be extremely difficult to estimate, while the potential costs could be vast and affect future generations. For this reason, governments and firms increasingly use scenario analysis, stress testing and AI safety assessments to evaluate potential risks. These approaches attempt to prepare for extreme outcomes rather than relying solely on probability calculations.
Supporters of AI argue that technological progress has historically improved living standards and that restricting AI too heavily could reduce innovation and economic growth. Critics argue that uncertainty about potentially catastrophic outcomes justifies a more cautious approach.
The debate therefore extends beyond labour economics to the wider issue of managing catastrophic risk. As with nuclear power or climate change, policymakers must decide how much risk society is willing to accept in exchange for potentially large economic benefits.
Articles
- Why are there concerns AI could threaten humanity, and how real are they?
BBC News, Liv McMahon (17/9/26)
- Two dire warnings, one from Terence Tao, the other from someone who just quit Anthropic
Marcus on AI, Gary Marcus (9/9/26)
- AI insiders fear extinction. Security experts see a familiar fight
Scientific American, Peter Hall (11/9/26)
- US rejects pleas from OpenAI, Anthropic for global AI standards
BBC News, Kali Hays (24/9/26)
- How would AI actually kill all humans? Here are the top 5 scenarios
The Conversation, Toby Walsh (22/9/26)
- Who’s Who In The Fight Over Whether AI Will Kill Us
Forbes, Andréa Morris (24/9/26)
- Why this AI doomsday warning from former Anthropic researcher broke through
The Guardian, Blake Montgomery (15/9/26)
 As AI behavior raises concerns, ex-researcher Jacob Coxon warns what may lie ahead
PBS News
- ‘A setup’: Elon Musk fuels wild theory about Anthropic whistleblower Jacob Coxon
ABC News, Harrison Christian (11/9/26)
- Sam Altman, Dario Amodei urge UN Security Council to adopt international AI standards
CNN, Hadas Gold (24/9/26)
- Not everyone thinks AI will kill us all
CNN, Hadas Gold and Clare Duffy (24/9/26)
- The turbulent AI era is here. The choices we make now are critical.
Gates Notes, Bill Gates (26/8/26)
Reports
Questions
- How might AI increase productivity while also causing unemployment in some sectors? Which sectors are likely to be affected the most?
- Why is it difficult to estimate the costs and benefits of advanced AI?
- Assume that a disaster is estimated to cost society £1000 billion (£1 000 000 000 000). The chances of the disaster occurring are said to be minute, however. Estimates vary from a probability of one in a million to one in a billion. What estimate of this cost would you include in a cost–benefit analysis?
- Why are many low-income countries apparently prepared to accept riskier projects than are high-income ones?
- Discuss whether the greatest economic challenge posed by AI is (a) job displacement; (b) increased inequality; (c) market concentration and the power of large technology firms; or (d) catastrophic long-term risks.
- Read the article by Bill Gates, The turbulent AI era is here. The choices we make now are critical. According to him, what steps should the world take to ensure that ‘AI will be a force for good and leave everyone better off’?
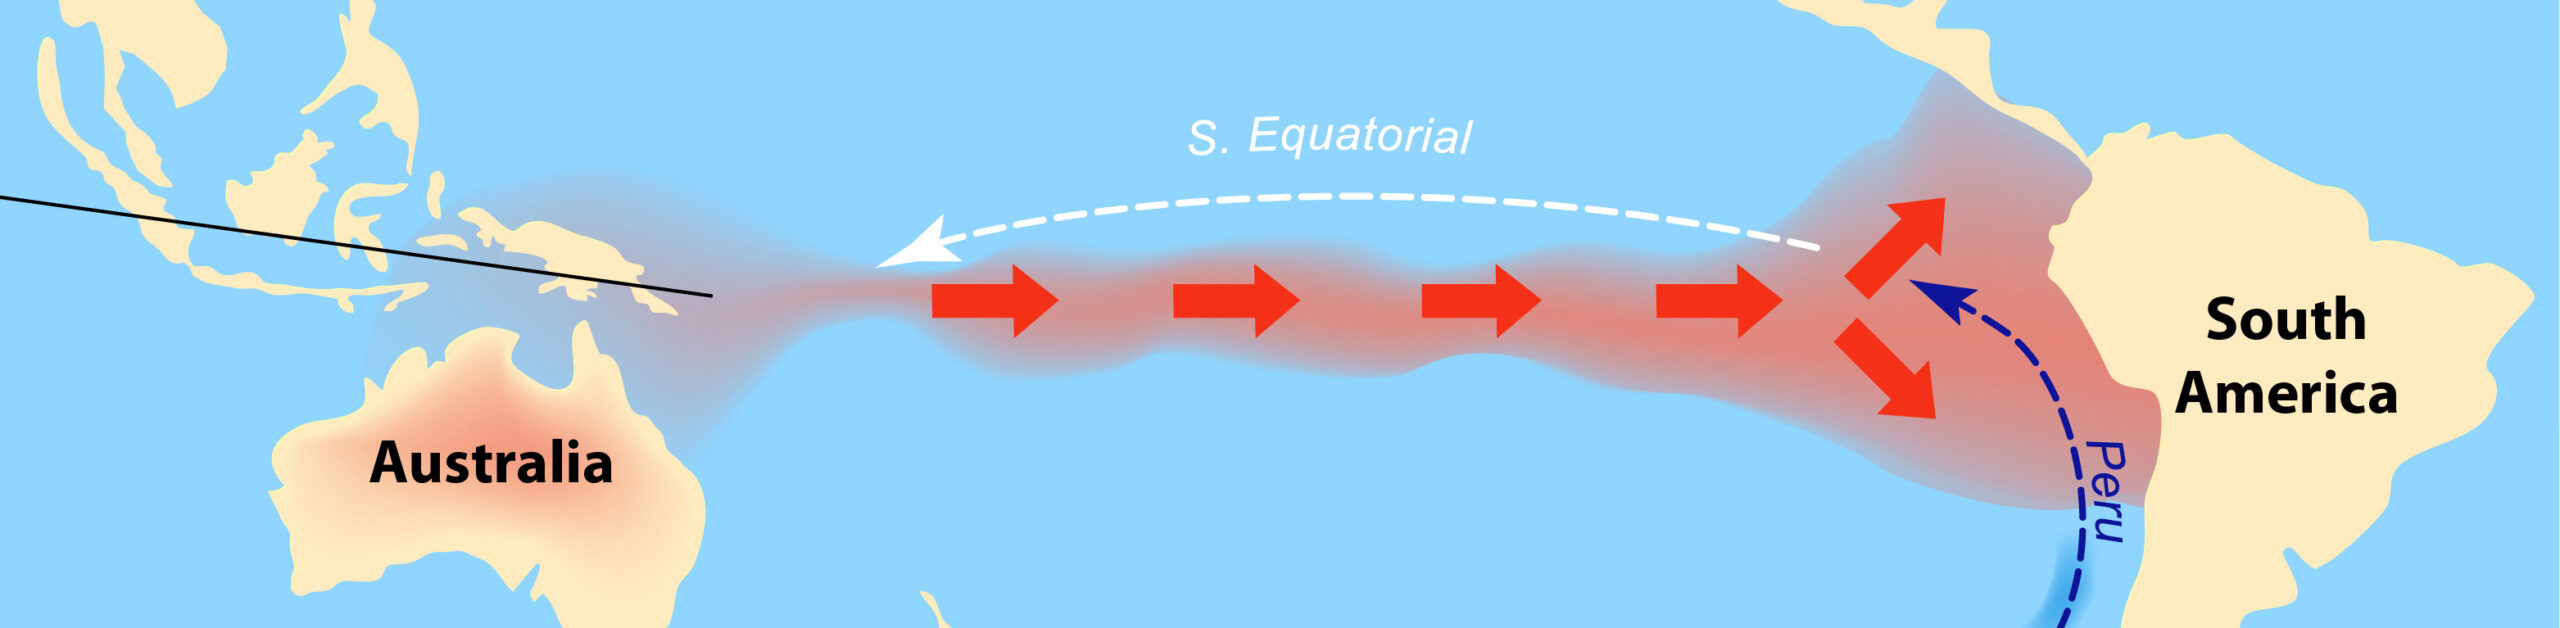
The World Meteorological Organization predicts that a ‘super El Niño’ is building. This has been nicknamed ‘Godzilla’. If forecasts are correct, this will be the most extreme El Niño in 1000 years.
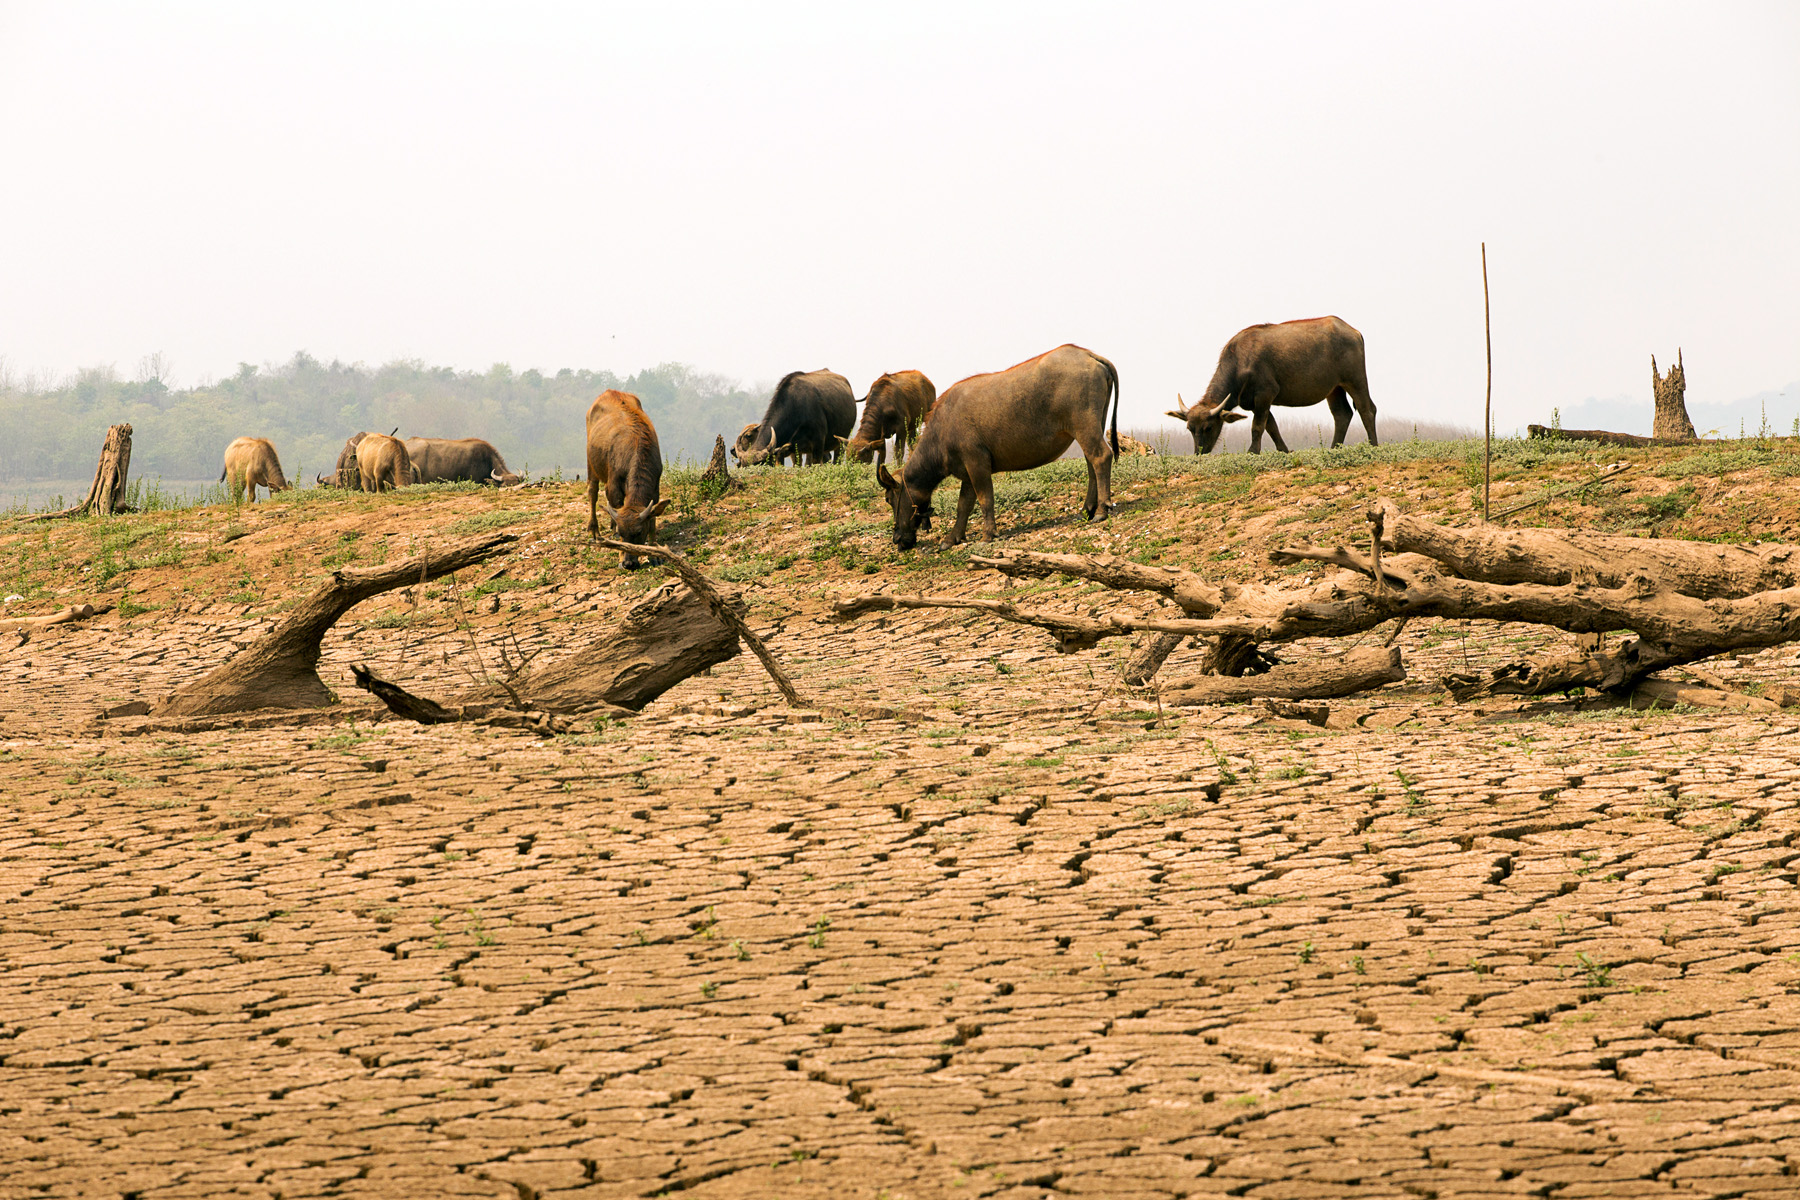
El Niño is a natural phenomenon. It occurs when the surface temperatures in the central and eastern tropical Pacific Ocean warm and cause the trade winds that typically blow from east to west across the Pacific Ocean to weaken or even reverse direction. As well as increasing global temperatures and causing intense heatwaves, it can result in droughts in some parts of the world, such as eastern Australia, south-east Asia and southern Africa, and intense rain and flooding in parts of South America, eastern Africa and south-western North America.
Typically, in an El-Niño event, the surface temperature of the central-eastern equatorial Pacific Ocean rises by 1°C to 1.5°C above the average. In the current El Niño, it is forecast to rise by up to 4°C by the end of 2026 and into 2027. It is already between 2.2°C and 2.6°C above the average. The effects could be catastrophic and hence the term ‘Godzilla’.
Although El Niño is a natural phenomenon, its severity is a direct result of climate change. This in turn is a direct result of economic decisions, and the effects will have severe economic consequences.
The economic causes
Climate change is an external cost of private economic decisions. When people or organisations burn fossil fuels, the climate costs of the CO2 emissions are not borne by the emitter. They are an external cost. This is illustrated in the diagram below, which shows the costs and benefits of electricity production from fossil fuels. (Click here for a PowerPoint.)
In this example, to make things simple, we assume that the external climate costs begin with the first unit of electricity generated and increase at a constant rate. The marginal social cost (MSC) of electricity generation equals the marginal private costs (MPC) to the generating company plus the marginal external cost in production MECP.
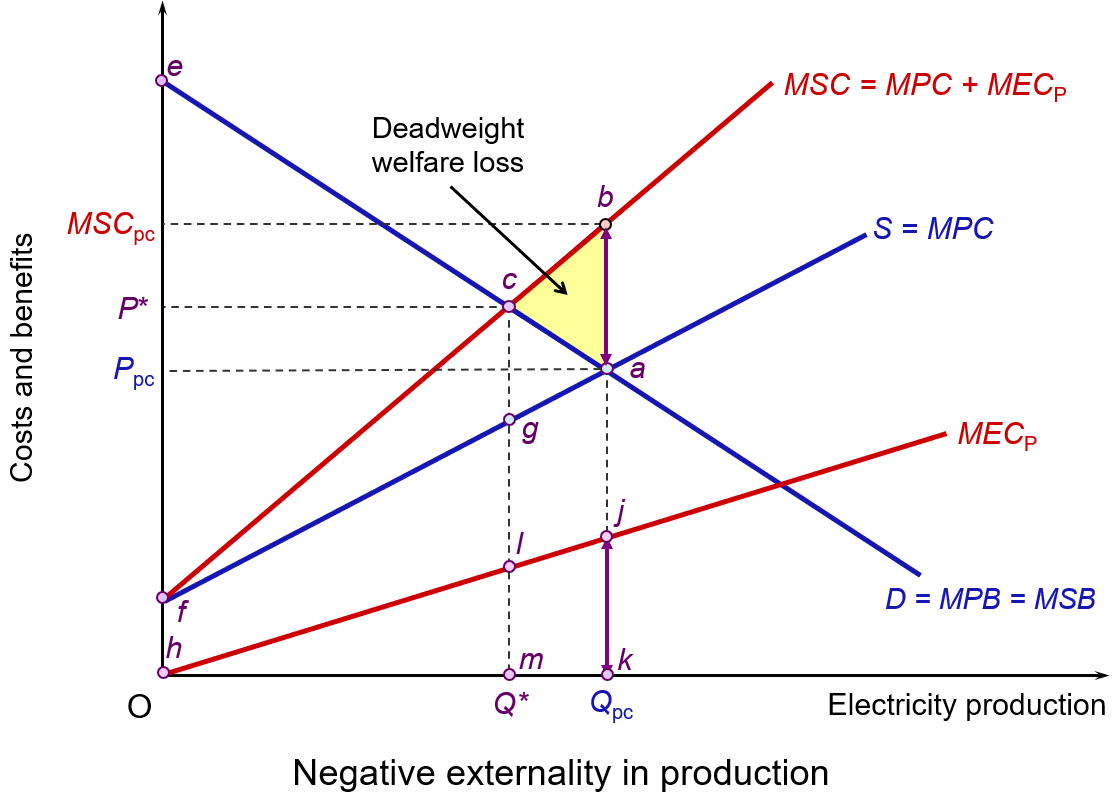 As you can see, the MSC curve is above the MPC curve. The vertical distance between them is equal to the MECP. It is also assumed that there are no externalities in consumption, which means that the marginal social benefit (MSB) curve is the same as the marginal private benefit (MPB) curve.
Competitive market forces, with producers and consumers responding only to private costs and benefits, will result in a market equilibrium at point a: i.e. where demand equals supply. The market equilibrium price is Ppc, while the market equilibrium quantity is Qpc. At Ppc, with no externalities on the consumption side, MPB is equal to MSB. The market price reflects both the private and social benefits from the last unit consumed. However, the presence of external costs in production means that MSC > MPC.
The socially optimal output would be Q*, where P = MSB = MSC, achieved at the socially optimal price of P*. This is illustrated at point c and clearly shows how external costs of production in a perfectly competitive market result in overproduction: i.e. Qpc > Q*. From society’s point of view, too much electricity is being produced from fossil fuels.
Total social surplus equals consumer surplus plus producer surplus minus the external costs. At the market equilibrium (Qpc) this is areas eaPpc+ Ppcaf – fba (or hjk, as it is the same size). At the socially optimal level of output (Q*) total social surplus is areas ecP* + P*cgf – fcg (or hlm).
Although consumer-plus-producer surplus is higher at the market equilibrium (Qpc) than at the socially optimum output (Q*) by the area cag, the external costs are higher still by the area cbag (or ljkm). Therefore, total social surplus at the market equilibrium is smaller than at the socially optimal point by area abc. This is a deadweight welfare loss and represents the excess of social costs over social benefits at all outputs above Q*. Put another way, moving from Qpc to Q* would represent a gain in social surplus of the area abc, as the fall in external costs outweighs the fall in consumer-plus-producer surplus.
One of the reasons why external environmental costs cause problems in a free-market economy is that no one has legal ownership of the atmosphere. Therefore, nobody has the ability either to prevent or to charge for their use as a ‘dumping ground’ for CO2. Such a ‘market’ is missing. Control must, therefore, be left to the government, international organisations, local authorities or regulators.
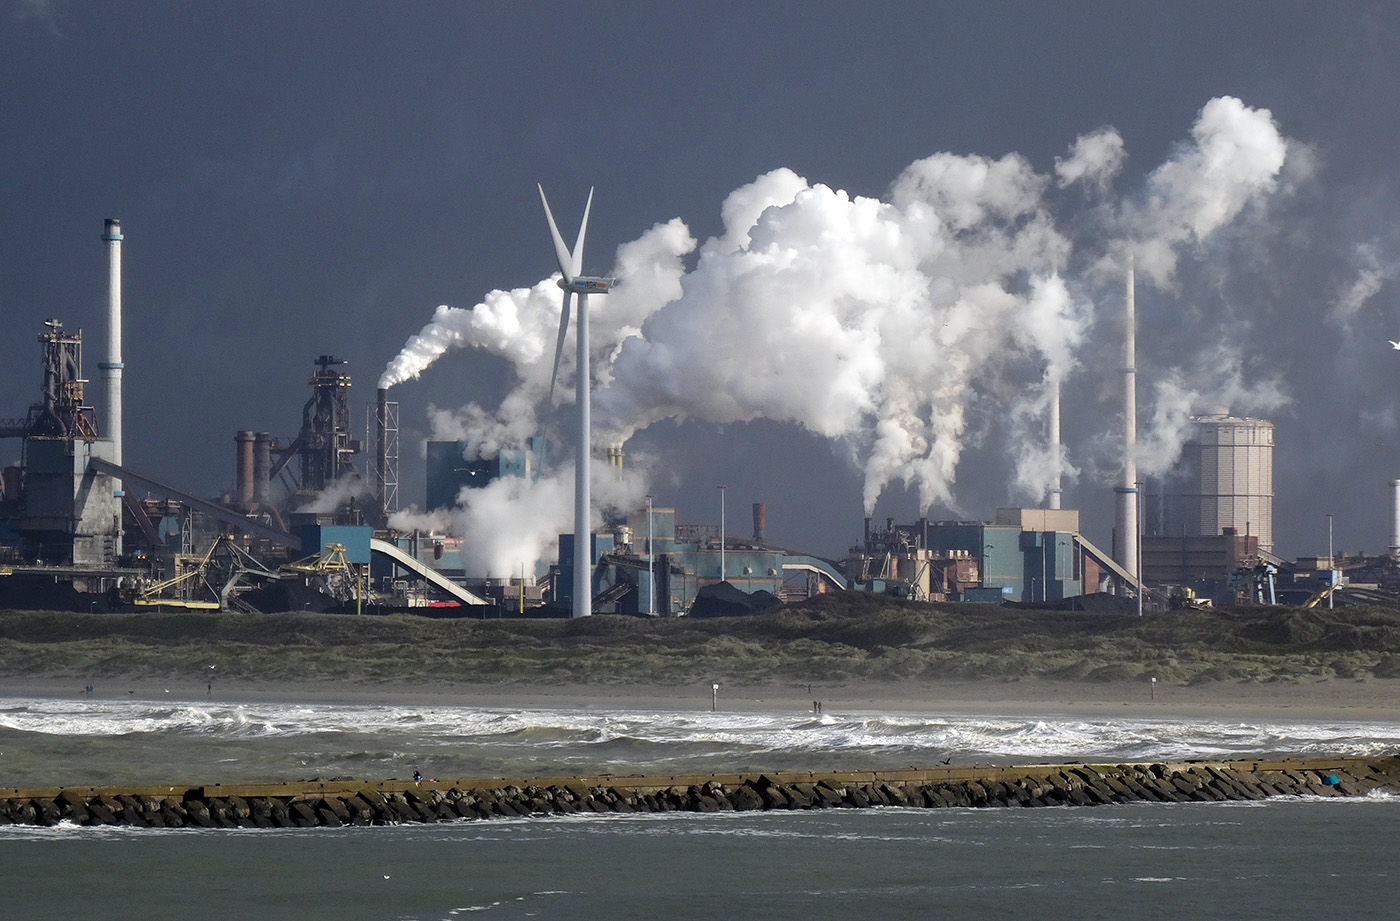 But such control is often too little. For example, when President Trump came to office in January 2025, he announced that the USA would withdraw from the UN’s Paris Agreement on climate change and that his policy towards oil production would be to ‘drill, baby, drill’. Indeed, governments globally spend hundreds of billions of dollars a year in subsidising oil, gas and coal production and its use, partly from pressure from the fossil fuel industry and partly to reduce the cost of living for consumers. This embeds fossil fuel dependence.
Game theory can help to explain the slow process of carbon reduction. For an individual country, such as the USA, it might argue that its optimum solution would be for other countries to cut their emissions, while maintaining its own levels. This approach would yield most of the benefits to the USA and none of the costs. However, when all countries argue like this, no progress is made. It’s a prisoners’ dilemma. Only if countries believe that the other countries will (a) ratify an agreement to cut emissions and (b) stick to the approved terms, is the agreement likely to succeed. This requires trust on all sides as well as the ability to monitor the outcomes.
Another major problem area concerns equity. Most countries will feel that they are being asked to do too much and that others are being asked to do too little. High-income countries will want to adopt a grandfathering approach. The starting point with this approach would be current levels of pollution. Every country would then be required to make the same percentage cut. Low-income countries, on the other hand, will want the bulk of the cuts, if not all of them, to be made by the rich countries. After all, the rich countries produce much higher levels of pollutants per capita than do the poor countries, and curbing growth in low-income countries would have a far more serious impact on levels of absolute poverty.
But will a supersized El Niño persuade countries to make deeper cuts in carbon emissions? In recent months commitments to achieving net zero emissions have waned. But the following economic consequences may encourage some countries to make deeper emissions cuts.
Economic consequences of a Godzilla El Niño
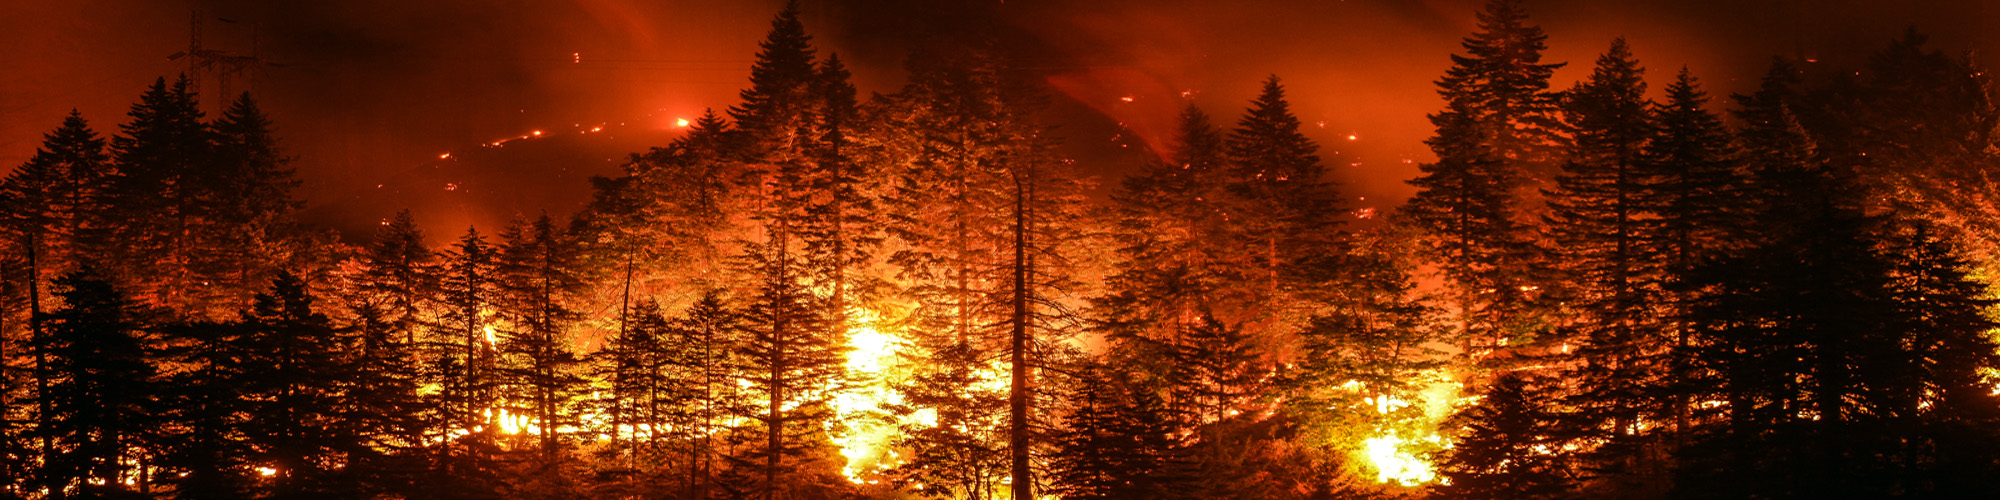
Extreme droughts, heat, wildfires and harvest failures in some areas and extreme rainfall and flooding in others will have severe economic consequences, often for the poorest people. There will be reductions in crop yields and loss of livelihood. Food prices will rise globally. This will add to the inflationary pressures from higher oil prices caused by the Iran war.
Droughts and wildfires in south-east Asia and Australia could have disastrous effects on harvests of palm oil, coffee, cocoa, rice, maize, wheat and various tropical fruits. Droughts and heat reduce output from hydropower and possibly wind energy, and industrial production may slow as a result of extreme heat in workplaces.
In Europe, warmer winters and unusually wet springs promote rapid plant growth. When this is followed by summer heatwaves, the undergrowth dries out and provides fuel for the wildfires. A super El Niño will amplify this. France and Spain have experienced massive wildfires these past few months. In the UK, the 2026 summer has been the hottest on record. The costs in Europe of the heat and wildfires in terms of lost crops and animals have been immense.
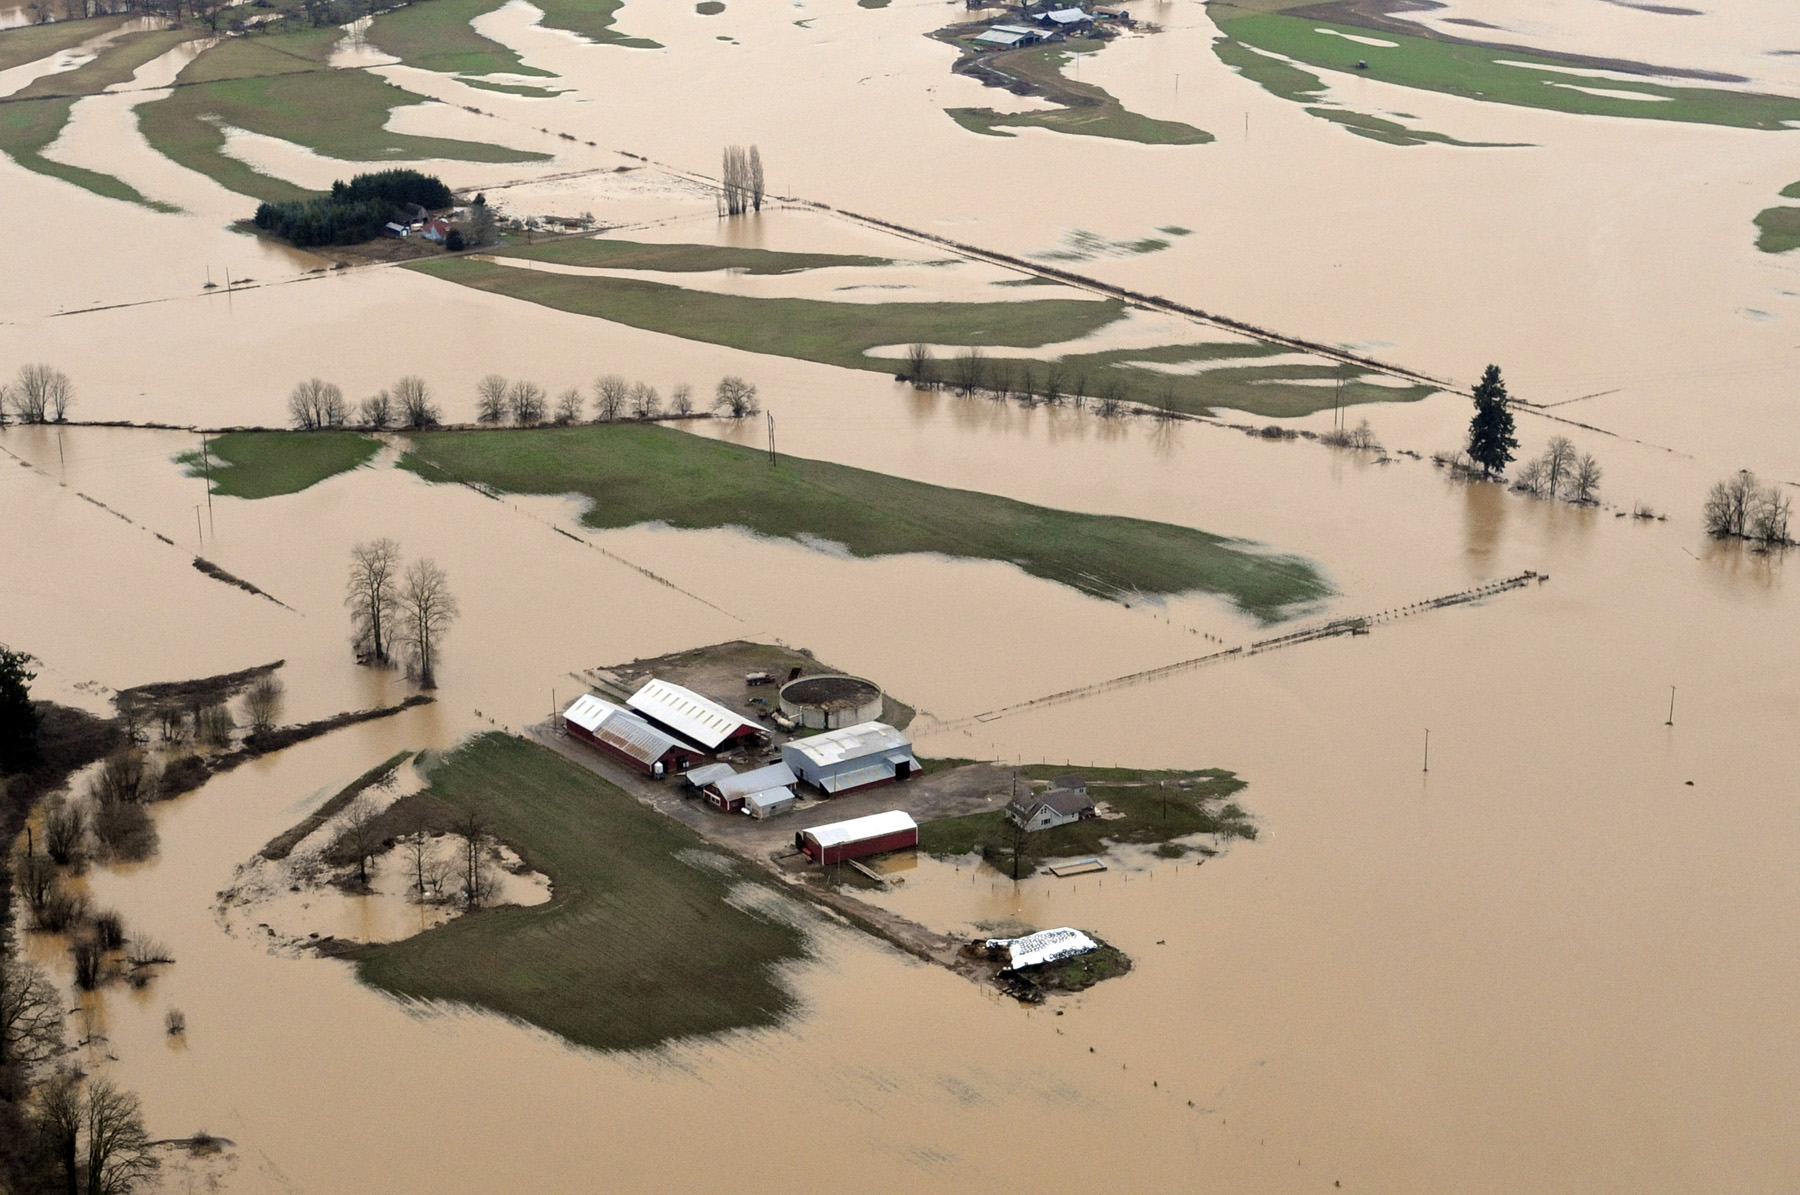 Floods and storms damage roads, power grids, railways and buildings. This forces governments to spend money on repairs instead of long-term investments. People are displaced and many are likely to lose their lives.
Fortunately, El Niños fade after a few months to be replaced by the cooler La Niña. The problem is that, with global warming, the next El Niño in a few years could be even more extreme with even more serious economic consequences.
The hope is that governments wake up to the pressing need to reduce carbon emissions.
Videos and podcast
Information
Articles
- Building climate-resilient agriculture in Europe: an economic perspective
European Environment Agency (17/3/26)
- What Super El Niño Means For Business Supply Chains And The Economy
Forbes, Chloe Demrovsky (25/8/26)
- A summer of extremes: Weathering a hotter world
CBS News, Jonathan Vigliotti (16/8/26)
- Area in Europe affected by wildfires could triple due to climate change
The National (UAE), Tariq Tahir (20/8/26)
- El Niño could drag down the global economy by almost $1 trillion or at least $7 trillion—and the choice is ours
Peterson Institute for International Economics, Cullen S Hendrix (26/7/26)
- UN warns of ‘supersized’ El Niño as countries prepare for impact
BBC News, Esme Stallard, Mark Poynting, Becky Dale, Yvette Tan, Tiffanie Turnbull and Nikita Yadav (3/9/26)
- Toxic haze from wildfires spreads across South East Asia as ‘super’ El Niño intensifies
BBC News (2/9/26)
- A Super El Niño is coming: 5 hard‑won lessons the world can learn from Africa
The Conversation, Tafadzwanashe Mabhaudhi and Mendy Ndlovu (5/7/26)
- ‘Supersizing before our eyes’: UN warns of record El Niño approaching
The Guardian, Damian Carrington (3/9/26)
- ‘Super’ El Niño could cause global food price shock lasting into 2028, analysts say
The Guardian, Richard Partington (12/7/26)
- Without action wildfires in Europe will increase 39% even in best-case climate scenario, study finds
The Guardian, Ajit Niranjan (20/8/26)
- From classrooms to climate action: ICSE 2026 charts new path for sustainability
Economic Times (Times of India) (2/9/26)
Questions
- What is the current state of progress towards meeting the goals of the UN Paris Climate Agreement?
- Are there any externalities in consumption that affect global warming?
- How might technological progress make it privately profitable to reduce carbon emissions?
- How might global supply chains and shipping be affected by a super El Niño?
- What role can education play in tackling climate change and its effects?
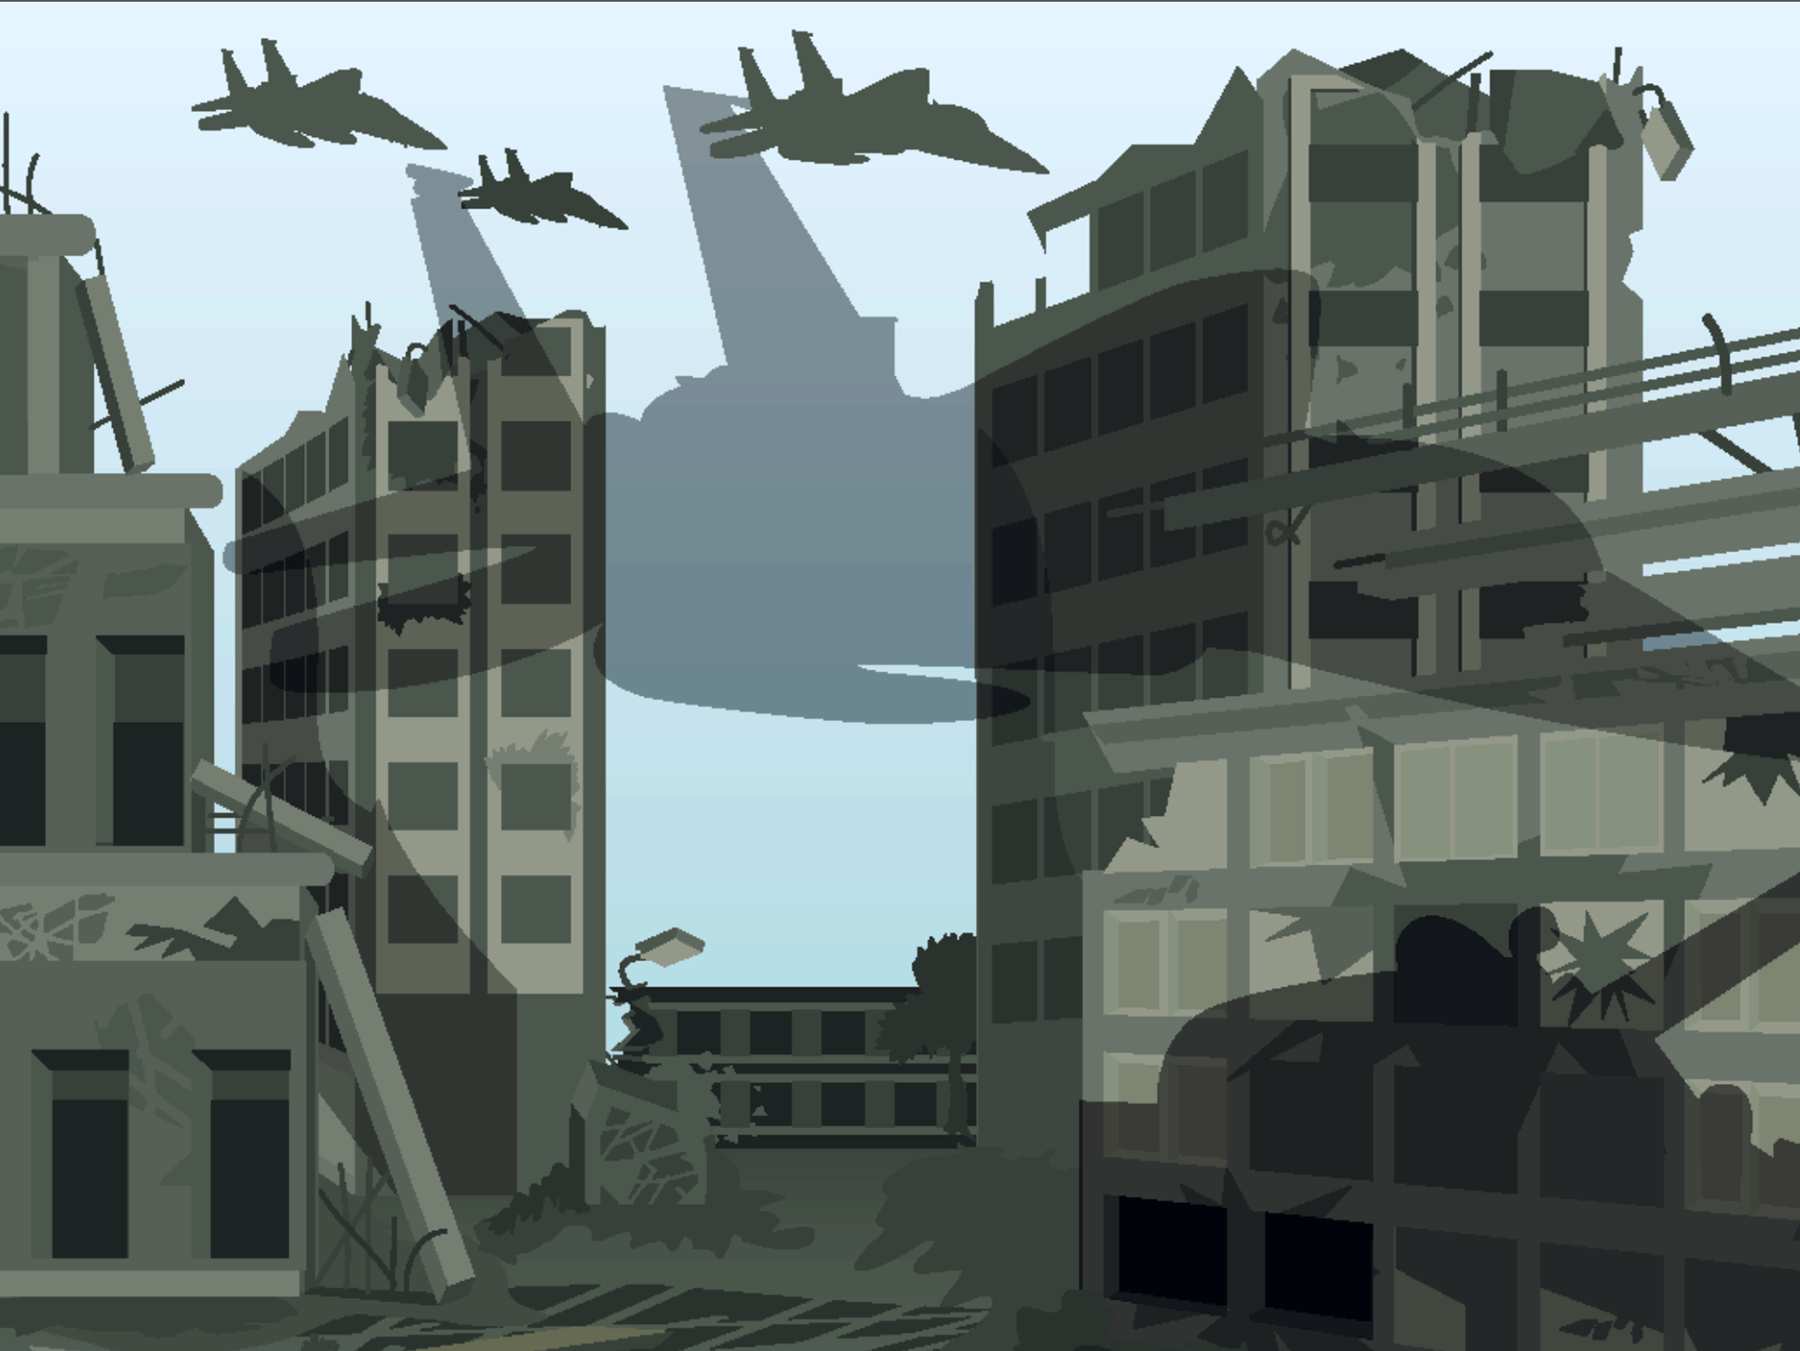 The world has suffered from a number of adverse supply shocks in recent years. First there was the credit supply shock of 2007–9 that led to a default on mortgages, a collapse in confidence in the banking system, the drying up of the inter-bank market, the freezing of lending and a global economic contraction. Then there was the COVID-19 pandemic. This shock to the the global economy led to a a fall in output and breaks in supply chains. As recovery took place, supply-side difficulties led to a surge in inflation.
Then there was the Russian invasion of Ukraine. This shock to energy and grain supplies led to rises in fuel and food prices: a cost-push inflationary shock. More recently, the closing of the Strait of Hormuz has cut off an important supply route and again sent fuel and other other prices rising.
These supply-side shocks create a dilemma for central banks. They push up inflation, but push output and employment down – a situation of ‘stagflation’.
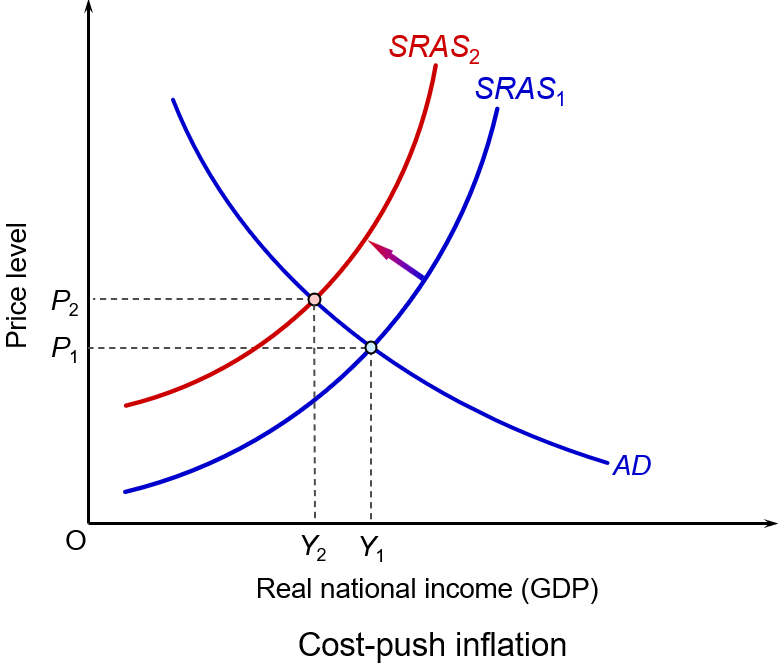 This can be illustrated with a simple aggregate demand and supply diagram. The shock shifts the aggregate supply curve upwards to the left, illustrated by the move from SRAS1 to SRAS2. The price level rises to P2 and GDP falls to Y2.
But central bank policy is designed to affect aggregate demand, not aggregate supply. If it raises interest rates, aggregate demand will shift to the left. The price level will fall (or at least the rate of inflation will fall), but output will fall further. If it cuts interest rates, aggregate demand will shift to the right. This will help to curtail, or even reverse, the fall in GDP, but will lead to even higher prices.
For countries where their central bank has a simple inflation mandate (e.g. keeping inflation close to 2%), sticking to this target in the short term would result in higher interest rates, lower economic growth and higher unemployment – and possibly even a recession. In such cases, central banks tend to project forward beyond the short-term shock and set interest rates to target inflation in a few months’ time. Indeed, many central banks do explicitly target inflation in the medium term (1 or 2 years) rather than the short term.
 Central banks, such as the US Federal Reserve Bank, which have a dual mandate of targeting inflation but also maximising employment, the trade-off between these two objectives can be stark. Getting the inflation down requires a higher rate of interest; maximising employment in the face of an adverse supply shock requires a lower rate of interest.
The short-term economic costs, let alone the human costs if the shock involves a war, can be great. People may suffer extreme hardship. The cost to the US Treasury of the first six weeks of the Iran war were estimated by the Pentagon to be some $29bn1 – which translates into higher taxes for US residents, lower government spending on non-war related items, higher government borrowing or some combination of the three. Other estimates put the cost to the US taxpayer as much higher – up to $1 trillion over the longer term.2 Then there are the costs to consumers of higher fuel and other prices, estimated at around $410 per month.3
The costs to Iranian citizens will be much higher in terms of war damage and loss of livelihood, let alone the suffering and loss of life. Then there are the costs to the rest of the world from higher prices of fuel, fertilisers and various industrial materials that are normally shipped through the Strait of Hormuz.
Long-term economic gain?
 Supply shocks often expose economic vulnerabilities that can later be addressed, making supply chains more diverse and more resilient. They can give a boost to alternative technologies, such as a switch from fossil-fuels to green energy.
After the 2007–9 financial crisis, banking systems were made more robust under the Basel III system. Capital and liquidity requirements were increased and bank leverage was decreased. Many countries, such as the UK, introduced ‘ringfencing’ to separate retail banking from the riskier investment banking. This increased confidence in the banking system.
The COVID-19 pandemic gave a boost to working remotely and the establishment of more flexible work patterns. What was a necessity during lockdowns, was seen as an effective model by many companies. Fully remote or hybrid working became commonplace for many jobs that were previously done in the office. Time has allowed employers to find the best balance of in-office and remote working, with the optimum balance often varying by type of job being performed.
The rising price of oil and gas following the Russian invasion of Ukraine in February 2022, saw many countries that had been reliant on imports from Russia, accelerating their efforts to switch to renewable energy. Supply chains were re-examined and there was a move towards ‘re-shoring’, ‘near-shoring’, or ‘friend-shoring’: that is, obtaining supplies from countries that are nearer and/or more reliable as trading partners.
 This approach was further boosted by the extensive tariffs imposed by the Trump second administration. One of the responses to the higher tariffs was to seek markets, both for exports and imports, away from the USA. To the extent that there is ‘re-shoring’ (substituting exports and imports for production and consumption within the country), then this amounts to deglobalisation. If this represents a move from low-cost to high-cost production and is contrary to the law of comparative advantage, then there will be a net economic loss. If, however, the reduction in risk of disruption and the boost to domestic industries allows a reduction in costs, there could be a net gain.
The most recent example of the Iran war has led many countries to reconsider sources of supply and to make their supply chains more robust and less risky. Gulf countries are considering expanding their pipeline network to avoid the Strait of Hormuz. For other countries, it is providing a further boost to green energy. Increased investment in the renewable sector will help to bring down costs and make countries less vulnerable to future conflicts involving oil-producing countries or sea passages.
To summarise: if initially adverse supply-side shocks cause a diversification and strengthening of supply chains, a diversification of energy sources, accelerated technological innovation and the adoption of new more efficient techniques, the long-term supply-side effects could be positive. Pain today for gain tomorrow?
But the short run comes before the long run and today’s costs are real and mounting. A shock may stimulate a positive response, but the current shock is persisting, and forecasts are getting more dire by the day. And even when the Iran war is over, there may be more shocks around the corner – ‘unknown unknowns’. As Keynes said: ‘In the long run we’re all dead’.
References
- Pentagon’s estimate for Iran war grows to $29B
Politico, Mark Sweney (12/5/26)
- World Politics The Iran war could cost the American taxpayer $1 trillion, says Harvard academic
CNBC, Joseph Wilkins (14/4/26)
- The Economic Costs of the Iran War
American Enterprise Institute, Roger Pielke Jr. (2/4/26)
Articles
Questions
- What policies have central banks pursued during the Iran war?
- Paint an optimistic scenario for the global economy five years hence.
- Paint a pessimistic scenario for the global economy five years hence.
- Compare the sources of supply of oil and gas for Europe directly prior to the Iran war with those directly prior to the Russian invasion of Ukraine.
- Compare the relative merits of globalisation and deglobalisation. Does this depend on the nature of globalisation and deglobalisation?
With relentless bombing of Iran by Israel and the USA, and with Iranian counterattacks on Gulf states, the costs of the war are mounting. The most obvious are in terms of human lives, injuries and suffering. But there are significant economic costs too. Some of these are immediate, such as the rising price of oil and hence the costs of fuel, or the fall in stock market prices. Some will be longer term, depending on how the war develops. For example, prices could rise more generally as supply chains are disrupted.
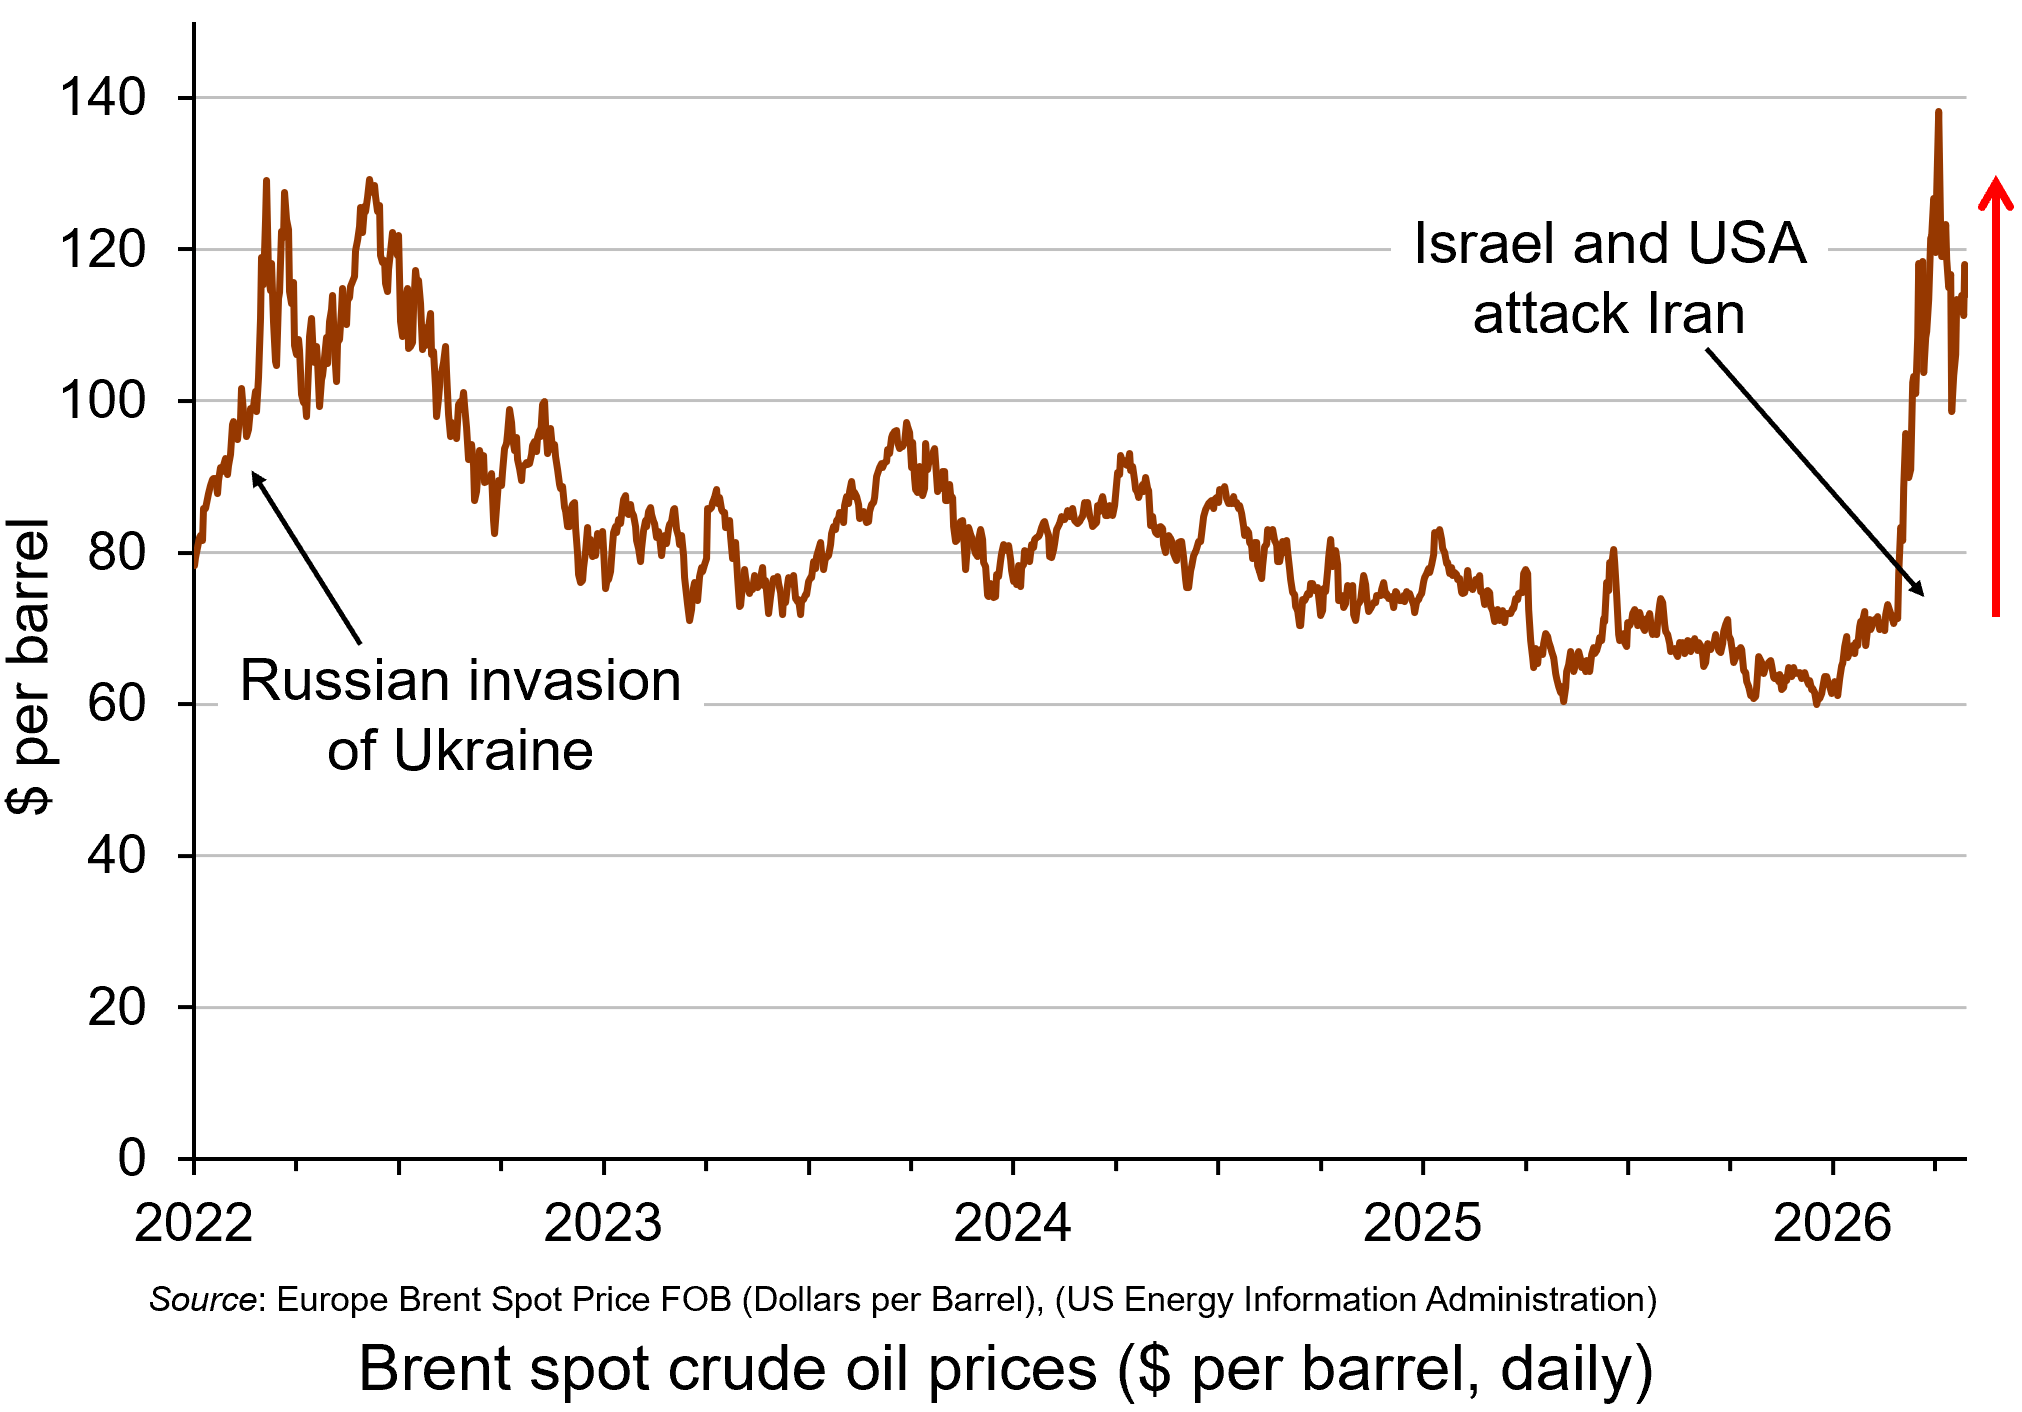 The impacts will vary across the world and across markets. The most obvious markets to be affected are those where significant supply comes from the Persian Gulf. Approximately 20% of total global oil consumption passes through the Strait of Hormuz, which connects the Persian Gulf with the Arabian Sea and the Indian Ocean.
Oil prices rose considerably in the days following the start of the war on 28 February, with Brent crude, a key measure of international oil prices, rising from $71.3 on 27 February to a peak of $119.4 per barrel by the morning of 9 March – a rise of 67%. It was possible that they would rise even further in the short term. However, prices fell back substantially later on 9 March after G7 finance ministers declared that the group ‘stands ready’ to release oil from strategic reserves if needed. By late in the day, the price had fallen to below $85. (Click here for a PowerPoint of the chart.)
However, despite the announcement on 11 March that 32 countries had agreed to release 400m barrels of oil reserves, oil prices began rising again and reached $100 on 12 March after three tankers had been struck in the Gulf, two of them close to the Strait of Hormuz. With Iran pledging to keep the Strait closed, there were worries that the release of oil reserves would provide only temporary relief. Just over 20m barrels of oil normally pass through the Strait of Hormuz. The 400m barrels released from storage is the equivalent, therefore, of only 20 days’ worth of lost oil from the Gulf.
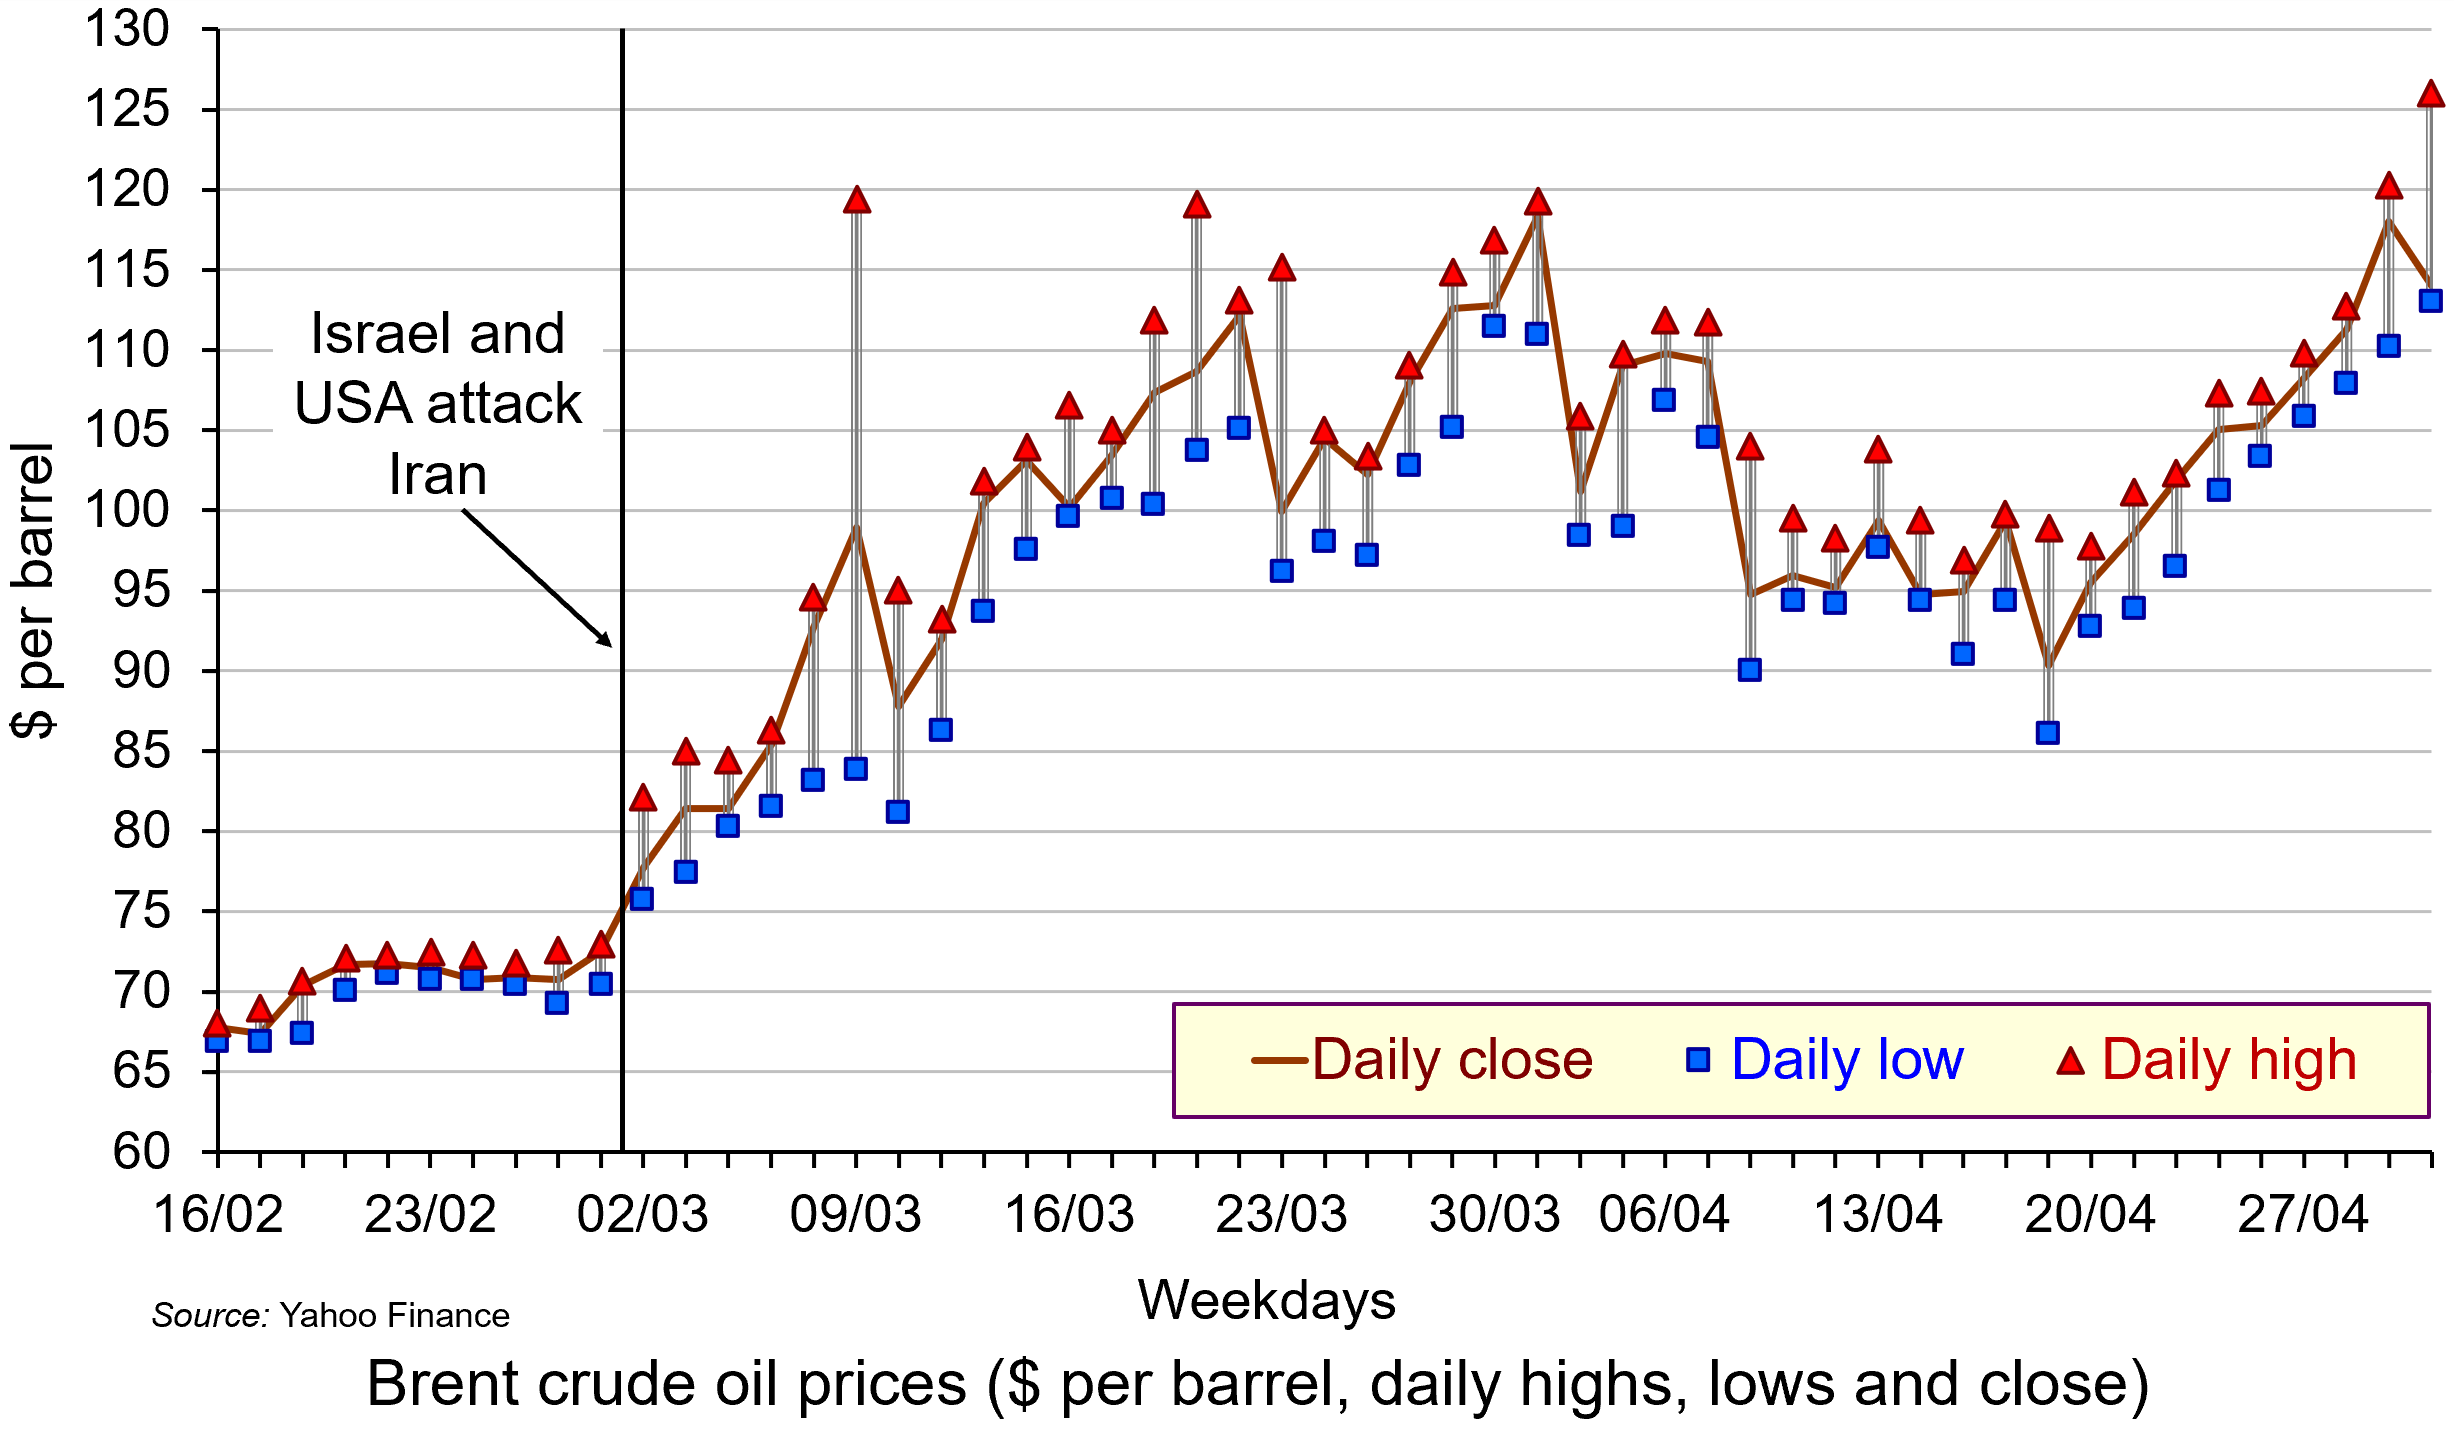
Not only did oil prices rise, but the price became much more volatile as markets reacted to the news on a continuous basis. Intra-day fluctuations in oil prices of several percentage points became typical, reflecting shifting expectations. The second chart shows daily fluctuations, with the highest and lowest prices for each day shown, along with the closing price. (Click here for a PowerPoint.)
The biggest fluctuation had been on 9 March when fears of the closing of the Strait of Hormuz saw the price of Brent crude rising to nearly $120 but falling to around $84 later in the day (a fall of around 30%) after the G7 announcement about releasing reserves.
There was another big fluctuation on 23 March. The previous day (Sunday), President Trump threatened to bomb Iran’s power plants if Iran did not allow free passage of ships through the Strait of Hormuz. Iran threatened to retaliate by striking Gulf countries’ energy and water systems. In early trading on Monday 23rd, Brent crude rose to over $115 per barrel. But later that day, Trump said that there had been constructive talks between the USA and Iran. The oil price immediately dropped to around $96 – a fall of 17% – before settling at around $100.
 Rising oil prices will drive up inflation. For those countries with a heavy dependence on Gulf oil, particularly countries in Asia, there could be significant supply problems. For oil exporters in the Persian Gulf, with tankers unable to traverse the Strait of Hormuz, the economic impact is huge. Oil exporters outside the Gulf, such as Russia, Norway and Canada, however, will gain from the higher prices. Clearly the size of these effects will depend on how long the conflict continues and how long the Strait of Hormuz remains closed.
And it is not just oil that is affected. Other products, such as liquified natural gas (LNG), petrochemicals, industrial materials, fertilizers for food production, medicines, helium for microchip production, metals and minerals are transported through the Strait of Hormuz. Gulf countries import much of their food through the Strait. On 18 March, Israel struck Iran’s huge South Pars gas field off the Gulf coast. This is the largest gas field in the world and is a major source of export revenue for Iran. Iran responded by striking the Qatari gas hub in Ras Laffan. Donald Trump responded by threatening to ‘blow up’ the entire Iranian South Pars gas field if Iran made further strikes on Qatar. The effect of this escalation was to drive oil and gas prices up further. By the week ending 20 March, the oil price closed at just over $112 per barrel.
Cuts in supplies of oil and other products represent an adverse supply shock. Such shocks push up prices (cost-push inflation), while adversely affecting aggregate output. This can lead to stagflation – a combination of higher inflation and stagnation or even falling output. Central banks with a simple mandate to keep inflation to a target are likely to raise interest rates, or at least delay in reducing them. In the USA, with a dual mandate of controlling inflation but also maximising employment, the response may be less deflationary, depending on the judgement of the Federal Reserve.
Uncertainty
 There is great uncertainty about how long the conflict will last. There is also a lack of clarity and consistency from the US administration about its war aims. This uncertainty has affected financial markets, which have seen considerable volatility. Stock markets have seen widespread falls, with airline, travel and AI-heavy stocks being particularly vulnerable.
If the war is concluded relatively swiftly, the economic effects could be relatively small. If the war continues, and especially if the Gulf countries are drawn further into the conflict and if the conflict spreads to other countries, the economic effects could be much more substantial. A prolonged conflict could see oil prices remaining above $100 per barrel, potentially increasing global inflation by 1 percentage point or more. This would slow or halt the move by central banks to cut rates and thereby reduce global economic growth – potentially, as we have seen, leading to stagflation.
The uncertainty was reflected in the decision of the Fed to keep interest rates unchanged at its meeting on 17/18 March. The Fed has the twin targets of keeping inflation close to 2% and maximising employment. Fed Chair, Jay Powell, acknowledged the current tension between the two goals: ‘upward risks for inflation and downward risks for employment, and that puts us in a difficult situation’. He also recognised that the future for inflation and the economy was highly uncertain as the war developed. This made interest rate setting difficult.
Then there is the issue of a potential new international refugee crisis. If the economic and political system in Iran deteriorates rapidly, this could trigger a wave of migration to neighbouring countries, such as Turkey, already hosting large numbers of refugees. Many could seek sanctuary further afield in Europe, with several countries already facing a backlash against immigration. The political and economic effects of this on host countries could be significant – but as yet, highly uncertain.
Articles
- Assessing the global economic impact of the Middle East war
ING, Carsten Brzeski, Warren Patterson, James Knightley and Deepali Bhargava (5/3/26)
- How the Hormuz closure could affect food, medicines and smartphones
BBC News Verify, Ben Chu (27/3/26)
- How will the Iran war affect the global economy?
Chatham House, Neil Shearing (6/3/26)
- ‘The stakes are enormous’: how a prolonged Iran war could shock the global economy
The Guardian, Richard Partington (22/3/26)
- Iran war is latest threat to a global economy rattled by Trump
Aljazeera, John Power (7/3/26)
- Why an Iran war inflation shock could wreck global economic recovery
The Guardian, Phillip Inman and Kalyeena Makortoff (8/3/26)
- Why has the Iran war sparked fears of stagflation for the global economy?
The Guardian, Luca Ittimani (9/2/26)
- Why the price of oil matters more than you might think
BBC News, Natalie Sherman and Mitchell Labiak (10/3/26)
- Strait of Hormuz: Factsheet
IEA (February 2026)
- Could this energy crisis be worse for the global economy than COVID?
The Conversation, Adi Imsirovic (26/3/26)
- Faisal Islam: Oil price spiral may be slowed but not stopped by G7 emergency move
BBC News, Faisal Islam (9/3/26)
- What on earth is going on with the oil price?
BBC News, Jemma Crew (12/3/26)
- Asia scrambles to confront energy crisis unleashed by Iran war – with no end in sight
The Guardian, Callum Jones (12/3/26)
- The grim choice facing the Trump administration: Economic or naval collapse?
CNN, Phil Mattingly and Zachary Cohen (9/3/26)
- Israel strikes Iran’s South Pars gasfield hours after forces kill intelligence minister
The Guardian, Lorenzo Tondo and William Christou (18/3/26)
- What Fed Chair Jerome Powell said — and didn’t say — about the oil crisis
Yahoo Finance, Jake Conley (19/3/26)
- What strikes on the world’s largest natural gas sites could do to the global economy
CNN, Hanna Ziady (19/3/26)
- How the Iran Conflict May Fuel a New International Refugee Crisis
Forbes, Andy J Semotiuk (5/3/26)
- Iran’s neighbours brace for fallout as war threatens new refugee crisis
Aljazeera, Abid Hussain (17/3/26)
- Two months into the Iran war, almost everybody is a loser
CNN, Ivana Kottasová (2/5/26)
Data
Report
Questions
- Who are the biggest gainers and losers from disruption to oil supplies from the Persian Gulf?
- Illustrate the effect of the current oil price shock on an aggregate demand and supply diagram (either static or dynamic).
- Why is the Iranian war likely to be less damaging to the European economy than the Ukrainian war has been?
- Why have AI-related stock prices been vulnerable to the uncertainty caused by the Iranian war?
- How have the Bank of England and the Federal Reserve Bank responded to higher oil prices and the broader economic effects of the war? Why might their responses be different in the coming months?
- What is the likely impact of the Iranian war on global economic recovery?
- How might the Iranian war affect global economic alliances?
- How is the current oil price shock likely to affect the eurozone? Will it be different from the oil price shock that followed the Russian invasion of Ukraine?
- What are the likely economic effects of large-scale migration caused by the war?
 At the fourth anniversary of Russia’s invasion of Ukraine, we look at the effect of the war on the Russian economy. Two years ago, in the blog The Russian economy after two years of war, we argued that the Russian economy had seemingly weathered the war successfully.
Unlike Ukraine, very little of its infrastructure had been destroyed; it had started the war with a current account balance of payments surplus, a budget surplus and a low general government debt-to-GDP ratio; it had achieved a lot of success in diverting its exports, including oil, away from countries imposing sanctions to countries such as China and India; it was the same with imports, with China especially becoming a major suppliers of machinery, components and vehicles; it has a strong central bank, which engenders a high level of confidence in managing inflation; the military expenditure provided a Keynesian boost to the economy, with production and employment rising.
The situation today
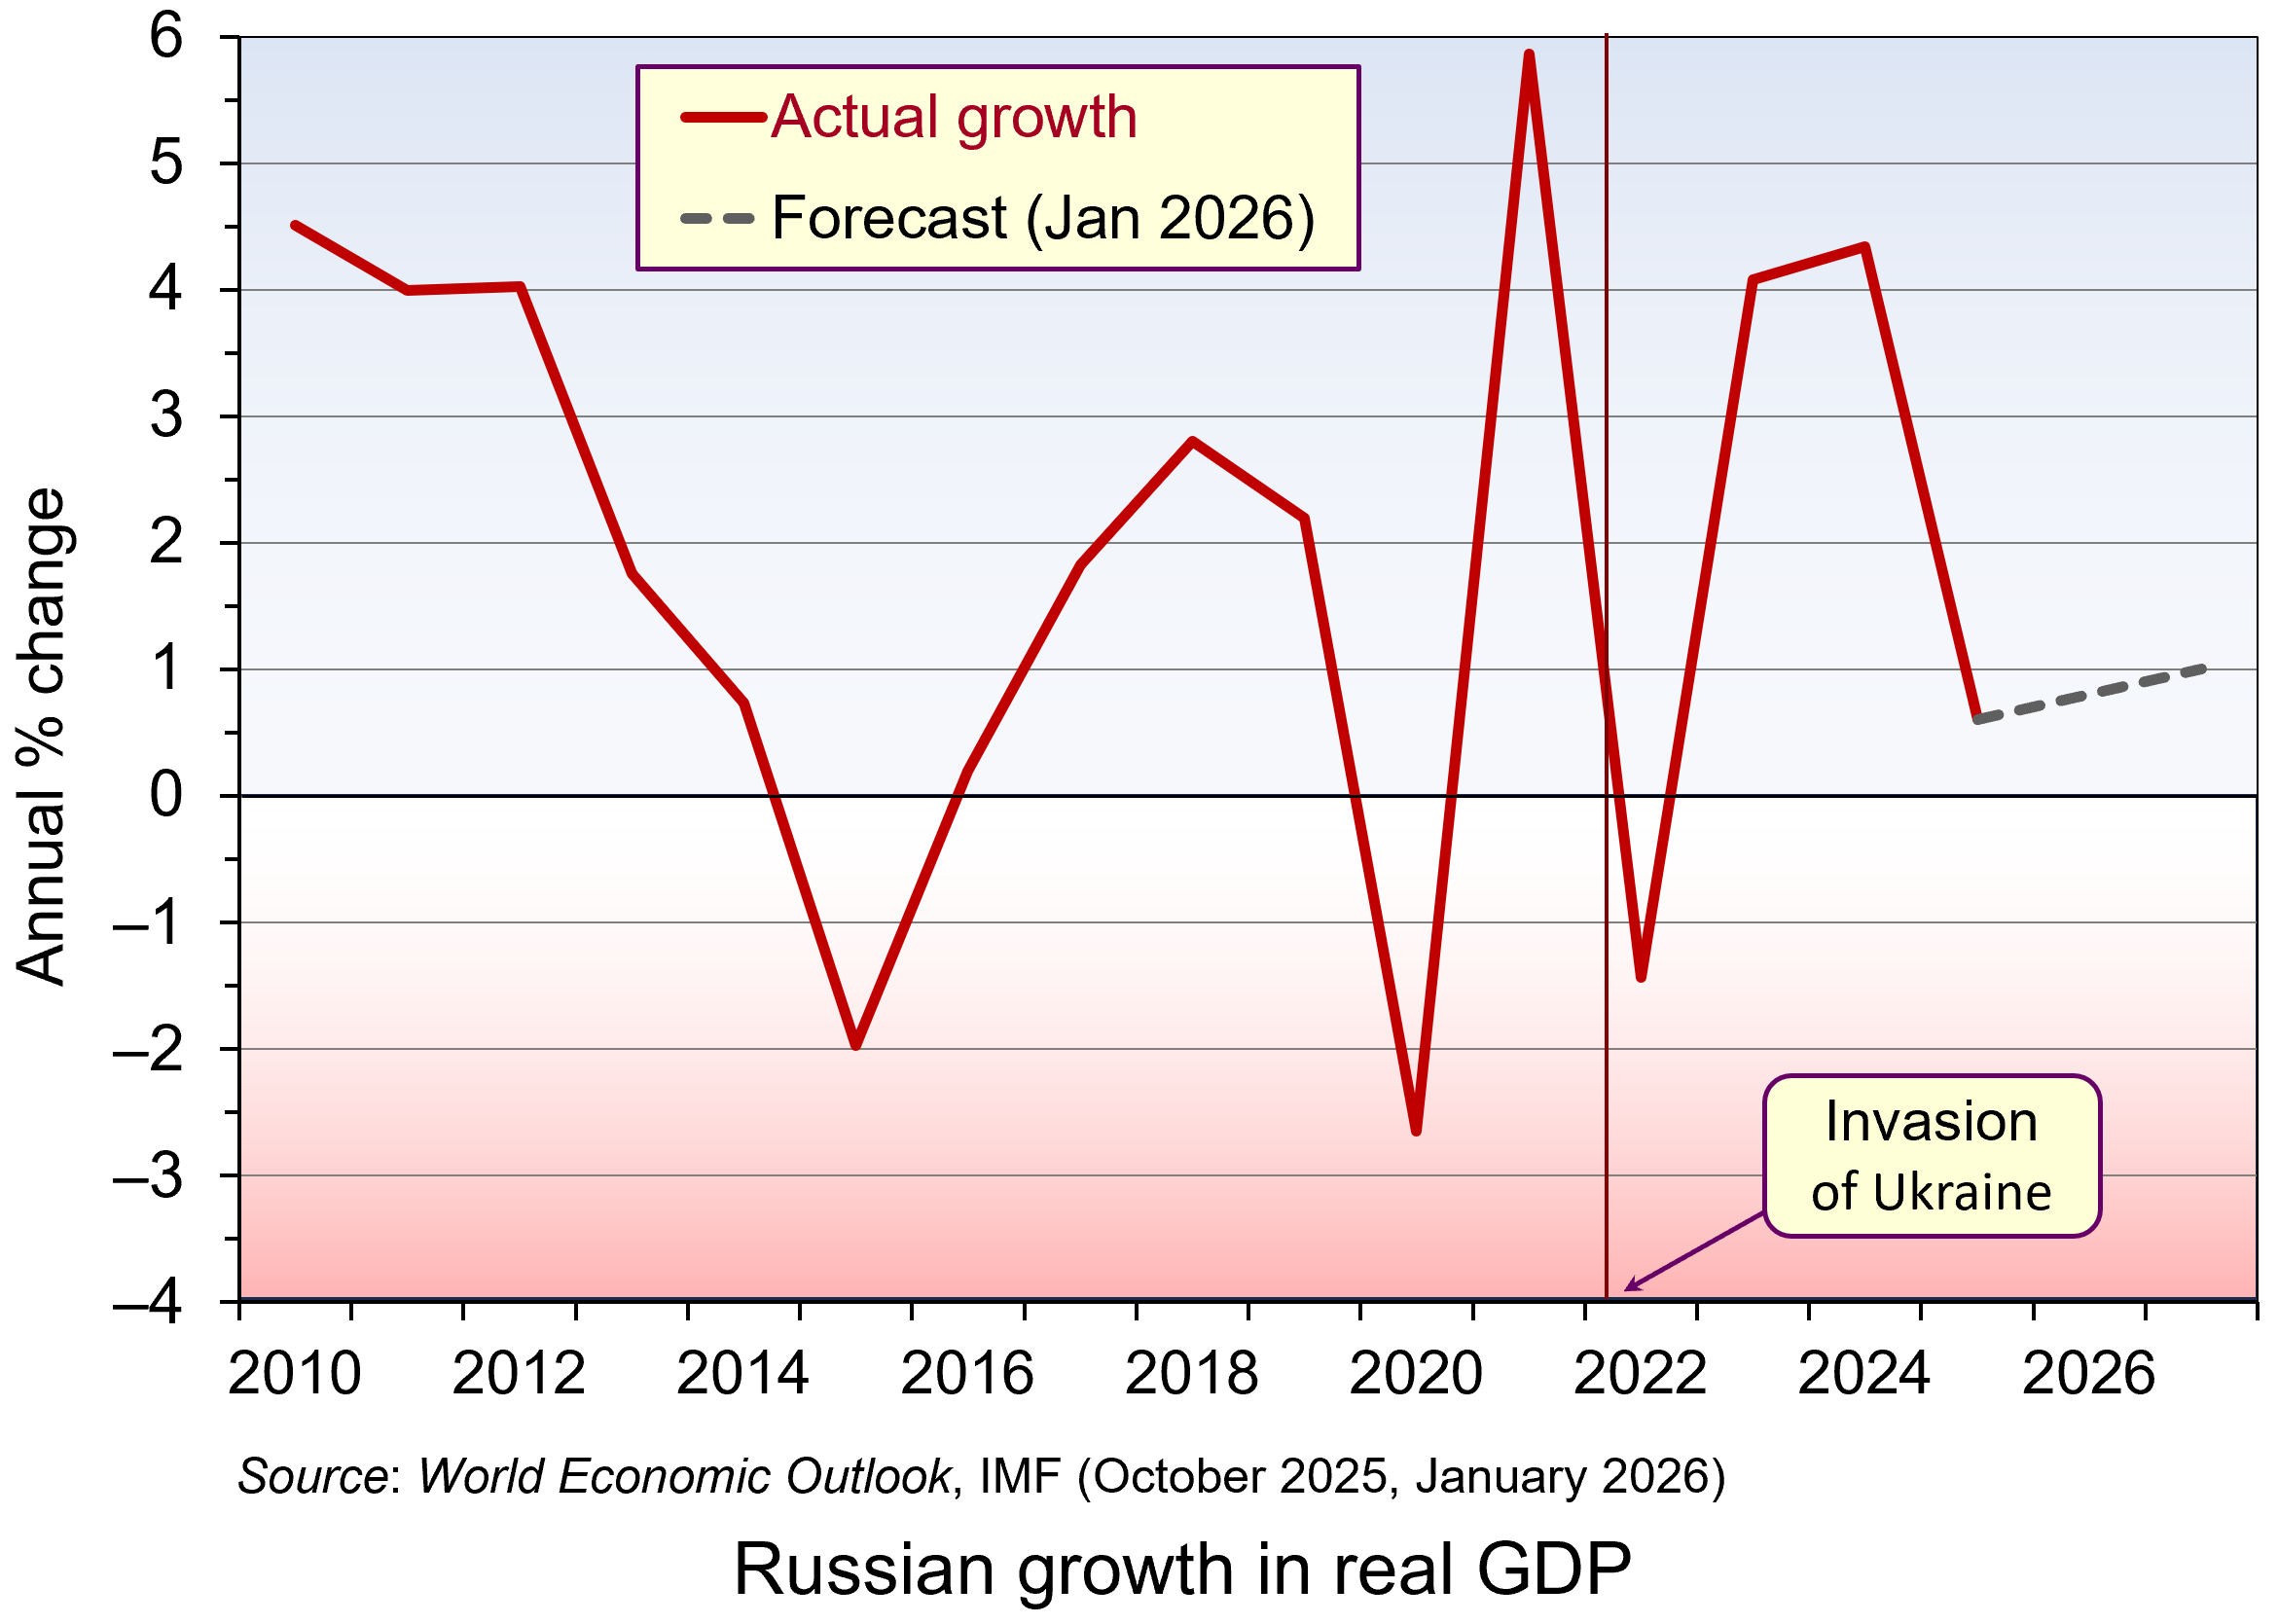 But two years further on, the Russian economy is looking a lot weaker and on the verge of recession. GDP growth fell to 0.6 per cent in 2025 and is forecast to be no more than 1 per cent for the next two years. (Click here for a PowerPoint of the chart.) And despite growth still being positive (just), this is largely because of the growth in military expenditure. Retail and wholesale trade fell by 1.1% in 2025, reflecting supply chain problems and high inflation dampening consumer demand.
With labour being diverted into the armaments and allied industries or into the armed forces, this has led to labour shortages. This has been compounded by the emigration of up to 1 million people by 2025 – often young, educated and skilled professionals.
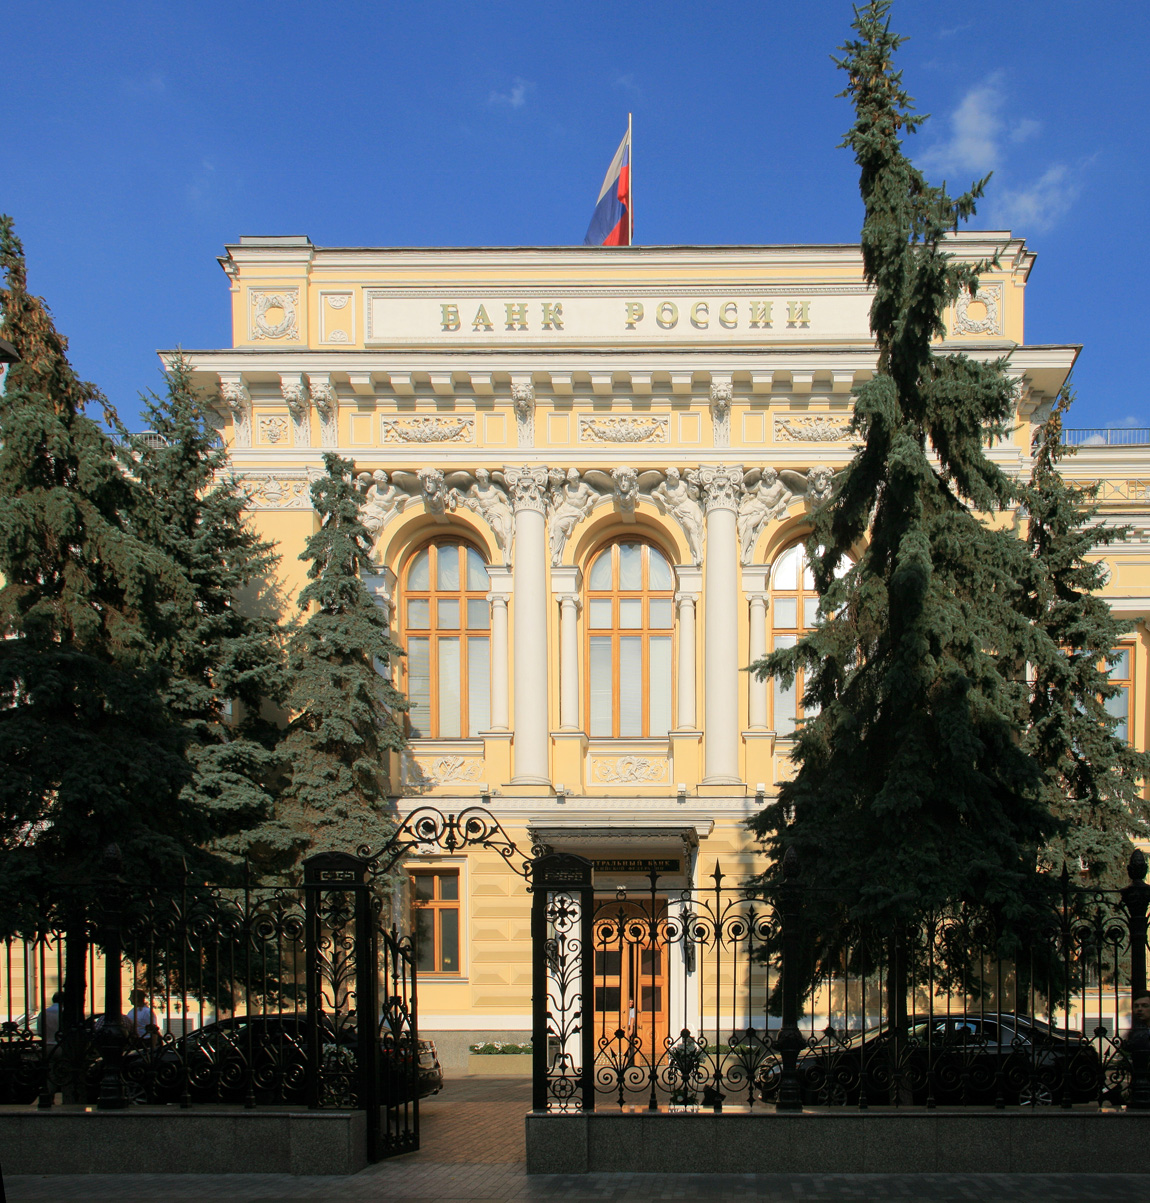 Official CPI inflation averaged 8.7 per cent in 2025, although the prices of food and other consumer essentials rose by more, especially in recent months. At the beginning of 2026, supermarket prices rose by 2.3% in just one month, made worse by a rise in VAT from 20% to 22%. The central bank has responded to the high inflation with high interest rates, which averaged 19.2% in 2025, giving a real rate of 10.5%. With such a high real rate, the response of households has been to save. This has masked the constraints on production, or imports, of consumer goods. Savings have also been boosted by large payments to soldiers and bereaved families, with the money saved by the recipients being used in part to fund future such payments. So far there has been trust in the banking system, but if that trust waned and people starting making large withdrawals of savings, it could be seriously destabilising.
Whilst the high real interest rates have helped to mask shortages of consumer goods, they have had a seriously dampening effect on investment by domestic companies. Gross capital formation fell by 3% in 2025, not helped by an increase in the corporation tax from 20% to 25%. At the same time, foreign direct investment remains subdued due to high perceived risks. The lack of investment, plus the labour shortages, will have profound effects on the supply side of the economy, with potential output in the non-military sector likely to decline over the medium term.
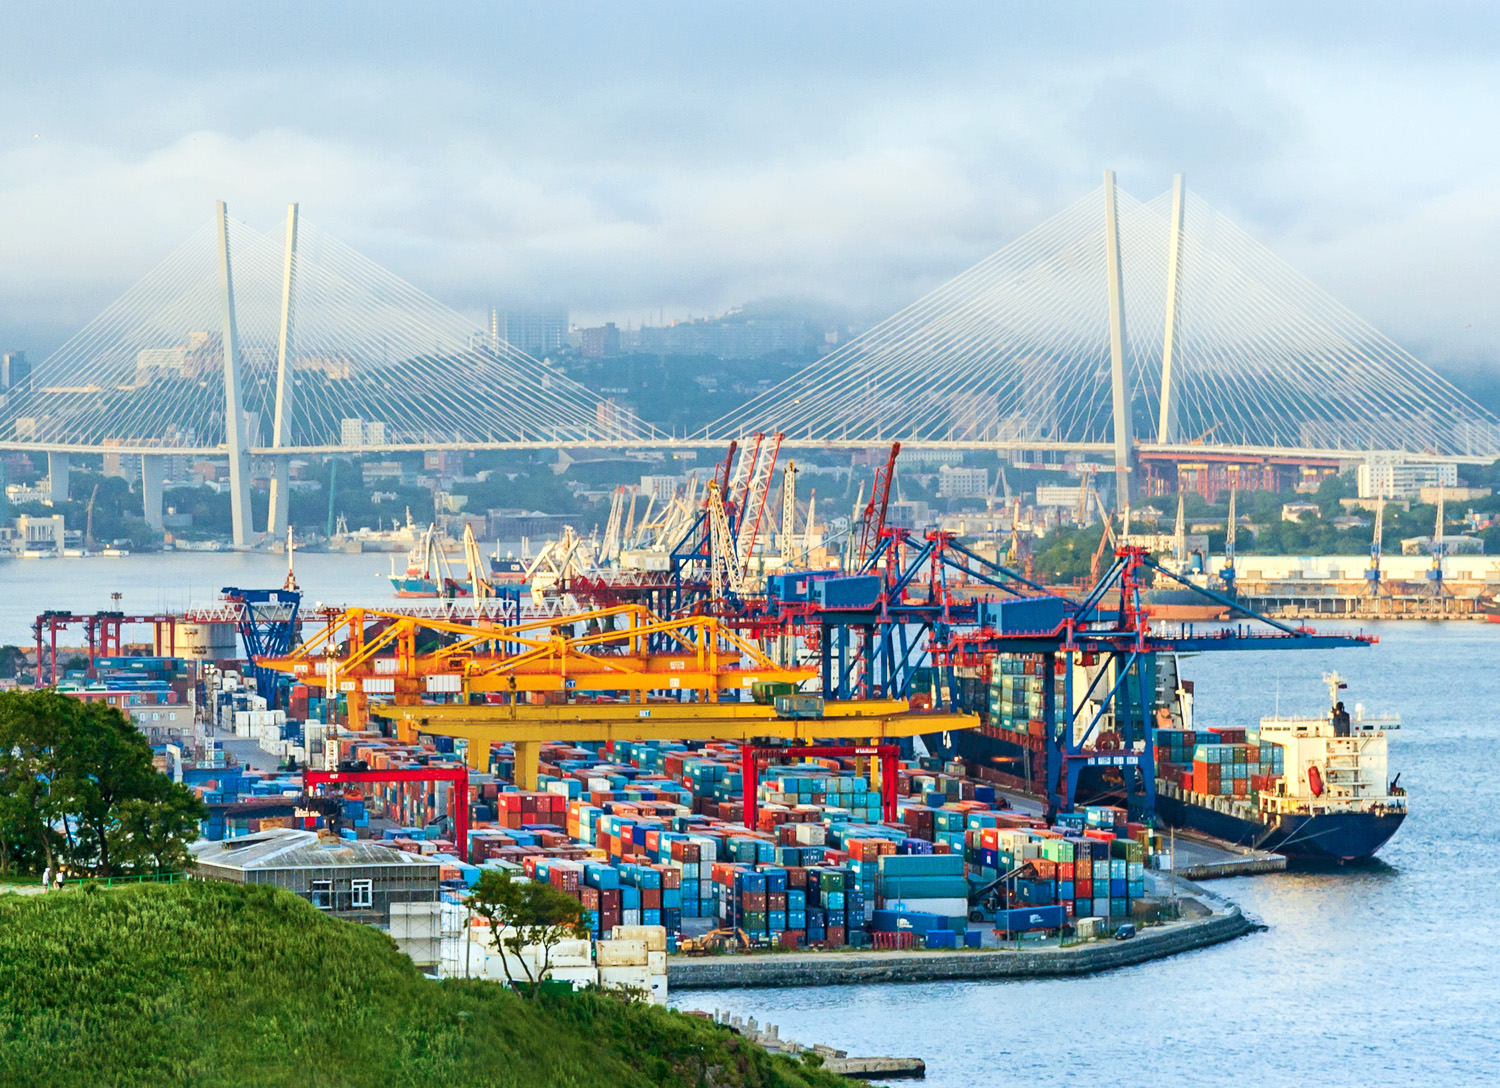 The balance of payments and government finances are turning less favourable. The balance of trade surplus has declined from US$173bn in 2021 to US$67bn in 2025. This could decline further, or even become a deficit, if oil prices continue to be weak, if Western sanctions are tightened (such as stopping the flow of Russian oil exports in the ‘shadow’ fleet of tankers) or if major importing countries stop buying Russian oil. Indian refiners have announced that they are not taking Russian crude in March/April as India seeks to finalise a trade deal with the USA.
The budget balance has moved from a small surplus of 0.8% of GDP in 2021 to a deficit of 2.9% in 2025. Although the government debt-to-GDP ratio remains low by international standards at 23.1% of GDP in 2025, this was up from 16.5% in 2021 and is set to rise further as budget deficits deepen. Nevertheless, as long as the saving rate remains high, the debt can be serviced by domestic bond purchase.
Russia’s economy is definitely weakening and labour shortages and low investment will create major problems for the future. But whether this deterioration will be enough to change Russia’s stance on the war in Ukraine remains to be seen.
Articles
- The Russian economy is finally stagnating. What does it mean for the war – and for Putin?
The Guardian, Alex Clark (6/2/26)
- Exclusive: Russia’s budget deficit may almost triple this year as oil revenues decline
Reuters (4/2/26)
- Russia’s war economy is not collapsing, but neither is it stable
The Conversation, Yerzhan Tokbolat (17/12/25)
- Food prices are surging in Russia. Is the war hitting Russians in the pocket?
BBC News, Olga Shamina, Yaroslava Kiryukhina and Sergei Kagermazov (18/2/26)
- [Russian] GDP data — what it reveals, what it conceals
The Bell, Denis Kasyanchuk (18/2/26)
 What to Expect From the Russian Economy in 2026
Carnegie Endowment for International Peace, Alexandra Prokopenko and Alexander Gabuev (12/2/26)
- Indian refiners avoid Russian oil in push for US trade deal
Reuters, Nidhi Verma (8/2/26)
- What Breaks First – Russia’s Economy or Its War?
Visegrad Insight, Tomasz Kasprowicz (3/2/26)
Videos
Reports
Data
Questions
- What constraints are there currently on the supply side of the Russian economy?
- Some economists have argued that the economic effects of a stalemate in the Ukraine war would suit the Russian leadership more than peace or victory. Why might this be so?
- Under what circumstances might a deep recession in Russia be more likely than stagnation?
- In what ways does Russia’s current financial system resemble a pyramid scheme?
- What cannot a Keynesian boost contunue to support the Russian economy indefinitely?