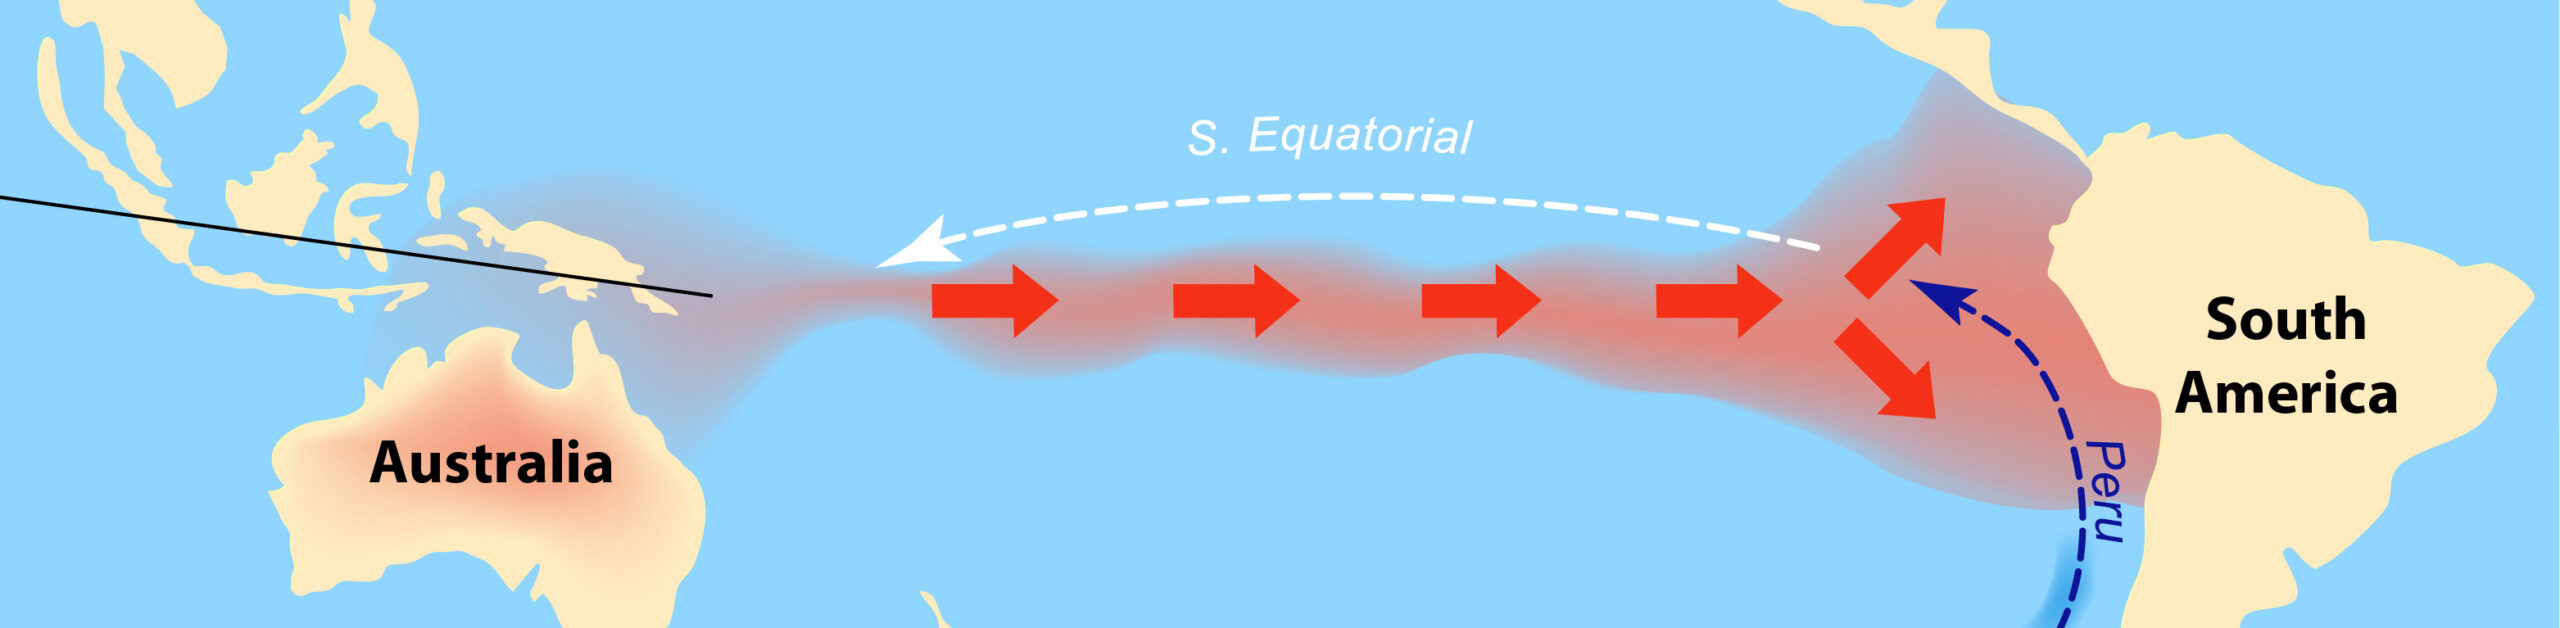
The World Meteorological Organization predicts that a ‘super El Niño’ is building. This has been nicknamed ‘Godzilla’. If forecasts are correct, this will be the most extreme El Niño in 1000 years.
El Niño is a natural phenomenon. It occurs when the surface temperatures in the central and eastern tropical Pacific Ocean warm and cause the trade winds that typically blow from east to west across the Pacific Ocean to weaken or even reverse direction. As well as increasing global temperatures and causing intense heatwaves, it can result in droughts in some parts of the world, such as eastern Australia, south-east Asia and southern Africa, and intense rain and flooding in parts of South America, eastern Africa and south-western North America.
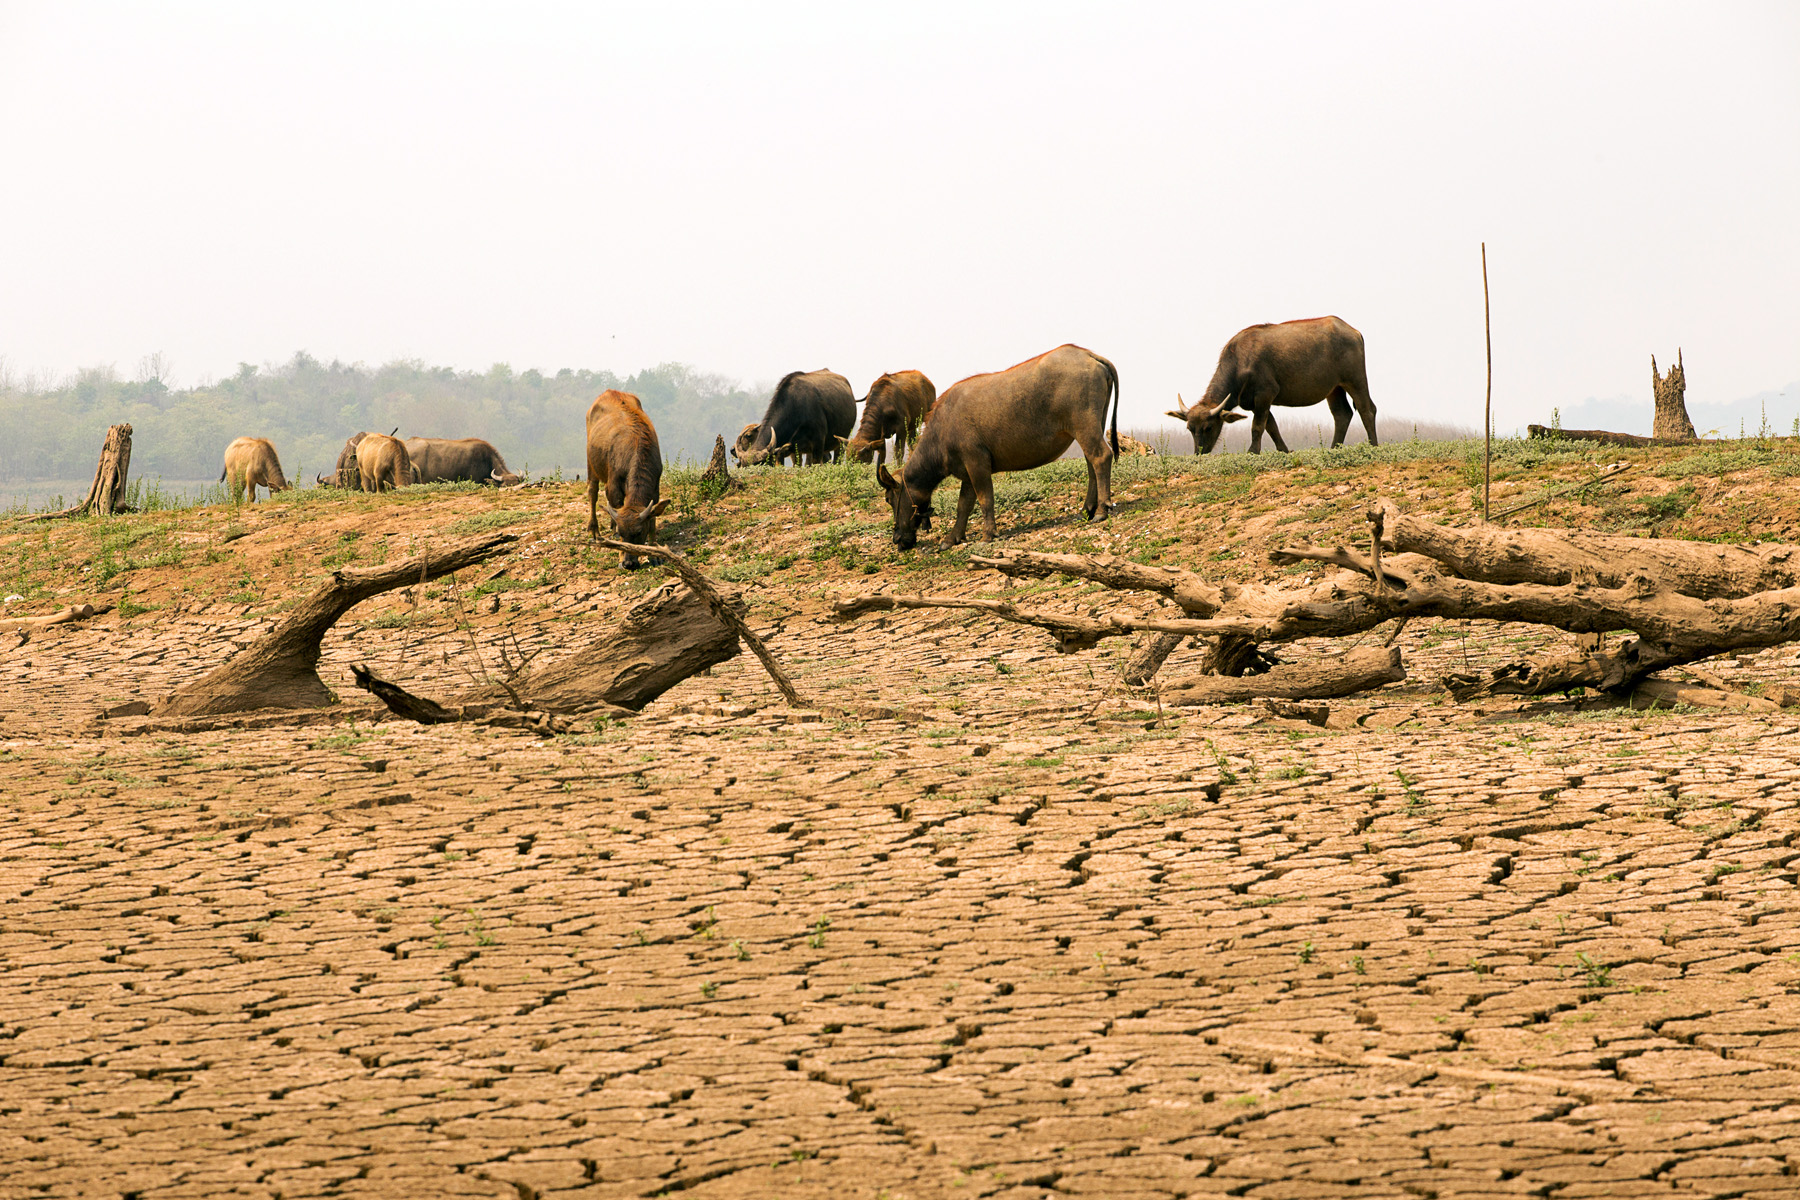
Typically, in an El-Niño event, the surface temperature of the central-eastern equatorial Pacific Ocean rises by 1°C to 1.5°C above the average. In the current El Niño, it is forecast to rise by up to 4°C by the end of 2026 and into 2027. It is already between 2.2°C and 2.6°C above the average. The effects could be catastrophic and hence the term ‘Godzilla’.
Although El Niño is a natural phenomenon, its severity is a direct result of climate change. This in turn is a direct result of economic decisions, and the effects will have severe economic consequences.
The economic causes
Climate change is an external cost of private economic decisions. When people or organisations burn fossil fuels, the climate costs of the CO2 emissions are not borne by the emitter. They are an external cost. This is illustrated in the diagram below, which shows the costs and benefits of electricity production from fossil fuels. (Click here for a PowerPoint.)
In this example, to make things simple, we assume that the external climate costs begin with the first unit of electricity generated and increase at a constant rate. The marginal social cost (MSC) of electricity generation equals the marginal private costs (MPC) to the generating company plus the marginal external cost in production MECP.
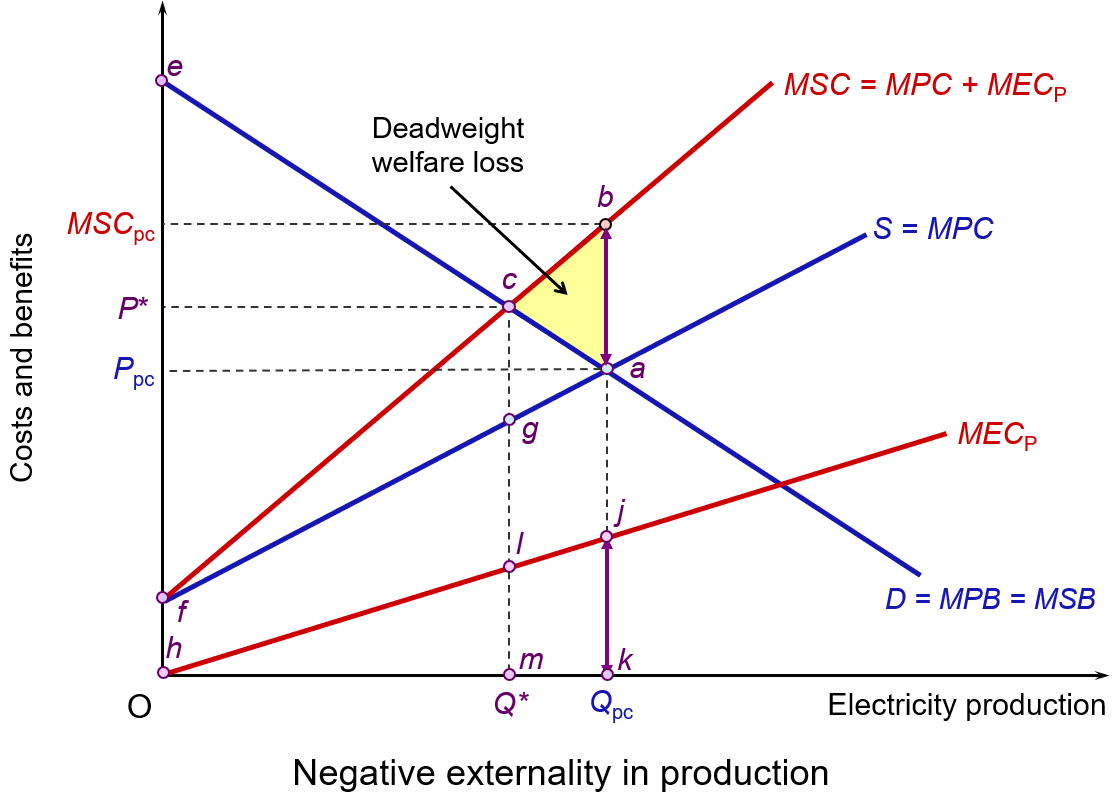 As you can see, the MSC curve is above the MPC curve. The vertical distance between them is equal to the MECP. It is also assumed that there are no externalities in consumption, which means that the marginal social benefit (MSB) curve is the same as the marginal private benefit (MPB) curve.
Competitive market forces, with producers and consumers responding only to private costs and benefits, will result in a market equilibrium at point a: i.e. where demand equals supply. The market equilibrium price is Ppc, while the market equilibrium quantity is Qpc. At Ppc, with no externalities on the consumption side, MPB is equal to MSB. The market price reflects both the private and social benefits from the last unit consumed. However, the presence of external costs in production means that MSC > MPC.
The socially optimal output would be Q*, where P = MSB = MSC, achieved at the socially optimal price of P*. This is illustrated at point c and clearly shows how external costs of production in a perfectly competitive market result in overproduction: i.e. Qpc > Q*. From society’s point of view, too much electricity is being produced from fossil fuels.
Total social surplus equals consumer surplus plus producer surplus minus the external costs. At the market equilibrium (Qpc) this is areas eaPpc+ Ppcaf – fba (or hjk, as it is the same size). At the socially optimal level of output (Q*) total social surplus is areas ecP* + P*cgf – fcg (or hlm).
Although consumer-plus-producer surplus is higher at the market equilibrium (Qpc) than at the socially optimum output (Q*) by the area cag, the external costs are higher still by the area cbag (or ljkm). Therefore, total social surplus at the market equilibrium is smaller than at the socially optimal point by area abc. This is a deadweight welfare loss and represents the excess of social costs over social benefits at all outputs above Q*. Put another way, moving from Qpc to Q* would represent a gain in social surplus of the area abc, as the fall in external costs outweighs the fall in consumer-plus-producer surplus.
One of the reasons why external environmental costs cause problems in a free-market economy is that no one has legal ownership of the atmosphere. Therefore, nobody has the ability either to prevent or to charge for their use as a ‘dumping ground’ for CO2. Such a ‘market’ is missing. Control must, therefore, be left to the government, international organisations, local authorities or regulators.
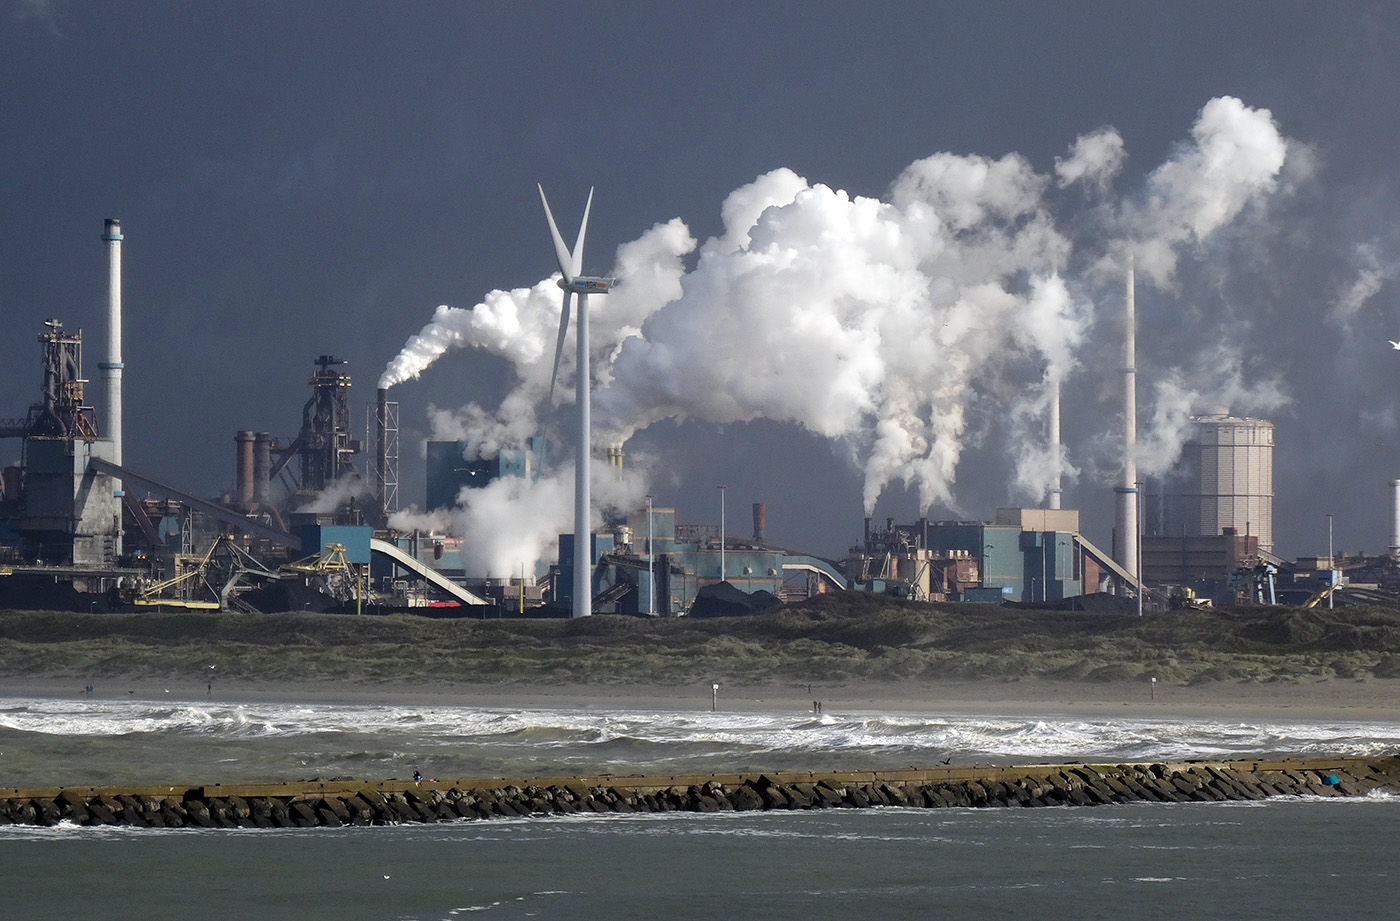 But such control is often too little. For example, when President Trump came to office in January 2025, he announced that the USA would withdraw from the UN’s Paris Agreement on climate change and that his policy towards oil production would be to ‘drill, baby, drill’. Indeed, governments globally spend hundreds of billions of dollars a year in subsidising oil, gas and coal production and its use, partly from pressure from the fossil fuel industry and partly to reduce the cost of living for consumers. This embeds fossil fuel dependence.
Game theory can help to explain the slow process of carbon reduction. For an individual country, such as the USA, it might argue that its optimum solution would be for other countries to cut their emissions, while maintaining its own levels. This approach would yield most of the benefits to the USA and none of the costs. However, when all countries argue like this, no progress is made. It’s a prisoners’ dilemma. Only if countries believe that the other countries will (a) ratify an agreement to cut emissions and (b) stick to the approved terms, is the agreement likely to succeed. This requires trust on all sides as well as the ability to monitor the outcomes.
Another major problem area concerns equity. Most countries will feel that they are being asked to do too much and that others are being asked to do too little. High-income countries will want to adopt a grandfathering approach. The starting point with this approach would be current levels of pollution. Every country would then be required to make the same percentage cut. Low-income countries, on the other hand, will want the bulk of the cuts, if not all of them, to be made by the rich countries. After all, the rich countries produce much higher levels of pollutants per capita than do the poor countries, and curbing growth in low-income countries would have a far more serious impact on levels of absolute poverty.
But will a supersized El Niño persuade countries to make deeper cuts in carbon emissions? In recent months commitments to achieving net zero emissions have waned. But the following economic consequences may encourage some countries to make deeper emissions cuts.
Economic consequences of a Godzilla El Niño
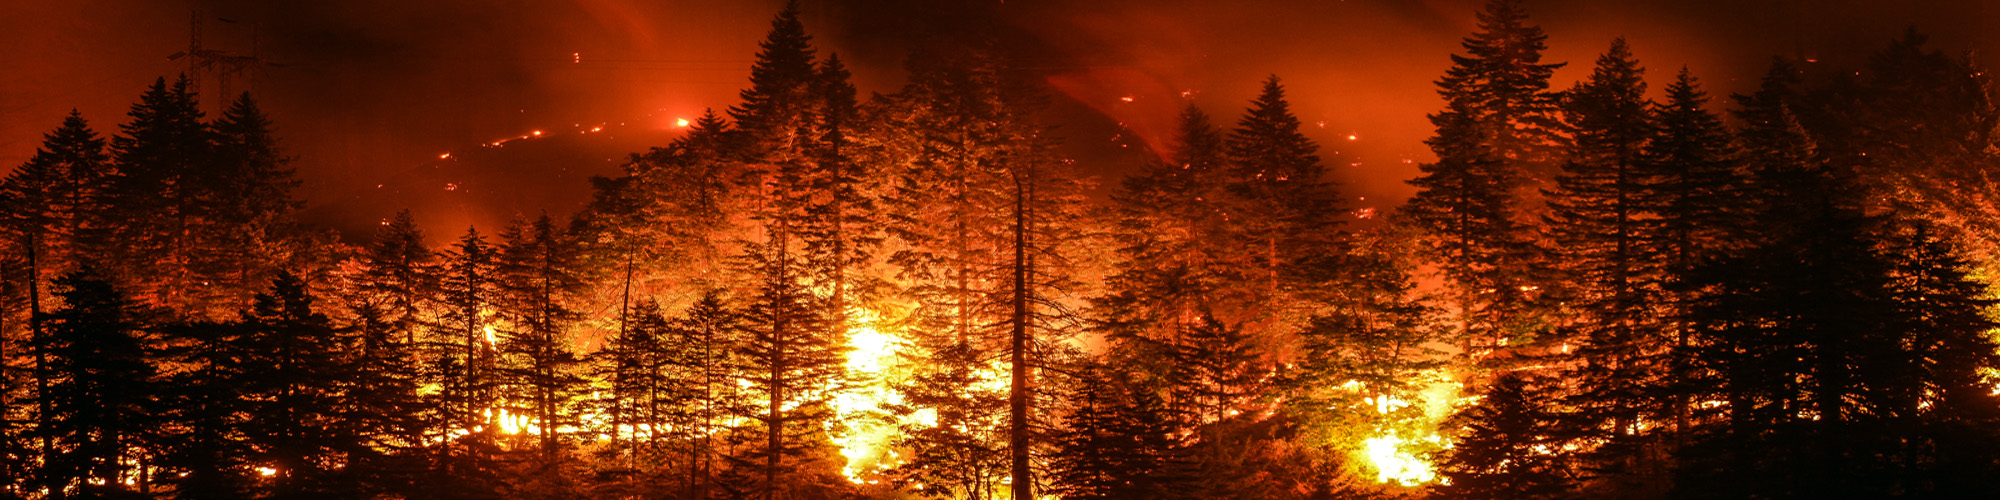
Extreme droughts, heat, wildfires and harvest failures in some areas and extreme rainfall and flooding in others will have severe economic consequences, often for the poorest people. There will be reductions in crop yields and loss of livelihood. Food prices will rise globally. This will add to the inflationary pressures from higher oil prices caused by the Iran war.
Droughts and wildfires in south-east Asia and Australia could have disastrous effects on harvests of palm oil, coffee, cocoa, rice, maize, wheat and various tropical fruits. Droughts and heat reduce output from hydropower and possibly wind energy, and industrial production may slow as a result of extreme heat in workplaces.
In Europe, warmer winters and unusually wet springs promote rapid plant growth. When this is followed by summer heatwaves, the undergrowth dries out and provides fuel for the wildfires. A super El Niño will amplify this. France and Spain have experienced massive wildfires these past few months. In the UK, the 2026 summer has been the hottest on record. The costs in Europe of the heat and wildfires in terms of lost crops and animals have been immense.
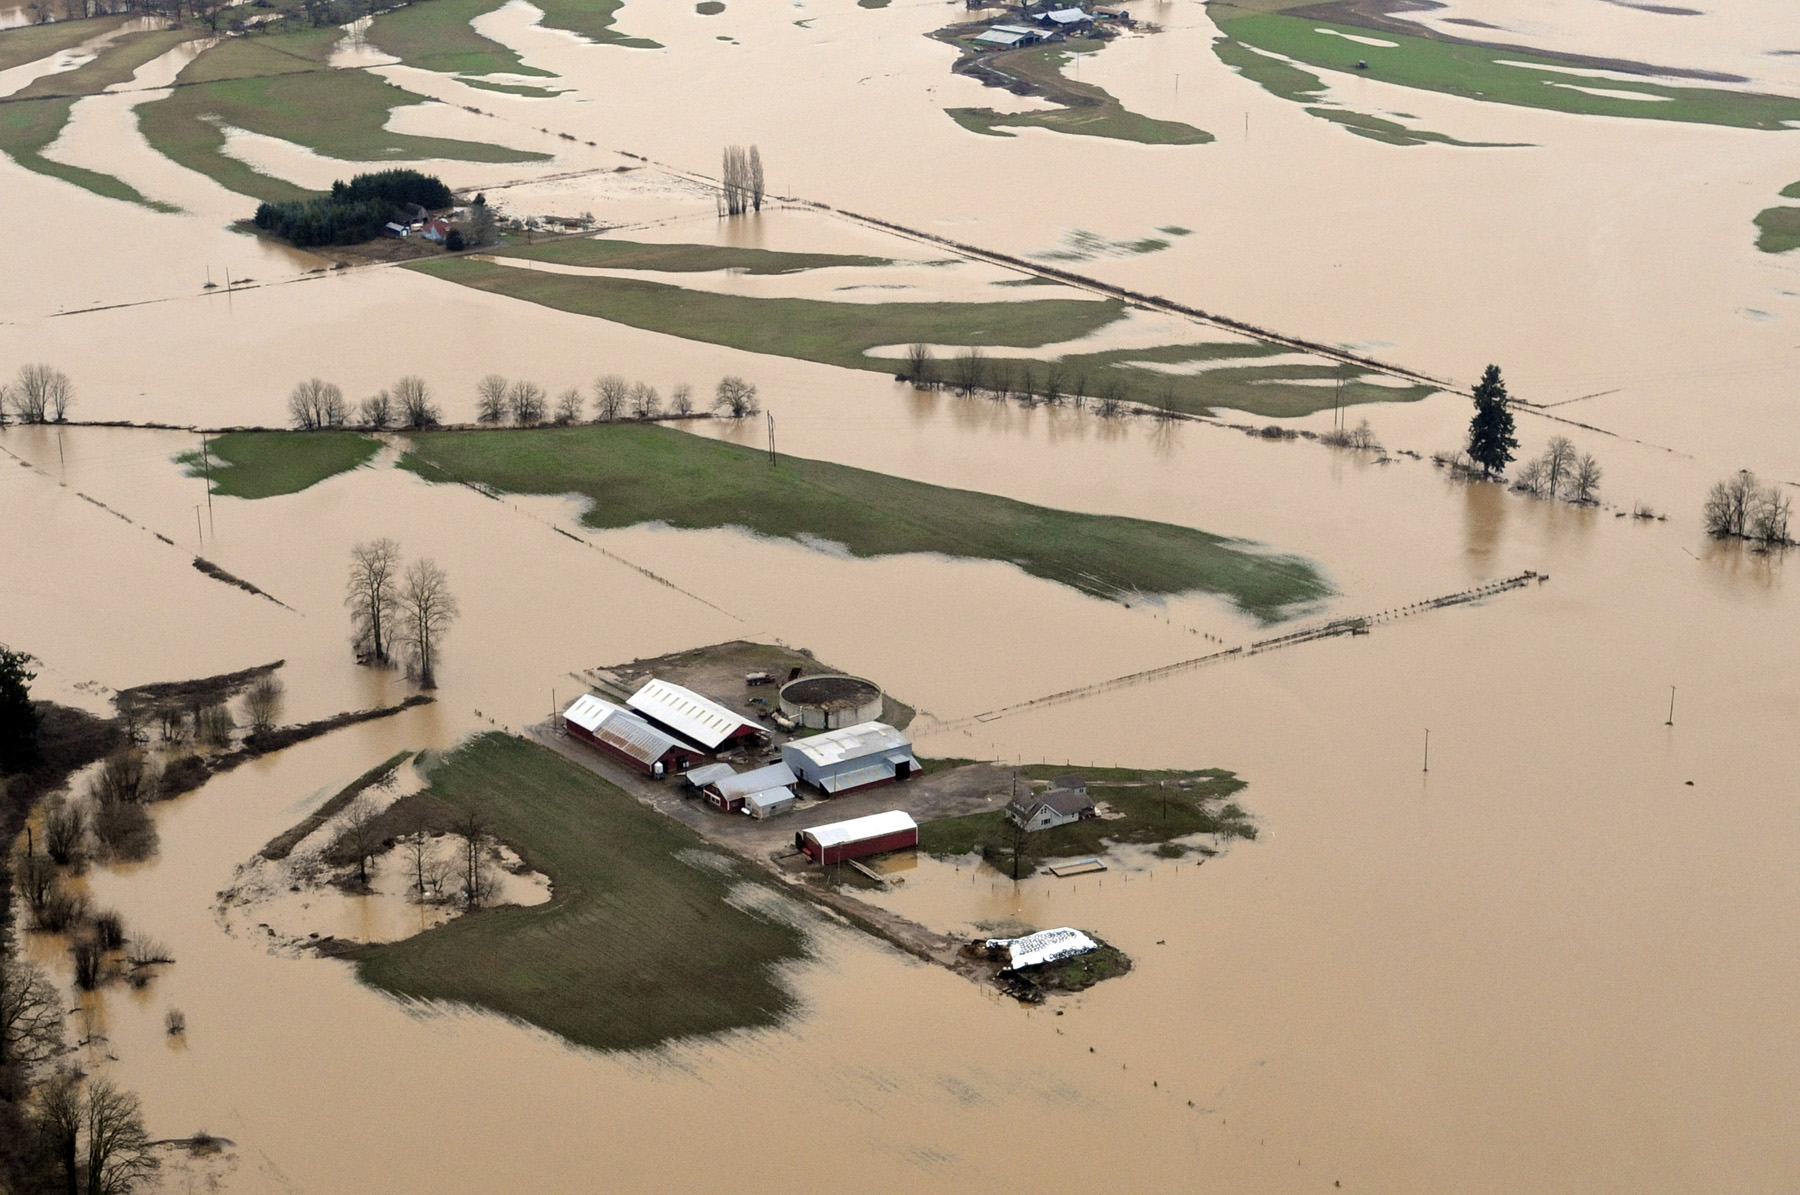 Floods and storms damage roads, power grids, railways and buildings. This forces governments to spend money on repairs instead of long-term investments. People are displaced and many are likely to lose their lives.
Fortunately, El Niños fade after a few months to be replaced by the cooler La Niña. The problem is that, with global warming, the next El Niño in a few years could be even more extreme with even more serious economic consequences.
The hope is that governments wake up to the pressing need to reduce carbon emissions.
Videos and podcast
 A ‘Super’ El Nino Is Coming For Southeast Asia. What Happens Next?
- ‘Godzilla-level’ El Niño could cause hottest year on record – The Latest
- What will El Niño cost us?
CNA Insider (Singapore) (1/9/26)
The Guardian, Today in Focus video, Lucy Hough and Damien Gayle (4/9/26)
BBC World Business Report (4/9/26)
Information
- Explainer: How the ‘super El Niño’ will reshape the world’s weather
- El Niño set to become very strong, raising risks of extreme weather into 2027
Carbon Brief, Robert McSweeney and Daisy Dunne (18/8/26)
World Meteorological Organization, Press Release (3/9/26)
Articles
- Building climate-resilient agriculture in Europe: an economic perspective
- What Super El Niño Means For Business Supply Chains And The Economy
- A summer of extremes: Weathering a hotter world
- Area in Europe affected by wildfires could triple due to climate change
- El Niño could drag down the global economy by almost $1 trillion or at least $7 trillion—and the choice is ours
- UN warns of ‘supersized’ El Niño as countries prepare for impact
- Toxic haze from wildfires spreads across South East Asia as ‘super’ El Niño intensifies
- A Super El Niño is coming: 5 hard‑won lessons the world can learn from Africa
- ‘Supersizing before our eyes’: UN warns of record El Niño approaching
- ‘Super’ El Niño could cause global food price shock lasting into 2028, analysts say
- Without action wildfires in Europe will increase 39% even in best-case climate scenario, study finds
- From classrooms to climate action: ICSE 2026 charts new path for sustainability
European Environment Agency (17/3/26)
Forbes, Chloe Demrovsky (25/8/26)
CBS News, Jonathan Vigliotti (16/8/26)
The National (UAE), Tariq Tahir (20/8/26)
Peterson Institute for International Economics, Cullen S Hendrix (26/7/26)
BBC News, Esme Stallard, Mark Poynting, Becky Dale, Yvette Tan, Tiffanie Turnbull and Nikita Yadav (3/9/26)
BBC News (2/9/26)
The Conversation, Tafadzwanashe Mabhaudhi and Mendy Ndlovu (5/7/26)
The Guardian, Damian Carrington (3/9/26)
The Guardian, Richard Partington (12/7/26)
The Guardian, Ajit Niranjan (20/8/26)
Economic Times (Times of India) (2/9/26)
Questions
- What is the current state of progress towards meeting the goals of the UN Paris Climate Agreement?
- Are there any externalities in consumption that affect global warming?
- How might technological progress make it privately profitable to reduce carbon emissions?
- How might global supply chains and shipping be affected by a super El Niño?
- What role can education play in tackling climate change and its effects?
