
The US national debt hit a milestone in August 2026. It reached a staggering $40 trillion. The national debt is the amount owed by the US federal government to holders of government bonds and bills (treasury securities). The debt grows each year by the size of the annual government deficit, which is the amount that government expenditure exceeds tax and other revenues. The bigger the deficit, the more the national debt grows. The $40 trillion debt represents 126% of GDP – in other words it is more that the total annual output of the USA. It represents around $118,000 per head or $290,000 per household
But does this high and rising debt matter? And how does it compare with other countries?
The comparative size of the national debt
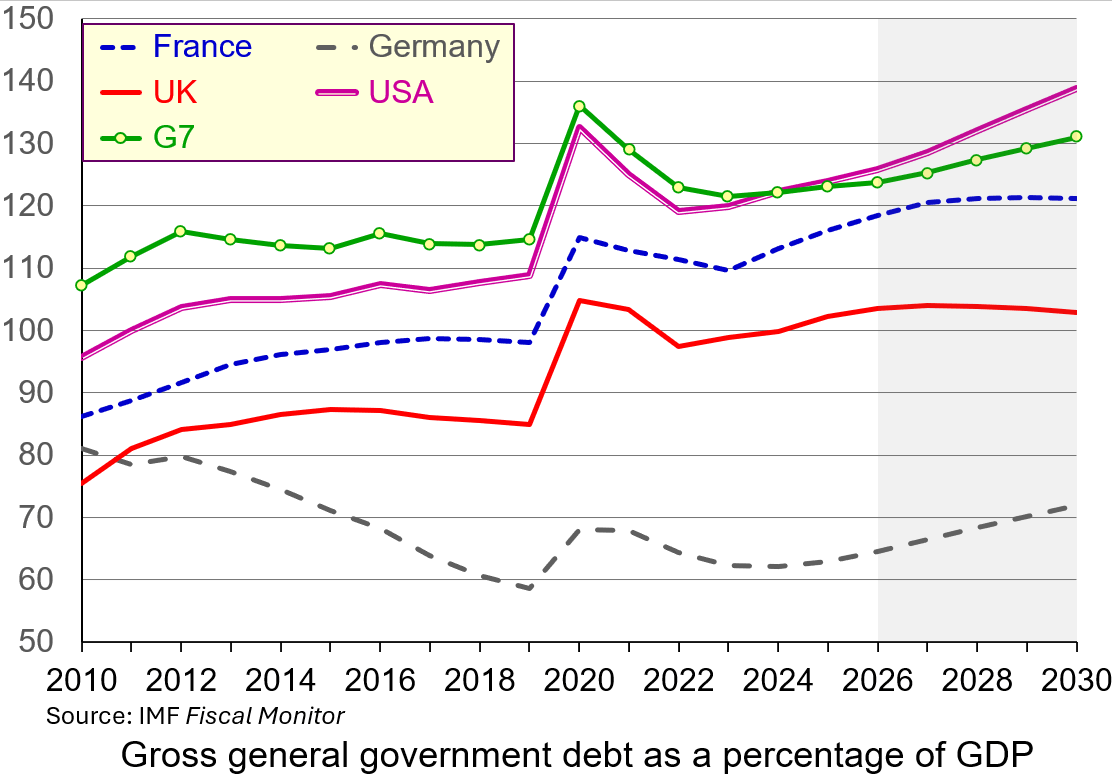 In absolute terms, the US national debt is huge, reflecting, in part, the size of the US economy. In percentage terms (126% of GDP), it is higher than Germany (65%), the UK (104%), Canada (110%) and France (118%) and slightly higher than the G7 average (124%). It is lower, however, than Italy (138%) and much lower than Japan (204%).
What is more, the IMF forecasts that the US national debt will rise from 126% of GDP in 2026 to 139% by 2030. This is because of continuing budget deficits, which require funding. The federal budget deficit is forecast to be around $2 trillion in the financial year ending September 2026 – it was $1.78 trillion in the previous financial year.
Japan’s debt percentage, by contrast, is forecast to fall from 204% in 2026 to 194% by 2030. Also, only about 10% of Japan’s debt is held by foreign investors. Around 90% is financed domestically by Japanese households, local banks, insurance companies, and the Bank of Japan. This makes Japan’s debt more sustainable than the USA’s, where around 28% is held by foreign investors (foreign governments, companies, banks and individuals).
Unlike domestic institutions (such as pension funds), which often have a structural bias to hold domestic assets, foreign investors typically view a country’s bonds as one of many global alternatives and are likely to switch faster to other countries’ assets during periods of market stress. The higher the proportion of bonds held outside the country, the more vulnerable the country is likely to be to bond market speculation.
The UK’s national debt percentage is forecast to fall slightly from 104% of GDP in 2026 to 103% in 2030. However, the UK is a global financial hub and the percentage of debt held by foreign investors (around 30%) is a little higher than in the USA. UK debt held overseas has risen from around 15% in the mid-2000s. It is likely to rise further.
Does high and rising US national debt matter?
 Servicing the debt. In February 2022, the US central bank rate (the Federal Funds rate) was 0.25%. It then rose in increments to combat rising inflation and reached 5.5% by July 2023. Although it has come down slightly since, standing at 3.75% in August 2026, US interest rates are higher now than at any time from 2008 to 2022. With higher interest rates, the USA now pays roughly $1.1 trillion annually just to service the debt. This accounts for around 15% of total federal spending – up from an historical 50-year average of just under 9%.
Upward pressure on domestic borrowing rates. To fund its deficits, the US Treasury Department must continually issue massive amounts of government bonds. This high volume of government borrowing competes for capital in global financial markets, which can push up broader interest rates. For businesses, this imposes a cost on investment and can act as a disincentive to borrow. For consumers, it adds to cost-of-living pressures by raising the cost of mortgages, car loans, credit card debt and other borrowing.
Crowding out other public spending. The money spent on servicing the debt is not available for building roads or other infrastructure, funding education, healthcare or defence, or providing social security. Annual interest payments of around $1.1 trillion now exceed national defence spending (around £960 billion), making it the third-largest item in the federal budget after healthcare and social security. As the national deficits and debt expand, so a higher proportion of current taxes is being used to fund past expenditure.
Long-term fiscal risk
The US dollar is the world’s primary reserve currency. This creates persistent global demand for US debt. However, ratings agencies and other organisations, such as the Congressional Budget Office (CBO), warn that adding $1 trillion to national debt roughly every five months is an unsustainable trajectory that could eventually erode confidence in the US economy.
 Already, many countries are seeking to expand the range of currencies used as reserves, including Chinese yuan, the euro and crypto currencies. They are also holding more gold. In 2001, the US dollar accounted for 72% of currencies held globally as reserves; by 2025 this had fallen to 57%. This process could accelerate as confidence in the USA is eroded because of the size of the debt and the capricious policies towards trade.
During periods of quantitative easing (QE), central banks, including the Fed, purchased large amounts of government bonds. But now, as central banks scale back their bond holdings in programmes of quantitative tightening (QT), foreign private investors and domestic households are being forced to absorb the majority of newly issued government debt, making pricing and yields increasingly sensitive to global investor demands. A decline in confidence can lead to a large sale of bonds, forcing down their price, thereby forcing up their yield and hence the interest that has to be paid on newly issued bonds. This is what happened in the UK in September 2022 under the short-lived administration of Liz Truss when she and her chancellor, Kwasi Kwarteng, made unfunded promises of tax cuts.
The USA is not immune to such bond market jitters. In mid-August, the yield on 30-year US Treasury bonds reached 5.3% – the highest level since 2007.
A worsening problem
 The US deficit is likely to increase, making the national debt rise more rapidly. There are various reasons.
The US population, as in many countries, is ageing and the proportion of retired people is rising. This puts increasing demands on healthcare and social security, with a proportionately smaller workforce to fund them.
The deficit has also been increased by deliberate government policies. For example, Donald Trump’s 2025 ‘One Big Beautiful Bill’ Act made substantial tax cuts, largely for the wealthy.
Congress caps the debt at a certain level and in the past this has acted as a brake on size of the deficit. However, the cap was raised by $5 trillion in 2025 and this could well happen again, allowing debt levels to expand further.
But reining in the deficit could have a contractionary effect on the economy as taxes are raised and/or expenditure is cut. Governments are reluctant to do this as it could lead to recession, or at least falling growth in the short term, and this could affect their chances or re-election. With the mid-terms approaching in the USA, and the presidential election just two years later, this is an unlikely policy for the Trump administration to pursue.
Articles
- Five charts explaining America’s $40 trillion debt
euronews, oloresz Katanich (22/8/26)
- How Much the National Debt Grew Under Trump and Biden
Time, Chantelle Lee (22/8/26)
- 7 questions about the national debt hitting $40 trillion
PBS News, Lisa Desjardins (19/8/26)
- The U.S. National Debt Officially Surpassed $40 Trillion in August: Here’s What History Says This Means for the Stock Market
Yahoo! Finance, Neil Patel, The Motley Fool (24/8/26)
- National debt reaches grim $40 trillion milestone. Here’s why that matters
CNN, Tami Luhby, John Towfighi, Matt Stiles and Amy O’Kruk (20/8/26)
- Jumpy bond markets make it clear: Trump risks driving US into debt crisis
The Guardian, Heather Stewart (23/8/26)
- Is the Trump Treasury panicking over the level of US debt?
The Guardian, Kenneth Rogoff (26/8/26)
- US debt hits $40 trillion: Who does Washington owe and why does it matter?
Aljazeera, Shola Lawal (21/8/26)
- US national debt passes $40tn after doubling in a decade
BBC News, Michael Race and Francisco Velasquez (20/8/26)
- Why the US economy is ringing alarm bells
BBC News, Michael Race (21/8/26)
- The war is raising the price of money. That’s a problem for the global economy
CNN, Matt Egan (2/9/26)
Information
Questions
- Distinguish between national debt, central government debt and general government debt.
- Would it be possible to run a budget deficit and yet for the national debt to fall as a percentage of GDP?
- Japan and Italy have a higher debt to GDP ratio than the USA or the UK. Why are they less subject to bond market pressures than the USA or the UK?
- What policy measures would you recommend to the US government to tackle the rising national debt and why?
- Could the USA ‘grow its way out of the debt problem’?

The yen has been depreciating against the dollar and other currencies for several months. It fell from 100 yen = $0.97 in January 2021 to $0.61 by the end of July 2026 – a fall of 37%. This marked a 40-year low. But then, at the end of July it rallied and by 3 August the rate was 100 yen = $0.64 – a rise of nearly 5%. But why did this happen and what will be the implications for Japan and the wider world economy?
Why has the yen fallen so much since 2021?
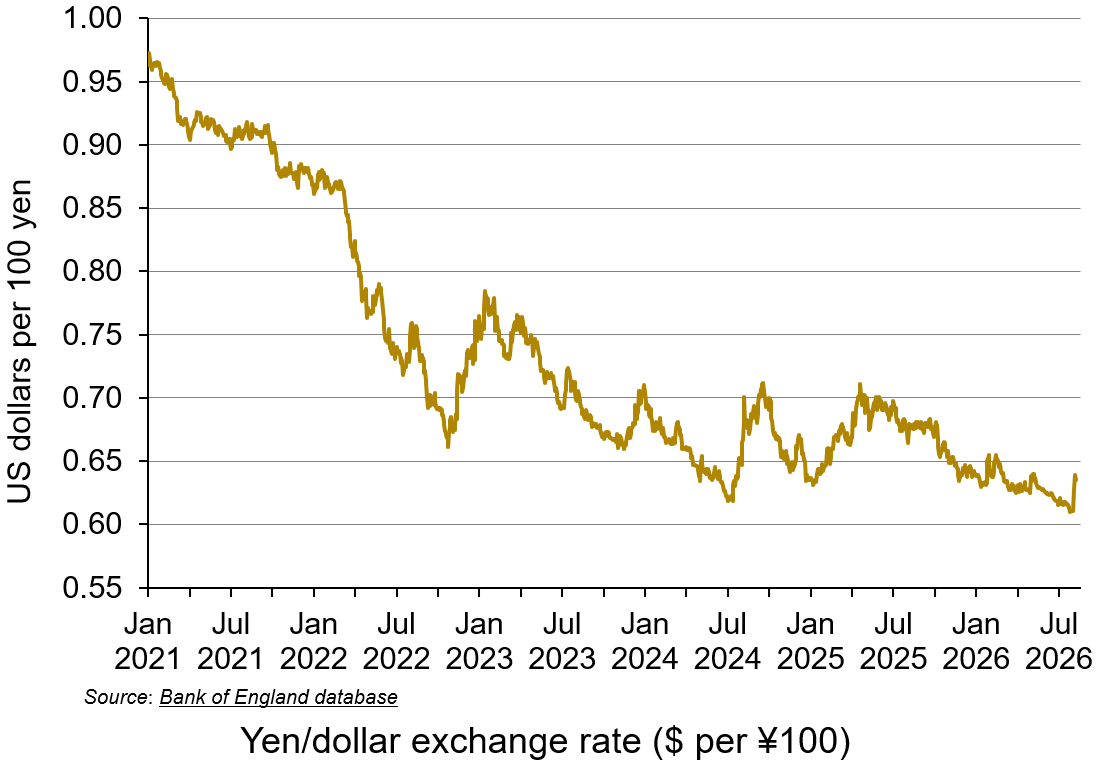 There have been two main drivers.
The first is fiscal policy. For many years, Japan has been pursuing expansionary fiscal policy in an attempt to stimulate the sluggish economy. This has led to large budget deficits and public-sector debt. Since 2020, general government gross debt has been around 255% of GDP, the largest of any high-income economy.
Recently, the Japanese government has adopted aggressive supplementary budgets to fund, among other things, fuel subsidies and public-private investment initiatives. This has involved the issuance of more government bonds to fund the necessary borrowing.
 Fiscal pressures have also increased becase of demography. A rapidly aging population and declining birth rates have required substantial public spending on healthcare, social security and pensions. Meanwhile, the tax-paying working-age population has declined as a proportion of total population.
On the plus side, unlike most highly indebted nations, over 90% of Japan’s debt is held domestically by Japanese residents, Japanese institutional investors, banks and the Bank of Japan (BoJ). This lowers the risk of default and hence the risk premium on Japanese bonds.
 The second driver is monetary policy. Interest rates have been kept low over many years, including periods of negative rates, as the BoJ has attempted to stimulate the economy. Low interest rates have sometimes been backed up with quantitative easing to increase money supply.
Since March 2024, however, there have been four interest rate increases. The latest was in June 2026 when the BoJ raised the short-term policy rate from 0.75% to 1.0% – the highest level since 1995. Despite this, interest rates have remained below those in other countries, and this contributed to the continuing fall of the yen.
A falling yen has helped to increase Japanese exports by making them more competitive, but more expensive imports have contributed to rising Japanese inflation.
Low interest rates have also stimulated the yen-dollar carry trade. This is where investors borrow money in yen at low interest rates, convert it into US dollars and invest it in higher-yielding US assets, typically US government bonds (‘Treasury bonds’). This borrowing in yen to buy dollars further contributed to the depreciation of the yen against the dollar.
Co-ordinated intervention
 In an attempt to raise the value of the yen, the Bank of Japan and the US Federal Reserve acted together – their first joint currency rescue operation since 2011. The BoJ spent tens of billions of dollars to buy yen; the US Treasury bought yen by selling euros. Prior to the intervention, global hedge funds held near-record short positions against the yen, meaning that they sold yen at a current price, agreeing to buy them back at a particular later date, hoping that the yen would fall in the meantime and that they would therefore make a profit. The sudden joint intervention forced these traders to buy back the yen to cut their losses before the rate rose further. This accelerated the yen’s appreciation.
But why did the USA join Japan in intervening? Japan is the largest foreign holder of US Treasuries ($1.1 trillion). The USA intervened to discourage Japanese investors from selling US Treasuries in order to raise cash, thereby pushing up US borrowing costs.
The rise in the yen was also encouraged by speculators who are expecting further interest rate rises from the BoJ to counter inflation and support public finances, driving domestic bond yields higher. This will lead to a narrowing of interest rates between Japan and other countries.
Effects on the Japanese economy
 If the yen continues to appreciate, this will help to reduce inflation by making imports cheaper and will help to ease cost-of-living pressures on Japanese consumers. Japan is heavily reliant on imported energy and raw materials.
However, the decline in the yen over recent years has provided a large boost to Japanese exports. A sharp reversal in this could severely affect exporters’ profits and have a serious negative impact on economic growth.
If the appreciation continues, it would lead to an unwinding of the carry trade. To prevent mounting currency losses, highly leveraged institutional investors would be forced to sell assets, such as US and other countries’ shares and bonds to buy back yen and pay off their debts. This potentially massive unwinding would be likely to create global market volatility and drive up interest rates.
Articles
- Yen holds gains after Japan, US confirm joint intervention, signal more action
Reuters, Makiko Yamazaki and Leika Kihara (3/8/26)
- Yen surges to three-month peak, dollar pares losses after intervention
Reuters, Chibuike Oguh (3/8/26)
- US dollar weakens sharply against the Japanese yen after officials intervene in markets
ABC7 Eyewitness News, Mayuko Ono and Elaine Kurtenbach (3/8/26)
- Yen hits three-month high after Trump helps prop up currency
The Guardian, Graeme Wearden (3/8/26)
- Why has Trump stepped in to prop up Japan’s currency?
The Guardian, Jonathan Yerushalmy (3/8/26)
- Why the U.S. stepped in after decades to prop up Japan’s yen — and what’s at stake
CNBC, Lee Ying Shan (3/8/26)
- Politics & Policy Analysis: How Bessent is pushing Warsh’s Fed to expand backstop for Japan’s yen defense
CNBC, Matt Peterson (3/8/26)
- Why Japan is propping up the yen – and why the US helped
The Straits Times (4/8/26)
- The Pros and Cons of a Strong Dollar
Johnston Investment Counsel (3/8/26)
- Why the U.S. Stepped In to Prop Up Japan’s Yen Currency
Yahoo!Finance, Tiago Ventura (3/8/26)
- Why the U.S. Is Helping Prop Up Japan’s Weak Currency
The New York Times, Eshe Nelson (3/8/26)
- U.S.-Japan Intervention Triggers Yen Carry Trade Fears
The Chosun Daily, Lee Hai-woon (3/8/26)
- What top minds in markets are saying about the US intervention to prop up Japan’s currency
Business Insider, Jennifer Sor (3/8/26)
Data
Questions
- What have been the benefits and costs to Japan of a depreciating exchange rate?
- Explain the carry trade.
- Why might the yen-dollar carry trade unwind and what would be the consequences for Japan and the USA?
- Find out what has happened to the exchange rate between the yen and the euro. Has this been driven by the carry trade?
- For what reasons might the yen (a) now continue rising; (b) resume depreciating?
- Find out what has happened to the yen/dollar exchange rate since this blog was written. Explain your findings.
 At the fourth anniversary of Russia’s invasion of Ukraine, we look at the effect of the war on the Russian economy. Two years ago, in the blog The Russian economy after two years of war, we argued that the Russian economy had seemingly weathered the war successfully.
Unlike Ukraine, very little of its infrastructure had been destroyed; it had started the war with a current account balance of payments surplus, a budget surplus and a low general government debt-to-GDP ratio; it had achieved a lot of success in diverting its exports, including oil, away from countries imposing sanctions to countries such as China and India; it was the same with imports, with China especially becoming a major suppliers of machinery, components and vehicles; it has a strong central bank, which engenders a high level of confidence in managing inflation; the military expenditure provided a Keynesian boost to the economy, with production and employment rising.
The situation today
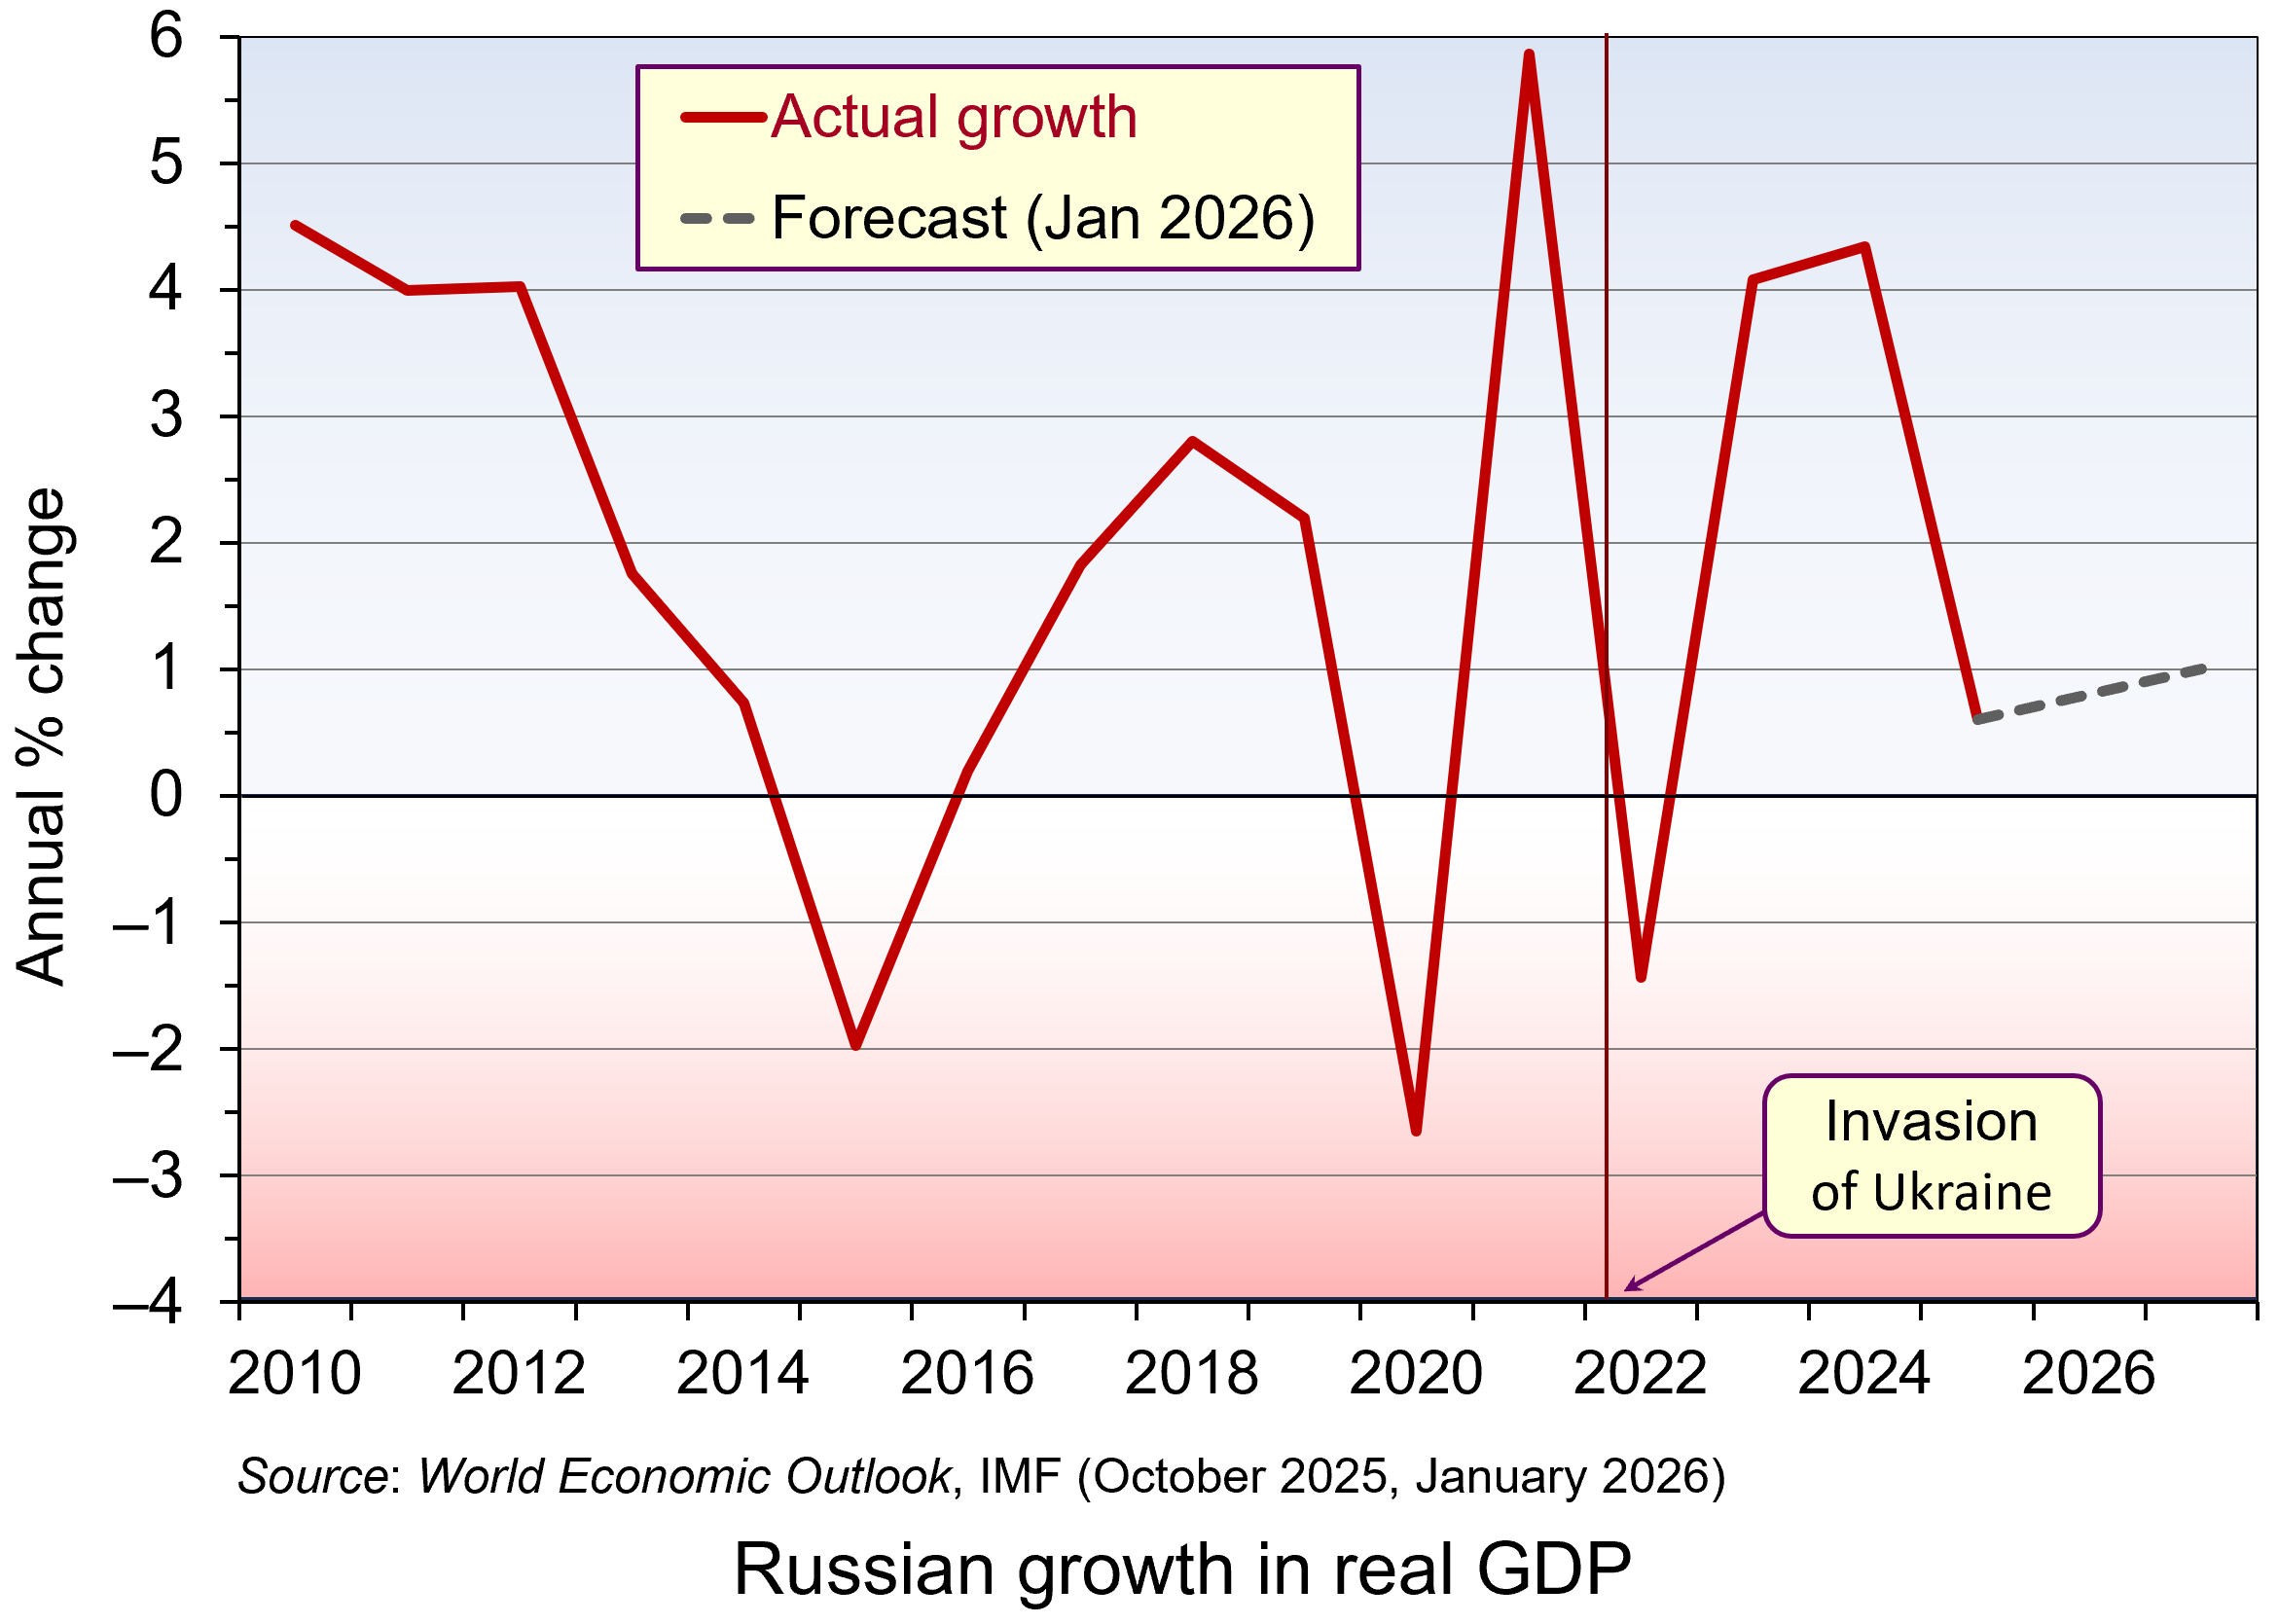 But two years further on, the Russian economy is looking a lot weaker and on the verge of recession. GDP growth fell to 0.6 per cent in 2025 and is forecast to be no more than 1 per cent for the next two years. (Click here for a PowerPoint of the chart.) And despite growth still being positive (just), this is largely because of the growth in military expenditure. Retail and wholesale trade fell by 1.1% in 2025, reflecting supply chain problems and high inflation dampening consumer demand.
With labour being diverted into the armaments and allied industries or into the armed forces, this has led to labour shortages. This has been compounded by the emigration of up to 1 million people by 2025 – often young, educated and skilled professionals.
 Official CPI inflation averaged 8.7 per cent in 2025, although the prices of food and other consumer essentials rose by more, especially in recent months. At the beginning of 2026, supermarket prices rose by 2.3% in just one month, made worse by a rise in VAT from 20% to 22%. The central bank has responded to the high inflation with high interest rates, which averaged 19.2% in 2025, giving a real rate of 10.5%. With such a high real rate, the response of households has been to save. This has masked the constraints on production, or imports, of consumer goods. Savings have also been boosted by large payments to soldiers and bereaved families, with the money saved by the recipients being used in part to fund future such payments. So far there has been trust in the banking system, but if that trust waned and people starting making large withdrawals of savings, it could be seriously destabilising.
Whilst the high real interest rates have helped to mask shortages of consumer goods, they have had a seriously dampening effect on investment by domestic companies. Gross capital formation fell by 3% in 2025, not helped by an increase in the corporation tax from 20% to 25%. At the same time, foreign direct investment remains subdued due to high perceived risks. The lack of investment, plus the labour shortages, will have profound effects on the supply side of the economy, with potential output in the non-military sector likely to decline over the medium term.
 The balance of payments and government finances are turning less favourable. The balance of trade surplus has declined from US$173bn in 2021 to US$67bn in 2025. This could decline further, or even become a deficit, if oil prices continue to be weak, if Western sanctions are tightened (such as stopping the flow of Russian oil exports in the ‘shadow’ fleet of tankers) or if major importing countries stop buying Russian oil. Indian refiners have announced that they are not taking Russian crude in March/April as India seeks to finalise a trade deal with the USA.
The budget balance has moved from a small surplus of 0.8% of GDP in 2021 to a deficit of 2.9% in 2025. Although the government debt-to-GDP ratio remains low by international standards at 23.1% of GDP in 2025, this was up from 16.5% in 2021 and is set to rise further as budget deficits deepen. Nevertheless, as long as the saving rate remains high, the debt can be serviced by domestic bond purchase.
Russia’s economy is definitely weakening and labour shortages and low investment will create major problems for the future. But whether this deterioration will be enough to change Russia’s stance on the war in Ukraine remains to be seen.
Articles
- The Russian economy is finally stagnating. What does it mean for the war – and for Putin?
The Guardian, Alex Clark (6/2/26)
- Exclusive: Russia’s budget deficit may almost triple this year as oil revenues decline
Reuters (4/2/26)
- Russia’s war economy is not collapsing, but neither is it stable
The Conversation, Yerzhan Tokbolat (17/12/25)
- Food prices are surging in Russia. Is the war hitting Russians in the pocket?
BBC News, Olga Shamina, Yaroslava Kiryukhina and Sergei Kagermazov (18/2/26)
- [Russian] GDP data — what it reveals, what it conceals
The Bell, Denis Kasyanchuk (18/2/26)
 What to Expect From the Russian Economy in 2026
Carnegie Endowment for International Peace, Alexandra Prokopenko and Alexander Gabuev (12/2/26)
- Indian refiners avoid Russian oil in push for US trade deal
Reuters, Nidhi Verma (8/2/26)
- What Breaks First – Russia’s Economy or Its War?
Visegrad Insight, Tomasz Kasprowicz (3/2/26)
Videos
Reports
Data
Questions
- What constraints are there currently on the supply side of the Russian economy?
- Some economists have argued that the economic effects of a stalemate in the Ukraine war would suit the Russian leadership more than peace or victory. Why might this be so?
- Under what circumstances might a deep recession in Russia be more likely than stagnation?
- In what ways does Russia’s current financial system resemble a pyramid scheme?
- What cannot a Keynesian boost contunue to support the Russian economy indefinitely?
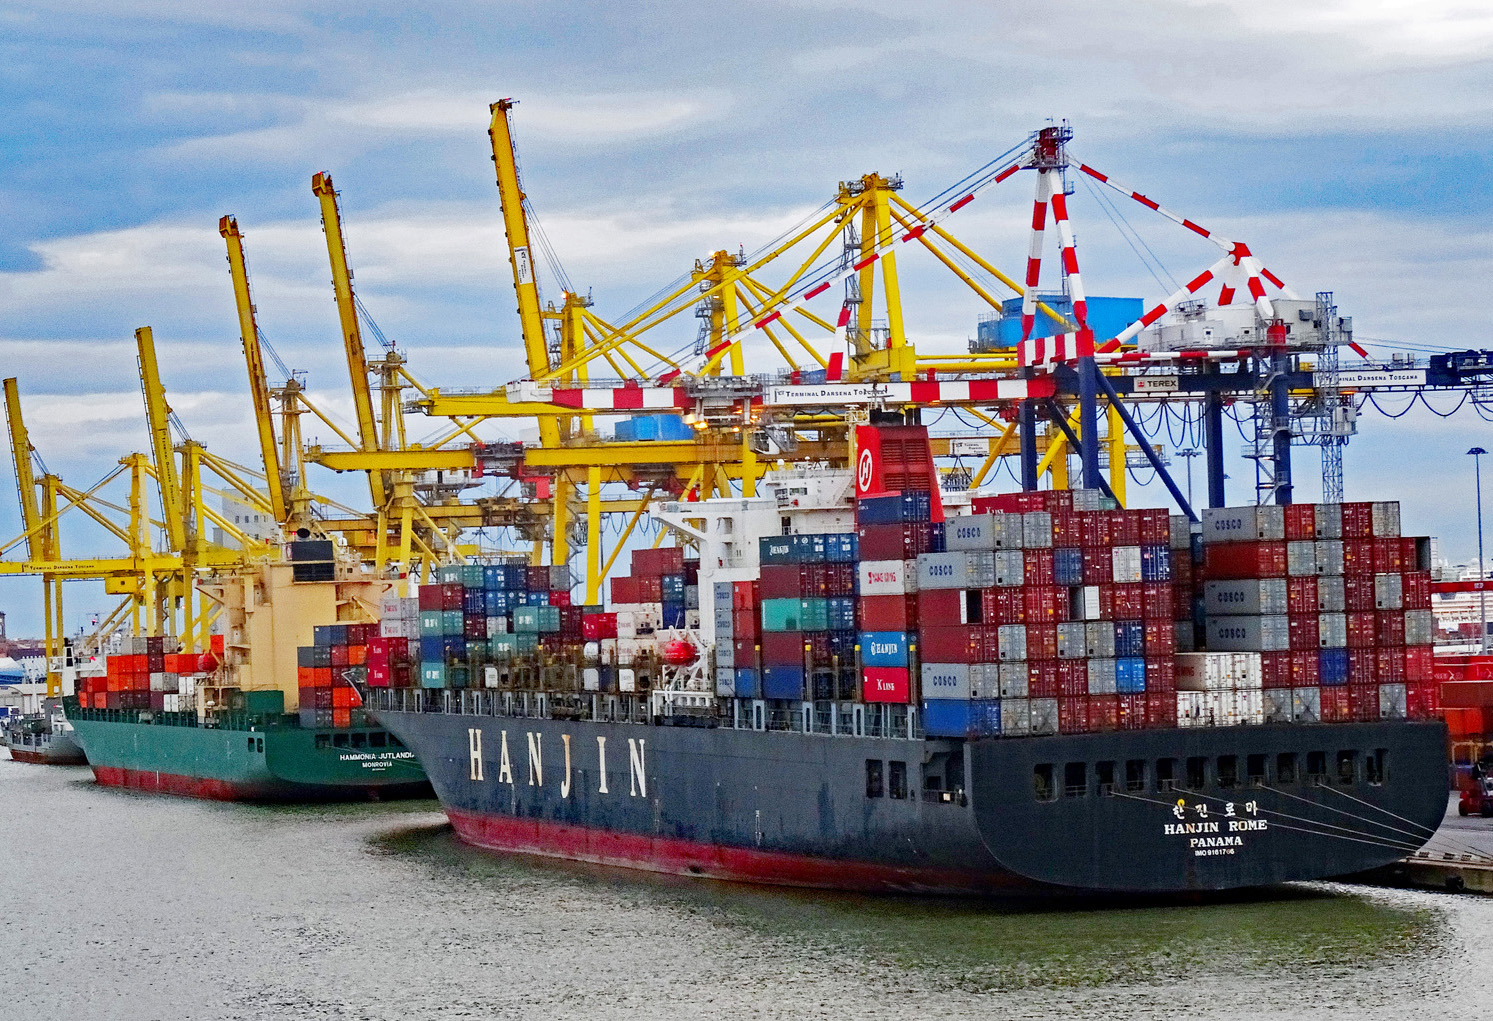 Three recent reports (see links below) have suggested that US consumers and businesses pay most of the tariffs imposed by the second Trump administration. The percentage varies from around 86% to 96%. US customs revenue surged by approximately $200 billion in 2025, but this was a tax paid almost entirely by US consumers and businesses. Foreign suppliers largely maintained their (pre-tariff) prices. They took a hit in terms of reduced volumes rather than reduced pre-tariff prices.
The incidence of a tariff between consumers, domestic importers and overseas producers will depend on price elasticities of demand and supply. The following diagram shows a product where the importing country is large enough to have a degree of market power, which will normally be the case with the USA. The greater its buying power, the flatter will be its demand curve, showing that the foreign supplier will have little influence on the price. With no tariff, the equilibrium price paid by importers will be at point a, where demand equals supply. Q1 would be imported at a price of P1.
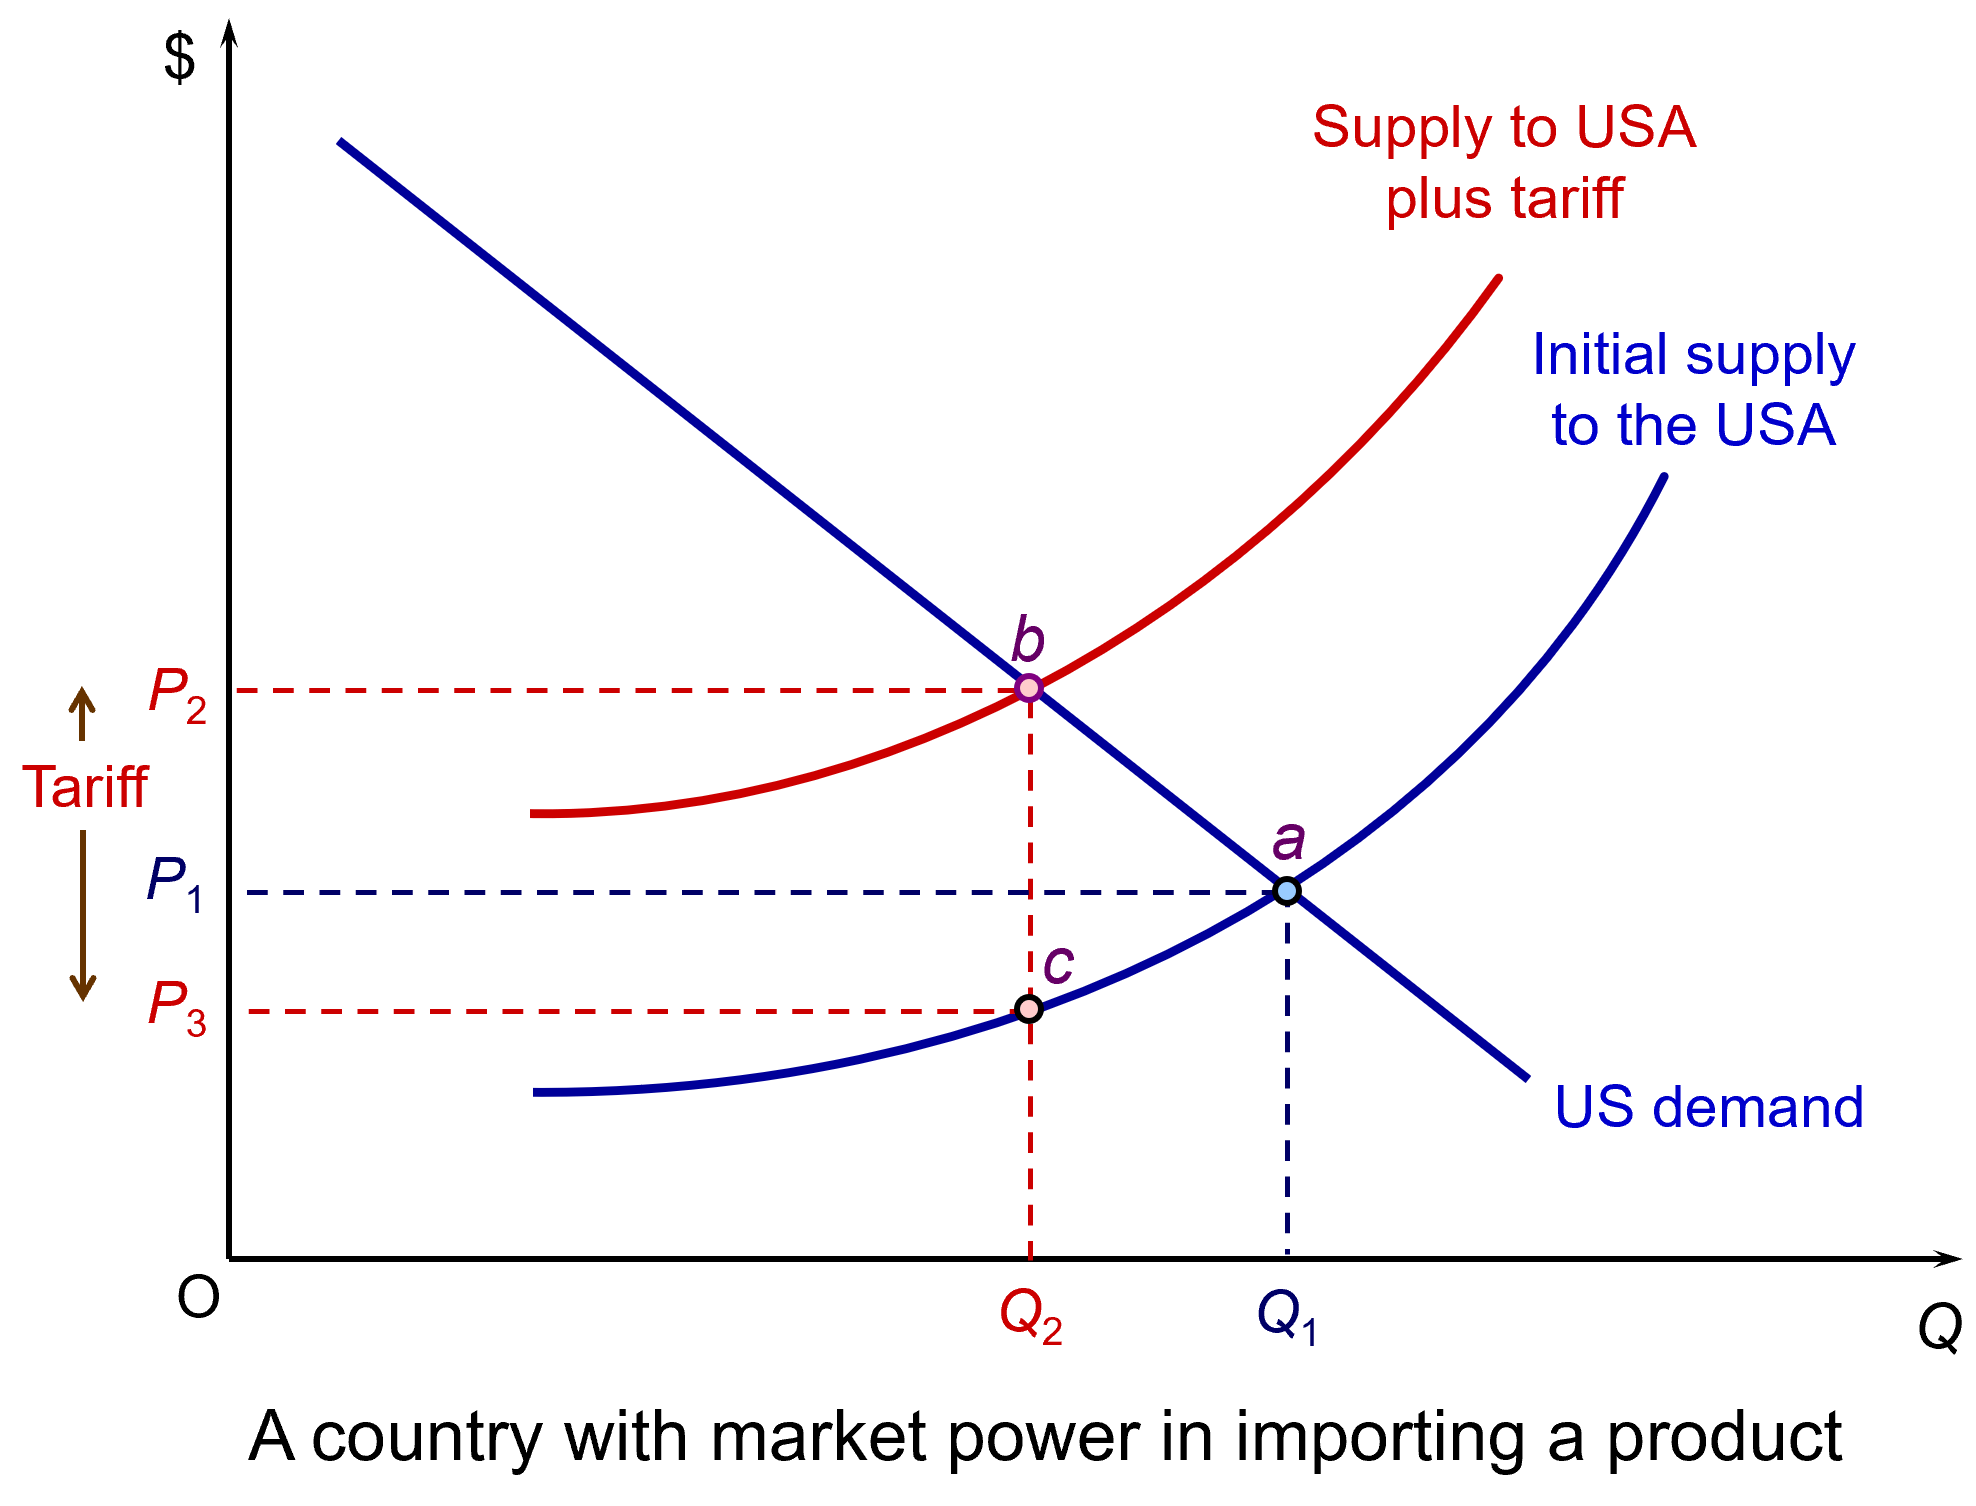 Imposition of a tariff will shift the supply curve upwards by the amount of the tariff. The new equilibrium price paid by importers will be at point b, where the new supply curve crosses the demand curve. Importers thus now pay a post-tariff price of P2: an effective rise in price of P2 minus P1. Foreign exporters receive P3, which is what they are paid by importers after the tariff has been paid.
The consumer price will be above P2 as that includes a mark-up by US businesses on top of the price they pay to import the product. Importers may bear some of the increase in price and not pass the full amount onto consumers, depending on competition and their ability to absorb cost increases.
President Trump argued that there would be very little rise in price from the tariffs and that overseas suppliers would bear the brunt of the tariffs. Indeed, recently he has argued that this must be the case as US inflation has been falling. In response, critics maintain that the rate of inflation would have fallen more without the tariffs and that current prices would be lower than they are. Also, if US importing firms or retailers bear some of the increased cost, even though this helps to dampen the price rise, their lower profits could damage investment and employment.

The Reports
The first report is from the New York Fed (one of the regional branches of the Federal Reserve Bank). It examines the effect of tariffs imposed in 2025, over three periods: (i) January to August, (ii) September to October, and (iii) November. In the first period, 94% of the tariffs were paid by US importers and 6% by foreign exports; in the second period, the figures were 92% and 8% and in the third period, 86% and 14%.
The second report is The Budget and Economic Outlook: 2026 to 2036 from the Congressional Budget Office. Box 2-1 notes that, as of November 2025, ‘the effective tariff rate was about 13 percentage points higher than the roughly 2 percent rate on imports in 2024’. Its analysis suggests that 95% of the tariffs will be borne by importers. Of these higher import prices, 30% will be borne by US businesses, largely through reduced profit margins, and 70% by consumers through higher prices. This will also allow many businesses which produce goods that compete with foreign imports to ‘increase their prices because of the decline in competition from abroad and the increased demand for tariff-free domestic goods’.
The third report is from the Kiel Insitut. In its Policy Brief, Americaʼs Own Goal: Who Pays the Tariffs?, it finds that US importers and consumers bear 96% of the cost of the 2025 tariffs, with foreign exporters absorbing only about 4%. It bases it findings on shipment-level data covering over 25 million transactions valued at nearly $4 trillion. This also shows that exports to the USA declined as foreign exporters preferred to reduce volumes rather than absorbing the tariffs.
The tariffs raised some $200 billion in 2025, around 3.8% of Federal tax receipts. But, as we have seen, this was paid largely by US consumers and business. It goes some way to offsetting the annual cut in tax revenues of around $450 to $520 billion per year from the tax cuts, largely to the better off, in Trump’s ‘One Big Beautiful Bill’.
Reports
Aricles
- NY Fed report says Americans pay for almost all of Trump’s tariffs
Reuters, Michael S. Derby (12/2/25)
- A year in, it’s official: Americans, not foreigners, are paying for Trump’s tariffs
CNN, Allison Morrow (12/2/26)
- Costs from Trump’s tariffs paid mainly by US firms and consumers, NY Fed says
BBC News, Kali Hays (13/2/26)
- Consumers and businesses paid nearly 90% of Trump tariffs in 2025, new analysis found
CBS News, Megan Cerullo (12/2/26)
- New Studies Challenge Who Really Pays for Tariffs
Investopedia, Diccon Hyatt (12/2/26)
- Trump Tariffs: Tracking the Economic Impact of the Trump Trade War
Tax Foundation, Erica York and Alex Durante (6/2/26)
- Who Is Paying the Trump Tariffs?
Paul Krugman (15/2/26)
Questions
- Summarise the findings of the three reports (but just Box 2-1 of the Congressional Budget Office one).
- Assess the argument that protectionism leads to inefficiency in the protected industries.
- Under what circumstances would exporters to the USA absorb a high percentage of tariff increases? Consider questions of elasticity.
- Can tariffs ever be justified on efficiency grounds?
- Can tariffs be justified as a bargaining ploy? Can they be used as a means of achieving freer and fairer trade?
- Read the blog, President Reagan on tariffs and summarise President Reagan’s arguments. Are they still relevant today?
- Consider the arguments for and against the EU raising tariffs on US goods.
 The gold market has become one of the most talked-about commodity markets in 2025, with prices reaching record highs. This is largely due to increased demand from investors, who see gold as a ‘safe haven’ during times of economic and political uncertainty. Central banks are also buying more gold as a way to reduce their reliance on currencies like the US dollar. With many analysts predicting prices could reach over $4000 per ounce in the next year, the gold market is showcasing how supply and demand, confidence, and global events can all influence a commodity market.
The commodities market is where basic agricultural products, raw materials and metals, such as gold, are bought and sold, often in large quantities and across global exchanges. Commodities are typically traded either in their physical form (like gold bars) at current market prices (spot prices) or through financial contracts, where investors buy or sell in futures markets. These are where a price is agreed today to buy or sell on a specific future date.
As with other commodities, the price of gold is determined by supply and demand. Demand for gold typically rises during times of economic uncertainty as investors want a safer store of value. This results in an increase in its price. Supply and demand, and hence price, also respond to other factors, including interest rates, currency movements, economic growth and growth prospects, and geopolitical events.
Record high prices
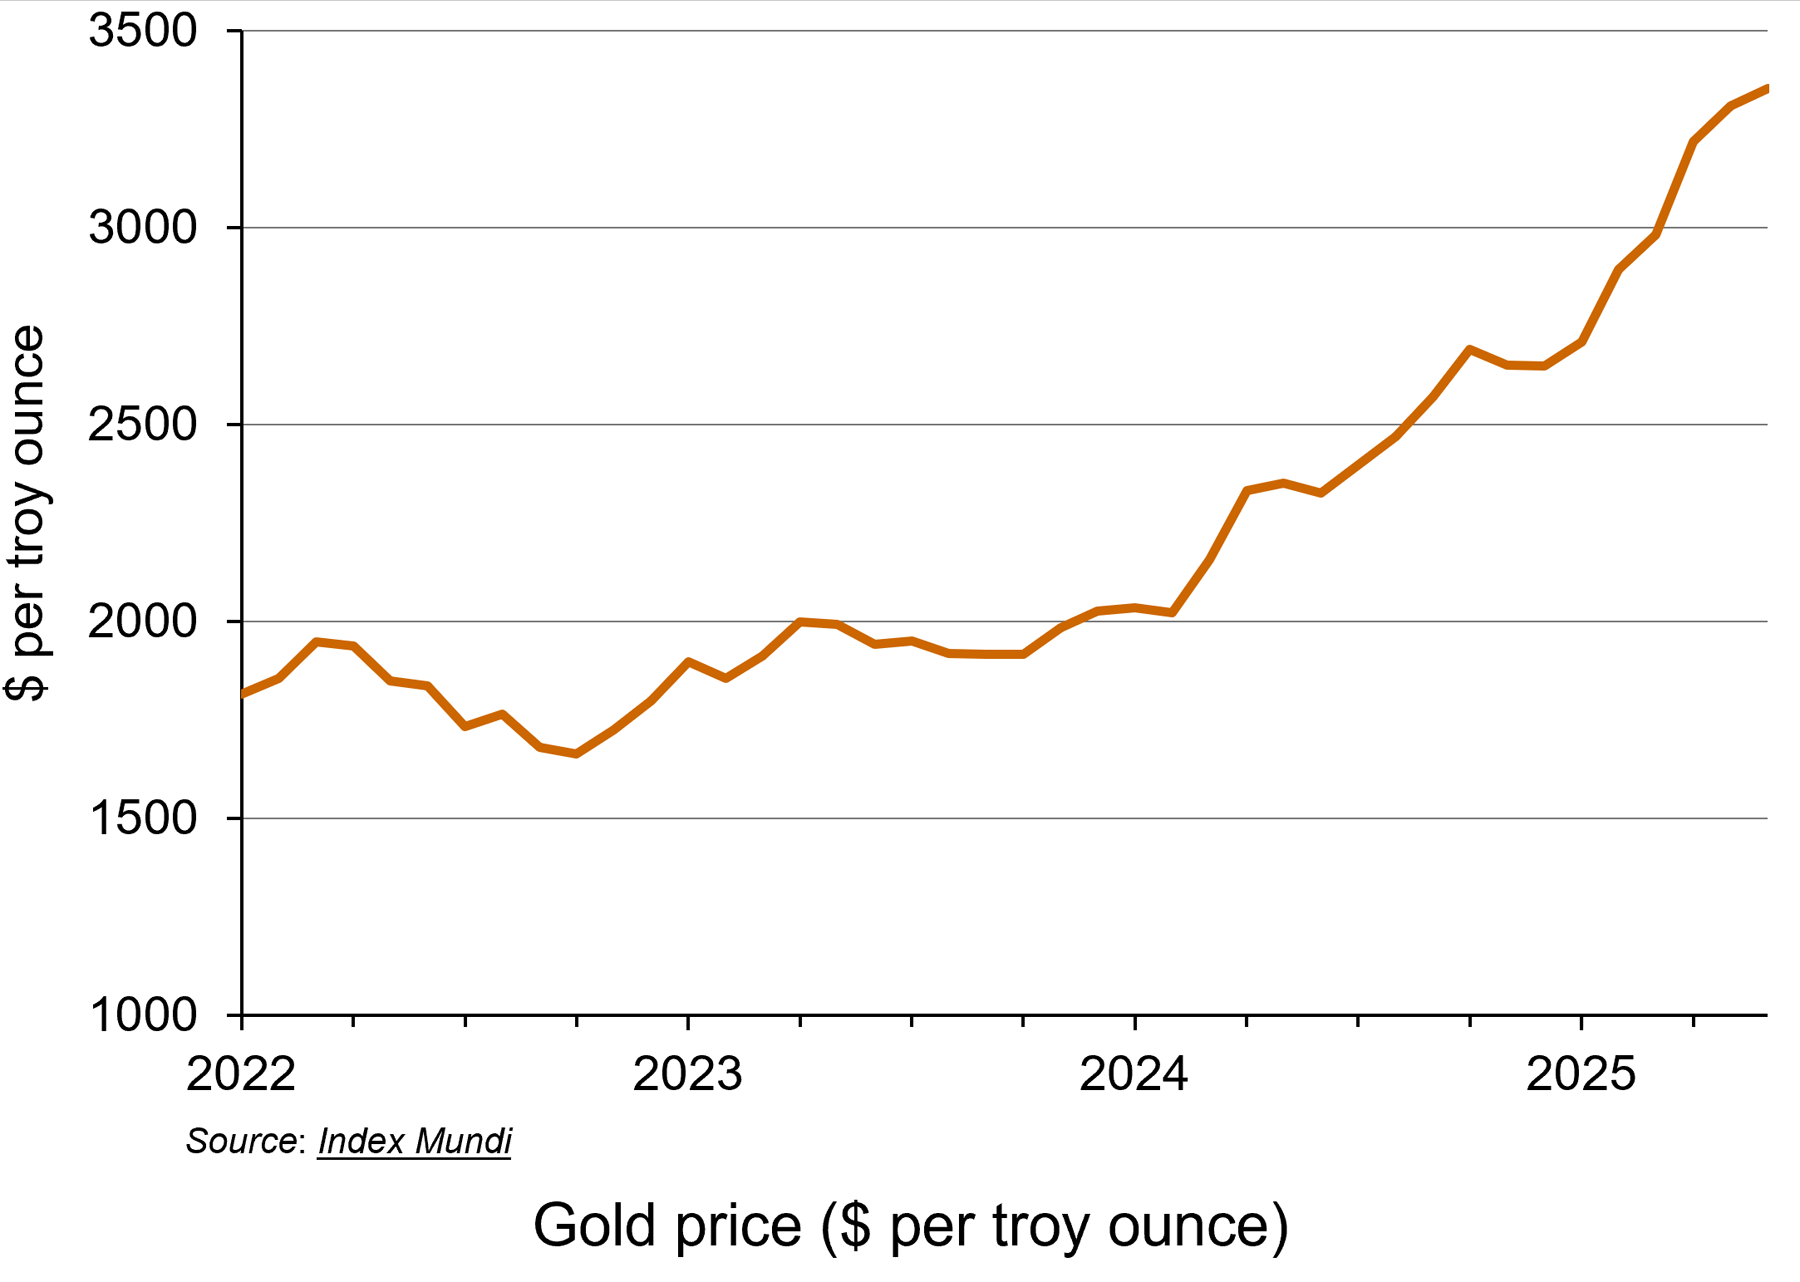 This year, the gold market has seen a remarkable rally, with the price of gold hitting a record high. Demand for the precious metal has resulted in spot prices surging over 35% to date (see the chart: click here for a PowerPoint). Rising prices earlier this year have been attributed to the US President, Donald Trump, announcing wide-ranging tariffs which have upset global trade. On 2 September, the spot gold price hit $3508.50 per ounce, continuing its upwards trend.
The price has also been lifted by expectations that the Federal Reserve (the US central bank) will cut its key interest rate, making gold an even more attractive prospect for investors. If the Federal Reserve cuts interest rates, the price of gold usually increases. This is because gold does not pay any interest or yield, so when interest rates are high, investors can earn better returns from alternatives, such as savings accounts or bonds. However, when interest rates fall, those returns become less attractive, making gold relatively more appealing.
Lower interest rates also tend to weaken the US dollar, which makes gold cheaper for foreign buyers, increasing global demand. Since gold is priced in dollars, a weaker dollar usually leads to higher gold prices.
Additionally, interest rate cuts are often a response to economic problems or uncertainty. As gold is viewed as a safer asset for investors during times of economic uncertainty, investors will typically increase their demand.
Unlike the market for currencies or shares, gold doesn’t rely on the performance of a government or company. This makes it attractive when people are worried about things like inflation, recession, war or stock market crashes. Gold is thus seen as a ‘safe haven’.
Gold and the Federal Reserve
The rise in the price of gold by more than a third this year can be linked to the US election last year, according to the director of research at BullionVault (see the BBC article below). Attitudes of the Trump administration towards the Federal Reserve have created concerns among investors. Fears that the US administration could erode the independence of the world’s most important central bank have fuelled the latest flows into the metal, which is traditionally viewed as a hedge against inflation.
According to the BBC article, Derren Nathan from Hargreaves Lansdown claims that it is Trump’s ‘attempts to undermine the independence of the Federal Reserve Bank’ that were ‘driving renewed interest in safe haven assets, including gold’. Investors are concerned that a politicised Fed would be more inclined to cut interest rates than would otherwise be the case, sending long-term inflation expectations higher.
This could lead to fears that future interest rates would then be pushed higher. This would increase the yields on longer-term government bonds by pushing down their price, as investors demand higher compensation for the increased risk of higher future interest rates reducing the value of their fixed-rate investments. This would force the US Treasury to pay higher interest on new bonds, making it more expensive to service US government debt.
Expected price rises for 2026
As we saw above, it is predicted that the price of gold will rise to $4000 per ounce next year. However, if the market sees investors move away from dollar assets, such as US Treasuries, the price increases would be even higher. Daan Struyven, co-head of global commodities research at Goldman Sachs explains ‘If 1 per cent of the privately owned US Treasury market were to flow to gold, the gold price would rise to nearly $5000 per troy ounce’ (see Financial Times article below).
 If the Federal Reserve does come under political pressure, it could affect the stability of the US economy and beyond. When gold prices rise sharply, demand usually falls in countries like China and India, which are the world’s largest buyers of gold jewellery. However, in 2025, this trend has changed. Instead of reducing their gold purchases, people in these countries have started buying investment gold, such as bars and coins, showing a shift in consumer behaviour from jewellery to investment assets.
At the same time, global events are also influencing the gold market. Suki Cooper, a metals analyst at Standard Chartered, said that events like Russia’s invasion of Ukraine have added to political uncertainty, which tends to increase demand for gold as a safe-haven asset. She also highlighted how changes in international trade policies have disrupted supply chains and contributed to higher inflation, both of which have made gold more attractive to investors. Additionally, a weaker US dollar earlier in the year made gold cheaper for buyers using other currencies, which boosted global demand even further.
Conclusion
Although the gold market is expected to remain strong over the next six months, some uncertainty remains. Many analysts predict that gold prices will stay high or even increase further, especially if interest rates in the US are cut as expected. Continued global instability, is also likely to keep demand for gold as a safe haven high. At the same time, if inflation stays elevated or trade disruptions continue, more investors may turn to gold to protect their wealth.
However, if economic conditions stabilise or interest rates rise again, gold demand could fall slightly, leading to a potential dip in prices. Overall, the outlook for gold remains positive, but sensitive to changes in global economic and political events.
Articles
- Gold price hits record high as investors seek safety
BBC News, Faarea Masud (2/9/25)
- Safe-haven gold rally gains further momentum after soft US data
Reuters, Sherin Elizabeth Varghese and Ashitha Shivaprasad (3/9/25)
- Gold vaults $3,000 in rush for safety from market, political worry
Reuters, Sherin Elizabeth Varghese and Anmol Choubey (14/3/25)
 The foundation of gold’s rally to historic highs started back in 2022
CNBC, Suki Cooper (17/3/25)
- Gold could hit nearly $5,000 if Trump undermines Fed, says Goldman Sachs
Financial Times, Emily Herbert (4/9/25)
- London’s bullion market set to trial digital gold
City AM, Maisie Grice (3/8/25)
- Gold price hits record high as investors seek safe haven
The Guardian, Julia Kollewe (2/9/25)
Data
Questions
- What factors influence the price of a commodity such as gold on the global market?
- Use a demand and supply diagram to illustrate what has been happening to the gold price in recent months.
- Find out what has been happening to silver prices. Are the explanations for the price changes the same as for gold?
- Why might investors choose to buy gold during times of economic or political uncertainty?
- How will changes in interest rates affect both the demand for and the price of gold?
- What are the possible consequences of rising gold prices for countries like India and China, where there is a traditionally high demand for gold jewellery?
- How do global events impact commodity markets? Use gold as an example in your answer.