
The US national debt hit a milestone in August 2026. It reached a staggering $40 trillion. The national debt is the amount owed by the US federal government to holders of government bonds and bills (treasury securities). The debt grows each year by the size of the annual government deficit, which is the amount that government expenditure exceeds tax and other revenues. The bigger the deficit, the more the national debt grows. The $40 trillion debt represents 126% of GDP – in other words it is more that the total annual output of the USA. It represents around $118,000 per head or $290,000 per household
But does this high and rising debt matter? And how does it compare with other countries?
The comparative size of the national debt
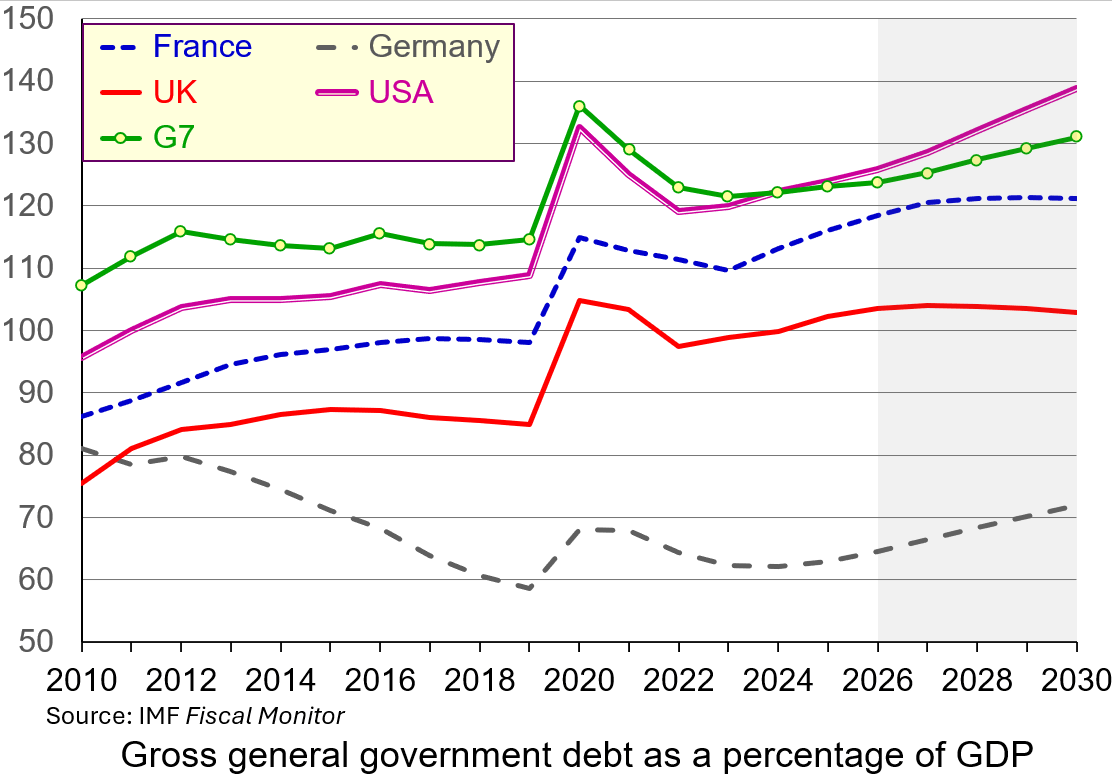 In absolute terms, the US national debt is huge, reflecting, in part, the size of the US economy. In percentage terms (126% of GDP), it is higher than Germany (65%), the UK (104%), Canada (110%) and France (118%) and slightly higher than the G7 average (124%). It is lower, however, than Italy (138%) and much lower than Japan (204%).
What is more, the IMF forecasts that the US national debt will rise from 126% of GDP in 2026 to 139% by 2030. This is because of continuing budget deficits, which require funding. The federal budget deficit is forecast to be around $2 trillion in the financial year ending September 2026 – it was $1.78 trillion in the previous financial year.
Japan’s debt percentage, by contrast, is forecast to fall from 204% in 2026 to 194% by 2030. Also, only about 10% of Japan’s debt is held by foreign investors. Around 90% is financed domestically by Japanese households, local banks, insurance companies, and the Bank of Japan. This makes Japan’s debt more sustainable than the USA’s, where around 28% is held by foreign investors (foreign governments, companies, banks and individuals).
Unlike domestic institutions (such as pension funds), which often have a structural bias to hold domestic assets, foreign investors typically view a country’s bonds as one of many global alternatives and are likely to switch faster to other countries’ assets during periods of market stress. The higher the proportion of bonds held outside the country, the more vulnerable the country is likely to be to bond market speculation.
The UK’s national debt percentage is forecast to fall slightly from 104% of GDP in 2026 to 103% in 2030. However, the UK is a global financial hub and the percentage of debt held by foreign investors (around 30%) is a little higher than in the USA. UK debt held overseas has risen from around 15% in the mid-2000s. It is likely to rise further.
Does high and rising US national debt matter?
 Servicing the debt. In February 2022, the US central bank rate (the Federal Funds rate) was 0.25%. It then rose in increments to combat rising inflation and reached 5.5% by July 2023. Although it has come down slightly since, standing at 3.75% in August 2026, US interest rates are higher now than at any time from 2008 to 2022. With higher interest rates, the USA now pays roughly $1.1 trillion annually just to service the debt. This accounts for around 15% of total federal spending – up from an historical 50-year average of just under 9%.
Upward pressure on domestic borrowing rates. To fund its deficits, the US Treasury Department must continually issue massive amounts of government bonds. This high volume of government borrowing competes for capital in global financial markets, which can push up broader interest rates. For businesses, this imposes a cost on investment and can act as a disincentive to borrow. For consumers, it adds to cost-of-living pressures by raising the cost of mortgages, car loans, credit card debt and other borrowing.
Crowding out other public spending. The money spent on servicing the debt is not available for building roads or other infrastructure, funding education, healthcare or defence, or providing social security. Annual interest payments of around $1.1 trillion now exceed national defence spending (around £960 billion), making it the third-largest item in the federal budget after healthcare and social security. As the national deficits and debt expand, so a higher proportion of current taxes is being used to fund past expenditure.
Long-term fiscal risk
The US dollar is the world’s primary reserve currency. This creates persistent global demand for US debt. However, ratings agencies and other organisations, such as the Congressional Budget Office (CBO), warn that adding $1 trillion to national debt roughly every five months is an unsustainable trajectory that could eventually erode confidence in the US economy.
 Already, many countries are seeking to expand the range of currencies used as reserves, including Chinese yuan, the euro and crypto currencies. They are also holding more gold. In 2001, the US dollar accounted for 72% of currencies held globally as reserves; by 2025 this had fallen to 57%. This process could accelerate as confidence in the USA is eroded because of the size of the debt and the capricious policies towards trade.
During periods of quantitative easing (QE), central banks, including the Fed, purchased large amounts of government bonds. But now, as central banks scale back their bond holdings in programmes of quantitative tightening (QT), foreign private investors and domestic households are being forced to absorb the majority of newly issued government debt, making pricing and yields increasingly sensitive to global investor demands. A decline in confidence can lead to a large sale of bonds, forcing down their price, thereby forcing up their yield and hence the interest that has to be paid on newly issued bonds. This is what happened in the UK in September 2022 under the short-lived administration of Liz Truss when she and her chancellor, Kwasi Kwarteng, made unfunded promises of tax cuts.
The USA is not immune to such bond market jitters. In mid-August, the yield on 30-year US Treasury bonds reached 5.3% – the highest level since 2007.
A worsening problem
 The US deficit is likely to increase, making the national debt rise more rapidly. There are various reasons.
The US population, as in many countries, is ageing and the proportion of retired people is rising. This puts increasing demands on healthcare and social security, with a proportionately smaller workforce to fund them.
The deficit has also been increased by deliberate government policies. For example, Donald Trump’s 2025 ‘One Big Beautiful Bill’ Act made substantial tax cuts, largely for the wealthy.
Congress caps the debt at a certain level and in the past this has acted as a brake on size of the deficit. However, the cap was raised by $5 trillion in 2025 and this could well happen again, allowing debt levels to expand further.
But reining in the deficit could have a contractionary effect on the economy as taxes are raised and/or expenditure is cut. Governments are reluctant to do this as it could lead to recession, or at least falling growth in the short term, and this could affect their chances or re-election. With the mid-terms approaching in the USA, and the presidential election just two years later, this is an unlikely policy for the Trump administration to pursue.
Articles
- Five charts explaining America’s $40 trillion debt
euronews, oloresz Katanich (22/8/26)
- How Much the National Debt Grew Under Trump and Biden
Time, Chantelle Lee (22/8/26)
- 7 questions about the national debt hitting $40 trillion
PBS News, Lisa Desjardins (19/8/26)
- The U.S. National Debt Officially Surpassed $40 Trillion in August: Here’s What History Says This Means for the Stock Market
Yahoo! Finance, Neil Patel, The Motley Fool (24/8/26)
- National debt reaches grim $40 trillion milestone. Here’s why that matters
CNN, Tami Luhby, John Towfighi, Matt Stiles and Amy O’Kruk (20/8/26)
- Jumpy bond markets make it clear: Trump risks driving US into debt crisis
The Guardian, Heather Stewart (23/8/26)
- Is the Trump Treasury panicking over the level of US debt?
The Guardian, Kenneth Rogoff (26/8/26)
- US debt hits $40 trillion: Who does Washington owe and why does it matter?
Aljazeera, Shola Lawal (21/8/26)
- US national debt passes $40tn after doubling in a decade
BBC News, Michael Race and Francisco Velasquez (20/8/26)
- Why the US economy is ringing alarm bells
BBC News, Michael Race (21/8/26)
- The war is raising the price of money. That’s a problem for the global economy
CNN, Matt Egan (2/9/26)
Information
Questions
- Distinguish between national debt, central government debt and general government debt.
- Would it be possible to run a budget deficit and yet for the national debt to fall as a percentage of GDP?
- Japan and Italy have a higher debt to GDP ratio than the USA or the UK. Why are they less subject to bond market pressures than the USA or the UK?
- What policy measures would you recommend to the US government to tackle the rising national debt and why?
- Could the USA ‘grow its way out of the debt problem’?
 In her bid to become Conservative party leader, Liz Truss promised to make achieving faster economic growth her number-one policy objective. This would involve pursuing market-orientated supply-side policies.
These policies would include lower taxes on individuals to encourage people to work harder and more efficiently, and lower taxes on business to encourage investment. The policy would also involve deregulation, which would again encourage investment, both domestic and inward investment from overseas. These proposals echoed the policies pursued in the 1980s by President Ronald Reagan in the USA and Margaret Thatcher in the UK.
On September 23, the new Chancellor, Kwasi Kwarteng, presented a ‘mini-Budget’ – although the size of the changes made it far from ‘mini’. This, as anticipated, included policies intended to boost growth, including scrapping the 45% top rate of income tax, which is currently paid by people earning over £150 000 (a policy withdrawn on 3 October after massive objections), cutting the basic rate of income tax from 20% to 19%, scrapping the planned rise in corporation tax from 19% to 25%, scrapping the planned rise in national insurance by 1.25 percentage points, a cut in the stamp duty on house purchase and scrapping the limit placed on bankers’ bonuses. In addition, he announced the introduction of an unlimited number of ‘investment zones’ which would have lower business taxes, streamlined planning rules and lower regulation. The policies would be funded largely from extra government borrowing.
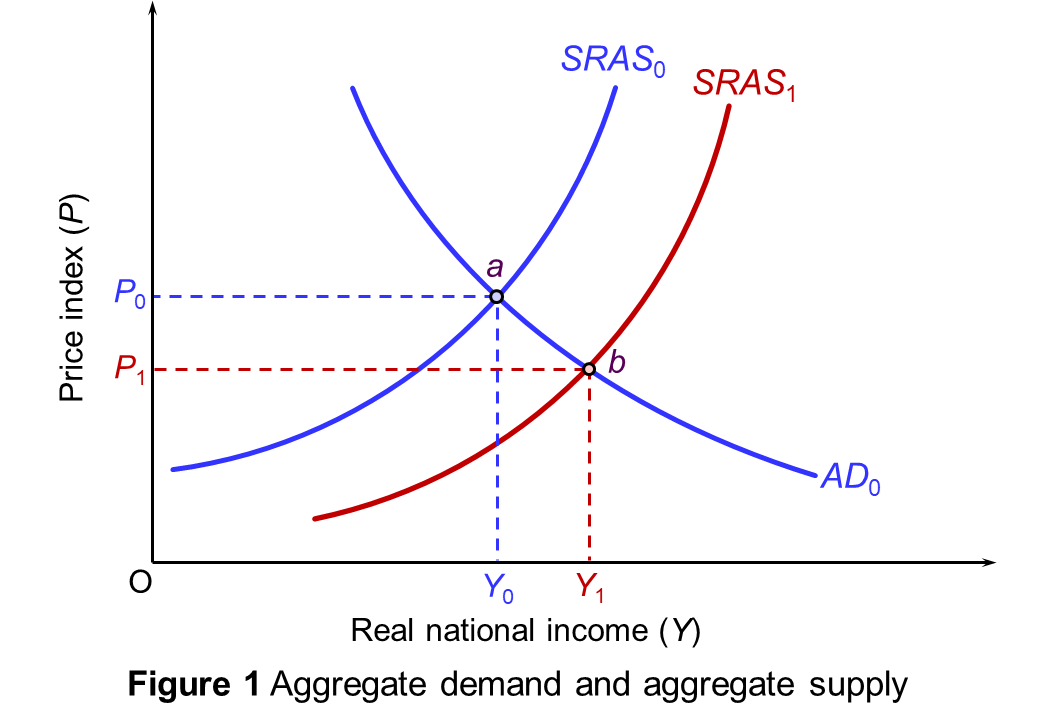 Theoretically, the argument is simple. If people do work harder and firms do invest more, then potential GDP will rise – a rise in aggregate supply. This can be shown on an aggregate demand and supply diagram. If the policy works, the aggregate supply curve will shift to the right. Real GDP will rise and there will be downward pressure on prices. In Figure 1, real GDP will rise from Y0 to Y1 and the price level will fall from P0 to P1. However, things are not as simple as this. Indeed, there are two major problems.
The first concerns whether tax cuts will incentivise people to work harder. The second concerns what happens to aggregate demand. I addition to this, the policies are likely to have a profound effect on income distribution.
Tax cuts and incentives
Cutting the top rate of income tax would have immediately given people at the top of the income scale a rise in post-tax income. This would have created a substitution effect and an income effect. Each extra pound that such people earn would be worth more in post-tax income – 60p rather than 55p. This would provide an incentive for people to substitute work for leisure as work is now more rewarding. This is the substitution effect. On the other hand, with the windfall of extra income, they now would have needed to work less in order to maintain their post-tax income at its previous level. They may well indeed, therefore, have decided to work less and enjoy more leisure. This is the income effect.
With the diminishing marginal utility of income, generally the richer people are, the bigger will be the income effect and the smaller the substitution effect. Thus, cutting the top rate of income tax may well have led to richer people working less. There is no evidence that the substitution effect would be bigger.
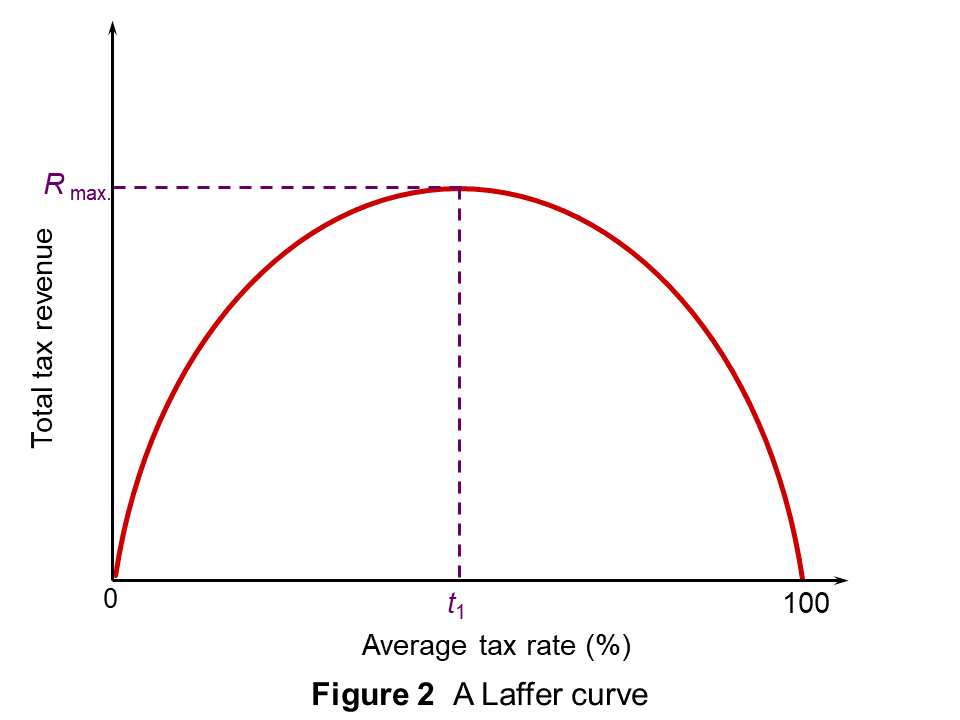 If top rates of income tax are already at a very high level, then cutting then may well encourage more work. After all, there is little incentive to work more if the current rate of tax is over 90%, say. Cutting them to 80% could have a big effect. This was the point made by Art Laffer, one of Ronald Reagan’s advisors. He presented his arguments in terms of the now famous ‘Laffer curve’, shown in Figure 2. This shows the total tax revenue raised at different tax rates.
If the average tax rate were zero, no revenue would be raised. As the tax rate is raised above zero, tax revenues will increase. The curve will be upward sloping. Eventually, however, the curve will peak (at tax rate t1). Thereafter, tax rates become so high that the resulting fall in output more than offsets the rise in tax rate. When the tax rate reaches 100 per cent, the revenue will once more fall to zero, since no one will bother to work.
If the economy were currently to the right of t1, then cutting taxes would increase revenue as there would be a major substitution effect. However, most commentators argue that the UK economy is to the left of t1 and that cutting the top rate would reduce tax revenues. Analysis by the Office for Budget Responsibility in 2012 suggested that t1 for the top rate of income tax was at around 48% and that cutting the rate below that would reduce tax revenue. Clearly according to this analysis, 40% is considerably below t1.
As far as corporation tax is concerned, the 19% rate is the lowest in the G20 and yet the UK suffers from low rates of both domestic investment and inward direct investment. There is no evidence that raising it somewhat, as previously planned, will cut investment. And as far as individual entrepreneurs are concerned, cutting taxes is likely to have little effect on the desire to invest and expand businesses. The motivation of entrepreneurs is only partly to do with the money. A major motivation is the sense of achievement in building a successful business.
Creating investment zones with lower taxes, no business rates and lower regulations may encourage firms to set up there. But much of this could simply be diverted investment from elsewhere in the country, leaving overall investment little changed.
To assess these questions, the government needs to model the outcomes and draw on evidence from elsewhere. So far this does not seem to have happened. They government did not even present a forecast of the effects of its policies on the public finances, something that the OBR normally presents at Budget time. This was one of the reasons for the collapse in confidence of sterling and gilts (government bonds) in the days following the mini-Budget.
Effects on aggregate demand
 Cutting taxes and financing them from borrowing will expand aggregate demand. In Figure 1, the AD curve will also shift to the right and this will push up prices. Inflation is already a serious problem in the economy and unfunded tax cuts will make it worse. Higher inflation will result in the Bank of England raising interest rates further to curb aggregate demand. But higher interest rates, by raising borrowing costs, are likely to reduce investment, which will have a negative supply-side effect.
The problem here is one of timing. Market-orientated supply-side policies, if they work to increase potential GDP, will take time – measured in years rather than months. The rise in aggregate demand will be much quicker and will thus precede the rise in supply. This could therefore effectively kill off the rise in supply as interest rates rise, the exchange rate falls and the economy is pushed towards recession. Indeed, the mini-Budget immediately sparked a run on the pound and the exchange rate fell.
The rising government debt may force the government to make cuts in public expenditure. Rather than cutting current expenditure on things such as nurses, teachers and benefits, it is easier to cut capital expenditure on things such as roads and other infrastructure. But this will have adverse supply-side effects.
Effects on income distribution
 Those advocating market-orientated supply-side policies argue that, by making GDP bigger, everyone can gain. They prefer to focus on the size of the national ‘pie’ rather than its distribution. If the rich initially gain, the benefits will trickle down to the poorest in society. This trickle-down theory was popular in the 1980s with politicians such as Margaret Thatcher and Ronald Reagan and, more recently, with Republican presidents, such as Goerge W Bush and Donald Trump. There are two problems with this, however.
The first, which we have already seen, is whether such policies actually do increase the size of the ‘pie’.
The second is how much does trickle down. During the Thatcher years, income inequality in the UK grew, as it did in the USA under Ronald Reagan. According to an IMF study in 2015 (see the link to the IMF analysis below), policies that increase the income share of the poor and the middle class do increase growth, while those that raise the income share of the top 20 per cent result in lower growth.
After the mini-Budget was presented, the IMF criticised it for giving large untargeted tax cuts that would heighten inequality. The poor would gain little from the tax cuts. The changes to income tax and national insurance mean that someone earning £20 000 per year will gain just £167 per year, while someone earning £200 000 will gain £5220. What is more, the higher interest rates and higher prices resulting from the lower exchange rate are likely to wipe out the modest gains to the poor.
Podcast
Articles
- At a glance: What’s in the mini-budget?
BBC News (23/9/22)
- Mini-budget: What it means for you and your finances
BBC News, Kevin Peachey (23/8/22)
- Will this huge tax cutting gamble pay off?
BBC News, Faisal Islam (23/9/22)
- Kwasi Kwarteng faces U-turn on tax or spending cuts
BBC News, Faisal Islam (28/9/22)
- Nearly 300 UK mortgage deals pulled in a day as pound’s fall heralds rate rise
The Guardian, Zoe Wood (27/9/23)
- Rationale behind abolition of 45p tax rate reflects failed ideology
The Guardian, Arun Advani, David Burgherr and Andy Summers (29/9/23)
- The UK’s ‘Trussonomics’ crashes the pound and leaves investors shaking their heads
CNN, Allison Morrow (26/9/23)
- Mini budget: will Kwasi Kwarteng’s plan deliver growth?
The Conversation, Steve Schifferes (23/9/23)
- Only a U-turn by the government or the Bank of England will calm UK financial markets
The Conversation, Campbell Leith (28/9/22)
- IMF gives damning verdict on Britain’s tax cuts
CNBC, Hannah Ward-Glenton (28/9/23)
- Lasting effects of ‘mini’ Budget will be felt far beyond the trading floors
Today News, Torsten Bell (1/10/23)
Analysis
- Causes and Consequences of Income Inequality: A Global Perspective
IMF Staff Discussion Notes, Era Dabla-Norris, Kalpana Kochhar, Nujin Suphaphiphat, Franto Ricka and Evridiki Tsounta (15/6/15)
- Mini-Budget response
Institute for Fiscal Studies, Stuart Adam, Isaac Delestre, Carl Emmerson, Paul Johnson, Robert Joyce, Isabel Stockton, Tom Waters, Xiaowei Xu and Ben Zaranko (23/9/22)
Questions
- Distinguish between market-orientated supply-side policies and interventionist ones. Consider the advantages and disadvantages of each.
- Explain why bond prices fell after the mini-Budget. What was the Bank of England’s response and why did this run counter to its plan for quantitative tightening?
- How might a tax-cutting Budget be designed to help the poor rather than the rich? Would this have beneficial supply-side effects?
- Find out about the 1972 tax-cutting Budget of Anthony Barber, the Chancellor in Ted Heath’s government, that led to the ‘Barber boom’ and then rampant inflation. Are there any similarities between the 1972 Budget and the recent mini-Budget?
When governments run deficits, these must be financed by borrowing. The main form of borrowing is government bonds. To persuade people (mainly private-sector institutions, such as pension funds) to buy these bonds, an interest rate must be offered. Bonds are issued for a fixed period of time and at maturity are paid back at face value to the holders. Thus new bonds are issued not just to cover current deficits but also to replace bonds that are maturing. The shorter the average term on existing government bonds, the greater the amount of bonds that will need replacing in any one year.
In normal times, bonds are seen as a totally safe asset to hold. On maturity, the government would buy back the bond from the current holder at the full face value.
In normal times, interest rates on new bonds reflect market interest rates with no added risk premium. The interest rate (or ‘coupon’) on a bond is fixed with respect to its face value for the life of the bond. In other words, a bond with a face value of £100 and an annual payment to the holder of £6 would be paying an interest rate of 6% on the face value.
As far as existing bonds are concerned, these can be sold on the secondary market and the price at which they are sold reflects current interest rates. If, for example, the current interest rate falls to 3%, then the market price of a £100 bond with a 6% coupon will rise to £200, since £6 per year on £200 is 3% – the current market rate of interest. The annual return on the current market price is known as the ‘yield’ (3% in our example). The yield will reflect current market rates of interest.
These, however, are not ‘normal’ times. Bonds issued by many countries are no longer seen as a totally safe form of investment.
Over the past few months, worries have grown about the sustainability of the debts of many eurozone countries. Bailouts have had to be granted to Greece, Ireland and Portugal; in return they have been required to adopt tough austerity measures; the European bailout fund is being increased; various European banks are having to increase their capital to shield them against possible losses from haircuts and defaults (see Saving the eurozone? Saving the world? (Part B)). But the key worry at present is what is happening to bond markets.
Bond yields for those countries deemed to be at risk of default have been rising dramatically. Italian bond yields are now over 7% – the rate generally considered to be unsustainable. And it’s not just Italy. Bond rates have been rising across the eurozone, even for the bonds of countries previously considered totally safe, such as Germany and Austria. And the effect is self reinforcing. As the interest rates on new bonds are driven up by the market, so this is taken as a sign of the countries’ weakness and hence investors require even higher rates to persuade them to buy more bonds, further undermining confidence and further driving up rates.
So what is to be done? Well, part of the problem is that the eurozone does not issue eurobonds. There is a single currency, but no single fiscal policy. There have thus been calls for the eurozone to issue eurobonds. These, it is argued would be much easier to sell on the market. What is more, the ECB could then buy up such bonds as necessary as part of a quantitative easing programme. At present the ECB does not act as lender of last resort to governments; at most it has been buying up some existing bonds of Italy, Spain, etc. in the secondary markets in an attempt to dampen interest rate rises.
The articles below examine some of the proposals.
What is clear is that politicians all over the world are trying to do things that will appease the bond market. They are increasingly feeling that their hands are tied: that they mustn’t do anything that will spook the markets.
Articles
Bond market hammers Italy, Spain ponders outside help Reuters, Barry Moody and Elisabeth O’Leary (25/11/11)
German Bonds Fall Prey to Contagion; Italian, Spanish Debt Drops Bloomberg Businessweek, Paul Dobson and Anchalee Worrachate (26/11/11)
Rates on Italian bonds soar, raising fears of contagion Deutsche Welle, Spencer Kimball (25/11/11)
 Brussels unveils euro bond plans Euronews (23/11/11)
Germany faces more pressure to back eurobonds Euronews on YouTube (24/11/11)
Bond markets Q&A: will the moneymen hit the panic button? Guardian, Jill Treanor and Patrick Collinson (7/11/11)
Why we all get burnt in the bonfire of the bond markets Observer, Heather Stewart, Simon Goodley and Katie Allen (20/11/11)
Retaining the confidence of the bond market is the key to Britain’s success in the EU treaty renegotiations The Telegraph, Toby Young (19/11/11)
Boom-year debts could bust us BBC News, Robert Peston (25/11/11)
UK’s debts ‘biggest in the world’ BBC News, Robert Peston (21/11/11)
Markets and the euro ‘end game’ BBC News, Stephanie Flanders (24/11/11)
The tricky path toward greater fiscal integration The Economist, H.G. (27/10/11)
The tricky path toward greater fiscal integration, take two The Economist, H.G. (23/11/11) and Comments by muellbauer
Data
European Economy, Statistical Annex Economic and Financial Affairs DG (Autumn 2011) (see Tables 76–78)
Monthly Bulletin ECB (November 2011) (see section 2.4)
Bonds and rates Financial Times
UK Gilt Market UK Debt Management Office
Questions
- Explain the relationship between bond yields and (a) bond prices; (b) interest rates generally.
- Using the data sources above, find the current deficit and debt levels of Italy, Spain, Germany, the UK, the USA and Japan. How do eurozone debts and deficits compare with those of other developed countries?
- Explain the various proposals considered in the articles for issuing eurobonds.
- To what extent do the proposals involve a moral hazard and how could eurobond schemes be designed to minimise this problem?
- Examine German objections to the issue of eurobonds.
- Does the global power of bond markets prevent countries (including non-eurozone ones, such as the UK and USA) from using fiscal policy to avert the slide back into recession?