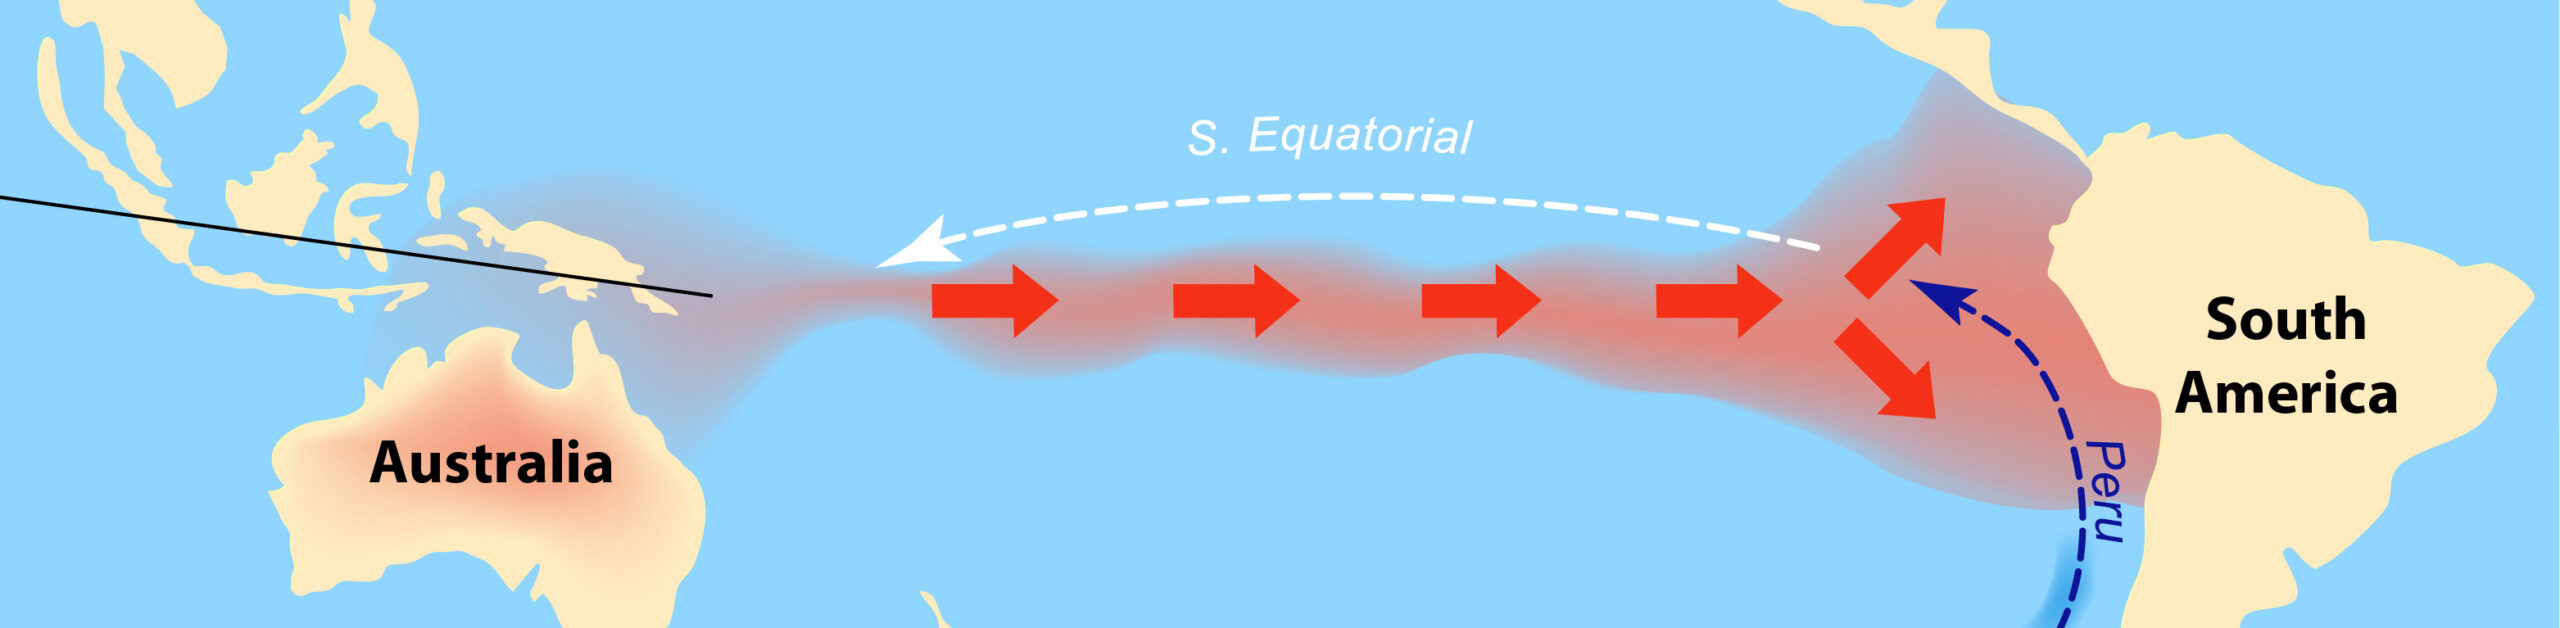
The World Meteorological Organization predicts that a ‘super El Niño’ is building. This has been nicknamed ‘Godzilla’. If forecasts are correct, this will be the most extreme El Niño in 1000 years.
El Niño is a natural phenomenon. It occurs when the surface temperatures in the central and eastern tropical Pacific Ocean warm and cause the trade winds that typically blow from east to west across the Pacific Ocean to weaken or even reverse direction. As well as increasing global temperatures and causing intense heatwaves, it can result in droughts in some parts of the world, such as eastern Australia, south-east Asia and southern Africa, and intense rain and flooding in parts of South America, eastern Africa and south-western North America.
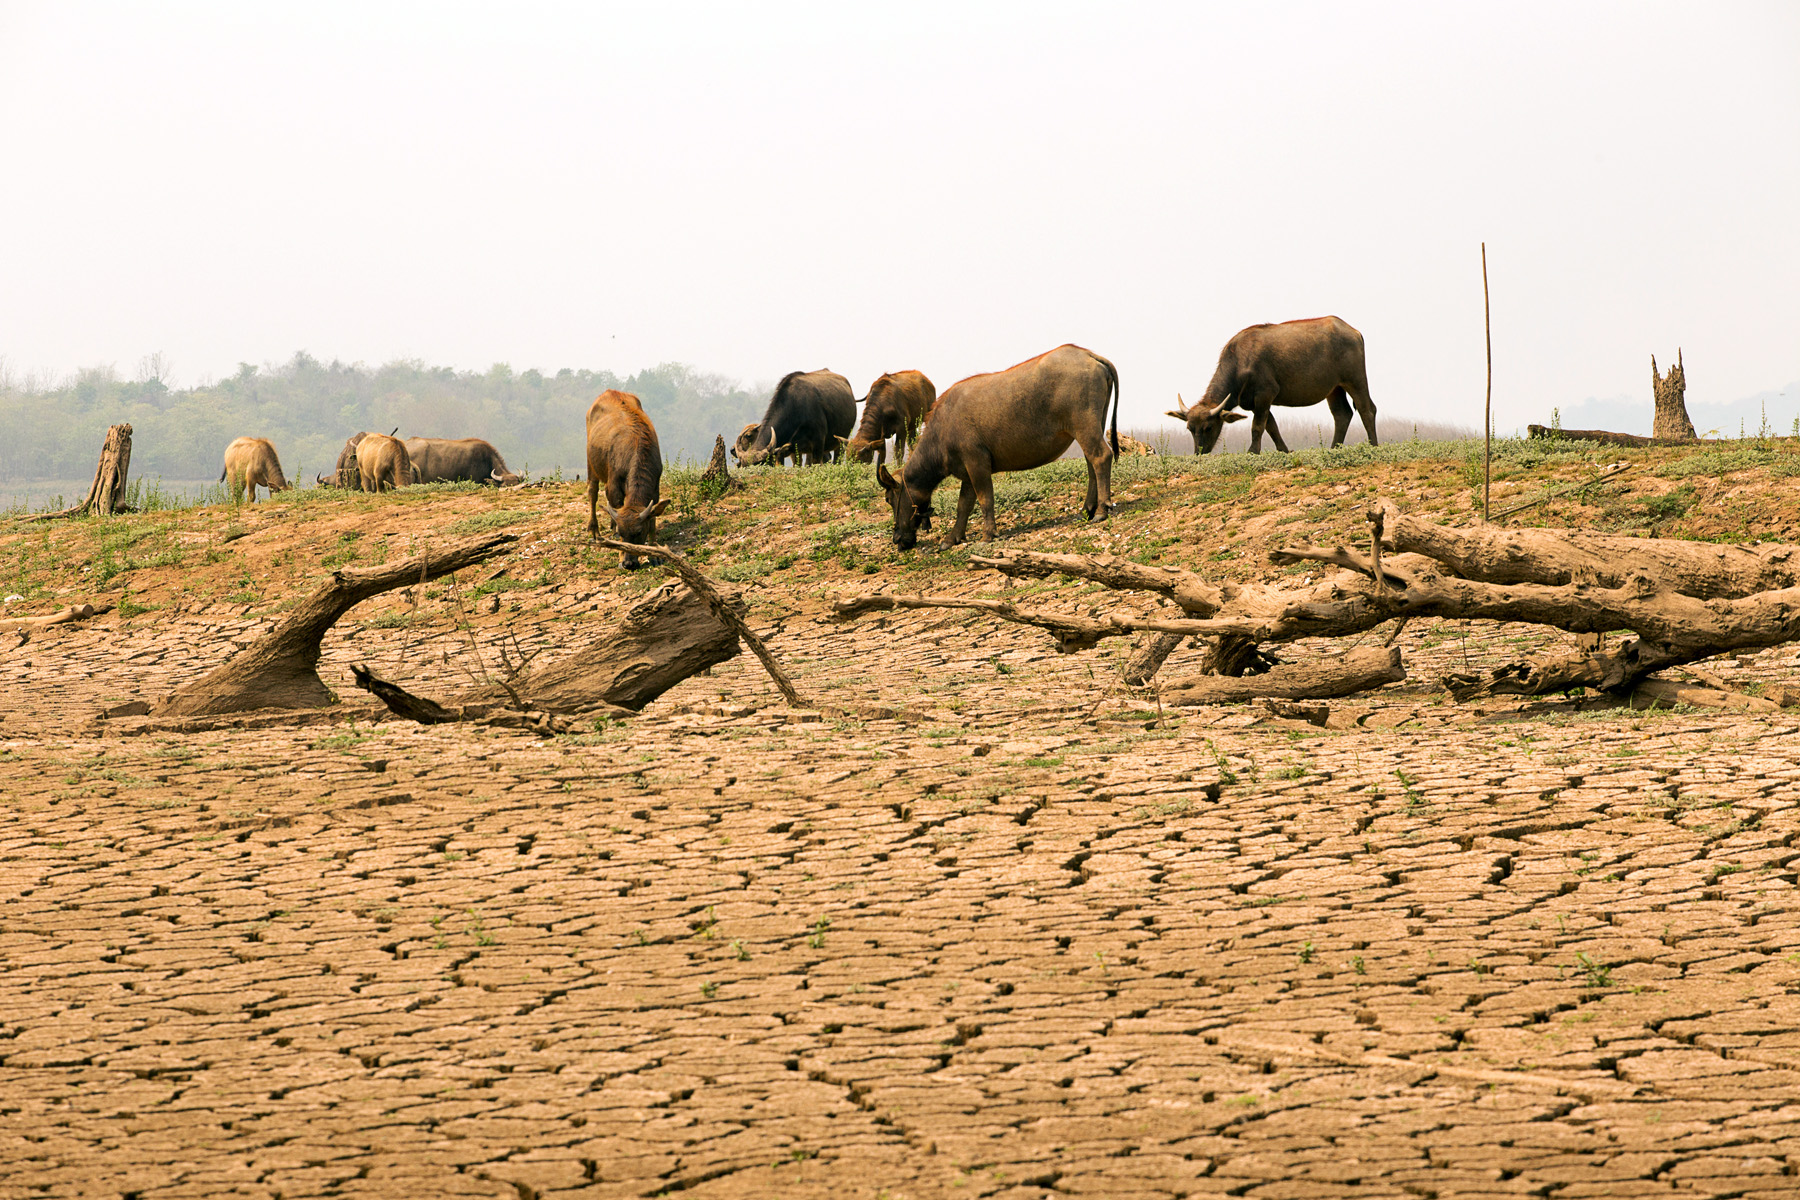
Typically, in an El-Niño event, the surface temperature of the central-eastern equatorial Pacific Ocean rises by 1°C to 1.5°C above the average. In the current El Niño, it is forecast to rise by up to 4°C by the end of 2026 and into 2027. It is already between 2.2°C and 2.6°C above the average. The effects could be catastrophic and hence the term ‘Godzilla’.
Although El Niño is a natural phenomenon, its severity is a direct result of climate change. This in turn is a direct result of economic decisions, and the effects will have severe economic consequences.
The economic causes
Climate change is an external cost of private economic decisions. When people or organisations burn fossil fuels, the climate costs of the CO2 emissions are not borne by the emitter. They are an external cost. This is illustrated in the diagram below, which shows the costs and benefits of electricity production from fossil fuels. (Click here for a PowerPoint.)
In this example, to make things simple, we assume that the external climate costs begin with the first unit of electricity generated and increase at a constant rate. The marginal social cost (MSC) of electricity generation equals the marginal private costs (MPC) to the generating company plus the marginal external cost in production MECP.
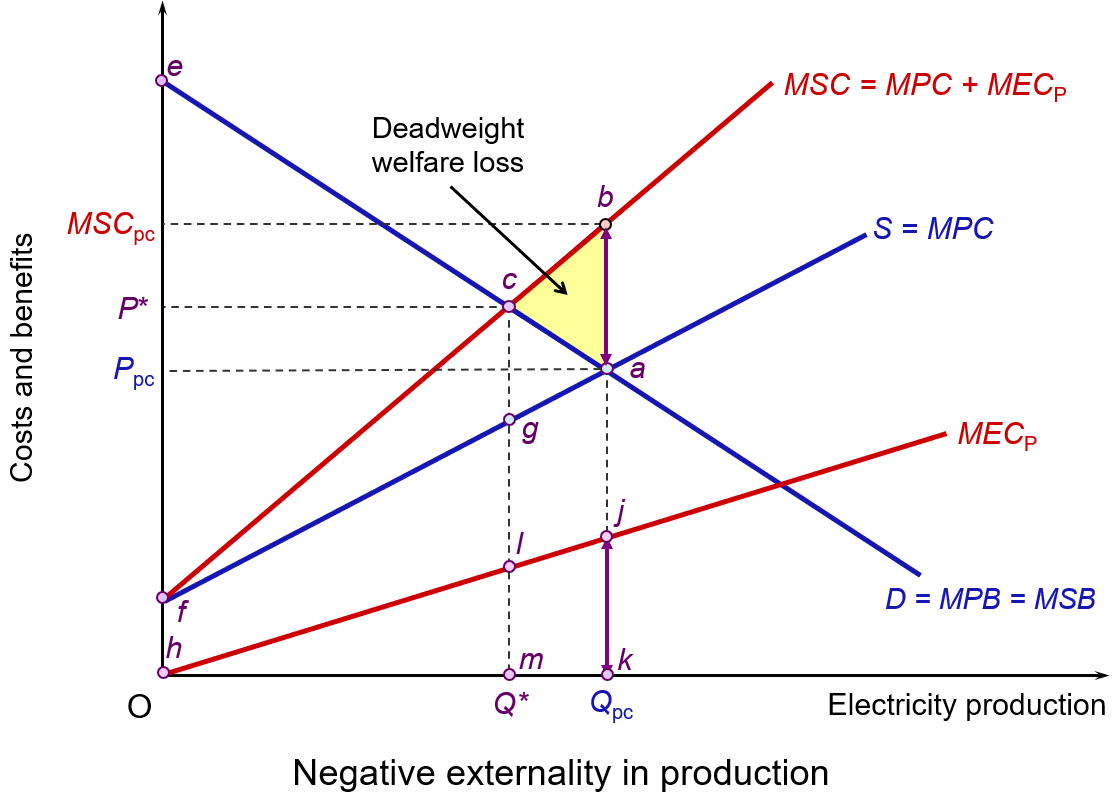 As you can see, the MSC curve is above the MPC curve. The vertical distance between them is equal to the MECP. It is also assumed that there are no externalities in consumption, which means that the marginal social benefit (MSB) curve is the same as the marginal private benefit (MPB) curve.
Competitive market forces, with producers and consumers responding only to private costs and benefits, will result in a market equilibrium at point a: i.e. where demand equals supply. The market equilibrium price is Ppc, while the market equilibrium quantity is Qpc. At Ppc, with no externalities on the consumption side, MPB is equal to MSB. The market price reflects both the private and social benefits from the last unit consumed. However, the presence of external costs in production means that MSC > MPC.
The socially optimal output would be Q*, where P = MSB = MSC, achieved at the socially optimal price of P*. This is illustrated at point c and clearly shows how external costs of production in a perfectly competitive market result in overproduction: i.e. Qpc > Q*. From society’s point of view, too much electricity is being produced from fossil fuels.
Total social surplus equals consumer surplus plus producer surplus minus the external costs. At the market equilibrium (Qpc) this is areas eaPpc+ Ppcaf – fba (or hjk, as it is the same size). At the socially optimal level of output (Q*) total social surplus is areas ecP* + P*cgf – fcg (or hlm).
Although consumer-plus-producer surplus is higher at the market equilibrium (Qpc) than at the socially optimum output (Q*) by the area cag, the external costs are higher still by the area cbag (or ljkm). Therefore, total social surplus at the market equilibrium is smaller than at the socially optimal point by area abc. This is a deadweight welfare loss and represents the excess of social costs over social benefits at all outputs above Q*. Put another way, moving from Qpc to Q* would represent a gain in social surplus of the area abc, as the fall in external costs outweighs the fall in consumer-plus-producer surplus.
One of the reasons why external environmental costs cause problems in a free-market economy is that no one has legal ownership of the atmosphere. Therefore, nobody has the ability either to prevent or to charge for their use as a ‘dumping ground’ for CO2. Such a ‘market’ is missing. Control must, therefore, be left to the government, international organisations, local authorities or regulators.
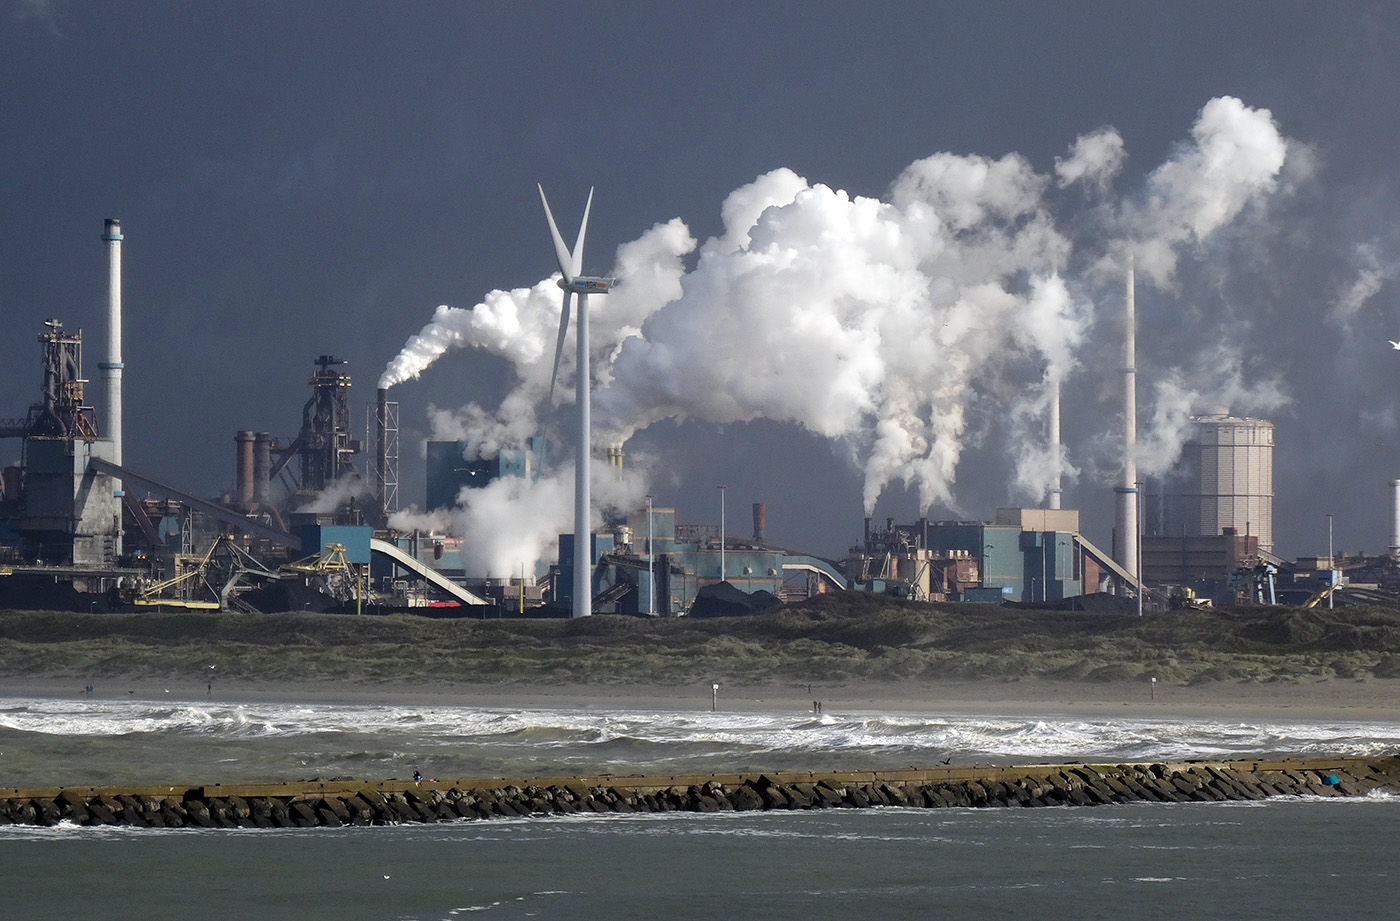 But such control is often too little. For example, when President Trump came to office in January 2025, he announced that the USA would withdraw from the UN’s Paris Agreement on climate change and that his policy towards oil production would be to ‘drill, baby, drill’. Indeed, governments globally spend hundreds of billions of dollars a year in subsidising oil, gas and coal production and its use, partly from pressure from the fossil fuel industry and partly to reduce the cost of living for consumers. This embeds fossil fuel dependence.
Game theory can help to explain the slow process of carbon reduction. For an individual country, such as the USA, it might argue that its optimum solution would be for other countries to cut their emissions, while maintaining its own levels. This approach would yield most of the benefits to the USA and none of the costs. However, when all countries argue like this, no progress is made. It’s a prisoners’ dilemma. Only if countries believe that the other countries will (a) ratify an agreement to cut emissions and (b) stick to the approved terms, is the agreement likely to succeed. This requires trust on all sides as well as the ability to monitor the outcomes.
Another major problem area concerns equity. Most countries will feel that they are being asked to do too much and that others are being asked to do too little. High-income countries will want to adopt a grandfathering approach. The starting point with this approach would be current levels of pollution. Every country would then be required to make the same percentage cut. Low-income countries, on the other hand, will want the bulk of the cuts, if not all of them, to be made by the rich countries. After all, the rich countries produce much higher levels of pollutants per capita than do the poor countries, and curbing growth in low-income countries would have a far more serious impact on levels of absolute poverty.
But will a supersized El Niño persuade countries to make deeper cuts in carbon emissions? In recent months commitments to achieving net zero emissions have waned. But the following economic consequences may encourage some countries to make deeper emissions cuts.
Economic consequences of a Godzilla El Niño
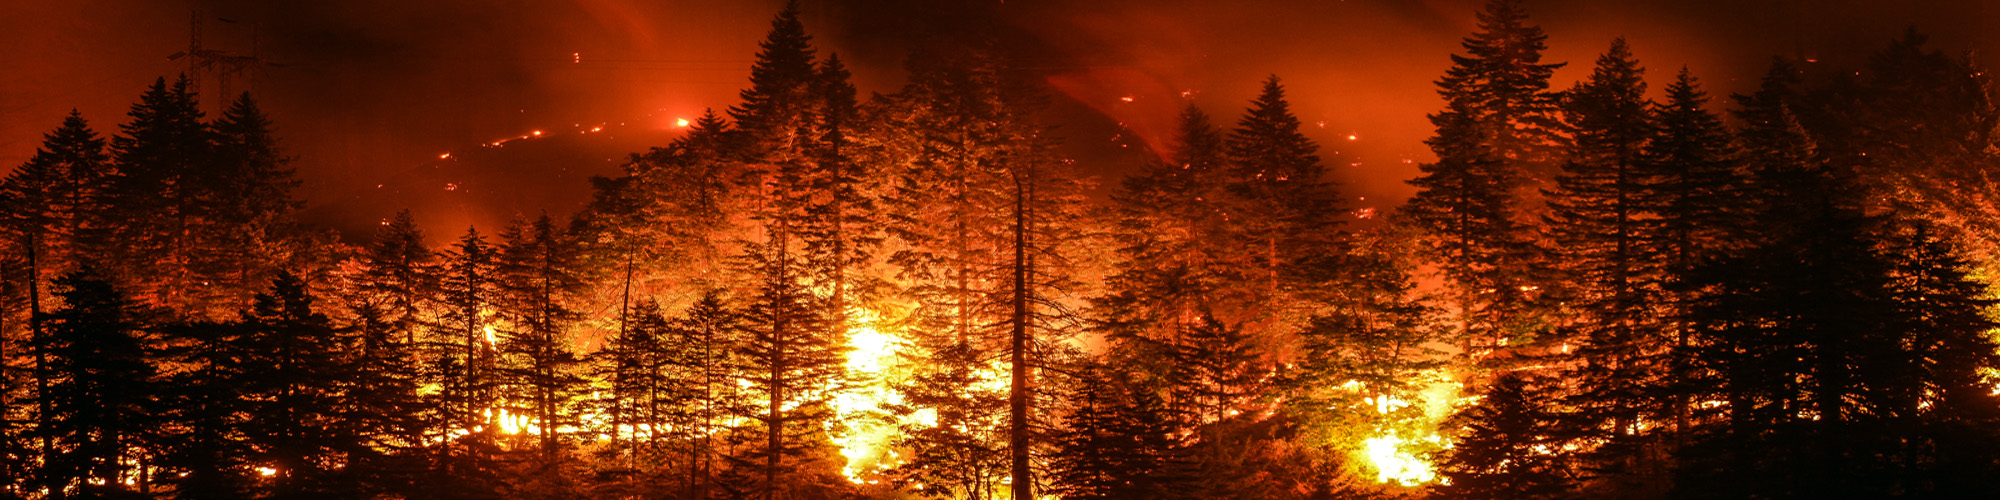
Extreme droughts, heat, wildfires and harvest failures in some areas and extreme rainfall and flooding in others will have severe economic consequences, often for the poorest people. There will be reductions in crop yields and loss of livelihood. Food prices will rise globally. This will add to the inflationary pressures from higher oil prices caused by the Iran war.
Droughts and wildfires in south-east Asia and Australia could have disastrous effects on harvests of palm oil, coffee, cocoa, rice, maize, wheat and various tropical fruits. Droughts and heat reduce output from hydropower and possibly wind energy, and industrial production may slow as a result of extreme heat in workplaces.
In Europe, warmer winters and unusually wet springs promote rapid plant growth. When this is followed by summer heatwaves, the undergrowth dries out and provides fuel for the wildfires. A super El Niño will amplify this. France and Spain have experienced massive wildfires these past few months. In the UK, the 2026 summer has been the hottest on record. The costs in Europe of the heat and wildfires in terms of lost crops and animals have been immense.
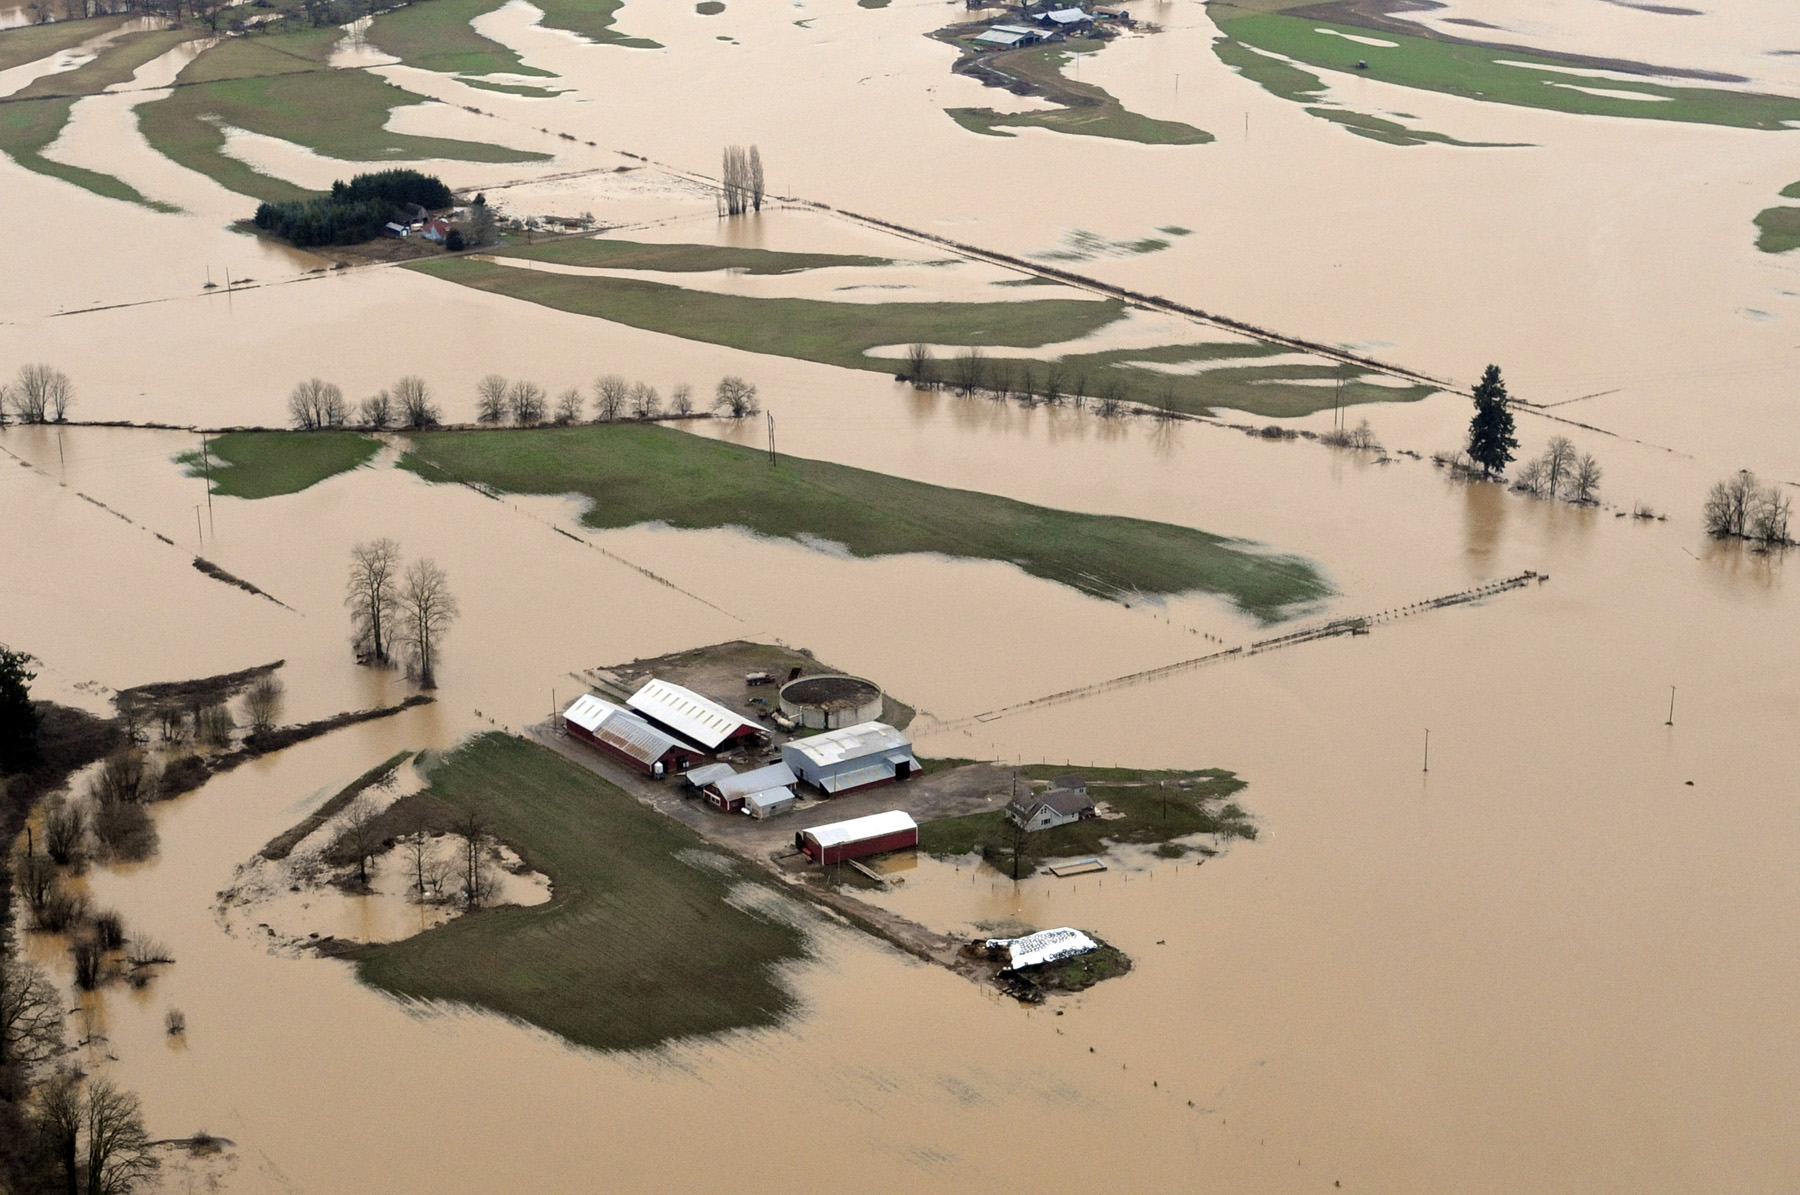 Floods and storms damage roads, power grids, railways and buildings. This forces governments to spend money on repairs instead of long-term investments. People are displaced and many are likely to lose their lives.
Fortunately, El Niños fade after a few months to be replaced by the cooler La Niña. The problem is that, with global warming, the next El Niño in a few years could be even more extreme with even more serious economic consequences.
The hope is that governments wake up to the pressing need to reduce carbon emissions.
Videos and podcast
Information
Articles
- Building climate-resilient agriculture in Europe: an economic perspective
European Environment Agency (17/3/26)
- What Super El Niño Means For Business Supply Chains And The Economy
Forbes, Chloe Demrovsky (25/8/26)
- A summer of extremes: Weathering a hotter world
CBS News, Jonathan Vigliotti (16/8/26)
- Area in Europe affected by wildfires could triple due to climate change
The National (UAE), Tariq Tahir (20/8/26)
- El Niño could drag down the global economy by almost $1 trillion or at least $7 trillion—and the choice is ours
Peterson Institute for International Economics, Cullen S Hendrix (26/7/26)
- UN warns of ‘supersized’ El Niño as countries prepare for impact
BBC News, Esme Stallard, Mark Poynting, Becky Dale, Yvette Tan, Tiffanie Turnbull and Nikita Yadav (3/9/26)
- Toxic haze from wildfires spreads across South East Asia as ‘super’ El Niño intensifies
BBC News (2/9/26)
- A Super El Niño is coming: 5 hard‑won lessons the world can learn from Africa
The Conversation, Tafadzwanashe Mabhaudhi and Mendy Ndlovu (5/7/26)
- ‘Supersizing before our eyes’: UN warns of record El Niño approaching
The Guardian, Damian Carrington (3/9/26)
- ‘Super’ El Niño could cause global food price shock lasting into 2028, analysts say
The Guardian, Richard Partington (12/7/26)
- Without action wildfires in Europe will increase 39% even in best-case climate scenario, study finds
The Guardian, Ajit Niranjan (20/8/26)
- From classrooms to climate action: ICSE 2026 charts new path for sustainability
Economic Times (Times of India) (2/9/26)
Questions
- What is the current state of progress towards meeting the goals of the UN Paris Climate Agreement?
- Are there any externalities in consumption that affect global warming?
- How might technological progress make it privately profitable to reduce carbon emissions?
- How might global supply chains and shipping be affected by a super El Niño?
- What role can education play in tackling climate change and its effects?

The US national debt hit a milestone in August 2026. It reached a staggering $40 trillion. The national debt is the amount owed by the US federal government to holders of government bonds and bills (treasury securities). The debt grows each year by the size of the annual government deficit, which is the amount that government expenditure exceeds tax and other revenues. The bigger the deficit, the more the national debt grows. The $40 trillion debt represents 126% of GDP – in other words it is more that the total annual output of the USA. It represents around $118,000 per head or $290,000 per household
But does this high and rising debt matter? And how does it compare with other countries?
The comparative size of the national debt
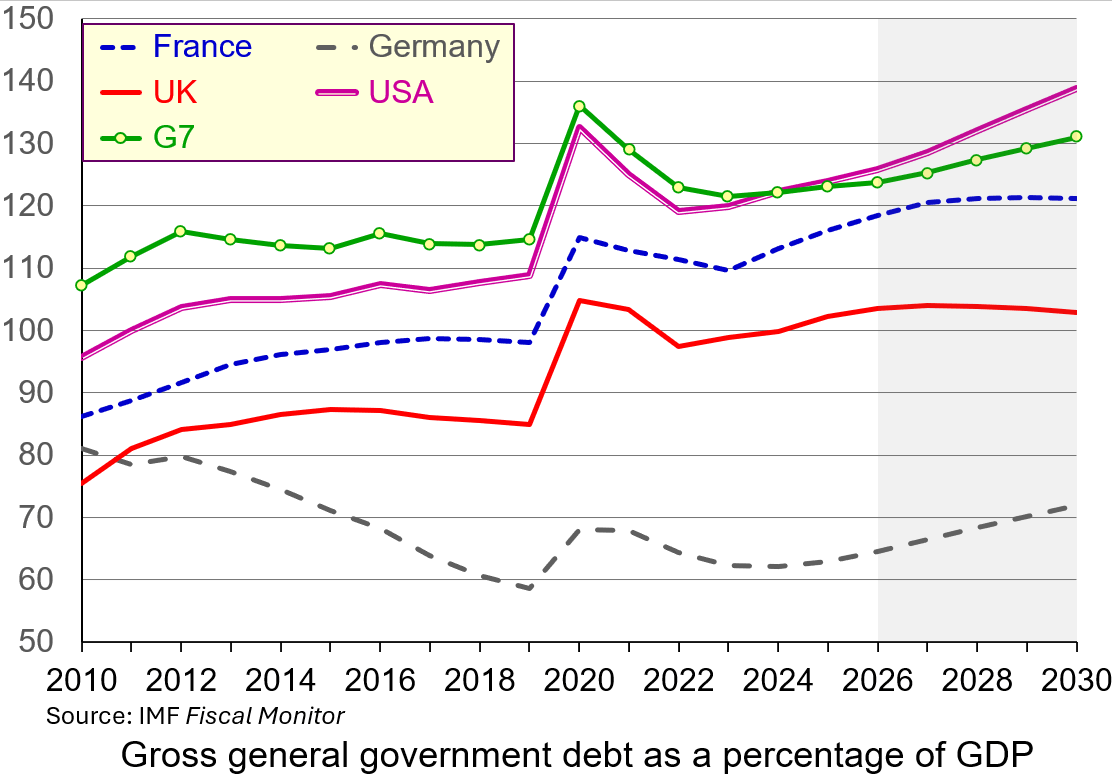 In absolute terms, the US national debt is huge, reflecting, in part, the size of the US economy. In percentage terms (126% of GDP), it is higher than Germany (65%), the UK (104%), Canada (110%) and France (118%) and slightly higher than the G7 average (124%). It is lower, however, than Italy (138%) and much lower than Japan (204%).
What is more, the IMF forecasts that the US national debt will rise from 126% of GDP in 2026 to 139% by 2030. This is because of continuing budget deficits, which require funding. The federal budget deficit is forecast to be around $2 trillion in the financial year ending September 2026 – it was $1.78 trillion in the previous financial year.
Japan’s debt percentage, by contrast, is forecast to fall from 204% in 2026 to 194% by 2030. Also, only about 10% of Japan’s debt is held by foreign investors. Around 90% is financed domestically by Japanese households, local banks, insurance companies, and the Bank of Japan. This makes Japan’s debt more sustainable than the USA’s, where around 28% is held by foreign investors (foreign governments, companies, banks and individuals).
Unlike domestic institutions (such as pension funds), which often have a structural bias to hold domestic assets, foreign investors typically view a country’s bonds as one of many global alternatives and are likely to switch faster to other countries’ assets during periods of market stress. The higher the proportion of bonds held outside the country, the more vulnerable the country is likely to be to bond market speculation.
The UK’s national debt percentage is forecast to fall slightly from 104% of GDP in 2026 to 103% in 2030. However, the UK is a global financial hub and the percentage of debt held by foreign investors (around 30%) is a little higher than in the USA. UK debt held overseas has risen from around 15% in the mid-2000s. It is likely to rise further.
Does high and rising US national debt matter?
 Servicing the debt. In February 2022, the US central bank rate (the Federal Funds rate) was 0.25%. It then rose in increments to combat rising inflation and reached 5.5% by July 2023. Although it has come down slightly since, standing at 3.75% in August 2026, US interest rates are higher now than at any time from 2008 to 2022. With higher interest rates, the USA now pays roughly $1.1 trillion annually just to service the debt. This accounts for around 15% of total federal spending – up from an historical 50-year average of just under 9%.
Upward pressure on domestic borrowing rates. To fund its deficits, the US Treasury Department must continually issue massive amounts of government bonds. This high volume of government borrowing competes for capital in global financial markets, which can push up broader interest rates. For businesses, this imposes a cost on investment and can act as a disincentive to borrow. For consumers, it adds to cost-of-living pressures by raising the cost of mortgages, car loans, credit card debt and other borrowing.
Crowding out other public spending. The money spent on servicing the debt is not available for building roads or other infrastructure, funding education, healthcare or defence, or providing social security. Annual interest payments of around $1.1 trillion now exceed national defence spending (around £960 billion), making it the third-largest item in the federal budget after healthcare and social security. As the national deficits and debt expand, so a higher proportion of current taxes is being used to fund past expenditure.
Long-term fiscal risk
The US dollar is the world’s primary reserve currency. This creates persistent global demand for US debt. However, ratings agencies and other organisations, such as the Congressional Budget Office (CBO), warn that adding $1 trillion to national debt roughly every five months is an unsustainable trajectory that could eventually erode confidence in the US economy.
 Already, many countries are seeking to expand the range of currencies used as reserves, including Chinese yuan, the euro and crypto currencies. They are also holding more gold. In 2001, the US dollar accounted for 72% of currencies held globally as reserves; by 2025 this had fallen to 57%. This process could accelerate as confidence in the USA is eroded because of the size of the debt and the capricious policies towards trade.
During periods of quantitative easing (QE), central banks, including the Fed, purchased large amounts of government bonds. But now, as central banks scale back their bond holdings in programmes of quantitative tightening (QT), foreign private investors and domestic households are being forced to absorb the majority of newly issued government debt, making pricing and yields increasingly sensitive to global investor demands. A decline in confidence can lead to a large sale of bonds, forcing down their price, thereby forcing up their yield and hence the interest that has to be paid on newly issued bonds. This is what happened in the UK in September 2022 under the short-lived administration of Liz Truss when she and her chancellor, Kwasi Kwarteng, made unfunded promises of tax cuts.
The USA is not immune to such bond market jitters. In mid-August, the yield on 30-year US Treasury bonds reached 5.3% – the highest level since 2007.
A worsening problem
 The US deficit is likely to increase, making the national debt rise more rapidly. There are various reasons.
The US population, as in many countries, is ageing and the proportion of retired people is rising. This puts increasing demands on healthcare and social security, with a proportionately smaller workforce to fund them.
The deficit has also been increased by deliberate government policies. For example, Donald Trump’s 2025 ‘One Big Beautiful Bill’ Act made substantial tax cuts, largely for the wealthy.
Congress caps the debt at a certain level and in the past this has acted as a brake on size of the deficit. However, the cap was raised by $5 trillion in 2025 and this could well happen again, allowing debt levels to expand further.
But reining in the deficit could have a contractionary effect on the economy as taxes are raised and/or expenditure is cut. Governments are reluctant to do this as it could lead to recession, or at least falling growth in the short term, and this could affect their chances or re-election. With the mid-terms approaching in the USA, and the presidential election just two years later, this is an unlikely policy for the Trump administration to pursue.
Articles
- Five charts explaining America’s $40 trillion debt
euronews, oloresz Katanich (22/8/26)
- How Much the National Debt Grew Under Trump and Biden
Time, Chantelle Lee (22/8/26)
- 7 questions about the national debt hitting $40 trillion
PBS News, Lisa Desjardins (19/8/26)
- The U.S. National Debt Officially Surpassed $40 Trillion in August: Here’s What History Says This Means for the Stock Market
Yahoo! Finance, Neil Patel, The Motley Fool (24/8/26)
- National debt reaches grim $40 trillion milestone. Here’s why that matters
CNN, Tami Luhby, John Towfighi, Matt Stiles and Amy O’Kruk (20/8/26)
- Jumpy bond markets make it clear: Trump risks driving US into debt crisis
The Guardian, Heather Stewart (23/8/26)
- Is the Trump Treasury panicking over the level of US debt?
The Guardian, Kenneth Rogoff (26/8/26)
- US debt hits $40 trillion: Who does Washington owe and why does it matter?
Aljazeera, Shola Lawal (21/8/26)
- US national debt passes $40tn after doubling in a decade
BBC News, Michael Race and Francisco Velasquez (20/8/26)
- Why the US economy is ringing alarm bells
BBC News, Michael Race (21/8/26)
- The war is raising the price of money. That’s a problem for the global economy
CNN, Matt Egan (2/9/26)
Information
Questions
- Distinguish between national debt, central government debt and general government debt.
- Would it be possible to run a budget deficit and yet for the national debt to fall as a percentage of GDP?
- Japan and Italy have a higher debt to GDP ratio than the USA or the UK. Why are they less subject to bond market pressures than the USA or the UK?
- What policy measures would you recommend to the US government to tackle the rising national debt and why?
- Could the USA ‘grow its way out of the debt problem’?
 The world has suffered from a number of adverse supply shocks in recent years. First there was the credit supply shock of 2007–9 that led to a default on mortgages, a collapse in confidence in the banking system, the drying up of the inter-bank market, the freezing of lending and a global economic contraction. Then there was the COVID-19 pandemic. This shock to the the global economy led to a a fall in output and breaks in supply chains. As recovery took place, supply-side difficulties led to a surge in inflation.
Then there was the Russian invasion of Ukraine. This shock to energy and grain supplies led to rises in fuel and food prices: a cost-push inflationary shock. More recently, the closing of the Strait of Hormuz has cut off an important supply route and again sent fuel and other other prices rising.
These supply-side shocks create a dilemma for central banks. They push up inflation, but push output and employment down – a situation of ‘stagflation’.
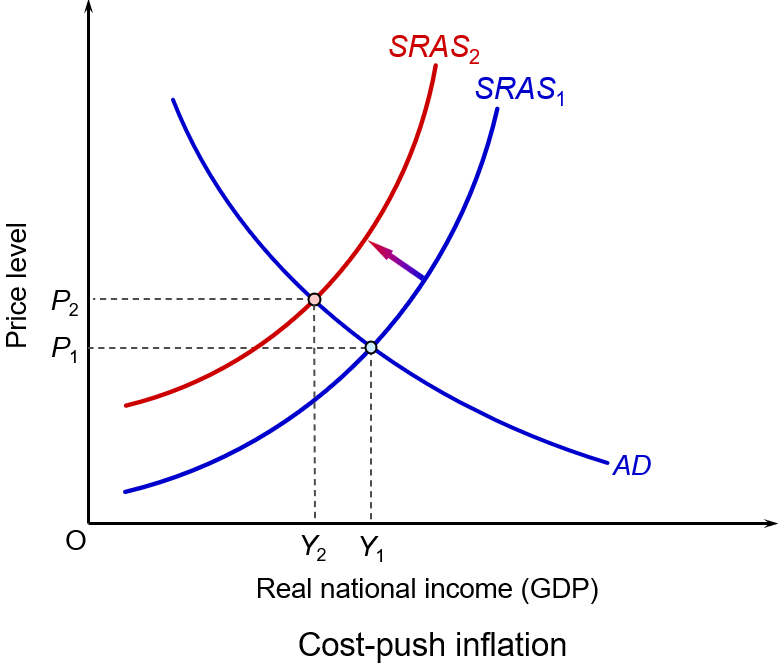 This can be illustrated with a simple aggregate demand and supply diagram. The shock shifts the aggregate supply curve upwards to the left, illustrated by the move from SRAS1 to SRAS2. The price level rises to P2 and GDP falls to Y2.
But central bank policy is designed to affect aggregate demand, not aggregate supply. If it raises interest rates, aggregate demand will shift to the left. The price level will fall (or at least the rate of inflation will fall), but output will fall further. If it cuts interest rates, aggregate demand will shift to the right. This will help to curtail, or even reverse, the fall in GDP, but will lead to even higher prices.
For countries where their central bank has a simple inflation mandate (e.g. keeping inflation close to 2%), sticking to this target in the short term would result in higher interest rates, lower economic growth and higher unemployment – and possibly even a recession. In such cases, central banks tend to project forward beyond the short-term shock and set interest rates to target inflation in a few months’ time. Indeed, many central banks do explicitly target inflation in the medium term (1 or 2 years) rather than the short term.
Central banks, such as the US Federal Reserve Bank, which have a dual mandate of targeting inflation but also maximising employment, the trade-off between these two objectives can be stark. Getting the inflation down requires a higher rate of interest; maximising employment in the face of an adverse supply shock requires a lower rate of interest.
The short-term economic costs, let alone the human costs if the shock involves a war, can be great. People may suffer extreme hardship. The cost to the US Treasury of the first six weeks of the Iran war were estimated by the Pentagon to be some $29bn1 – which translates into higher taxes for US residents, lower government spending on non-war related items, higher government borrowing or some combination of the three. Other estimates put the cost to the US taxpayer as much higher – up to $1 trillion over the longer term.2 Then there are the costs to consumers of higher fuel and other prices, estimated at around $410 per month.3
The costs to Iranian citizens will be much higher in terms of war damage and loss of livelihood, let alone the suffering and loss of life. Then there are the costs to the rest of the world from higher prices of fuel, fertilisers and various industrial materials that are normally shipped through the Strait of Hormuz.
Long-term economic gain?
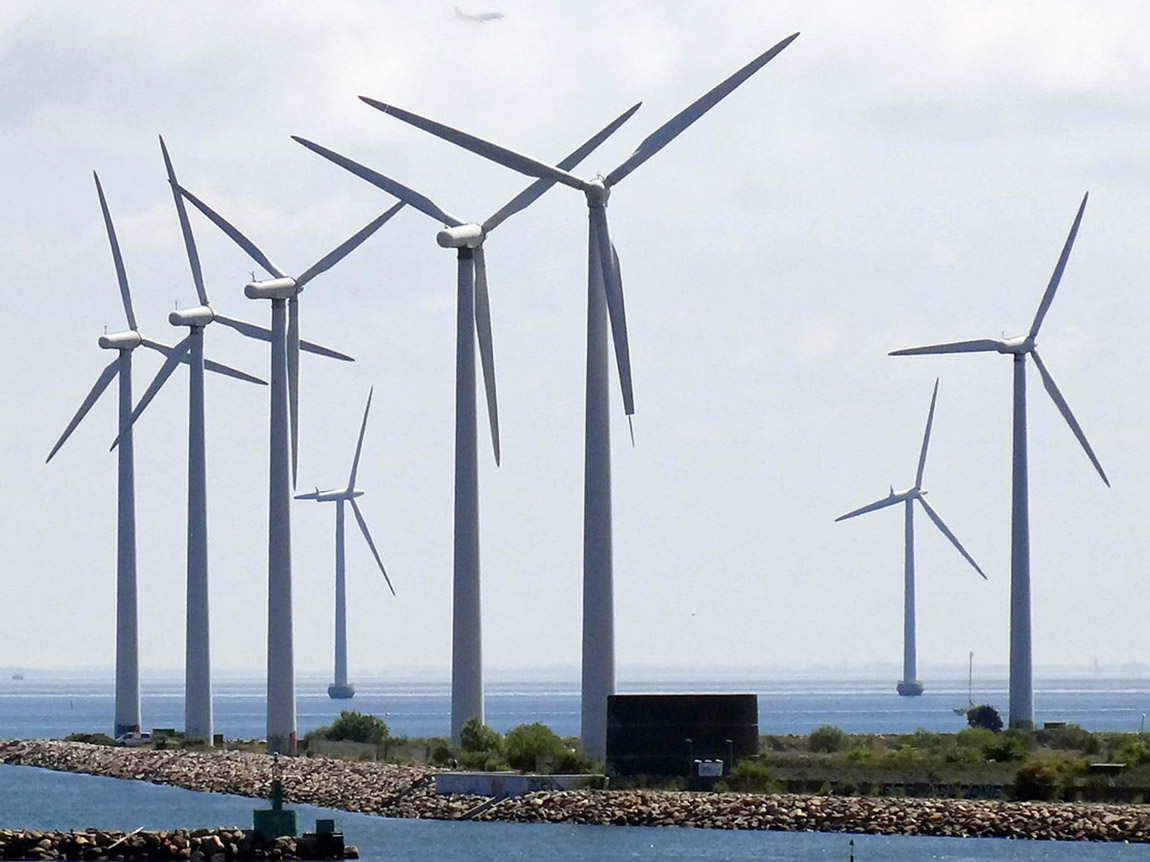 Supply shocks often expose economic vulnerabilities that can later be addressed, making supply chains more diverse and more resilient. They can give a boost to alternative technologies, such as a switch from fossil-fuels to green energy.
After the 2007–9 financial crisis, banking systems were made more robust under the Basel III system. Capital and liquidity requirements were increased and bank leverage was decreased. Many countries, such as the UK, introduced ‘ringfencing’ to separate retail banking from the riskier investment banking. This increased confidence in the banking system.
The COVID-19 pandemic gave a boost to working remotely and the establishment of more flexible work patterns. What was a necessity during lockdowns, was seen as an effective model by many companies. Fully remote or hybrid working became commonplace for many jobs that were previously done in the office. Time has allowed employers to find the best balance of in-office and remote working, with the optimum balance often varying by type of job being performed.
The rising price of oil and gas following the Russian invasion of Ukraine in February 2022, saw many countries that had been reliant on imports from Russia, accelerating their efforts to switch to renewable energy. Supply chains were re-examined and there was a move towards ‘re-shoring’, ‘near-shoring’, or ‘friend-shoring’: that is, obtaining supplies from countries that are nearer and/or more reliable as trading partners.
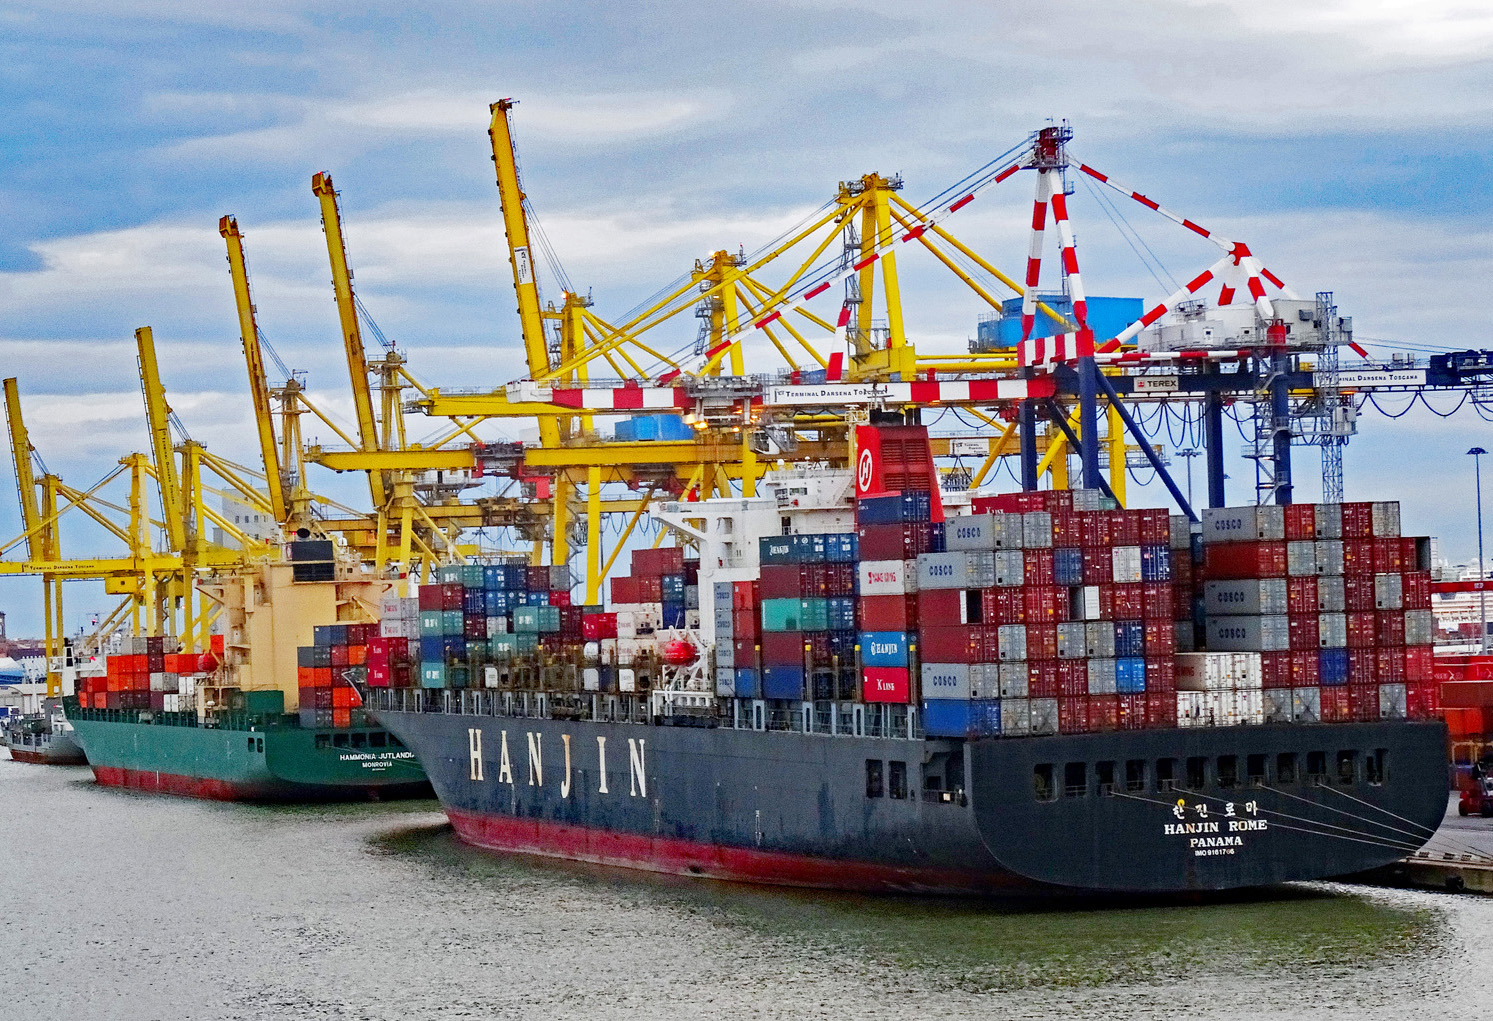 This approach was further boosted by the extensive tariffs imposed by the Trump second administration. One of the responses to the higher tariffs was to seek markets, both for exports and imports, away from the USA. To the extent that there is ‘re-shoring’ (substituting exports and imports for production and consumption within the country), then this amounts to deglobalisation. If this represents a move from low-cost to high-cost production and is contrary to the law of comparative advantage, then there will be a net economic loss. If, however, the reduction in risk of disruption and the boost to domestic industries allows a reduction in costs, there could be a net gain.
The most recent example of the Iran war has led many countries to reconsider sources of supply and to make their supply chains more robust and less risky. Gulf countries are considering expanding their pipeline network to avoid the Strait of Hormuz. For other countries, it is providing a further boost to green energy. Increased investment in the renewable sector will help to bring down costs and make countries less vulnerable to future conflicts involving oil-producing countries or sea passages.
To summarise: if initially adverse supply-side shocks cause a diversification and strengthening of supply chains, a diversification of energy sources, accelerated technological innovation and the adoption of new more efficient techniques, the long-term supply-side effects could be positive. Pain today for gain tomorrow?
But the short run comes before the long run and today’s costs are real and mounting. A shock may stimulate a positive response, but the current shock is persisting, and forecasts are getting more dire by the day. And even when the Iran war is over, there may be more shocks around the corner – ‘unknown unknowns’. As Keynes said: ‘In the long run we’re all dead’.
References
- Pentagon’s estimate for Iran war grows to $29B
Politico, Mark Sweney (12/5/26)
- World Politics The Iran war could cost the American taxpayer $1 trillion, says Harvard academic
CNBC, Joseph Wilkins (14/4/26)
- The Economic Costs of the Iran War
American Enterprise Institute, Roger Pielke Jr. (2/4/26)
Articles
Questions
- What policies have central banks pursued during the Iran war?
- Paint an optimistic scenario for the global economy five years hence.
- Paint a pessimistic scenario for the global economy five years hence.
- Compare the sources of supply of oil and gas for Europe directly prior to the Iran war with those directly prior to the Russian invasion of Ukraine.
- Compare the relative merits of globalisation and deglobalisation. Does this depend on the nature of globalisation and deglobalisation?
 Economists use game theory to understand decision making where the outcome for an economic actor – individual, firm, government, etc. – depends on the actions and reactions of other actors. It models how rational actors make optimal decisions based on their expectations about such actions and reactions of competitors. Sometimes these expectations will be based on considerable knowledge; sometimes they will be based on hunch or the degree of optimism or pessimism.
Perhaps the most famous game is the prisoners’ dilemma. This is where two or more firms (or people) independently attempt to choose the best strategy, thinking about how their rivals are likely to react. But they end up in a worse position than if they had co-operated in the first place. For example, if a firm is considering cutting price, it would gain market share if the other firm does not cut price; in such a scenario it is likely to gain by cutting price. If, however, the other firm is expected to cut its price, the first firm will have to cut price itself to avoid losing market share; in this scenario it will also cut price. Assuming the other firm reasons the same, the outcome is likely to be a price war, with both firms losing profit. However, if they both colluded to maintain prices or even raise them (assuming they can evade any legal restrictions on collusion), they will both gain.
 Another example is the game of chicken. This is where two or more actors engage in brinkmanship, hoping that the other actor(s) will give in first. Take the above example of a price war. Assume that two firms are engaging in price cutting. They know that this will damage their short-term profit. But each hopes that the other will give up first and may then be willing to collude or, better still, be driven out of business. If either firm thinks it can win the game, it will reason that short-term pain is justified by long-term gain.
The war in Iran
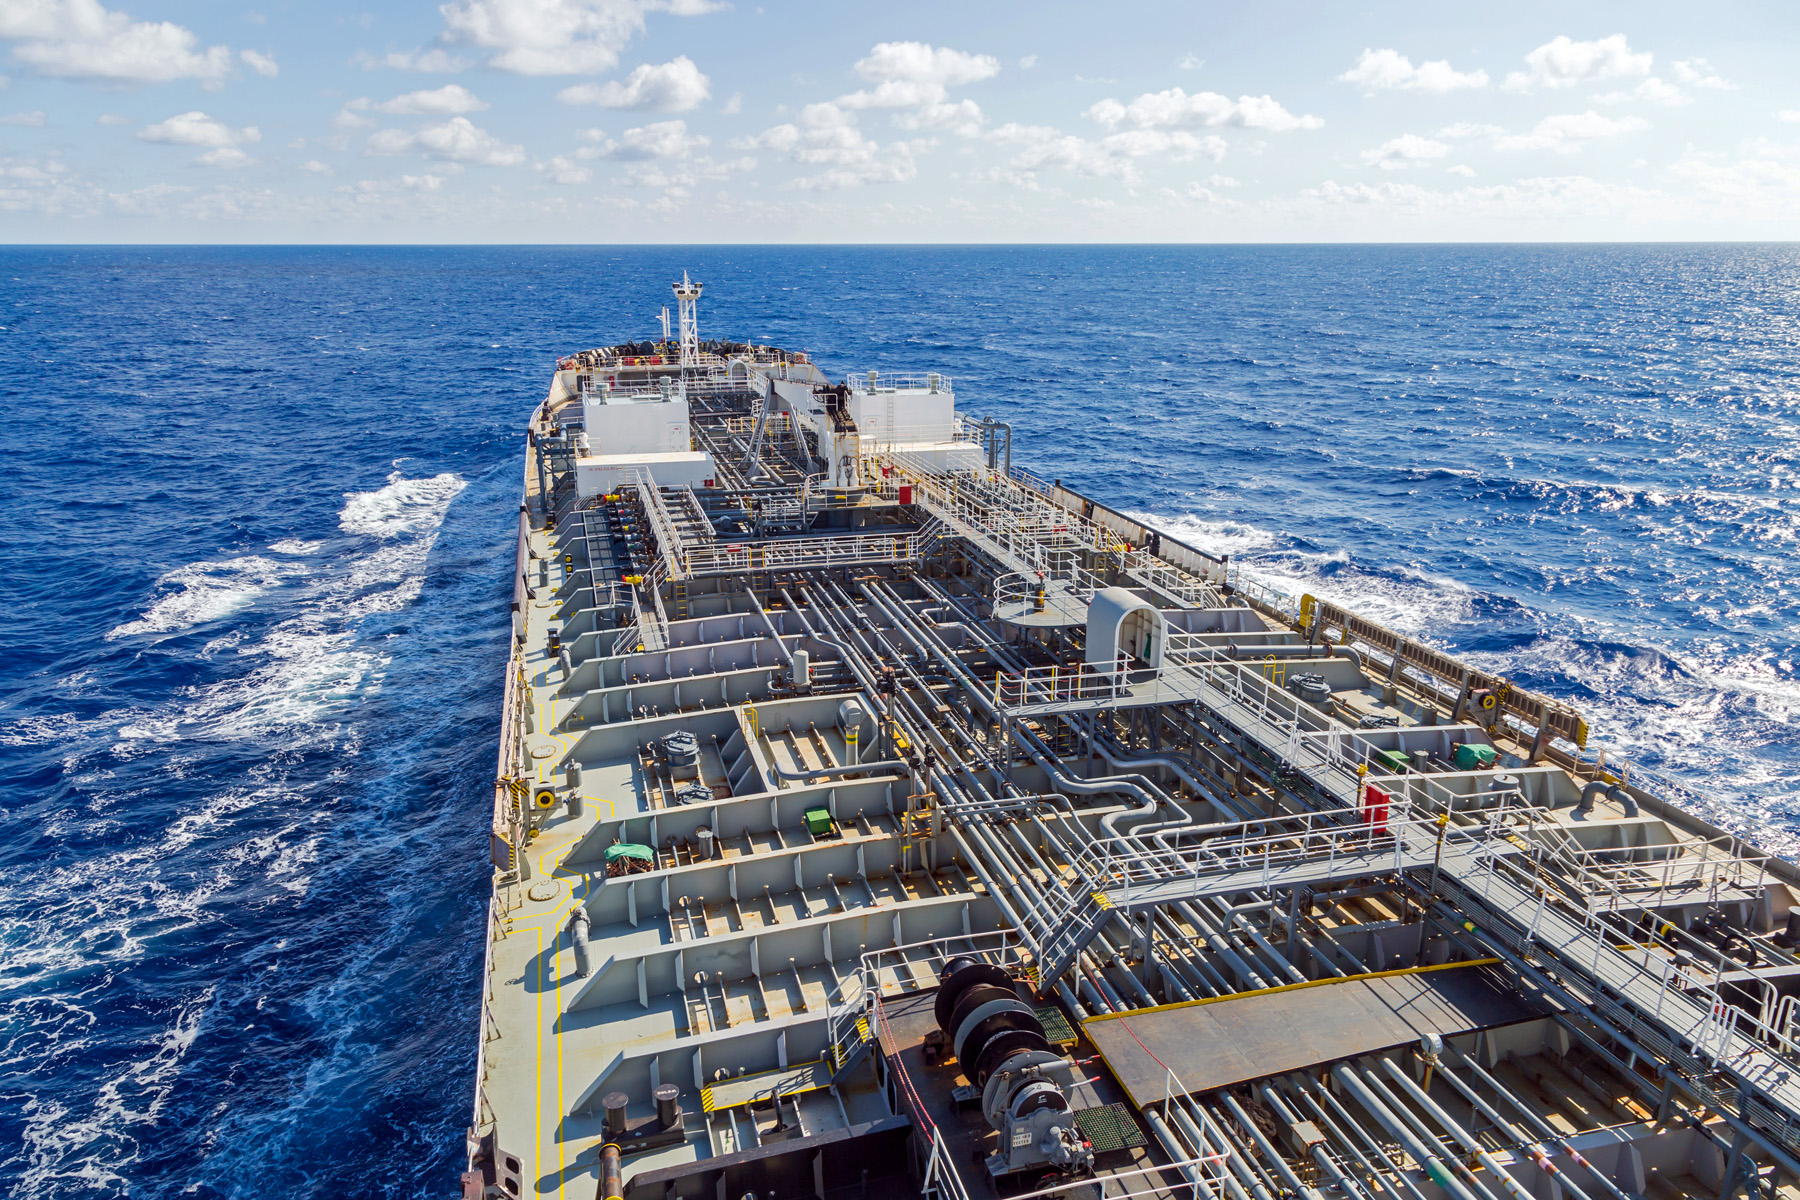 A game of chicken is currently being ‘played’ by the USA and Iran. Iran is blocking the Strait of Hormuz; the USA is blockading Iranian ports, preventing ships from arriving or leaving. Both policies inflict economic pain. Blocking the Strait of Hormuz has driven up oil and gas prices and the prices of many other products exported through the Strait – products such as fertilisers, plastics, petrochemicals, sulphur, methanol and helium.
Each side hopes that the economic pain inflicted on the other will cause it to give up first.
But the game is ‘asymmetric’: the costs of continuing the blockades are different for each side and thus the pressures on each side to concede differ. For Iran, the blockade of its ports is massively curtailing its exports and is doing huge damage to its economy, already battered by bombing. But the war has so far seemed to allow the Iranian authorities to tighten their political grip and they may be prepared to play the ‘long game’ by rallying the Iranian population against the US and Israeli assault. The authorities may calculate that the Iranian people will be prepared to endure greater hardship for some time.
The USA is facing a much lower economic cost. Much of the hardship from the effective closure of the Strait of Hormuz is being borne by other countries. Energy and fertiliser shortages and the resulting rise in price of these critical inputs threaten a humanitarian disaster in some of the poorest countries. Harvests will be down, as will GDP; food prices will soar. There will be widespread economic hardship across Africa and much of Asia, particularly in those countries struggling with existing high debt burdens.
 But for Donald Trump and his administration, those costs are likely to be seen as important only in so far as they affect the USA. However, oil prices are determined in international markets and, despite the US economy gaining from higher oil prices as the USA is a net exporter, the price of fuel to the US consumer has risen substantially. Petrol prices in the USA have risen some 45% since the start of the war and jet fuel prices have doubled, driving up air fares. With the prices of other key products, such as medicines, clothing and electronics increasing too, US inflation is now rising – aggravated by the effects of the tariffs on many products. These costs matter to the US consumer and, with mid-term elections approaching and with Donald Trump’s approval rate plummeting, the USA is likely to be more sensitive to short-term economic costs than Iran.
But the USA poses a much greater military threat to Iran than vice versa and this is seen in the USA as a major advantage in this high-stakes game of chicken. But the Iranian authorities’ willingness to endure further military strikes for what they see as long-term gain, may make them unlikely to concede first.
Podcast and video
Articles
- Chicken
Stanford University, Janet Chen, Su-I Lu and Dan Vekhter
- Who will blink first as the Iran war hits the world economy?
CNN, Nic Robertson (23/4/26)
- Game theory explains why the US’s goals in Iran keep changing
New Scientist, Petros Sekeris (21/4/26)
- The Islamabad Game: From Lose-Lose to Win-Win in the Iran War
Times of Israeil, Vincent James Hoope (28/4/26)
- Deadly game they’re playing: Why Iran, Israel, and the US can’t stop escalating
The Business Standard, Bangladesh, Mohammad Omar Farooq (29/4/26)
- The Middle East’s game of chicken
Funds Global MENA, Raphael Olszyna-Marzys (27/4/26)
- The Strait of Hormuz shows how everything is now about leverage
The Conversation, Renaud Foucart (22/4/26)
Questions
- Explain the prisoners’ dilemma game and explain what is meant by the Nash equilibrium in the game.
- What is the Nash equilibrium of a game of chicken?
- Explain the asymmetries in the ‘game’ being ‘played’ by the USA, Israel and Iran?
- What other actors are there in the ‘game’ and do they play any significant role?
- How important is information and understanding held by the USA, Israeli and Iran about the likely consequences of their actions?
- What can mediators, such as Pakistan, do to de-escalate the situation?
- What are the likely long-term costs to the global economy if the blocking of the Strait of Hormuz persists for a number of months?
With relentless bombing of Iran by Israel and the USA, and with Iranian counterattacks on Gulf states, the costs of the war are mounting. The most obvious are in terms of human lives, injuries and suffering. But there are significant economic costs too. Some of these are immediate, such as the rising price of oil and hence the costs of fuel, or the fall in stock market prices. Some will be longer term, depending on how the war develops. For example, prices could rise more generally as supply chains are disrupted.
 The impacts will vary across the world and across markets. The most obvious markets to be affected are those where significant supply comes from the Persian Gulf. Approximately 20% of total global oil consumption passes through the Strait of Hormuz, which connects the Persian Gulf with the Arabian Sea and the Indian Ocean.
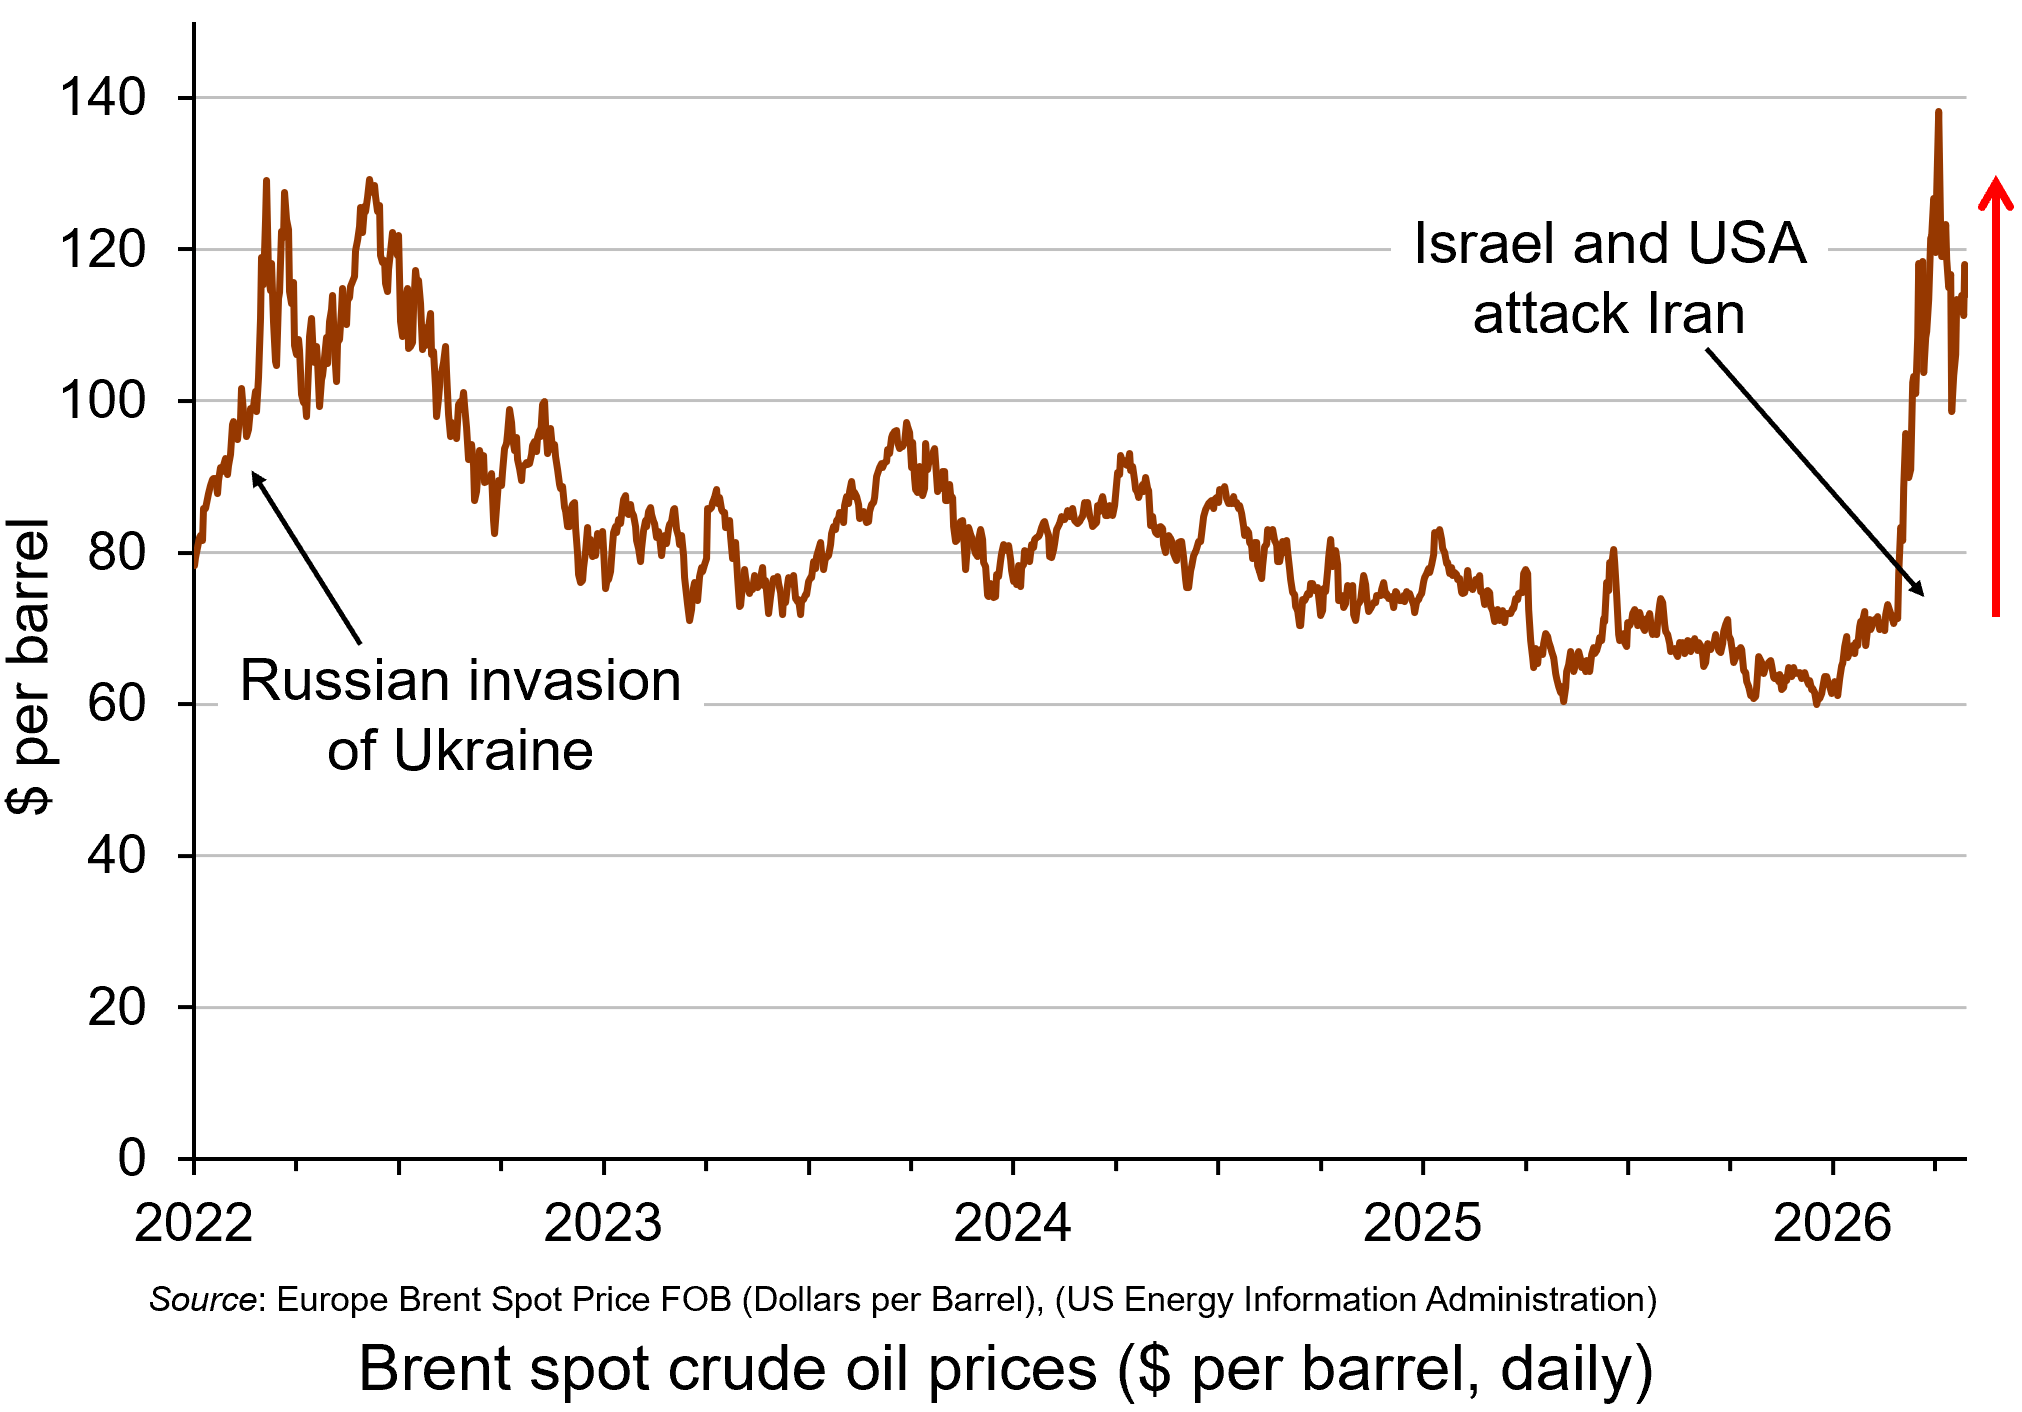
Oil prices rose considerably in the days following the start of the war on 28 February, with Brent crude, a key measure of international oil prices, rising from $71.3 on 27 February to a peak of $119.4 per barrel by the morning of 9 March – a rise of 67%. It was possible that they would rise even further in the short term. However, prices fell back substantially later on 9 March after G7 finance ministers declared that the group ‘stands ready’ to release oil from strategic reserves if needed. By late in the day, the price had fallen to below $85. (Click here for a PowerPoint of the chart.)
However, despite the announcement on 11 March that 32 countries had agreed to release 400m barrels of oil reserves, oil prices began rising again and reached $100 on 12 March after three tankers had been struck in the Gulf, two of them close to the Strait of Hormuz. With Iran pledging to keep the Strait closed, there were worries that the release of oil reserves would provide only temporary relief. Just over 20m barrels of oil normally pass through the Strait of Hormuz. The 400m barrels released from storage is the equivalent, therefore, of only 20 days’ worth of lost oil from the Gulf.
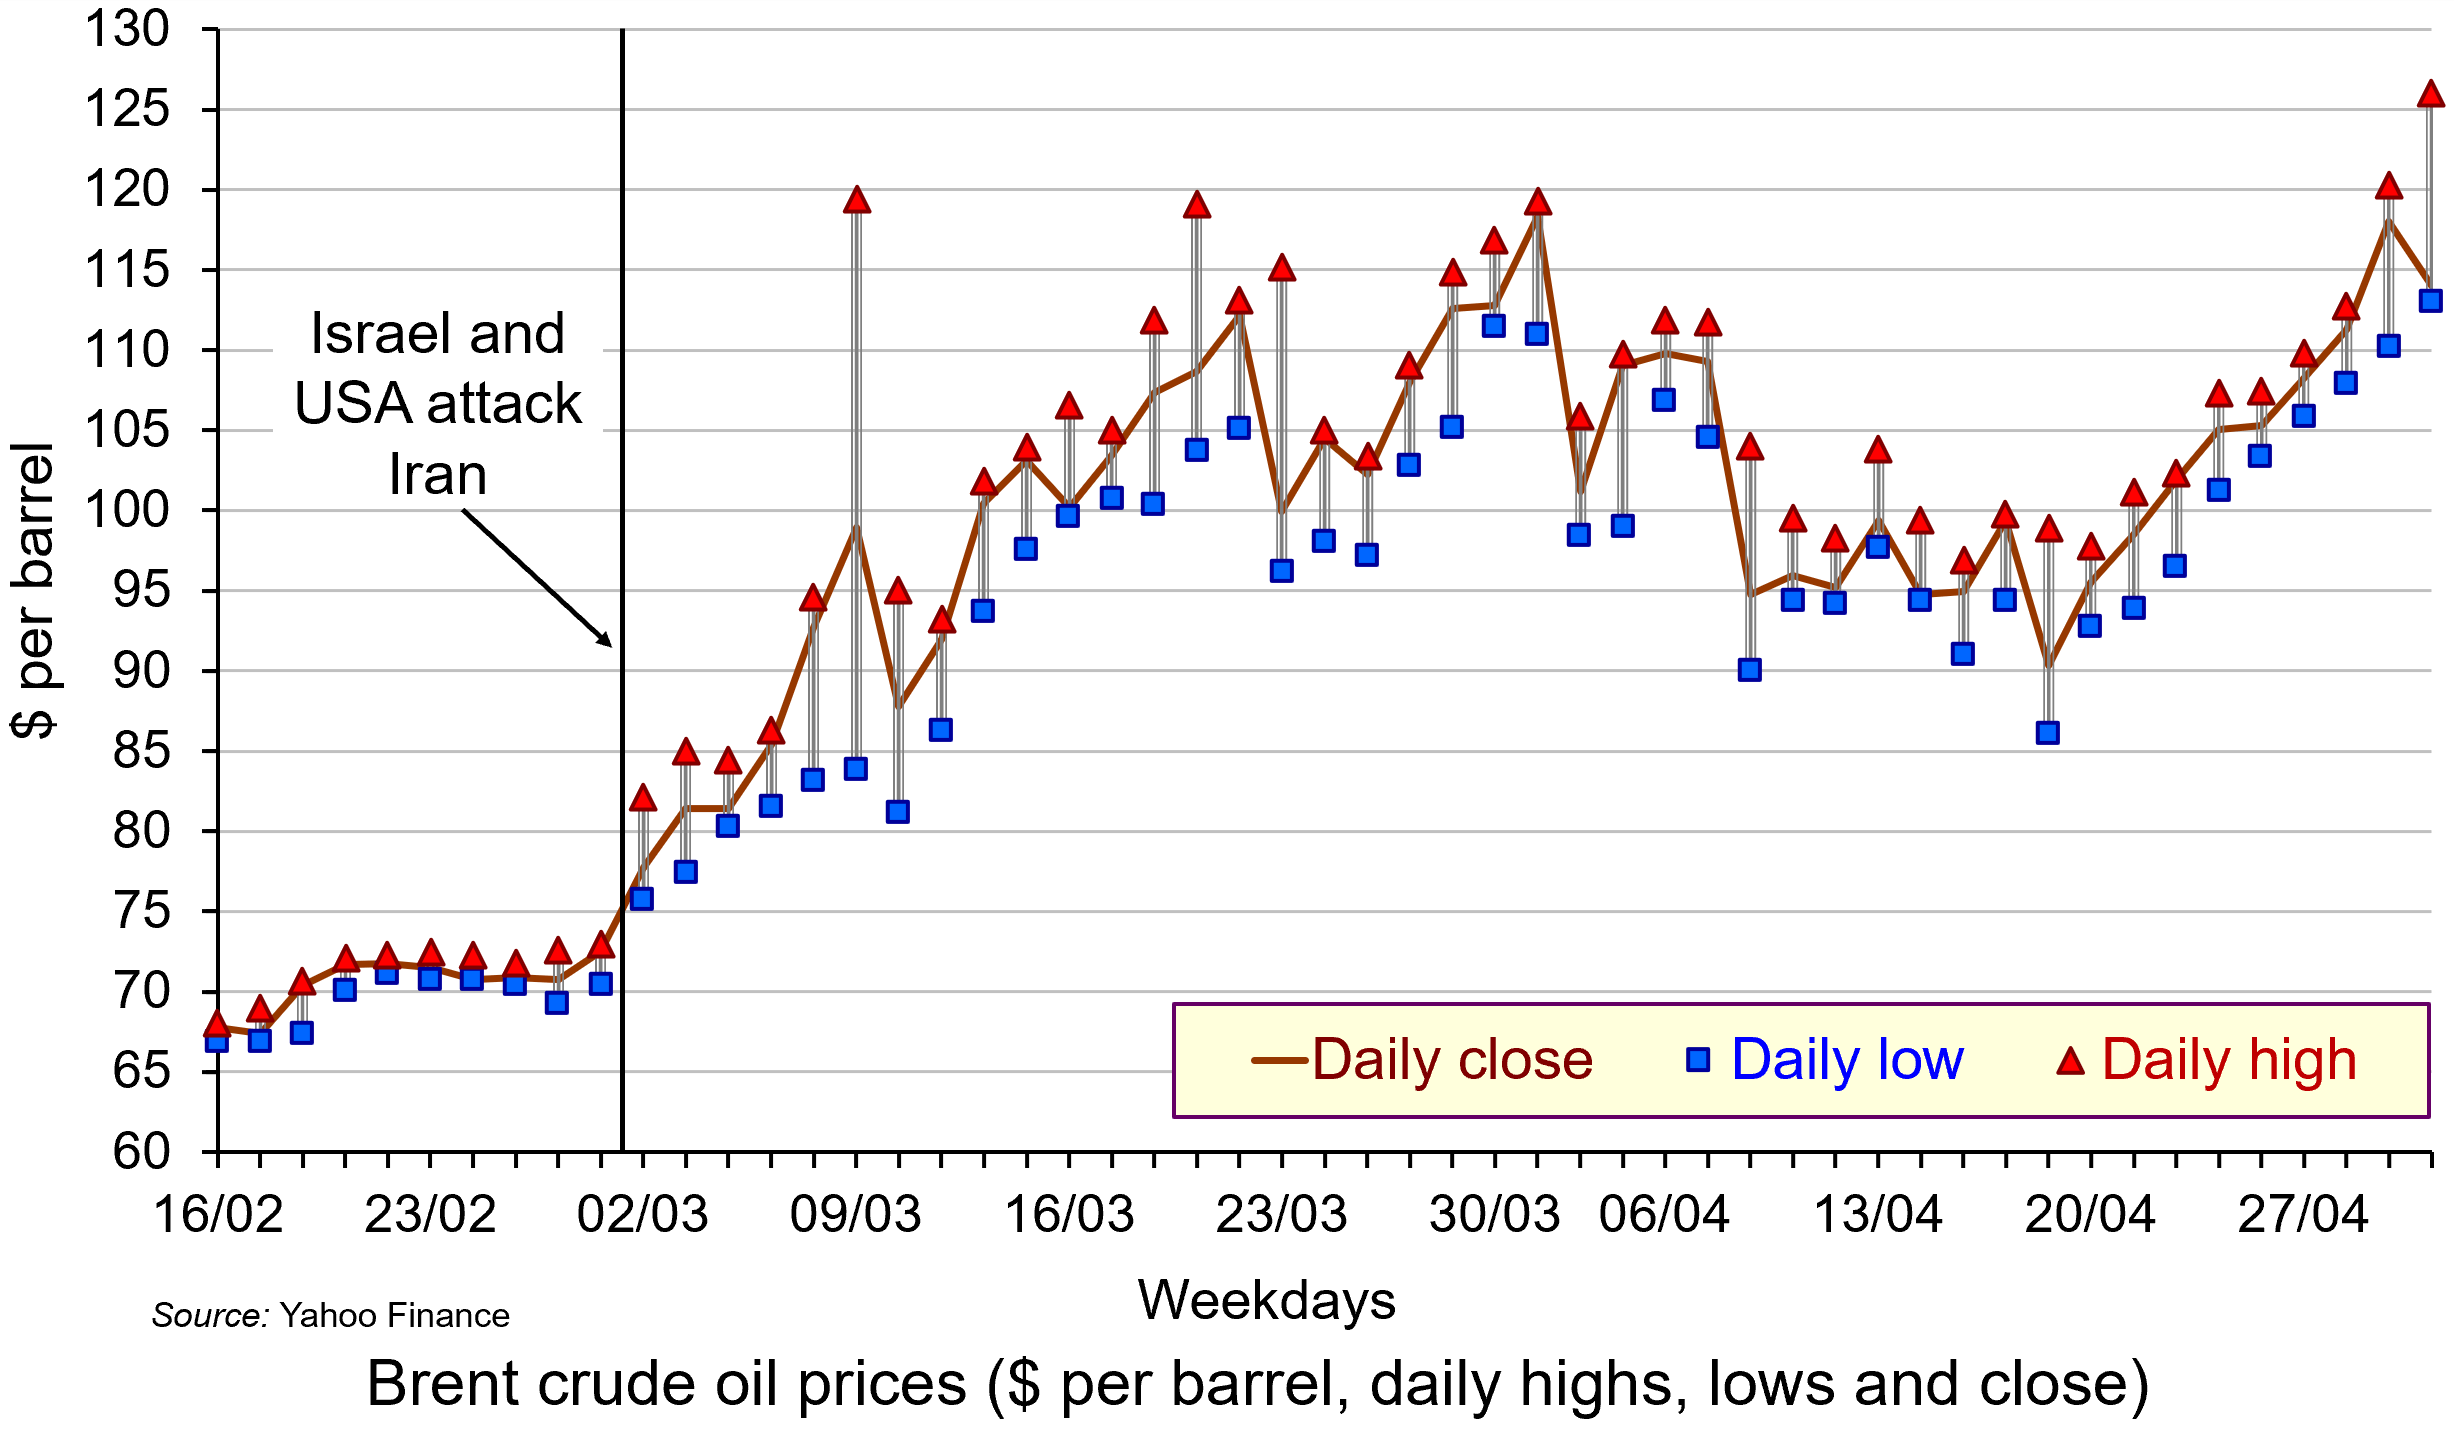
Not only did oil prices rise, but the price became much more volatile as markets reacted to the news on a continuous basis. Intra-day fluctuations in oil prices of several percentage points became typical, reflecting shifting expectations. The second chart shows daily fluctuations, with the highest and lowest prices for each day shown, along with the closing price. (Click here for a PowerPoint.)
The biggest fluctuation had been on 9 March when fears of the closing of the Strait of Hormuz saw the price of Brent crude rising to nearly $120 but falling to around $84 later in the day (a fall of around 30%) after the G7 announcement about releasing reserves.
There was another big fluctuation on 23 March. The previous day (Sunday), President Trump threatened to bomb Iran’s power plants if Iran did not allow free passage of ships through the Strait of Hormuz. Iran threatened to retaliate by striking Gulf countries’ energy and water systems. In early trading on Monday 23rd, Brent crude rose to over $115 per barrel. But later that day, Trump said that there had been constructive talks between the USA and Iran. The oil price immediately dropped to around $96 – a fall of 17% – before settling at around $100.
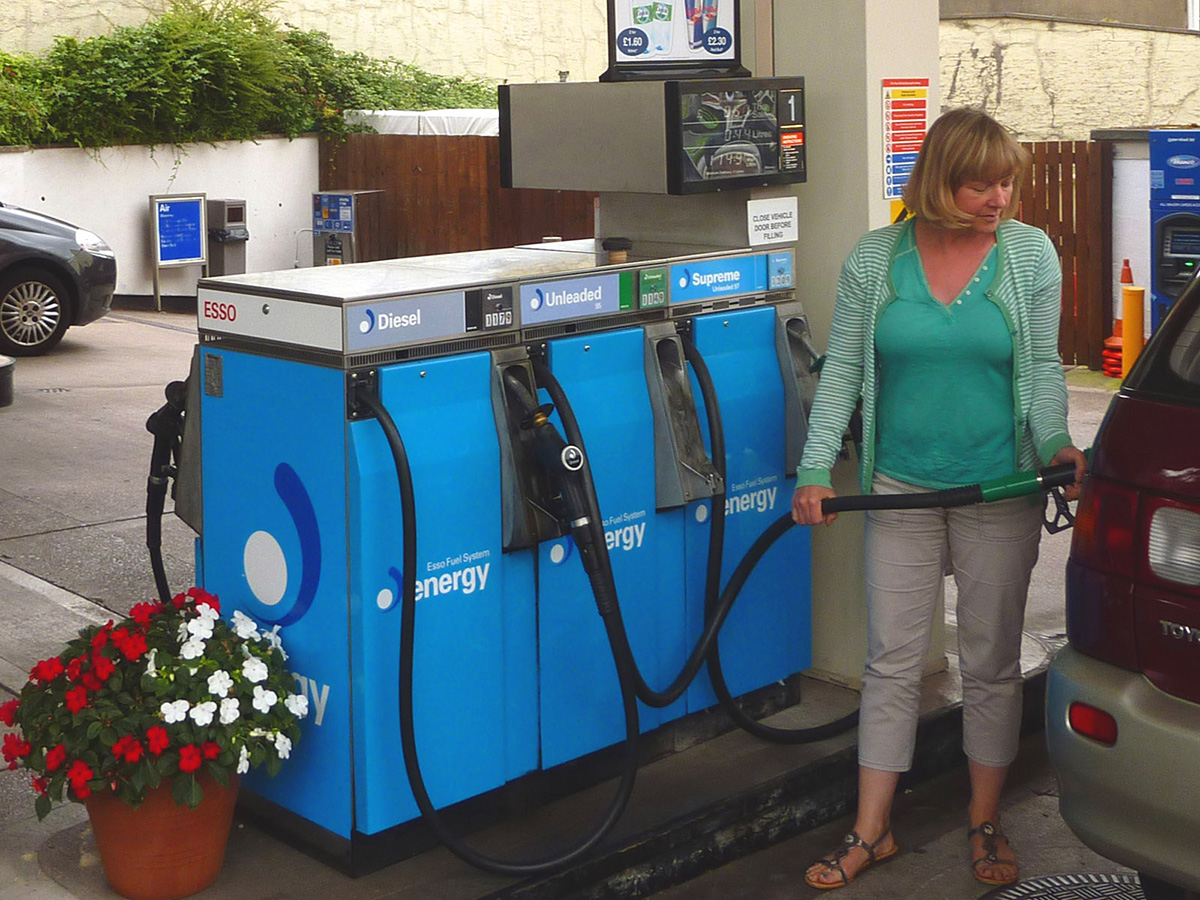 Rising oil prices will drive up inflation. For those countries with a heavy dependence on Gulf oil, particularly countries in Asia, there could be significant supply problems. For oil exporters in the Persian Gulf, with tankers unable to traverse the Strait of Hormuz, the economic impact is huge. Oil exporters outside the Gulf, such as Russia, Norway and Canada, however, will gain from the higher prices. Clearly the size of these effects will depend on how long the conflict continues and how long the Strait of Hormuz remains closed.
And it is not just oil that is affected. Other products, such as liquified natural gas (LNG), petrochemicals, industrial materials, fertilizers for food production, medicines, helium for microchip production, metals and minerals are transported through the Strait of Hormuz. Gulf countries import much of their food through the Strait. On 18 March, Israel struck Iran’s huge South Pars gas field off the Gulf coast. This is the largest gas field in the world and is a major source of export revenue for Iran. Iran responded by striking the Qatari gas hub in Ras Laffan. Donald Trump responded by threatening to ‘blow up’ the entire Iranian South Pars gas field if Iran made further strikes on Qatar. The effect of this escalation was to drive oil and gas prices up further. By the week ending 20 March, the oil price closed at just over $112 per barrel.
Cuts in supplies of oil and other products represent an adverse supply shock. Such shocks push up prices (cost-push inflation), while adversely affecting aggregate output. This can lead to stagflation – a combination of higher inflation and stagnation or even falling output. Central banks with a simple mandate to keep inflation to a target are likely to raise interest rates, or at least delay in reducing them. In the USA, with a dual mandate of controlling inflation but also maximising employment, the response may be less deflationary, depending on the judgement of the Federal Reserve.
Uncertainty
 There is great uncertainty about how long the conflict will last. There is also a lack of clarity and consistency from the US administration about its war aims. This uncertainty has affected financial markets, which have seen considerable volatility. Stock markets have seen widespread falls, with airline, travel and AI-heavy stocks being particularly vulnerable.
If the war is concluded relatively swiftly, the economic effects could be relatively small. If the war continues, and especially if the Gulf countries are drawn further into the conflict and if the conflict spreads to other countries, the economic effects could be much more substantial. A prolonged conflict could see oil prices remaining above $100 per barrel, potentially increasing global inflation by 1 percentage point or more. This would slow or halt the move by central banks to cut rates and thereby reduce global economic growth – potentially, as we have seen, leading to stagflation.
The uncertainty was reflected in the decision of the Fed to keep interest rates unchanged at its meeting on 17/18 March. The Fed has the twin targets of keeping inflation close to 2% and maximising employment. Fed Chair, Jay Powell, acknowledged the current tension between the two goals: ‘upward risks for inflation and downward risks for employment, and that puts us in a difficult situation’. He also recognised that the future for inflation and the economy was highly uncertain as the war developed. This made interest rate setting difficult.
Then there is the issue of a potential new international refugee crisis. If the economic and political system in Iran deteriorates rapidly, this could trigger a wave of migration to neighbouring countries, such as Turkey, already hosting large numbers of refugees. Many could seek sanctuary further afield in Europe, with several countries already facing a backlash against immigration. The political and economic effects of this on host countries could be significant – but as yet, highly uncertain.
Articles
- Assessing the global economic impact of the Middle East war
ING, Carsten Brzeski, Warren Patterson, James Knightley and Deepali Bhargava (5/3/26)
- How the Hormuz closure could affect food, medicines and smartphones
BBC News Verify, Ben Chu (27/3/26)
- How will the Iran war affect the global economy?
Chatham House, Neil Shearing (6/3/26)
- ‘The stakes are enormous’: how a prolonged Iran war could shock the global economy
The Guardian, Richard Partington (22/3/26)
- Iran war is latest threat to a global economy rattled by Trump
Aljazeera, John Power (7/3/26)
- Why an Iran war inflation shock could wreck global economic recovery
The Guardian, Phillip Inman and Kalyeena Makortoff (8/3/26)
- Why has the Iran war sparked fears of stagflation for the global economy?
The Guardian, Luca Ittimani (9/2/26)
- Why the price of oil matters more than you might think
BBC News, Natalie Sherman and Mitchell Labiak (10/3/26)
- Strait of Hormuz: Factsheet
IEA (February 2026)
- Could this energy crisis be worse for the global economy than COVID?
The Conversation, Adi Imsirovic (26/3/26)
- Faisal Islam: Oil price spiral may be slowed but not stopped by G7 emergency move
BBC News, Faisal Islam (9/3/26)
- What on earth is going on with the oil price?
BBC News, Jemma Crew (12/3/26)
- Asia scrambles to confront energy crisis unleashed by Iran war – with no end in sight
The Guardian, Callum Jones (12/3/26)
- The grim choice facing the Trump administration: Economic or naval collapse?
CNN, Phil Mattingly and Zachary Cohen (9/3/26)
- Israel strikes Iran’s South Pars gasfield hours after forces kill intelligence minister
The Guardian, Lorenzo Tondo and William Christou (18/3/26)
- What Fed Chair Jerome Powell said — and didn’t say — about the oil crisis
Yahoo Finance, Jake Conley (19/3/26)
- What strikes on the world’s largest natural gas sites could do to the global economy
CNN, Hanna Ziady (19/3/26)
- How the Iran Conflict May Fuel a New International Refugee Crisis
Forbes, Andy J Semotiuk (5/3/26)
- Iran’s neighbours brace for fallout as war threatens new refugee crisis
Aljazeera, Abid Hussain (17/3/26)
- Two months into the Iran war, almost everybody is a loser
CNN, Ivana Kottasová (2/5/26)
Data
Report
Questions
- Who are the biggest gainers and losers from disruption to oil supplies from the Persian Gulf?
- Illustrate the effect of the current oil price shock on an aggregate demand and supply diagram (either static or dynamic).
- Why is the Iranian war likely to be less damaging to the European economy than the Ukrainian war has been?
- Why have AI-related stock prices been vulnerable to the uncertainty caused by the Iranian war?
- How have the Bank of England and the Federal Reserve Bank responded to higher oil prices and the broader economic effects of the war? Why might their responses be different in the coming months?
- What is the likely impact of the Iranian war on global economic recovery?
- How might the Iranian war affect global economic alliances?
- How is the current oil price shock likely to affect the eurozone? Will it be different from the oil price shock that followed the Russian invasion of Ukraine?
- What are the likely economic effects of large-scale migration caused by the war?
 A ‘Super’ El Nino Is Coming For Southeast Asia. What Happens Next?