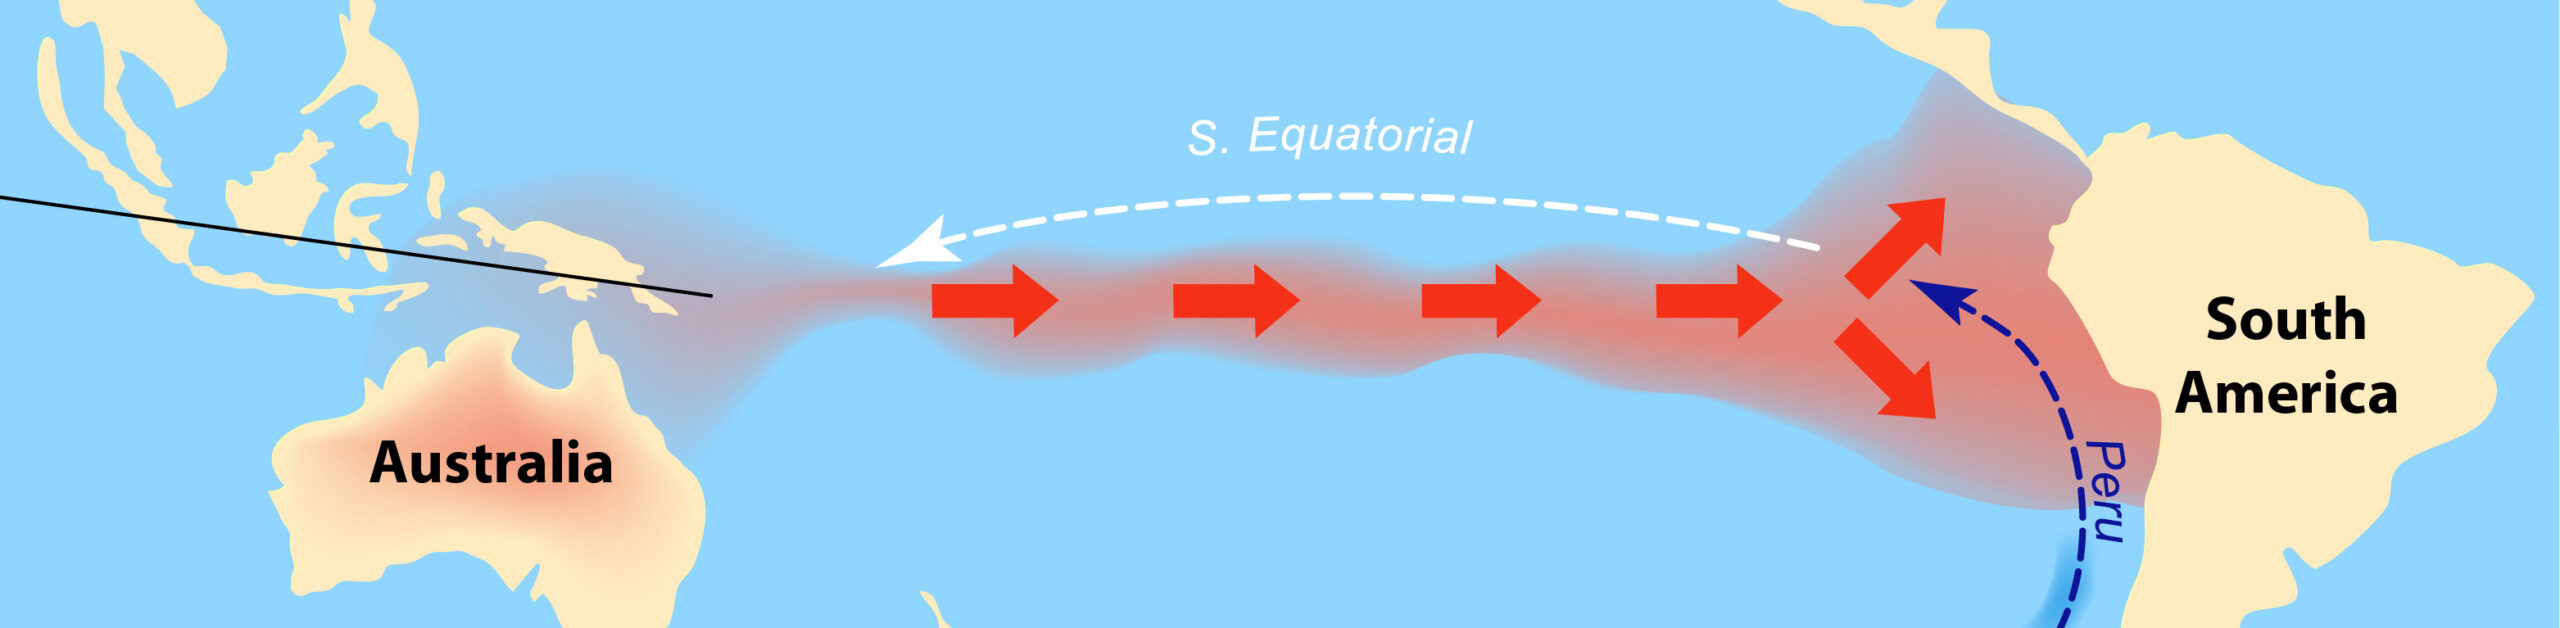
The World Meteorological Organization predicts that a ‘super El Niño’ is building. This has been nicknamed ‘Godzilla’. If forecasts are correct, this will be the most extreme El Niño in 1000 years.
El Niño is a natural phenomenon. It occurs when the surface temperatures in the central and eastern tropical Pacific Ocean warm and cause the trade winds that typically blow from east to west across the Pacific Ocean to weaken or even reverse direction. As well as increasing global temperatures and causing intense heatwaves, it can result in droughts in some parts of the world, such as eastern Australia, south-east Asia and southern Africa, and intense rain and flooding in parts of South America, eastern Africa and south-western North America.
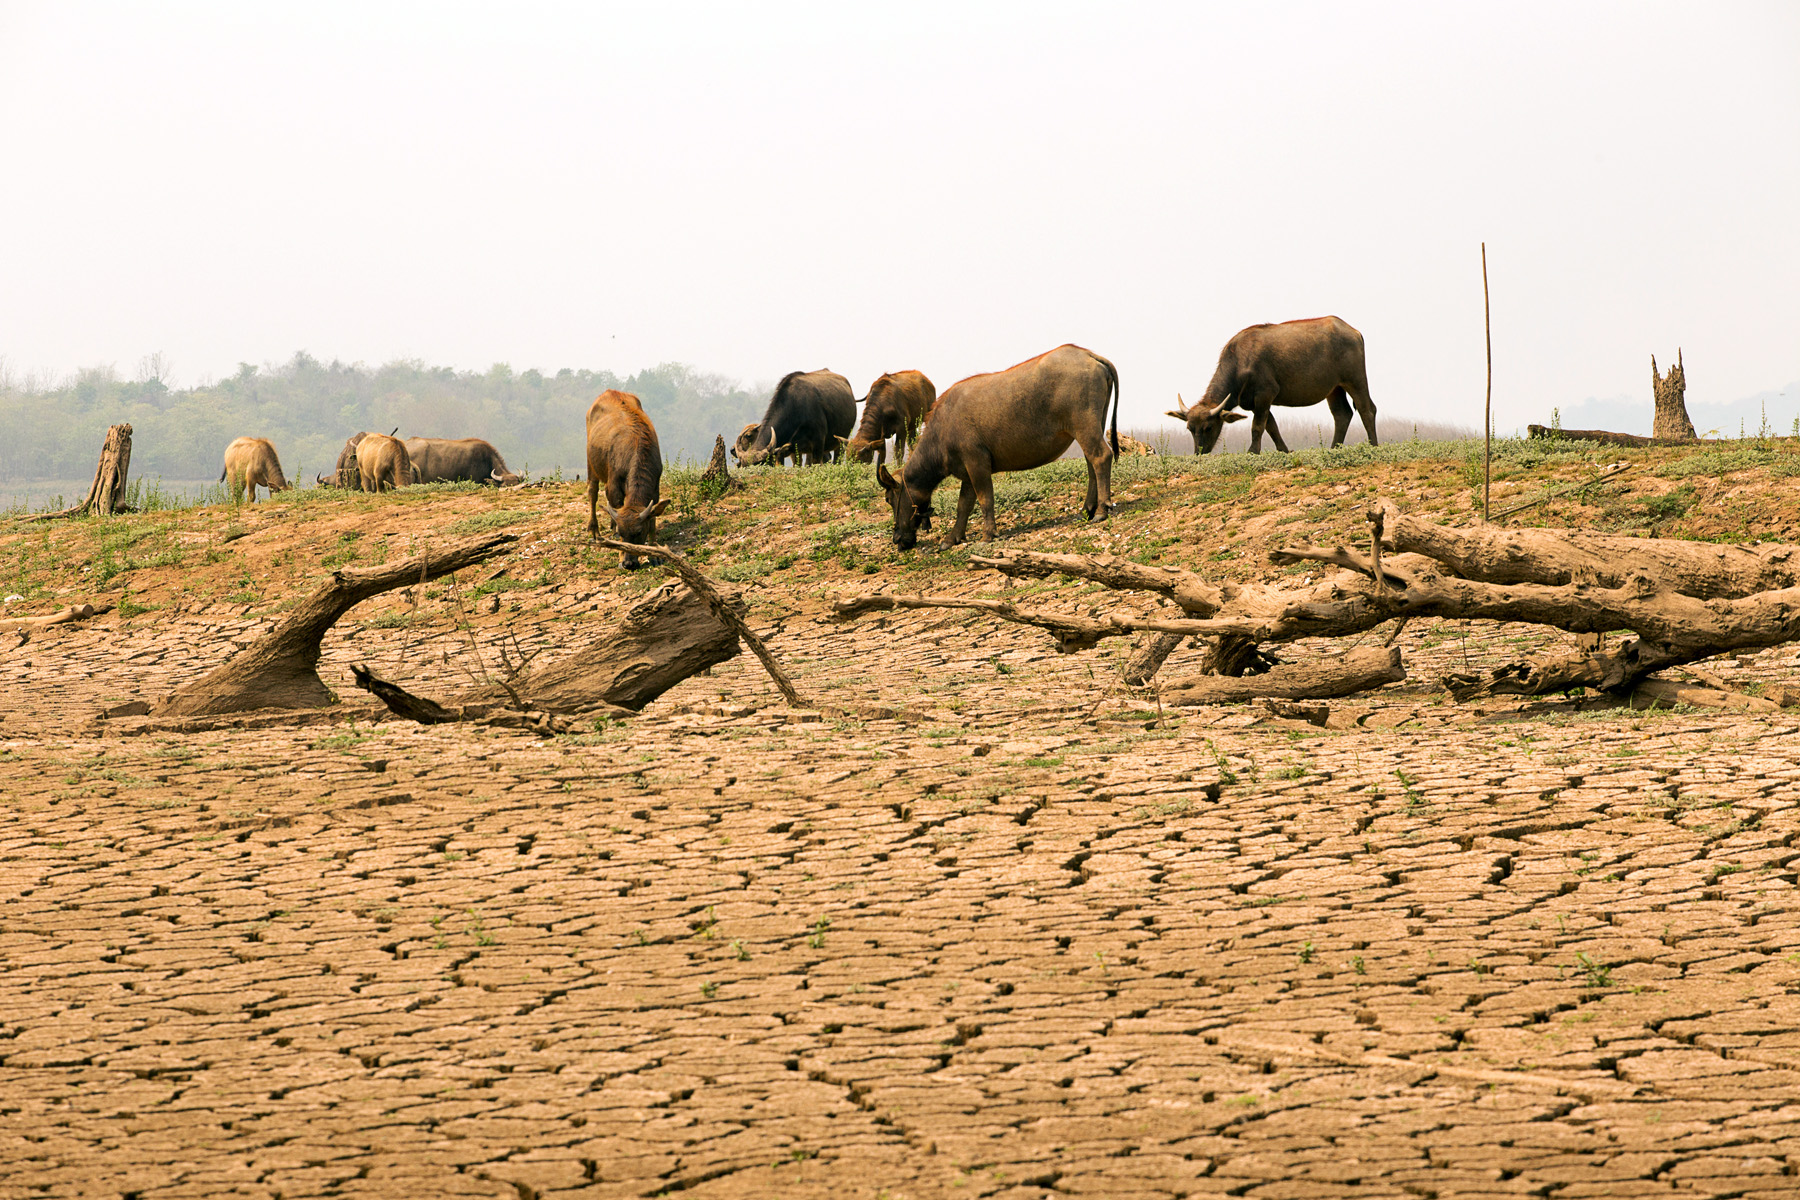
Typically, in an El-Niño event, the surface temperature of the central-eastern equatorial Pacific Ocean rises by 1°C to 1.5°C above the average. In the current El Niño, it is forecast to rise by up to 4°C by the end of 2026 and into 2027. It is already between 2.2°C and 2.6°C above the average. The effects could be catastrophic and hence the term ‘Godzilla’.
Although El Niño is a natural phenomenon, its severity is a direct result of climate change. This in turn is a direct result of economic decisions, and the effects will have severe economic consequences.
The economic causes
Climate change is an external cost of private economic decisions. When people or organisations burn fossil fuels, the climate costs of the CO2 emissions are not borne by the emitter. They are an external cost. This is illustrated in the diagram below, which shows the costs and benefits of electricity production from fossil fuels. (Click here for a PowerPoint.)
In this example, to make things simple, we assume that the external climate costs begin with the first unit of electricity generated and increase at a constant rate. The marginal social cost (MSC) of electricity generation equals the marginal private costs (MPC) to the generating company plus the marginal external cost in production MECP.
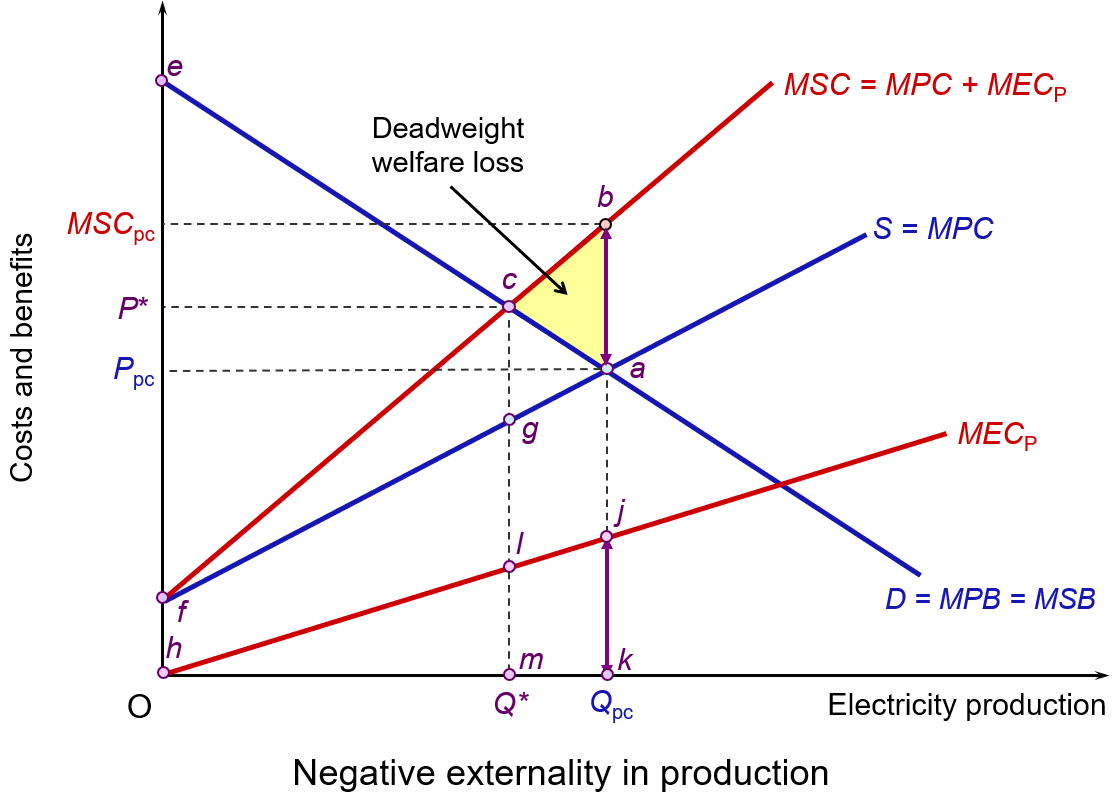 As you can see, the MSC curve is above the MPC curve. The vertical distance between them is equal to the MECP. It is also assumed that there are no externalities in consumption, which means that the marginal social benefit (MSB) curve is the same as the marginal private benefit (MPB) curve.
Competitive market forces, with producers and consumers responding only to private costs and benefits, will result in a market equilibrium at point a: i.e. where demand equals supply. The market equilibrium price is Ppc, while the market equilibrium quantity is Qpc. At Ppc, with no externalities on the consumption side, MPB is equal to MSB. The market price reflects both the private and social benefits from the last unit consumed. However, the presence of external costs in production means that MSC > MPC.
The socially optimal output would be Q*, where P = MSB = MSC, achieved at the socially optimal price of P*. This is illustrated at point c and clearly shows how external costs of production in a perfectly competitive market result in overproduction: i.e. Qpc > Q*. From society’s point of view, too much electricity is being produced from fossil fuels.
Total social surplus equals consumer surplus plus producer surplus minus the external costs. At the market equilibrium (Qpc) this is areas eaPpc+ Ppcaf – fba (or hjk, as it is the same size). At the socially optimal level of output (Q*) total social surplus is areas ecP* + P*cgf – fcg (or hlm).
Although consumer-plus-producer surplus is higher at the market equilibrium (Qpc) than at the socially optimum output (Q*) by the area cag, the external costs are higher still by the area cbag (or ljkm). Therefore, total social surplus at the market equilibrium is smaller than at the socially optimal point by area abc. This is a deadweight welfare loss and represents the excess of social costs over social benefits at all outputs above Q*. Put another way, moving from Qpc to Q* would represent a gain in social surplus of the area abc, as the fall in external costs outweighs the fall in consumer-plus-producer surplus.
One of the reasons why external environmental costs cause problems in a free-market economy is that no one has legal ownership of the atmosphere. Therefore, nobody has the ability either to prevent or to charge for their use as a ‘dumping ground’ for CO2. Such a ‘market’ is missing. Control must, therefore, be left to the government, international organisations, local authorities or regulators.
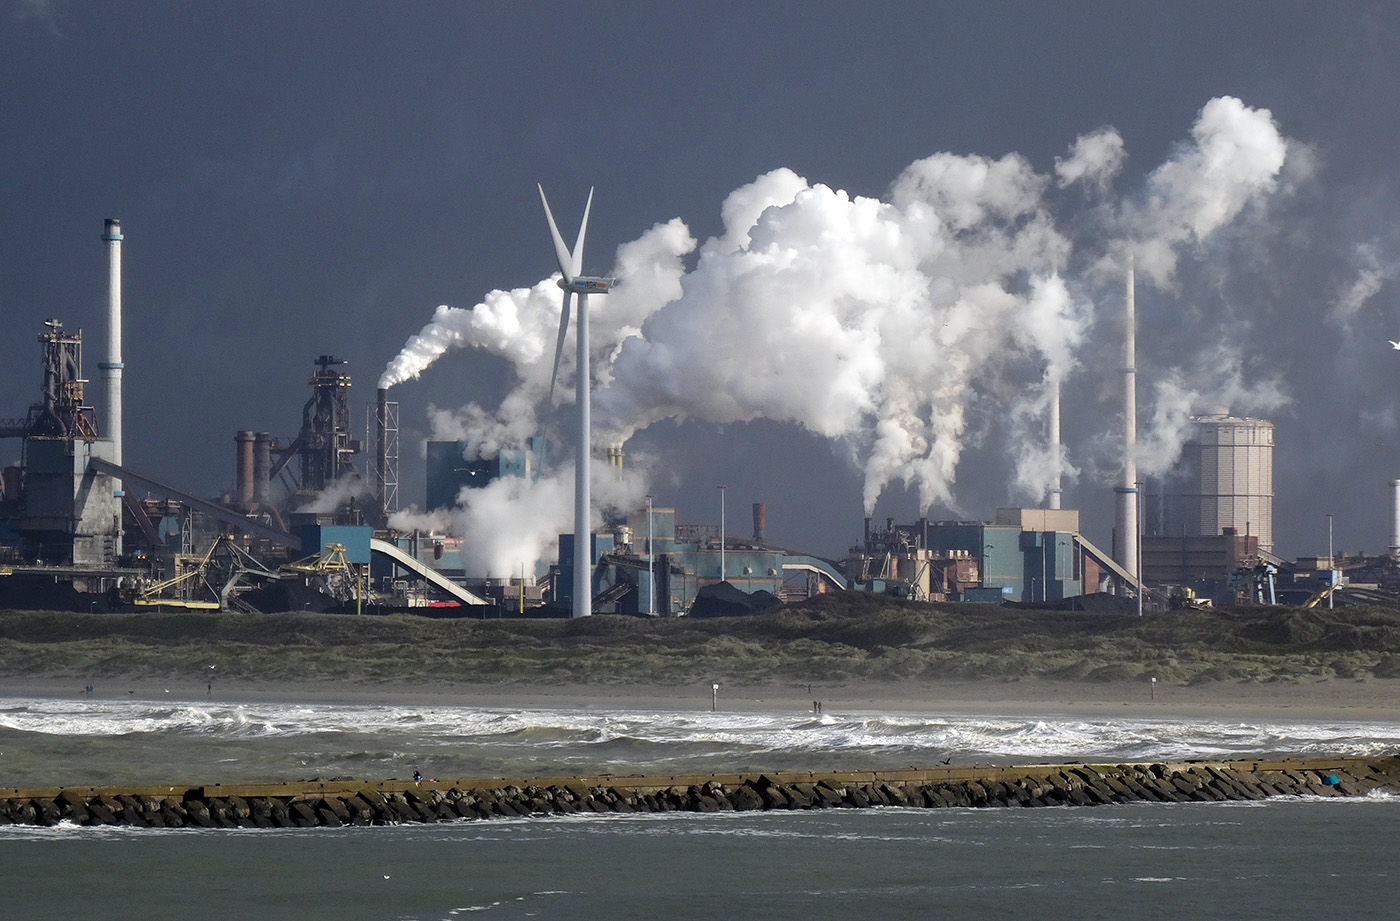 But such control is often too little. For example, when President Trump came to office in January 2025, he announced that the USA would withdraw from the UN’s Paris Agreement on climate change and that his policy towards oil production would be to ‘drill, baby, drill’. Indeed, governments globally spend hundreds of billions of dollars a year in subsidising oil, gas and coal production and its use, partly from pressure from the fossil fuel industry and partly to reduce the cost of living for consumers. This embeds fossil fuel dependence.
Game theory can help to explain the slow process of carbon reduction. For an individual country, such as the USA, it might argue that its optimum solution would be for other countries to cut their emissions, while maintaining its own levels. This approach would yield most of the benefits to the USA and none of the costs. However, when all countries argue like this, no progress is made. It’s a prisoners’ dilemma. Only if countries believe that the other countries will (a) ratify an agreement to cut emissions and (b) stick to the approved terms, is the agreement likely to succeed. This requires trust on all sides as well as the ability to monitor the outcomes.
Another major problem area concerns equity. Most countries will feel that they are being asked to do too much and that others are being asked to do too little. High-income countries will want to adopt a grandfathering approach. The starting point with this approach would be current levels of pollution. Every country would then be required to make the same percentage cut. Low-income countries, on the other hand, will want the bulk of the cuts, if not all of them, to be made by the rich countries. After all, the rich countries produce much higher levels of pollutants per capita than do the poor countries, and curbing growth in low-income countries would have a far more serious impact on levels of absolute poverty.
But will a supersized El Niño persuade countries to make deeper cuts in carbon emissions? In recent months commitments to achieving net zero emissions have waned. But the following economic consequences may encourage some countries to make deeper emissions cuts.
Economic consequences of a Godzilla El Niño
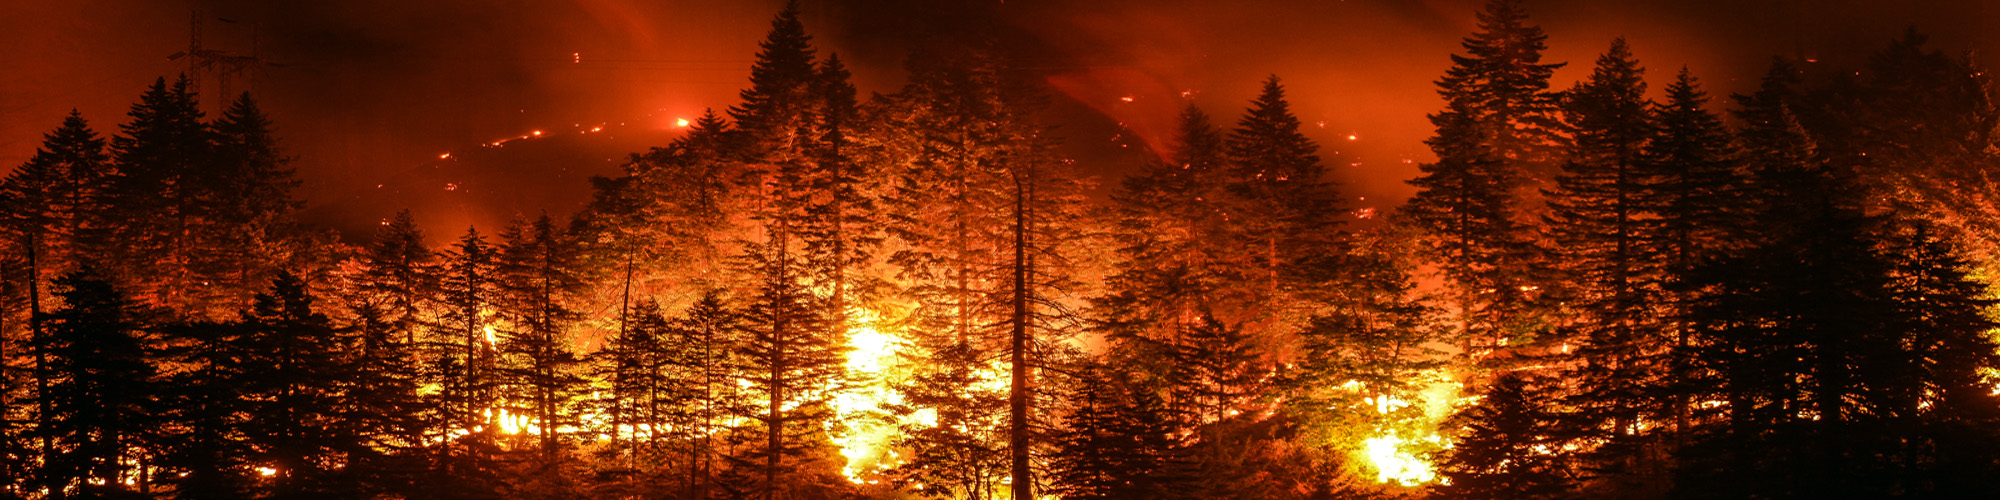
Extreme droughts, heat, wildfires and harvest failures in some areas and extreme rainfall and flooding in others will have severe economic consequences, often for the poorest people. There will be reductions in crop yields and loss of livelihood. Food prices will rise globally. This will add to the inflationary pressures from higher oil prices caused by the Iran war.
Droughts and wildfires in south-east Asia and Australia could have disastrous effects on harvests of palm oil, coffee, cocoa, rice, maize, wheat and various tropical fruits. Droughts and heat reduce output from hydropower and possibly wind energy, and industrial production may slow as a result of extreme heat in workplaces.
In Europe, warmer winters and unusually wet springs promote rapid plant growth. When this is followed by summer heatwaves, the undergrowth dries out and provides fuel for the wildfires. A super El Niño will amplify this. France and Spain have experienced massive wildfires these past few months. In the UK, the 2026 summer has been the hottest on record. The costs in Europe of the heat and wildfires in terms of lost crops and animals have been immense.
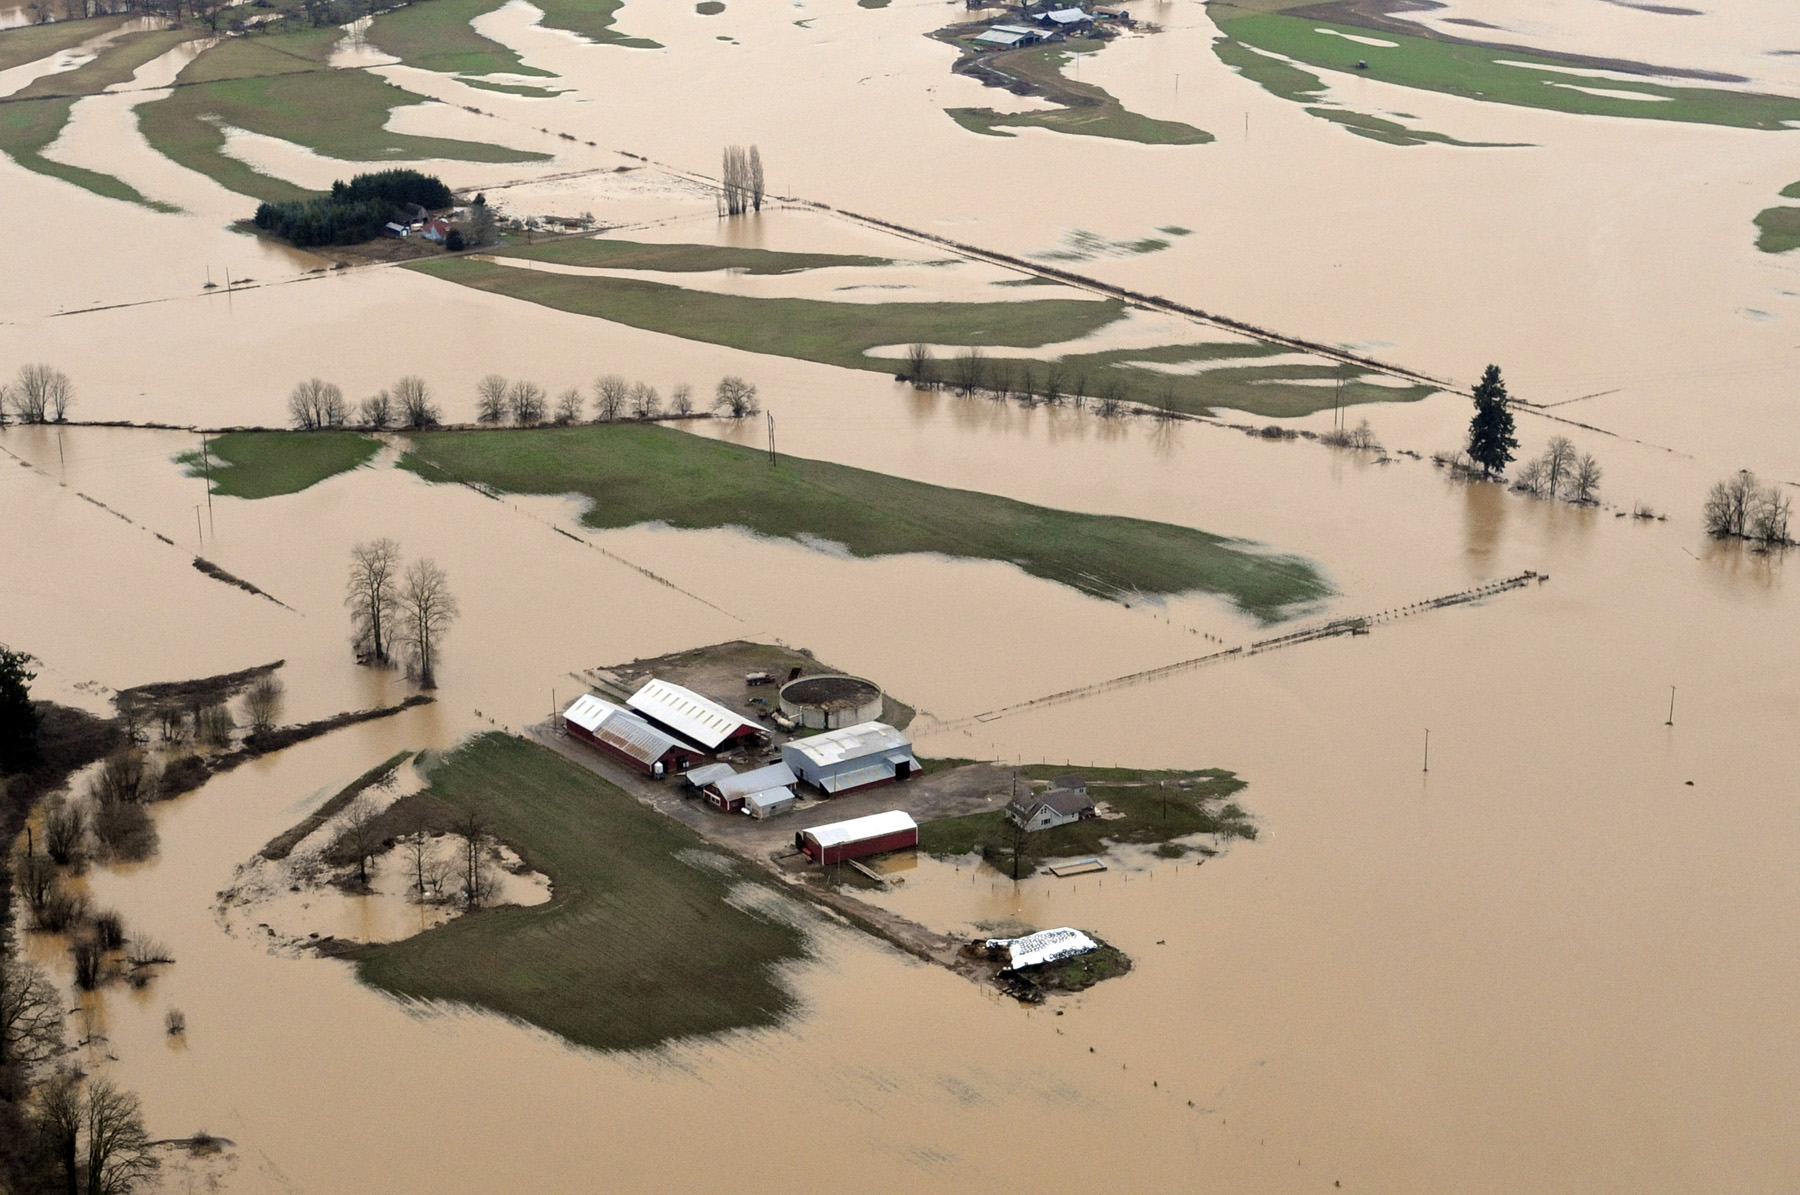 Floods and storms damage roads, power grids, railways and buildings. This forces governments to spend money on repairs instead of long-term investments. People are displaced and many are likely to lose their lives.
Fortunately, El Niños fade after a few months to be replaced by the cooler La Niña. The problem is that, with global warming, the next El Niño in a few years could be even more extreme with even more serious economic consequences.
The hope is that governments wake up to the pressing need to reduce carbon emissions.
Videos and podcast
Information
Articles
- Building climate-resilient agriculture in Europe: an economic perspective
European Environment Agency (17/3/26)
- What Super El Niño Means For Business Supply Chains And The Economy
Forbes, Chloe Demrovsky (25/8/26)
- A summer of extremes: Weathering a hotter world
CBS News, Jonathan Vigliotti (16/8/26)
- Area in Europe affected by wildfires could triple due to climate change
The National (UAE), Tariq Tahir (20/8/26)
- El Niño could drag down the global economy by almost $1 trillion or at least $7 trillion—and the choice is ours
Peterson Institute for International Economics, Cullen S Hendrix (26/7/26)
- UN warns of ‘supersized’ El Niño as countries prepare for impact
BBC News, Esme Stallard, Mark Poynting, Becky Dale, Yvette Tan, Tiffanie Turnbull and Nikita Yadav (3/9/26)
- Toxic haze from wildfires spreads across South East Asia as ‘super’ El Niño intensifies
BBC News (2/9/26)
- A Super El Niño is coming: 5 hard‑won lessons the world can learn from Africa
The Conversation, Tafadzwanashe Mabhaudhi and Mendy Ndlovu (5/7/26)
- ‘Supersizing before our eyes’: UN warns of record El Niño approaching
The Guardian, Damian Carrington (3/9/26)
- ‘Super’ El Niño could cause global food price shock lasting into 2028, analysts say
The Guardian, Richard Partington (12/7/26)
- Without action wildfires in Europe will increase 39% even in best-case climate scenario, study finds
The Guardian, Ajit Niranjan (20/8/26)
- From classrooms to climate action: ICSE 2026 charts new path for sustainability
Economic Times (Times of India) (2/9/26)
Questions
- What is the current state of progress towards meeting the goals of the UN Paris Climate Agreement?
- Are there any externalities in consumption that affect global warming?
- How might technological progress make it privately profitable to reduce carbon emissions?
- How might global supply chains and shipping be affected by a super El Niño?
- What role can education play in tackling climate change and its effects?
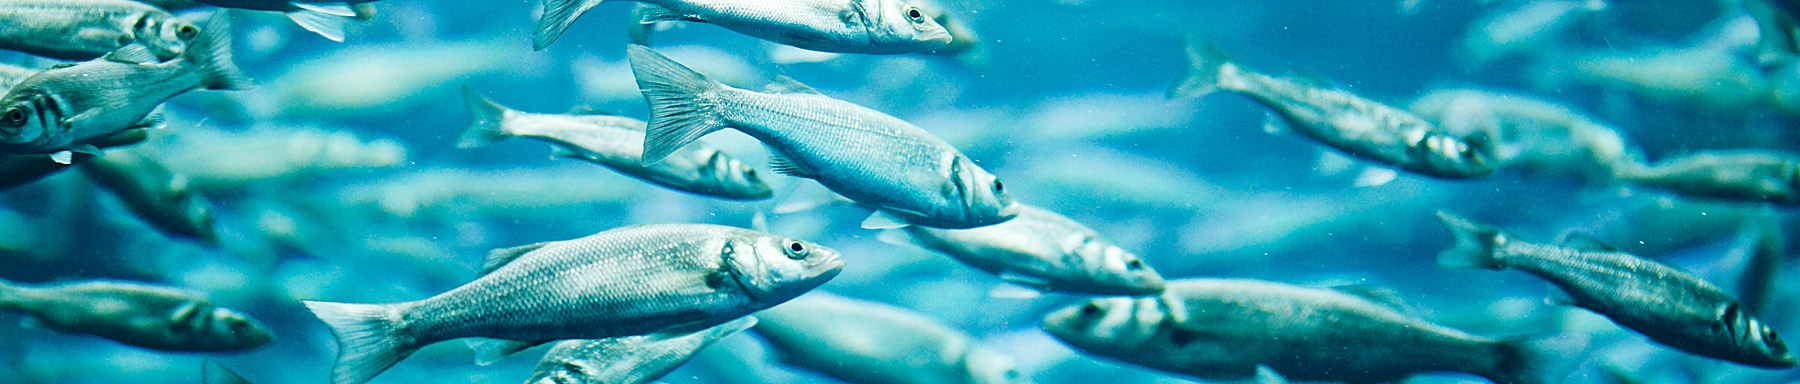
The prices of many species of fish have risen in recent months. Coastal pelagic fish, such as mackerel, herring and sardines have risen especially rapidly. Mackerel, once seen as a cheap source of protein, is no longer quite such a ‘bargain’.
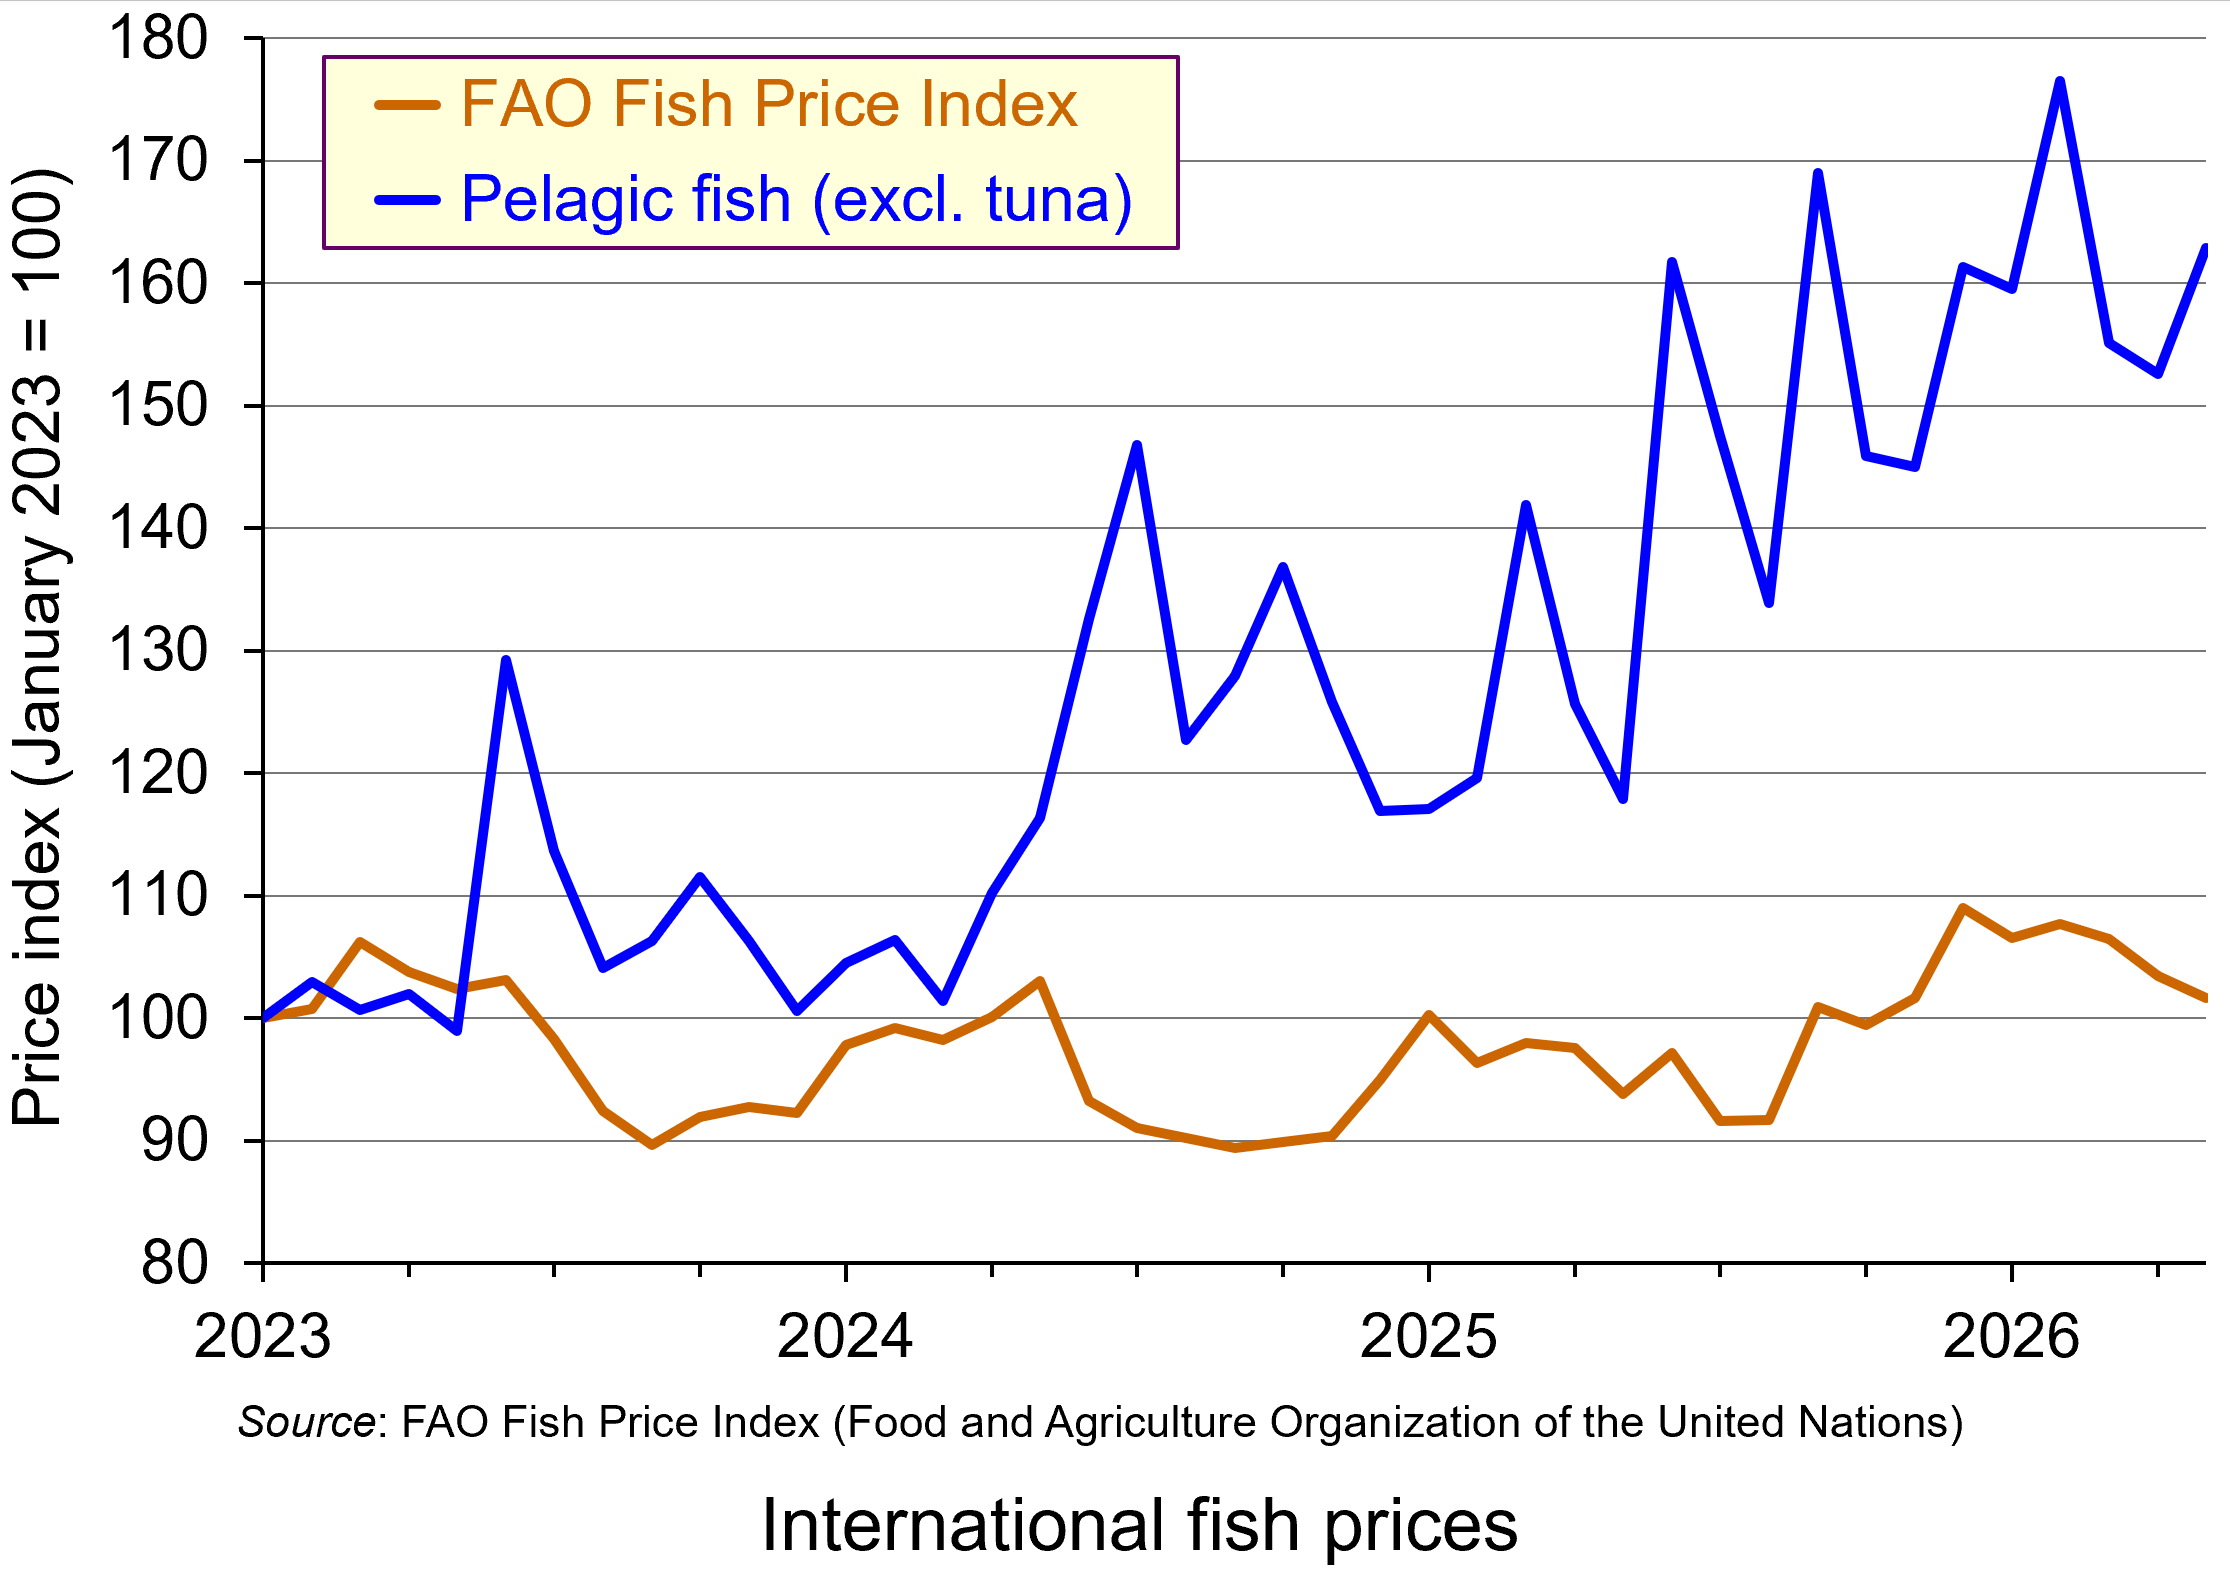 From January 2023 to May 2026, the international price index of pelagic fish rose by 69%. In 2025, UK supermarket fresh, chilled smoked and tinned mackerel prices rose by an average of 25%; and over the first part of 2026, some tinned mackerel product lines have increased by as much 55%. In February 2026, Waitrose announced that it would suspend sales of fresh and chilled mackerel and tinned mackerel once current stocks had been cleared. It cited overfishing and sustainability concerns.
Supply and demand
But why have mackerel prices risen so much? The price of fish is determined by demand and supply. So what has changed? The main changes have been on the supply side.
Supply. Most of the world’s supply of mackerel comes from the Northeast Atlantic. These waters have been overfished for many years, thereby depleting the stock of the fish and reducing the amount of mackerel caught.
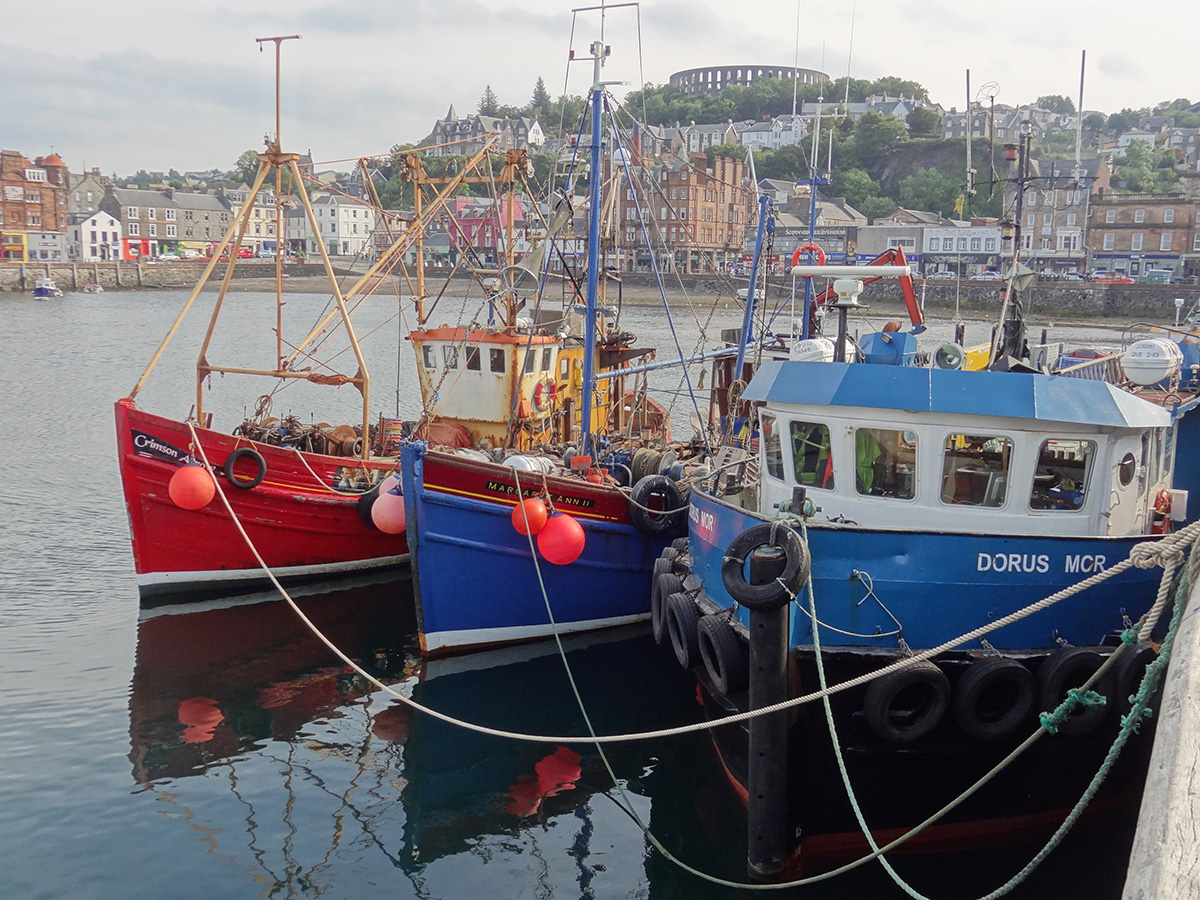 To arrest the decline and allow stocks to rebuild, the International Council for the Exploration of the Sea (ICES) recommended a quota of 174,357 tonnes for 2026. This would represent a 70% cut from 2025. The main fishing countries – Norway, the UK, the Faroe Islands and Iceland – eventually agreed to a quota of 299,010 tonnes: a cut of 48%. After a series of bilateral agreements between the four countries over access to each other’s waters, this resulted in the following quota shares: UK 30.55%, Norway 26.4%, Faroes 12% and Iceland 10.5%. The remaining 20.55% would be for the EU, Greenland and Russia.
Despite these other countries not being part of the deal, in May 2026 the EU agreed to reduce its catch by 48% too. Russia, however, set its own quota of 67,548 tonnes, which is 22.6% of the total 299,010 quota, above the 20.55% set aside for the EU, Russia and Greenland combined and almost almost five times Russia’s historic quota share! The UK, EU and Iceland responded by agreeing to bar Russian vessels carrying mackerel from entering their ports.
The quotas have added to the decline in supply, even though the aim is to increase supply in the future as stocks are rebuilt. In May this year, the Norwegian catch was down nearly 85% – well below the 48% reduction in the quota.
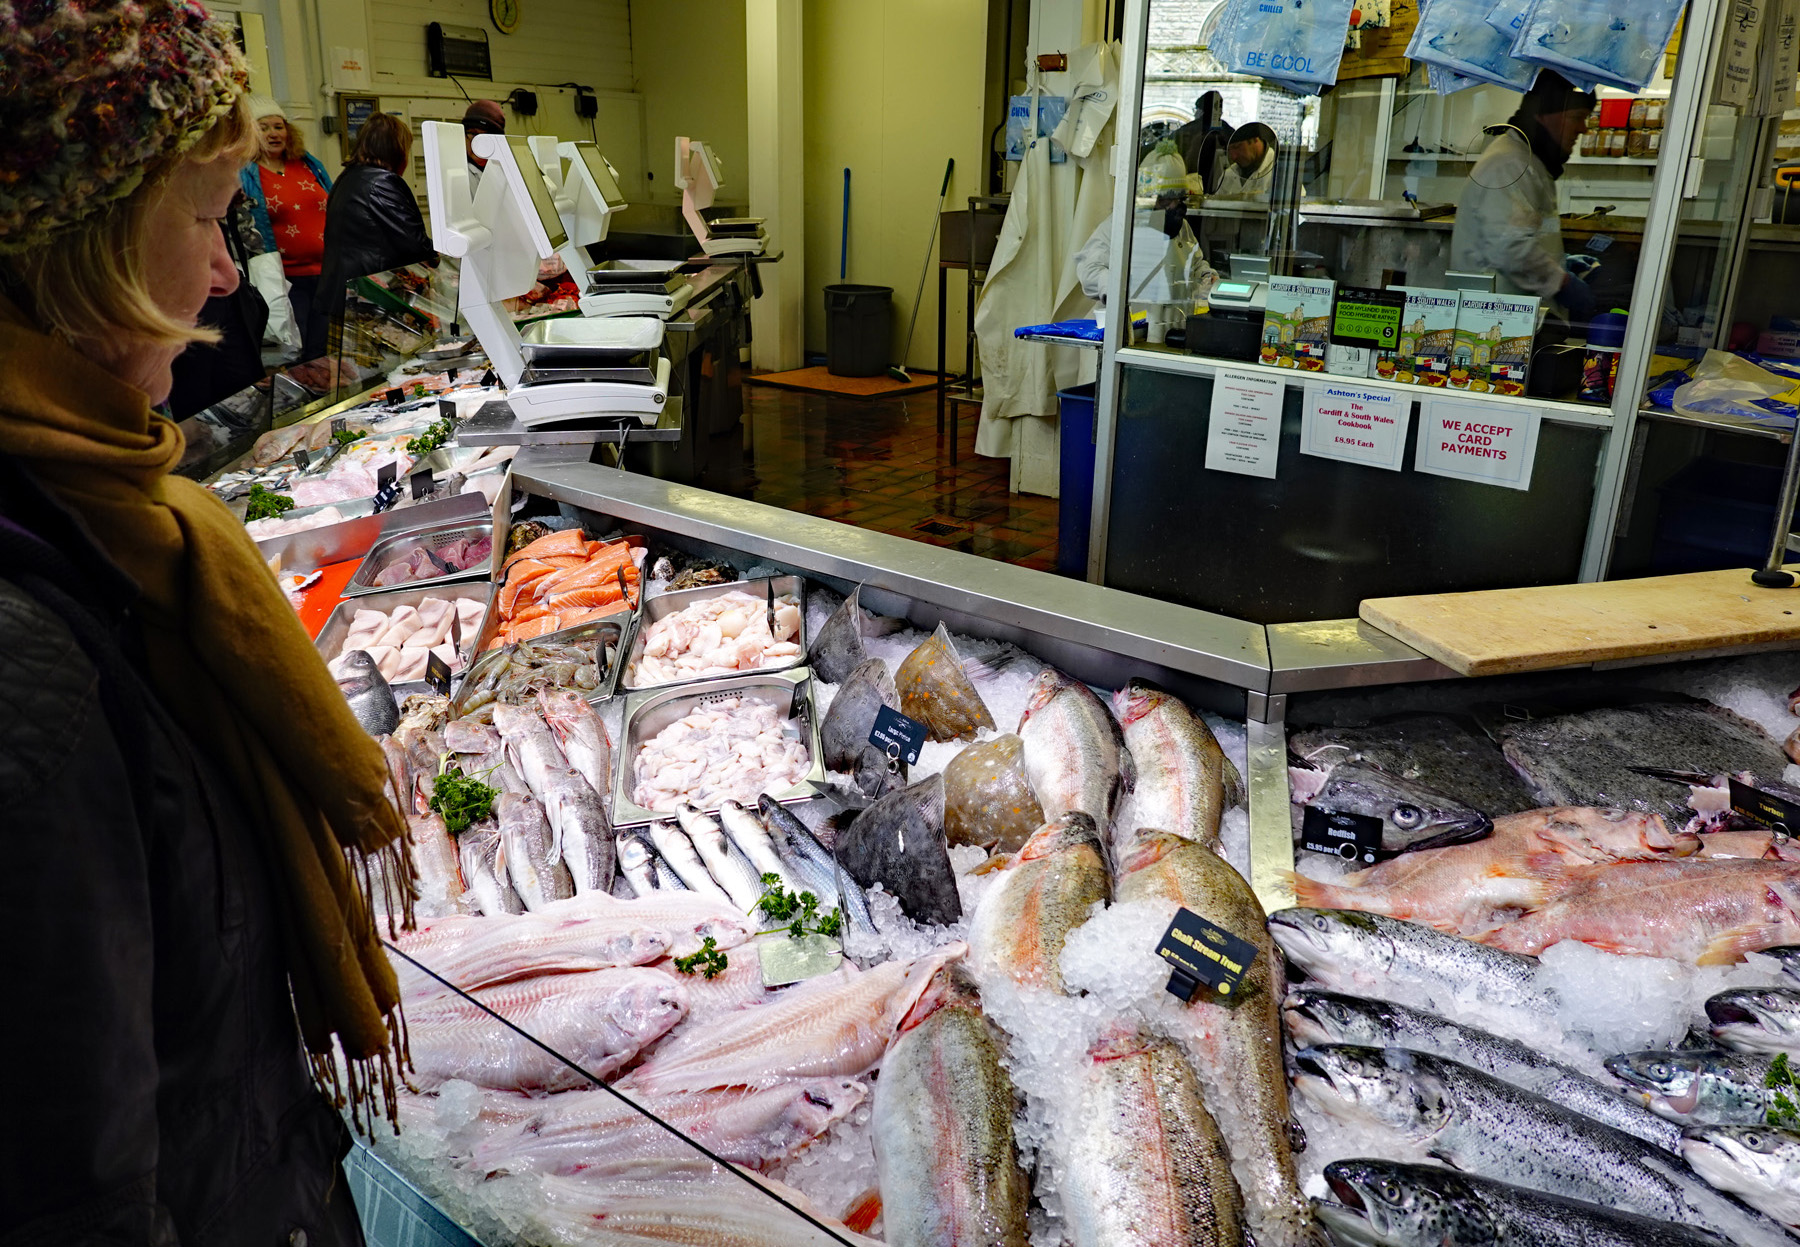 Demand. Despite higher prices, demand has remained strong. Part of the reason is that demand is relatively inelastic. This is because, despite its increase in price, mackerel remains a relatively cheap fish and thus there is little option to switch to cheaper alternative fish. Indeed, with other fish going up in price, and meat too, some people may even switch to mackerel.
Another reason for strong demand is the growing market outside Europe, especially in southeast Asia, China, South Korea and Japan. In some of these countries, mackerel is seen as a luxury fish and people are prepared to pay higher prices, making demand relatively inelastic but at the other end of the market. In 2025, imports of frozen whole mackerel into the region rose by nearly 9%, despite rising prices.
However, Norwegian exports to the region have been falling, reflecting lower quotas in 2025 and lower still in 2026. This has further exacerbated the rise in price and intensified competition between Asian importers. For example, in July 2026, Korea sent a ‘mackerel envoy’ to Norway and other major exporters to seek to secure additional supplies.
The future
With supply restricted by declining stocks and tighter quotas, and with a price inelastic and growing demand, the high prices of mackerel in all forms look set to last – at least until stocks rebuild and quotas can be relaxed. But, with total quotas well above the level suggested by the ICES, rebuilding could take a long time.
Articles
- Norwegian Mackerel Prices Drive Record Pelagic Values in 2025
The Fishing Daily, Oliver McBride (25/5/26)
- Mackerel prices soar as demand and supply pressures take hold
The Grocer, Charles Elliman (23/1/26)
- Mackerel Prices Have Broken Historical Highs And May See Another Surge in 2026
Caharbor Import and Export Co., Ltd, China (12/1/26)
- Waitrose to suspend mackerel sales due to overfishing concerns
BBC News, Emer Moreau (27/2/26)
- Holy mackerel! The fish Waitrose removed from its shelves
Epigram (University of Bristol student newspaper), Grace Golby (6/6/26)
- Four Northeast Atlantic coastal parties agree on 2026 mackerel quotas, shares; EU left out again
SeafoodSource, Regin Winther Poulsen (17/12/25)
- EU Raises Mackerel Quotas despite Scientific Overfishing Warnings
The Fishing Daily, Oliver McBride (30/3/26)
- High Mackerel Prices Reshape Asian Small Pelagic Trade
The Fishing Daily, Oliver McBride (2/6/26)
- Korea dispatches ‘mackerel envoy’ to Norway as prices spike
Korea JoongAng Daily, Ahn Hyo-Seong (6/7/26)
- Norwegian Mackerel Supply Plunges, Korean Catch Regains Price Edge
Seoul Economic Daily, Nam Yoon-jung (28/6/26)
- Geopolitical unrest, currency effects and quota cuts led to a decline in the value of Norwegian seafood exports in the first half of the year
Norwegian Seafood Council, Press Release (3/7/26)
- Norwegian Seafood Exports: Frozen Mackerel and Herring Prices Surge in Week 26 of 2026
IndexBox (1/7/26)
- New sanctions on Russia following huge unilateral increase in mackerel quota
Fishing News, Steve Mackinson (9/7/26)
Data
Questions
- Draw a supply and demand diagram to illustrate what has happened to mackerel prices.
- What is the effective price elasticity of supply of mackerel?
- Why is demand for mackerel relatively price inelastic in the UK, except when prices rise above a certain level?
- Why is demand for mackerel relatively price inelastic in certain Asian countries, such as Japan and South Korea?
- In which country is demand for mackerel likely to be more income elastic: the UK or Japan?
- Under what circumstances might the price of mackerel in five years’ time be (a) higher than now; (b) lower than now? What will determine which is more likely?
- Should other supermarkets follow Waitrose’s lead in stopping the sale of mackerel?
- What is the ‘tragedy of the commons’? Why is a common resource such as fish in the open seas likely to result in the tragedy?
 This Christmas, more people are considering giving second-hand (or ‘pre-loved’) goods as presents. This allows them to afford better-quality presents and to save money at a time when a large proportion of the population are finding that their finances are stretched. This continues a trend towards buying second-hand products – a trend driven by the rise of various online retailers, such as Vinted and Preloved, and a growing online presence of charity shops, as well as extensive use of established platforms, such as Facebook Marketplace, eBay, Depop, Gumtree and Nextdoor.
Clearly, people gain from buying and selling second-hand items – part of the ‘circular economy’. But what are the implications for gross domestic product (GDP)? After all, GDP is one of the main indicators of the size of an economy, and growth in GDP is probably the most widely-used measure of economic progress. Are second-hand transactions captured in GDP?
If you directly sell your own second-hand items, this does not count towards GDP. There is no new product being made. The items are only counted when they are first produced. Any service you provide to the purchaser (and to yourself) is in a similar category to housework, childcare, DIY and other services that people provide to themselves, household members and friends. But like such services, there is a strong argument that they should be.
 Likewise, the environmental benefits (positive externalities) of recycling products, rather than throwing them away or hoarding them, are not counted. In fact, if reusing products causes fewer new products to be made, this would be counted as subtracting from GDP.
If, however, you set up a business by buying and selling second-hand items, the service you provide would contribute towards GDP. What would be counted would the value added to the product – captured through the difference in the purchase and selling prices. In fact, HMRC has warned people that buying and selling second-hand items is taxable, as it counts as self-employment for tax purposes. But it is only this value added that counts. If you buy an item on Vinted, only the value added by Vinted counts towards GDP.
As no production takes place, the purchase of second-hand items adds either nothing to GDP or just the service of a retailer. It is effectively just a transfer of goods and money. If buying second-hand items means that you buy fewer new ones, then that would cause GDP to fall if the response of firms is to produce fewer newer items. However, the person selling the second-hand items will gain revenue, which could be used to buy new items. If that increased production, that would boost GDP. The net effect on GDP of this transfer of goods and money in the second-hand market will be pretty small.
Yet, clearly, the second-hand market provides a welfare gain to both sellers and purchasers – a gain that is likely to grow as the use of second-hand markets increases. At Christmas time, it provides a timely warning of the limitations of using GDP to measure wellbeing.
Articles
- Giving toys another life with another child
Westmorland & Furness Council, News (18/11/25)
- ‘I make £1,000 a week with charity shop side hustle – I couldn’t afford Christmas without it’
Manchester Evening News, Lee Grimsditch and Hannah Cottrell (3/12/25)
- HMRC issues warning to anyone with money-making ‘side hustle’ ahead of Christmas
Manchester Evening News , Ryan Price (12/11/25)
- 12 tips for a low cost Christmas
Rest Less, Melanie Wright (14/11/25)
- I’ve saved over £100 on my girl’s Christmas gifts & got everything on her list including Disney dolls & Hey Dugee toys
The Sun, Becky Pemberton (25/11/25)
- Circular trade is growing, but will second-hand shopping be visible during the Christmas season?
Finnish Commerce Federation, Press Release (27/11/25)
- Shop secondhand, shred your veg and try ‘furoshiki’ wrapping: 14 easy ways to cut Christmas waste
The Guardian, Hannah Rochell (8/12/25)
- 13 Ways to Have a Sustainable Christmas This Year
Circular&Co., Adam Millett (1/12/23)
- The Role of Circular Economy in Driving Economic Growth: Evidence from EU Countries
Sage Open, Vladimir Radivojević, Tamara Rađenović and Jelena Dimovski (14/11/24)
- How to Have a Circular Economy Christmas: Deck the Halls, Sustainably
50 Shades Greener, Kiri Spanowicz (10/12/24)
- Twelve Economic Impacts of Christmas
City-REDI Blog, Birmingham University, Charlotte Hoole (22/12/16)
- Christmas 2025: Christmas Economics Explained
Plus500 (23/11/25)
Questions
- What other items or activities affecting human wellbeing are not counted in GDP?
- Name some goods and services that are produced, and hence are included in GDP, but which can be classed as ‘bads’.
- For what reasons might a country have a high GDP per capita but a poor average level of wellbeing?
- How might GDP figures be adjusted for international comparison purposes?
- Would it be possible to adjust GDP figures to take account of externalities in production (negative and positive)? If so, how?
- Production involves human costs. To what extent does GDP take this into account?
- What is meant by the circular economy? How might you have a ‘circular’ Christmas?
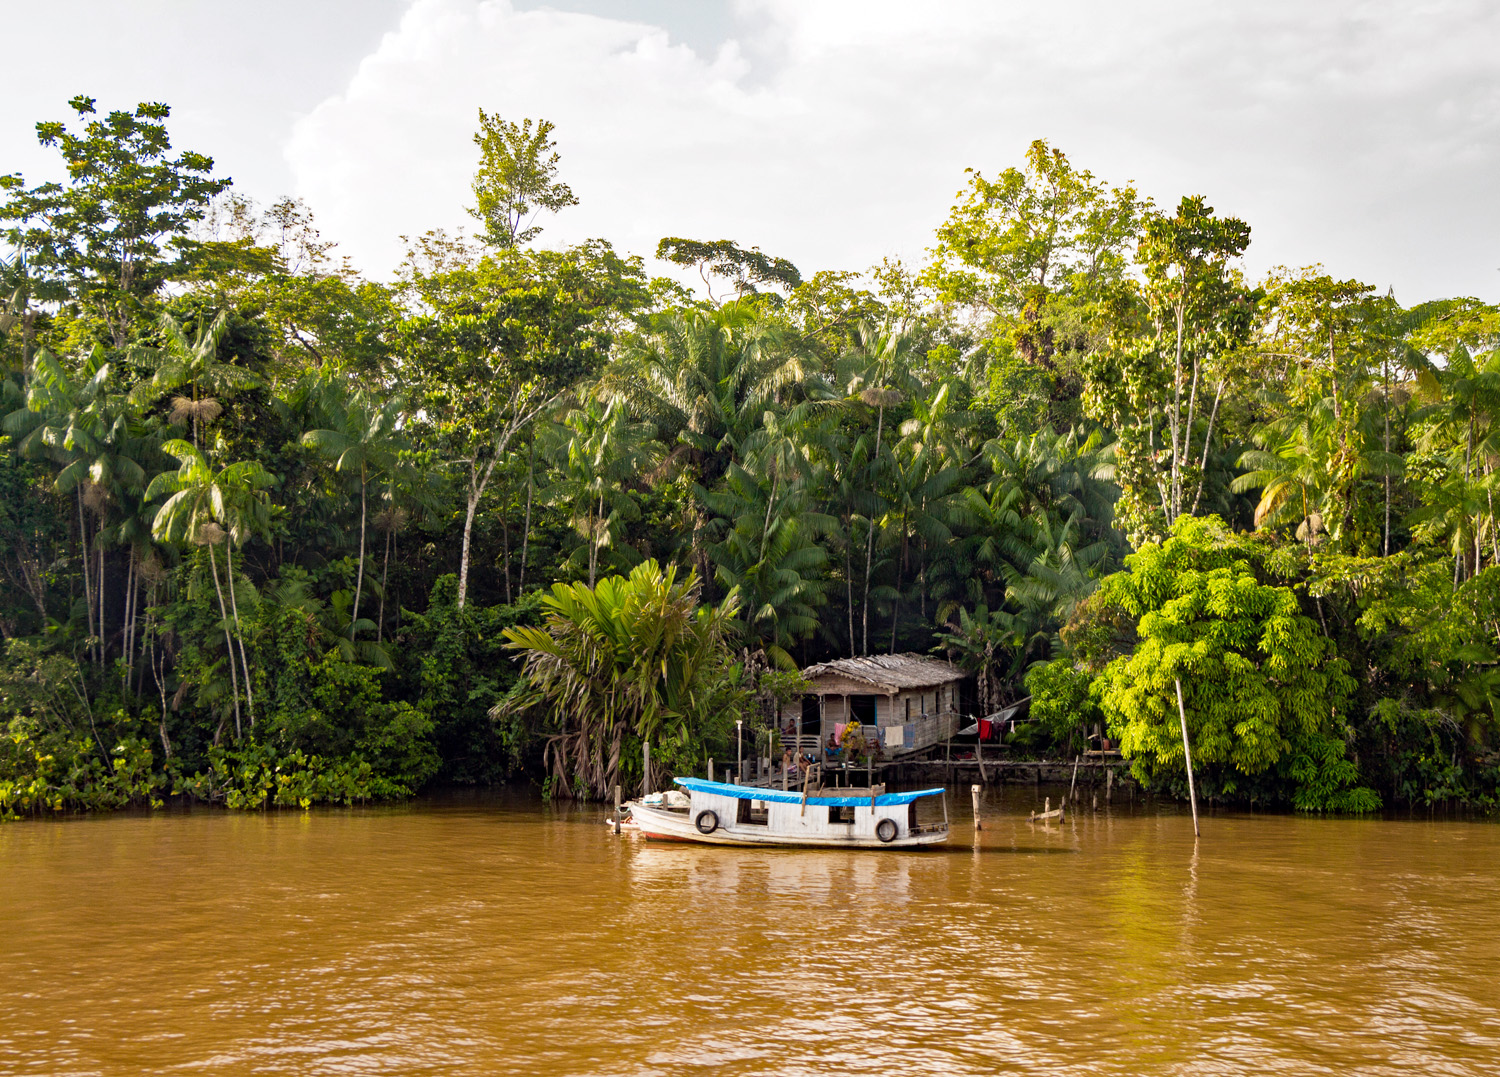 Every year, world leaders gather to find ways of limiting global warming. The latest of these ‘COP’ meetings, COP30, is in Belém, Brazil from 10 to 20 November 2025. COP stands for ‘Conference of the Parties’, the decision-making body of the United Nations Framework Convention on Climate Change (UNFCCC).
Perhaps the best-known of these meetings was in Paris in 2015. This resulted in the Paris Agreement. This is a legally-binding international treaty to limit global warming to well below 2°C and preferably to 1.5°C above pre-industrial levels. This would involve reducing greenhouse gas emissions and/or taking carbon absorbing measures. All UN countries except for Iran, Libya and Yemen are signatories to the agreement.
However, on coming to office in January 2025, President Trump announced that the USA will withdraw from the agreement in January 2026. Instead, he would prioritise fossil fuel production, under the mantra, ‘drill, baby, drill’. Previously he had claimed that global warming is a hoax concocted by China designed to undermine the competitive power of the USA.
Progress in reducing emissions and mitigating climate change
 Since 2020, each country has been required to submit its own emissions-reduction targets, known as ‘nationally determined contributions’ (NDCs), and the actions it will take to meet them. Every five years each country must submit a new NDC more ambitious than the last. New NDCs are due this year. As of 12 November, 112 of the 197 countries had submitted a new NDC (including the USA, China, the EU and the UK). These 112 countries account for around 71 per cent of global emissions.
Implementing all new NDCs would reduce global CO2 emissions by between 15 and 25 per cent from current levels by 2035. But this would merely reduce global warming to around 2.6°C above pre-industrial levels. Approximately 35 per cent emissions reductions by 2035 would be required to restrict global warming to 2°C and 55 per cent to restrict it to 1.5°C.
But implementing the Paris Agreement has still had a high degree of success. Without the action taken and being taken over the past 10 years, it is predicted that global temperatures by 2050 would rise by 3–3.5°C.
Rich countries are expected to provide finance to low-income countries. This is required to help such countries adopt green technologies and to adapt to the harmful effects of climate change (e.g. through irrigation schemes and flood defences). At COP29 in Azerbaijan, the ‘Baku Finance Goal’ was agreed. This is an agreement to provide climate finance of $1.3 trillion per year by 2035 to developing countries from all public and private sources.
The subsequent ‘Baku to Belém Roadmap’ provides a set of suggested actions for governments, financial institutions and the private sector to bridge the gap between current climate finance flows and the $1.3 trillion agreed to meet global climate goals. The roadmap is a central focus of the COP30 conference in Belém, with discussions between countries on how to translate the Baku finance goal into concrete, tangible actions and integrate it into formal decisions.
The role of Donald Trump
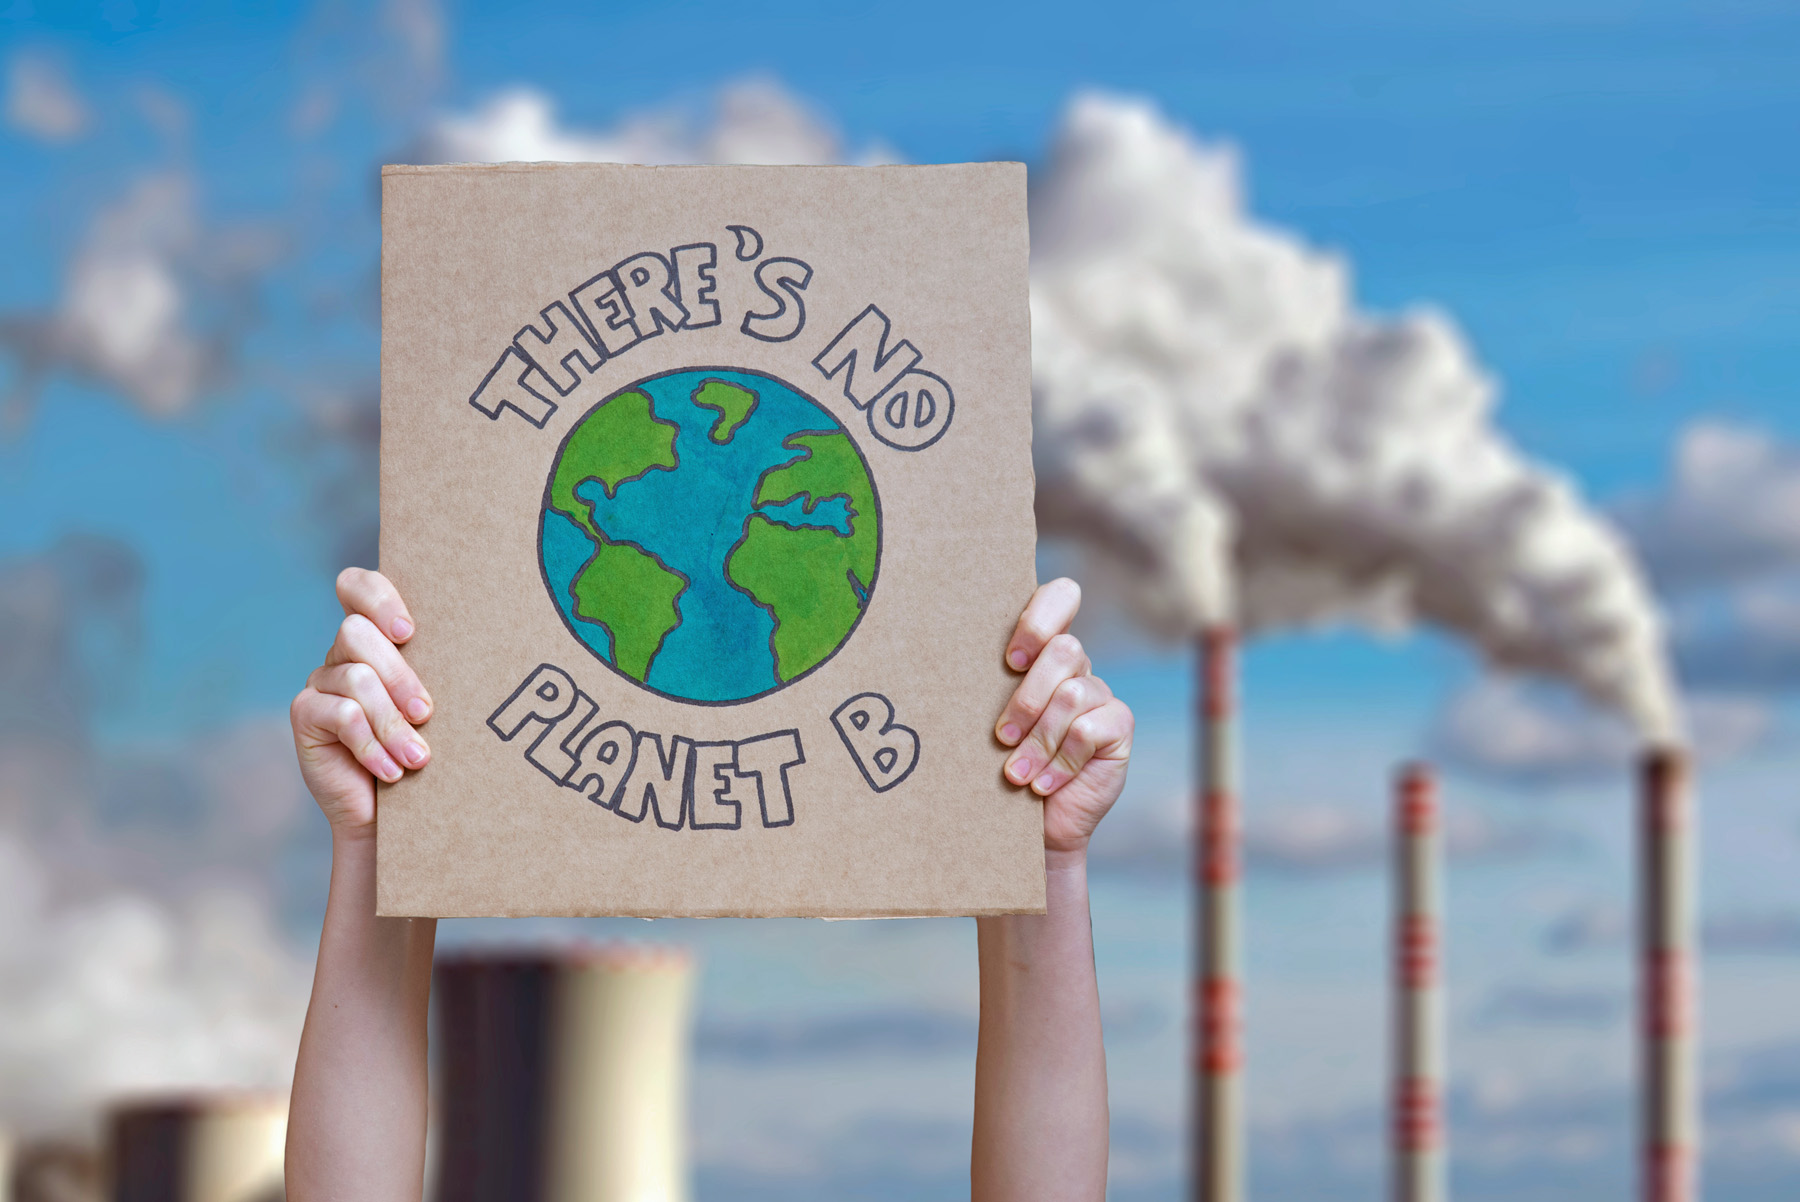 As well as announcing that the USA will withdraw from the Paris Agreement in January 2026, since coming to office in 2025, President Trump has given billions of dollars of tax cuts to fossil fuel firms and allowed drilling for oil and gas on federal lands. At the same time, he has described renewable energy as ‘a joke’ that will bankrupt countries and has slashed subsidies and tax breaks for solar and wind power, withdrawn permits for wind and solar farms, and cut funding for green energy research.
He wants the USA to be world leader in fossil fuel energy, calling on governments to buy US oil and gas, threatening some countries with tariffs if they do not. Already, Japan, South Korea and several European countries have agreed to buy huge quantities of US oil and liquefied natural gas (LNG). A worry is that other similarly inclined governments, such as Argentina, may roll back on their commitments to a green transition and instead boost their fossil fuel industries.
This gives added urgency to the Belém talks. It is crucial for the rest of the world to stick together in pushing ahead to combat global warming and in adopting and sticking to tough NDCs. It is also crucial for rich countries to support dlow-income countries in adopting climate-friendly investment and in measures to mitigate the effects of global warming.
The economics of climate change
 Climate change is directly caused by market failures. One of the most important of these is that the atmosphere is a common resource: it is not privately owned; it is a global ‘commons’. Individuals and firms use it at a zero price. If the price of any good or service to the user is zero, there is no incentive to economise on its use. Thus for the emitter there are no private costs of using the atmosphere in this way as a ‘dump’ for their emissions and, in a free market, no incentive to reduce the climate costs.
And yet when firms emit greenhouse gases into the atmosphere there are costs to other people. To the extent that they contribute to global warming, part of these costs will be borne by the residents of that country; but a large part will be borne by inhabitants of other countries.
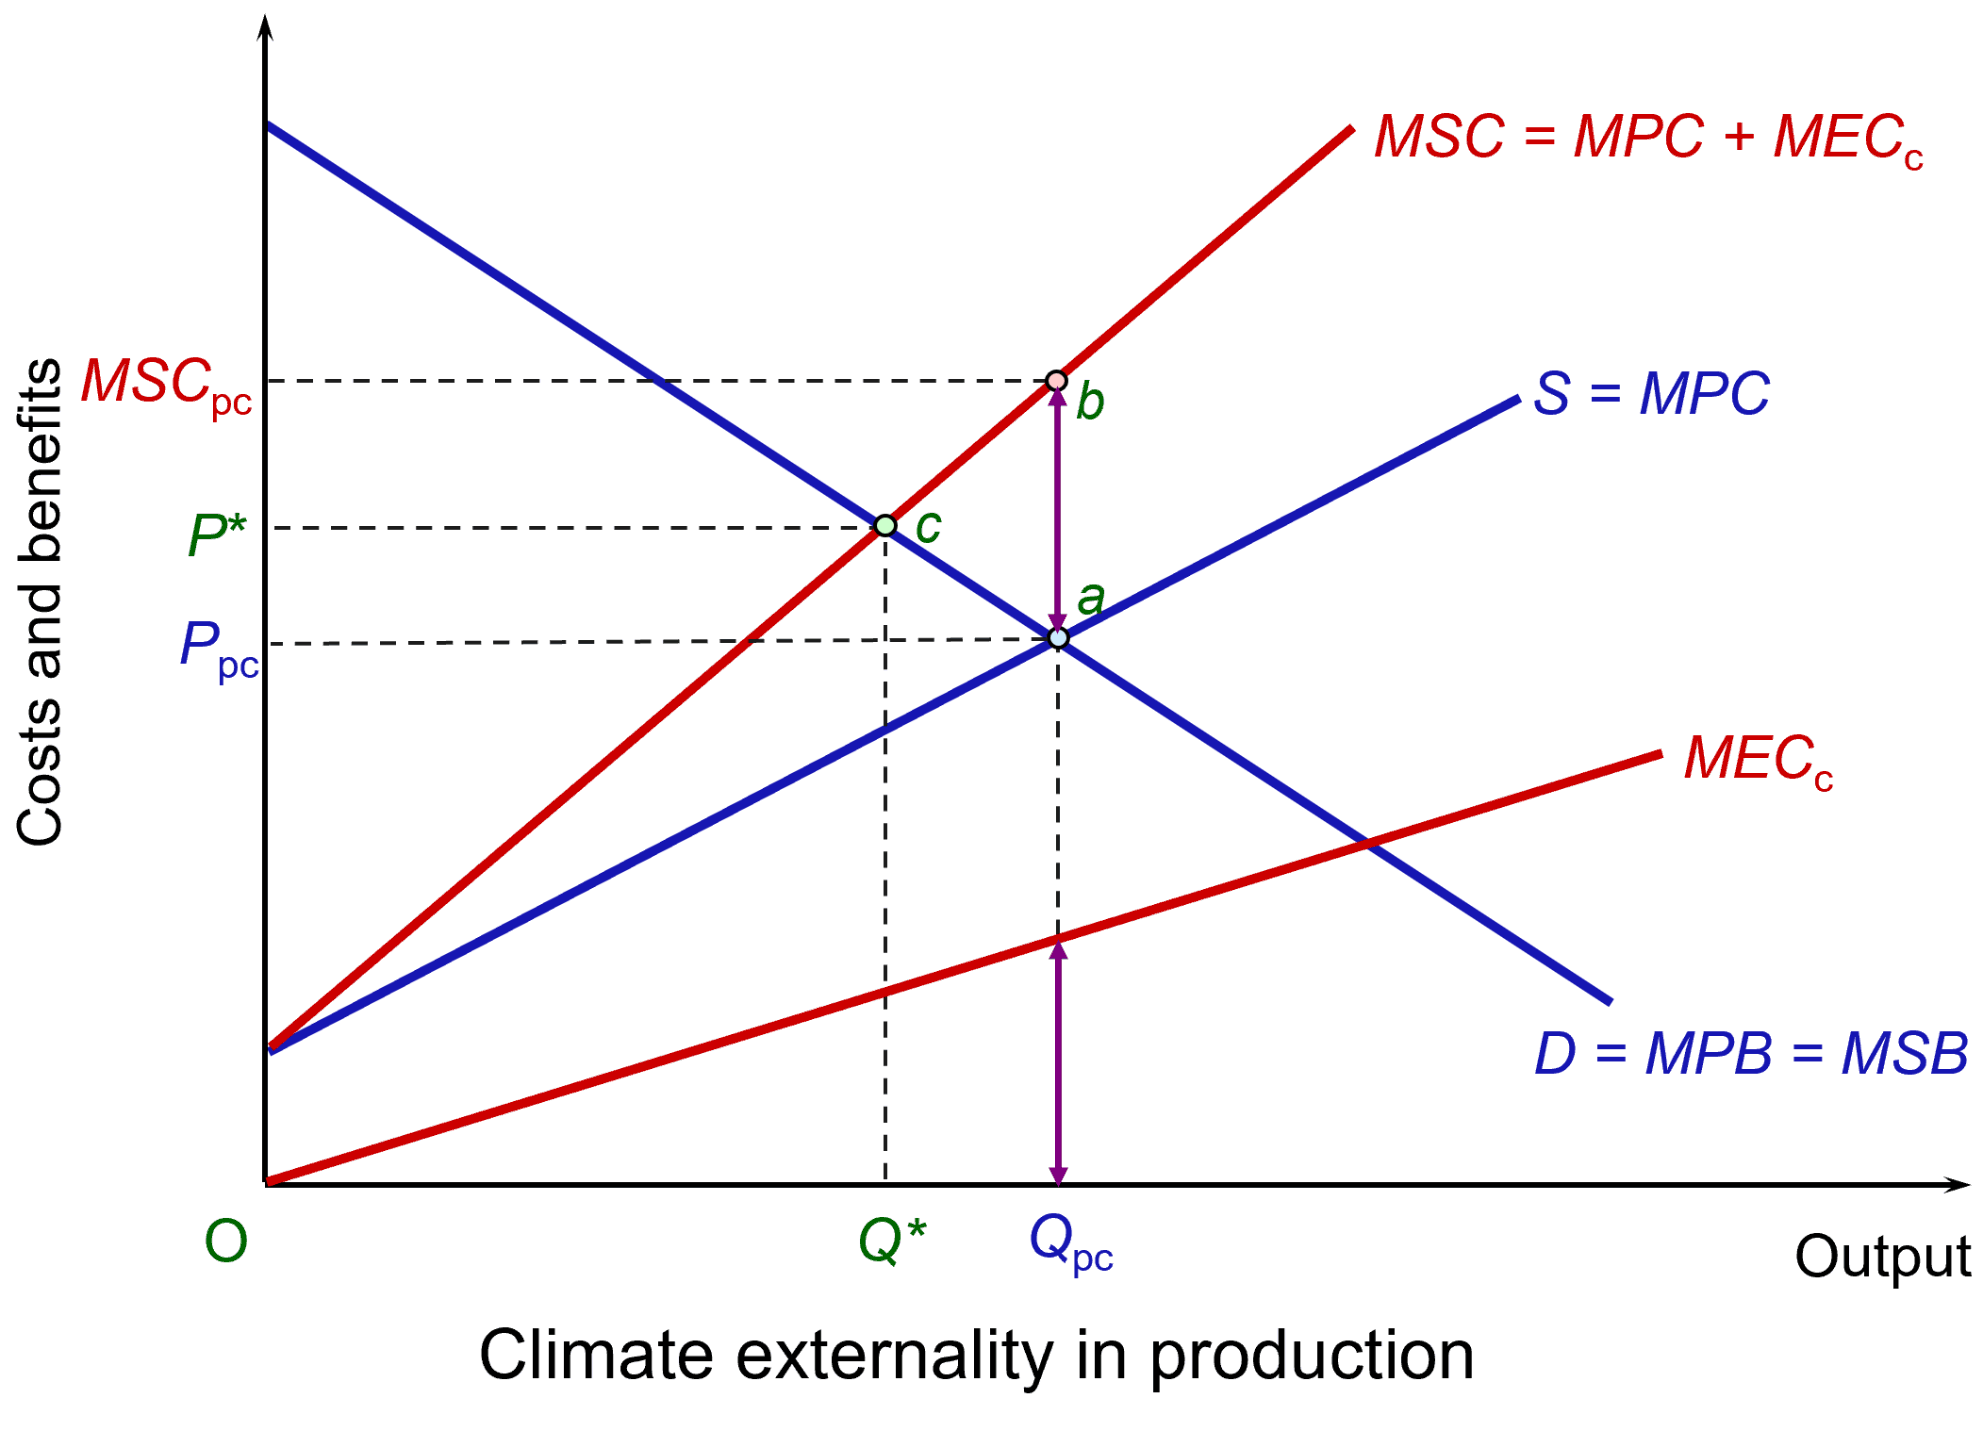 These climate costs are external costs to the firm and are illustrated in the figure. It shows an industry that emits CO2. To keep the analysis simple, assume that it is a perfectly competitive industry with demand and supply given by curves D and S, which are equal to the marginal private benefits (MPB) and marginal private costs (MPC), respectively. There are no externalities on the demand side and hence MPB equals the marginal social cost (MSB). Market equilibrium is at point a, with output at Qpc and price at Ppc. (Click here for a PowerPoint.)
Assume that the emissions create a marginal cost to society equal to MECc. Assume that the MEC increases as output and total emissions increase. The MECc line is thus upward sloping. At the market price of Qpc, these external climate costs are equal to the purple vertical line. When these external climate costs are added to private costs, this gives a marginal social cost given by MSC = MPC + MECc. The gives a socially optimal level of output of the product of Q* at a price of P*, with the optimum point of c.
 In other words, other things being equal, the free market overproduces products with climate externalities. If the output is to be reduced to the social optimum of Q*, then the government will need to take measures such as those advocated in the Paris Agreement. These could include imposing taxes on products, such as electricity generated by fossil fuels, or on the emissions themselves. Or green alternatives, such as wind power, could be subsidised.
Alternatively, regulations could be used to cap the production of products creating emissions, or caps on the emissions themselves could be imposed. Emissions permits could be issued or auctioned. Only firms in possession of the permits would be allowed to emit and the permits would cap emissions below free-market levels. These permits could be traded under a cap-and-trade scheme, such as the EU’s Emissions Trading Scheme. Again, such schemes are advocated under the Paris Agreement.
COP30 and progress in tackling climate change
 The USA is not attending COP30 in Brazil. Nor is the Chinese leader, Xi Jinping. However, there are growing opportunities for translating aims into practical policies for specific sectors, such as energy, transport and carbon-intensive industries. These policies may require some degree of government action – taxes, subsidies or regulation – to internalise climate externalities. But increasingly, green alternatives are becoming economically viable without subsidies or with just initial government funding to ‘crowd in’ private investment, which will then attract further private capital as external economies of scale kick in. Increasingly investors will find profitable opportunities in climate-friendly projects.
At the same time, while the USA is moving away from climate-friendly investment (as least for the term of the Trump Presidency), China is moving in the opposite direction, with massive investment in solar panels, wind turbines, EVs and batteries – investment that is bringing down their cost and thereby encouraging their adoption around the world. Such technologies create huge opportunities for low-income countries to provide affordable energy and to create local jobs, both skilled and unskilled. It also helps them achieve much greater energy security by reducing their reliance on fossil fuel imports
Chinese advances in green technology are also providing a stimulus to other countries to invest in renewable industries to prevent Chinese dominance. The danger, however, of Chinese dominance in the renewable sector in high-income countries is that it may encourage them to impose tariffs on Chinese imports of EVs, solar panels, etc. to protect their own industries.
But despite the growing opportunities for profitable adoption of green technologies without government support, there is still much that governments need to do to encourage the process. COP meetings are an important forum for discussing such policies and holding governments to account for meeting or not meeting their targets.
The agreement
The agreement reached at the end of the conference marked relatively small progress. There was agreement to increase finance from developed to developing countries to help them adapt to climate change. This would triple to $120bn per year, up from the previously agreed doubling, but the target date was pushed back to 2035 from the previously agreed 2030.
By the end of the conference, 122 of the 197 countries had submitted a new NDC – still 75 countries short, although others are expected.
The conference also agreed to establish a ‘just transition mechanism (JTM)’ to ‘enhance international cooperation, technical assistance, capacity-building and knowledge-sharing, and enable equitable, inclusive just transitions’. However, this is voluntary and no funding was attached, but it could act as the basis for future funding.
The biggest failure of the conference was probably the lack of agreement on phasing out of fossil fuels. This is not surprising given the opposition of the major oil producers. The hope is that the reduction in costs of renewable energy will drive the process anyway – a process that China is keen to accelerate with its investment in solar power and other renewable energy. One hopeful development, however, was the pledging of more than $9bn to halt deforestation, a major source of global warming. (See the Travers Smith article at the end of the Articles list below for a very useful summary of the outcome.)
Articles
- What is COP30 and why does it matter for the climate?
Chatham House, Anna Åberg (5/9/25)
- COP30 in Brazil: What is at stake for global collaboration on climate and nature?
World Economic Forum, Pim Valdre (5/11/25)
- What is COP30 and why does it matter?
CNN, Laura Paddison (11/11/25)
- Why COP 30 in Brazil Matters for a Thriving Economy and a Safe, Livable Planet
Union of Concerned Scientists (UCS),Rachel Cleetus (7/11/25)
- Nationally Determined Contributions: The Action Plans Behind Global Efforts To Fight the Climate Crisis
Center for American Progress (CAP, Kalina Gibson and Courtney Federico (22/9/25)
- New climate pledges only slightly lower dangerous global warming projections
UN Environment Programme, Press Release (4/11/25)
- COP30: Trump and many leaders are skipping it, so does the summit still have a point?
BBC News, Justin Rowlatt (10/11/25)
- Trump dismisses clean energy as ‘a joke.’ But Americans deserve facts, not fear
USA Today, Mark McNees (23/9/25)
- The surprising countries pulling off stunningly fast clean energy transitions
CNN, Ella Nilsen and Samuel Hart (7/11/25)
 Could the world’s biggest polluter be its savior against climate change?
CNN, Simone McCarthy (17/11/25)
- COP 2025: Outlook and Implications for Investors
RankiaPro, Joanna Piwko, Allegra Ianiri, Marie Lassegnore and Jean-Philippe Desmartin (10/11/25)
Post-agreement
- Belém: yet another cop out
Zero Hour, Allan Gray (25/11/25)
- Cop30’s watered-down agreements will do little for an ecosystem at tipping point
The Guardian, Fiona Harvey, Jonathan Watts, Damien Gayle and Damian Carrington (22/11/25)
- COP30: Five key takeaways from a deeply divisive climate summit
BBC News, Justin Rowlatt and Matt McGrath, (25/11/25)
- COP30: What were the key outcomes?
Travers Smith (1/12/25)
Information and Data
Questions
- Summarise the Paris Agreement.
- Summarise the Baku to Belém Roadmap to 1.3T.
- What incentives are there for countries to stick to their NCDs?
- Using a diagram similar to that above, illustrate how the free market will produce a sub-optimal amount of solar power because the marginal social benefit exceeds the marginal private benefit. How might the calculation be changing?
- How might game theory be used to analyse possible international decision making at COP conferences? How might this be affected by the attitudes of the Trump administration?
- Is it in America’s interests to cease investing in green energy and green production methods?
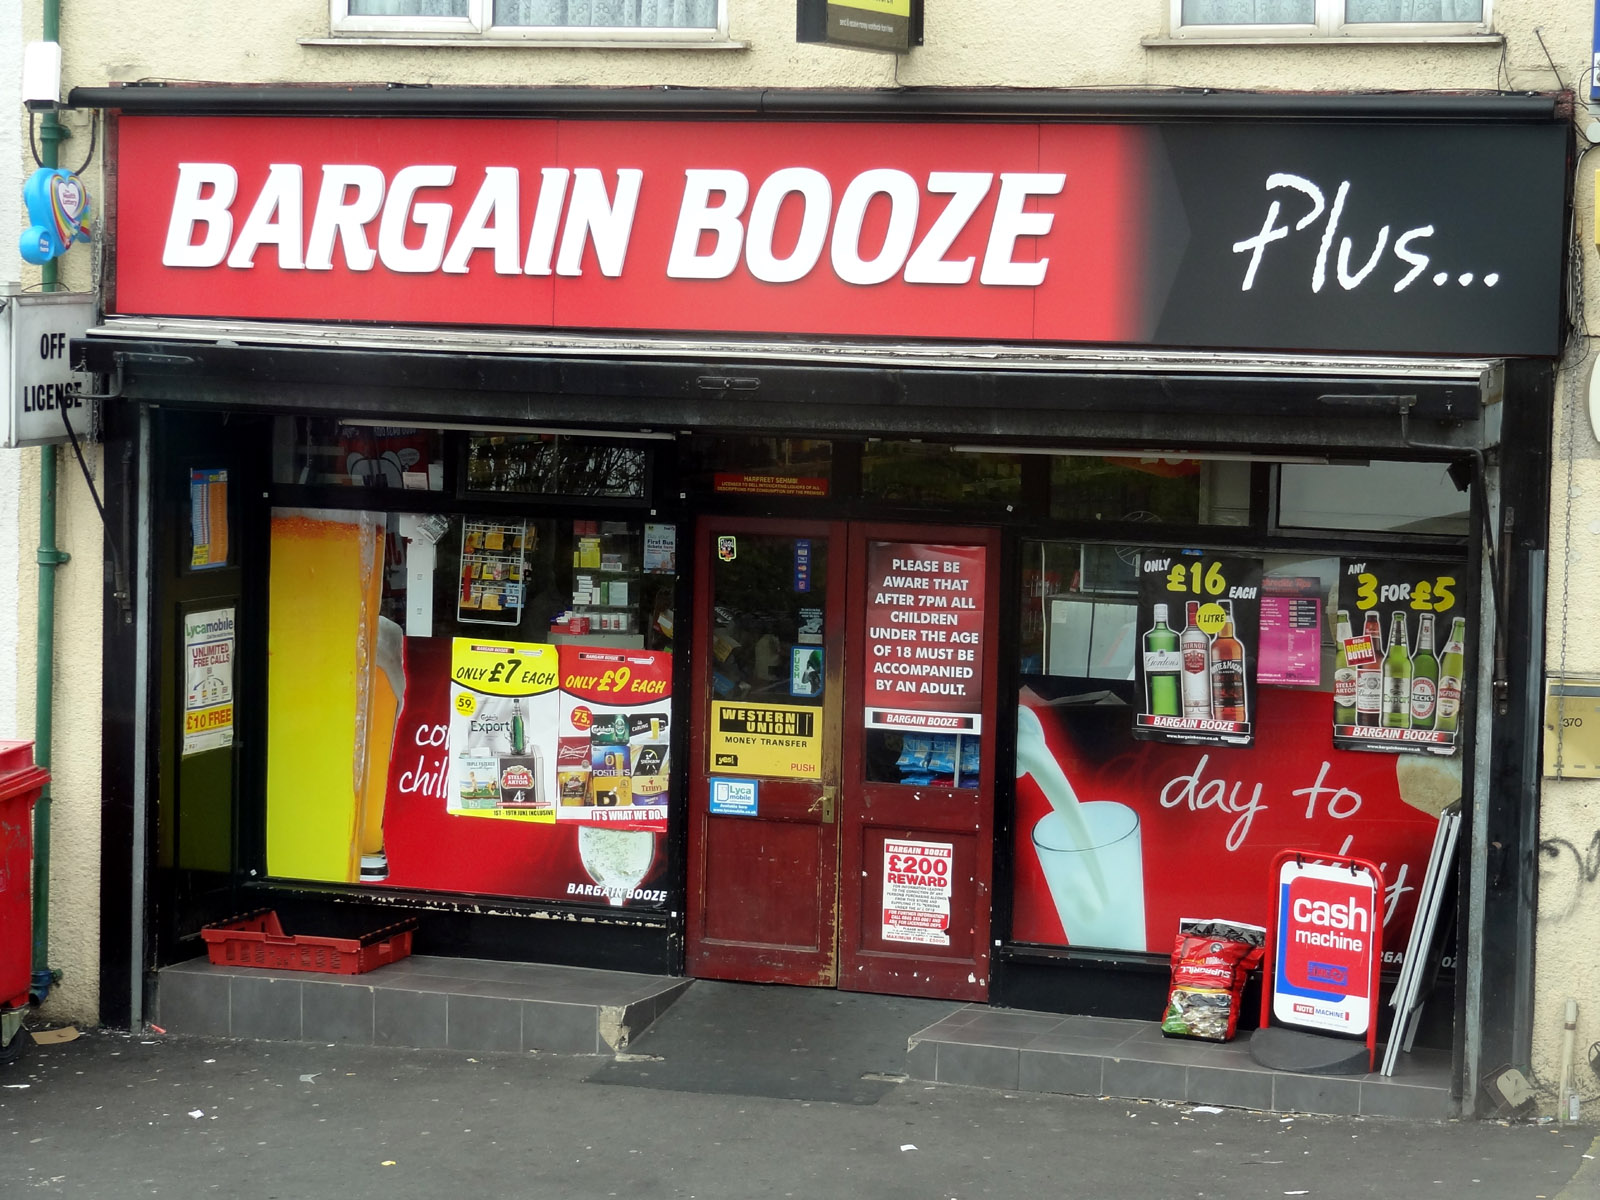 The debate about a minimum price for alcohol continues to be prompted by concerns over high levels of drinking, its effect on public health and public order, and a widespread belief that most of the alcohol that contributes to drunken behaviour is irresponsibly priced and sold. Minimum pricing for alcohol, although considered a radical intervention, is not a new policy. A minimum unit price (MUP) for alcohol was introduced in Scotland in 2018, in Wales in 2020, in the Republic of Ireland in 2022 and looks likely to be introduced in Northern Ireland.
Despite more countries following Scotland’s lead, there are no current plans to consider an application of an MUP in England. However, with recent increases in the MUP in Scotland and the findings of a five-year review in Wales, it would suggest that this policy will continue to be at the forefront of discussions of how to tackle impacts of alcohol consumption.
Reasons and options for intervention
The main goal of introducing a minimum unit price for alcohol is to tackle unwanted consequences from the consumption of alcohol. While many people consume alcoholic drinks safely without any problems, some patterns of alcohol use are associated with significant physical, mental and social harm.
It costs UK society more than £27 billion a year through a combination of health, crime, workplace and social welfare costs. Therefore, some governments in the British Isles have deemed it necessary to intervene in this market to reduce alcohol-related harm and protect the health of those regularly drinking more than the recommended 14 units per week.
 Research has shown that making alcohol less affordable can reduce consumption and hence related harms. The World Health Organization considers minimum pricing one of its ‘best buys’ for tackling harmful alcohol use.
There are three main policy options that aim to reduce the consumption of alcohol by making alcohol less affordable. One is to tax alcoholic drinks; the second is to set a minimum price per unit of alcohol; the third is to ban the sale of alcohol drinks below cost price (the level of alcohol duty plus VAT).
The policy option of an MUP has been adopted by Scotland, Wales and the Republic of Ireland; England has opted to use a ban on selling alcohol below the level of alcohol duty plus VAT (since 28 May 2014).
What is a minimum price?
The introduction by the government of a minimum price for a product means that it cannot legally be sold below that price. It can be set in order to achieve certain economic or social objectives that are not currently being achieved at equilibrium in the market. In order for the policy to have an effect, the minimum price must be set above the equilibrium price. This price floor then prevents prices from falling too low and settling back at equilibrium below the MUP.
A common misconception is that introducing a minimum price for alcohol is a form of taxation. However, this is not the case. Implementing an MUP means that any extra money from higher prices goes to the retailers and producers, not to the government.
Why choose a minimum price floor?
The policy has two main objectives. The first is to protect the interests of drinkers who may make poor decisions on their own behalf. This may be from lack of information, social pressures or a disregard for their own long-term health or welfare.
The second objective is to reduce the external costs placed on health services, the police, the criminal justice system, on fellow citizens or employers. There are also longer-term external costs when alcohol abuse impacts on productivity or leads to repeated absences from work.
It is argued that MUP intervention can encourage positive changes in behaviour of both consumers and producers. It can target harmful excessive drinking, while leaving the more moderate drinker relatively unaffected.
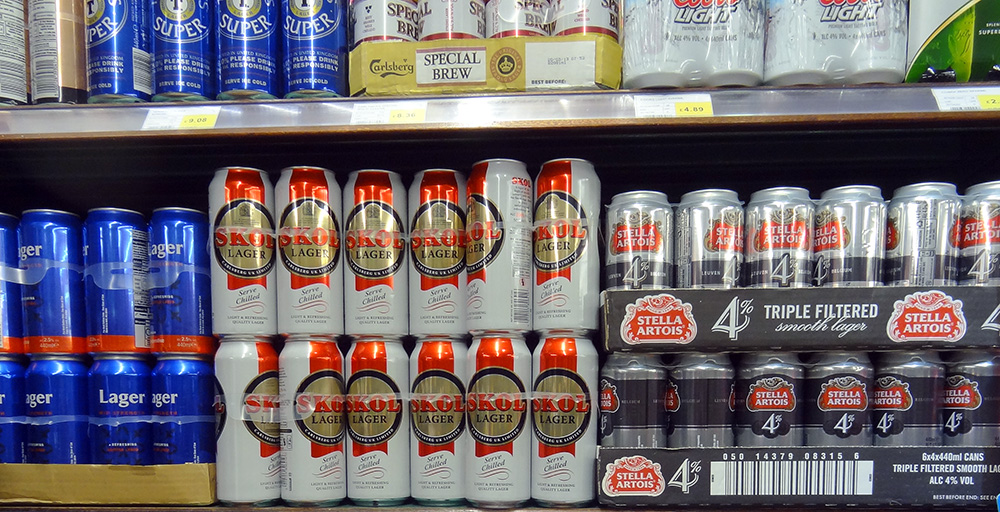 A positive impact on consumers is the possible changes in demand. People who previously consumed cheap, and often strong, drinks, such as cheap cider, will find that their marginal private cost of consuming alcohol has increased. Depending on the price elasticity of demand, their consumption will decrease and there will be a reduction in alcohol-related violence and other external costs. A positive impact on producers is that it can encourage drinks manufacturers themselves to reduce the alcohol content of their products and, therefore, limit any increase in price passed on to the consumer.
How it differs in the different parts of the British Isles
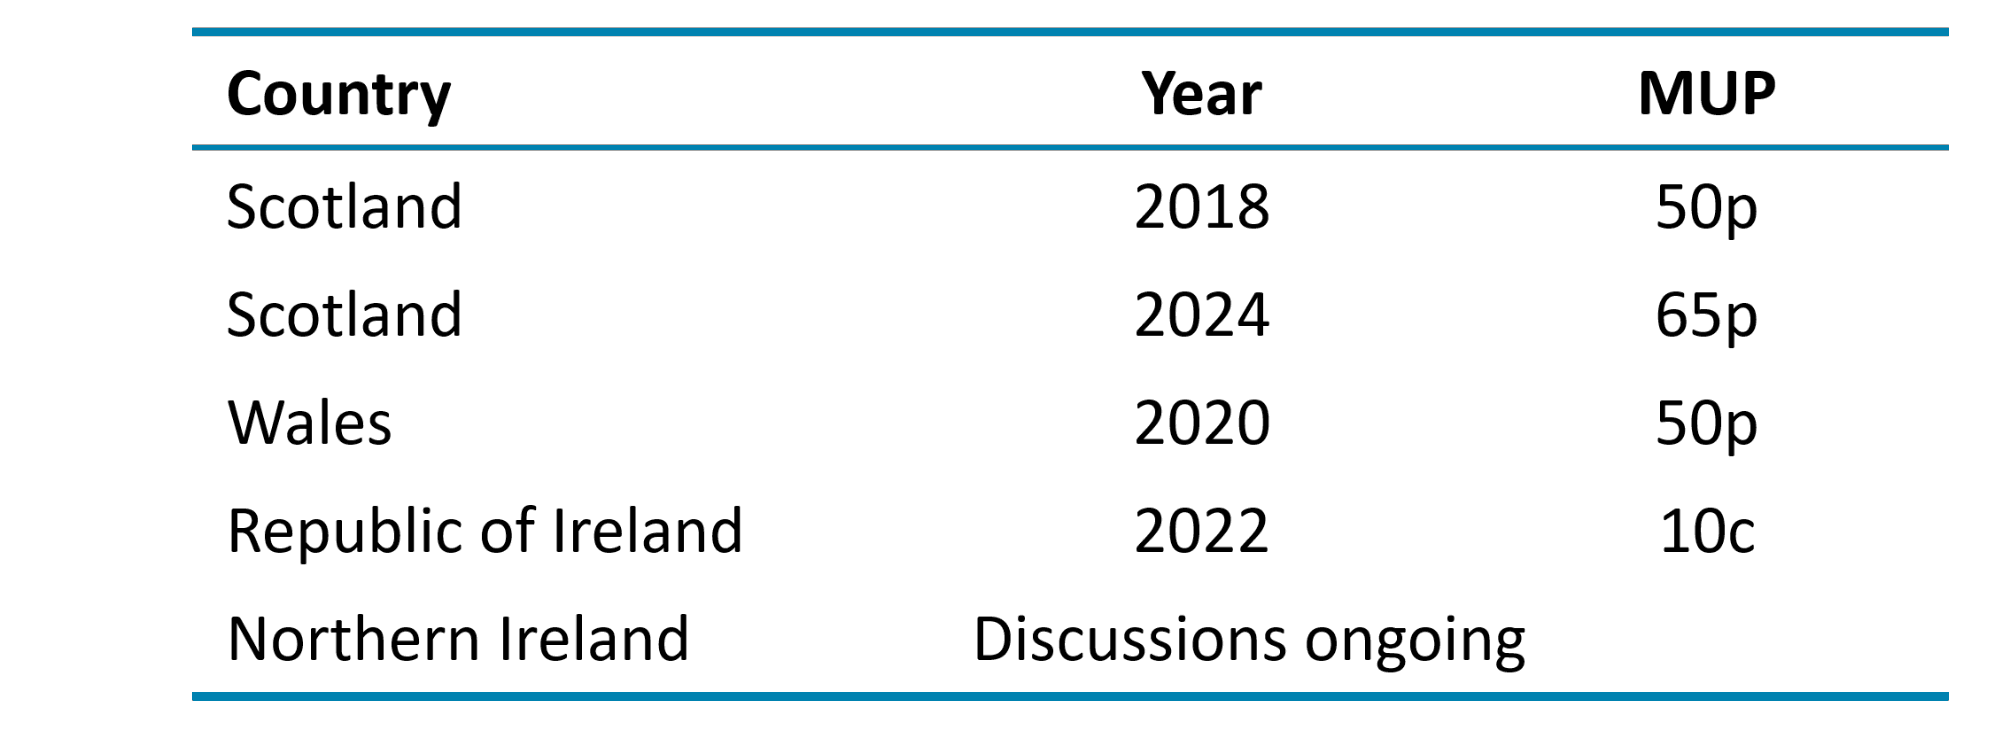
While minimum alcohol pricing is in place in several countries, policies differ. In terms of the British Isles, in 2018 Scotland became the first country to introduce a national minimum price for all types of alcohol. Two years later, Wales followed suit. The Republic of Ireland introduced minimum pricing in January 2022, while Northern Ireland has been engaged in consultation on the policy for several years. The following table shows when MUP was introduced and at what rates.
Has the MUP been effective?
Wales has reached the five-year review point since the MUP was introduced. Many of the findings within the Welsh evaluation have strong resonance with those elsewhere, particularly those of the final Scottish evaluation. There have been five main findings:
- Implementation has been smooth. Retailers have largely complied with the law, and enforcement has been effective.
- Certain cheap alcohol products have disappeared. Large bottles of strong cider, for example, are now rare. There have also been shifts in promotions and product availability.
- There are indications that overall alcohol consumption in Wales has declined. While it is difficult to measure directly, purchasing data suggests a reduction.
- Concerns about unintended consequences have not materialised significantly. Predictions of a rise in home brewing, substance switching, shoplifting and cross-border purchasing have not been widely observed.
- Some drinkers have changed their purchasing habits. A minority have switched from cider to wine or spirits as price differences narrowed. Others, particularly those on low incomes, experienced further struggles in financially maintaining their drinking habits.
There was also a study published last year (2024) in the journal Economic Inquiry, looking at the impacts of the policy during lockdown restrictions. The study showed that the introduction of MUP in Wales resulted in a 15% increase in transaction prices and a sharp reduction in the amount of alcohol bought, around 20%, with an overall drop in expenditure per customer compared to England over the same period.
However, it should be noted that the COVID pandemic disrupted drinking habits and the availability of alcohol. In addition, evaluating the overall effects of the policy has been complex with other economic factors, including the cost-of-living crisis, also influencing affordability.
Is it a fair policy?
A counter argument to applying a price intervention on alcohol is that it may have unintended private and external costs. One argument claims that young people could decide to switch to cheaper non-alcoholic drugs instead. Alternatively, they may seek to purchase alcohol on illegal shadow markets.
 Critics of the policy argue that it negatively impacts those who consume alcohol responsibly, especially families on average or below-average incomes. The wine and spirits industry tried to lobby against the Scottish government, arguing that it is inconsistent with the operation of the free market and that the intervention creates a barrier to trade. They claim that lower sales of alcoholic drinks will cost jobs in the UK, both in manufacturing and from reduced revenues of corner shops, pubs and other retailers.
There is also an argument that relying solely on an MUP targets the affordability of drinking rather than addressing all aspects of alcohol harm. Therefore, this policy is not necessarily effective in achieving all the government’s goals. Critics argue that this policy should be one component of a more comprehensive strategy delivery, which might include education, restricting the availability of alcohol, banning advertising, increasing alcohol duty, etc.
Conclusion
Although there are currently no plans to implement an MUP in England, there is ongoing pressure for the Government to consider adopting one. In the Autumn of 2024, Lord Darzi carried out an independent investigation of the NHS in England. This investigation into the NHS highlighted the ‘alarming’ death toll in England caused by cheap drink (see link below). This led public health leaders to call for action to increase the price of cheap alcohol in supermarkets and off-licences.
 However, the policy itself is not without its critics, especially those citing continued trends in actual numbers of alcohol-related deaths. Therefore, it is suggested that the policy needs to be accompanied by well-funded treatment and support services for people experiencing alcohol-related difficulties. If combined with other policy measures and social support, it has the potential to contribute significantly to reductions in alcohol-related harm.
Despite reservations, overall a minimum price per unit of alcohol is viewed by many as a justified intervention and is well supported by evidence. It has been accepted that a minimum price is required to reduce consumption closer towards the social optimum and in order to bring about change in consumer and producer behaviour. Given the evidence provided from current MUP countries and ongoing discussions of alcohol-related deaths in England, health officials believe a review is almost certain, even though the current government reportedly ruled out minimum unit pricing shortly after winning power.
Articles
Reports
Questions
- Using a supply and demand diagram, discuss the effect of introducing a minimum price per unit of alcohol.
- How is the price elasticity of demand for alcoholic drinks relevant to determining the success of minimum pricing?
- Compare the effects on alcohol consumption of imposing a minimum unit price of alcohol with a ban the sale of alcohol below cost price. What are the revenue implications of the two policies for the government?
- What negative externalities occur as a result in the over consumption of alcohol? How could a socially efficient price for alcohol be determined?
- Could alcohol consumption be described as a ‘de-merit good’? Explain.
- Rather than targeting the price of alcohol, what other policies could the government introduce to tackle over consumption of alcohol?
- What will determine the number of people travelling across borders within the UK (i.e. from Scotland or Wales to England) to buy cheaper alcoholic drinks?