
The prices of many species of fish have risen in recent months. Coastal pelagic fish, such as mackerel, herring and sardines have risen especially rapidly. Mackerel, once seen as a cheap source of protein, is no longer quite such a ‘bargain’.
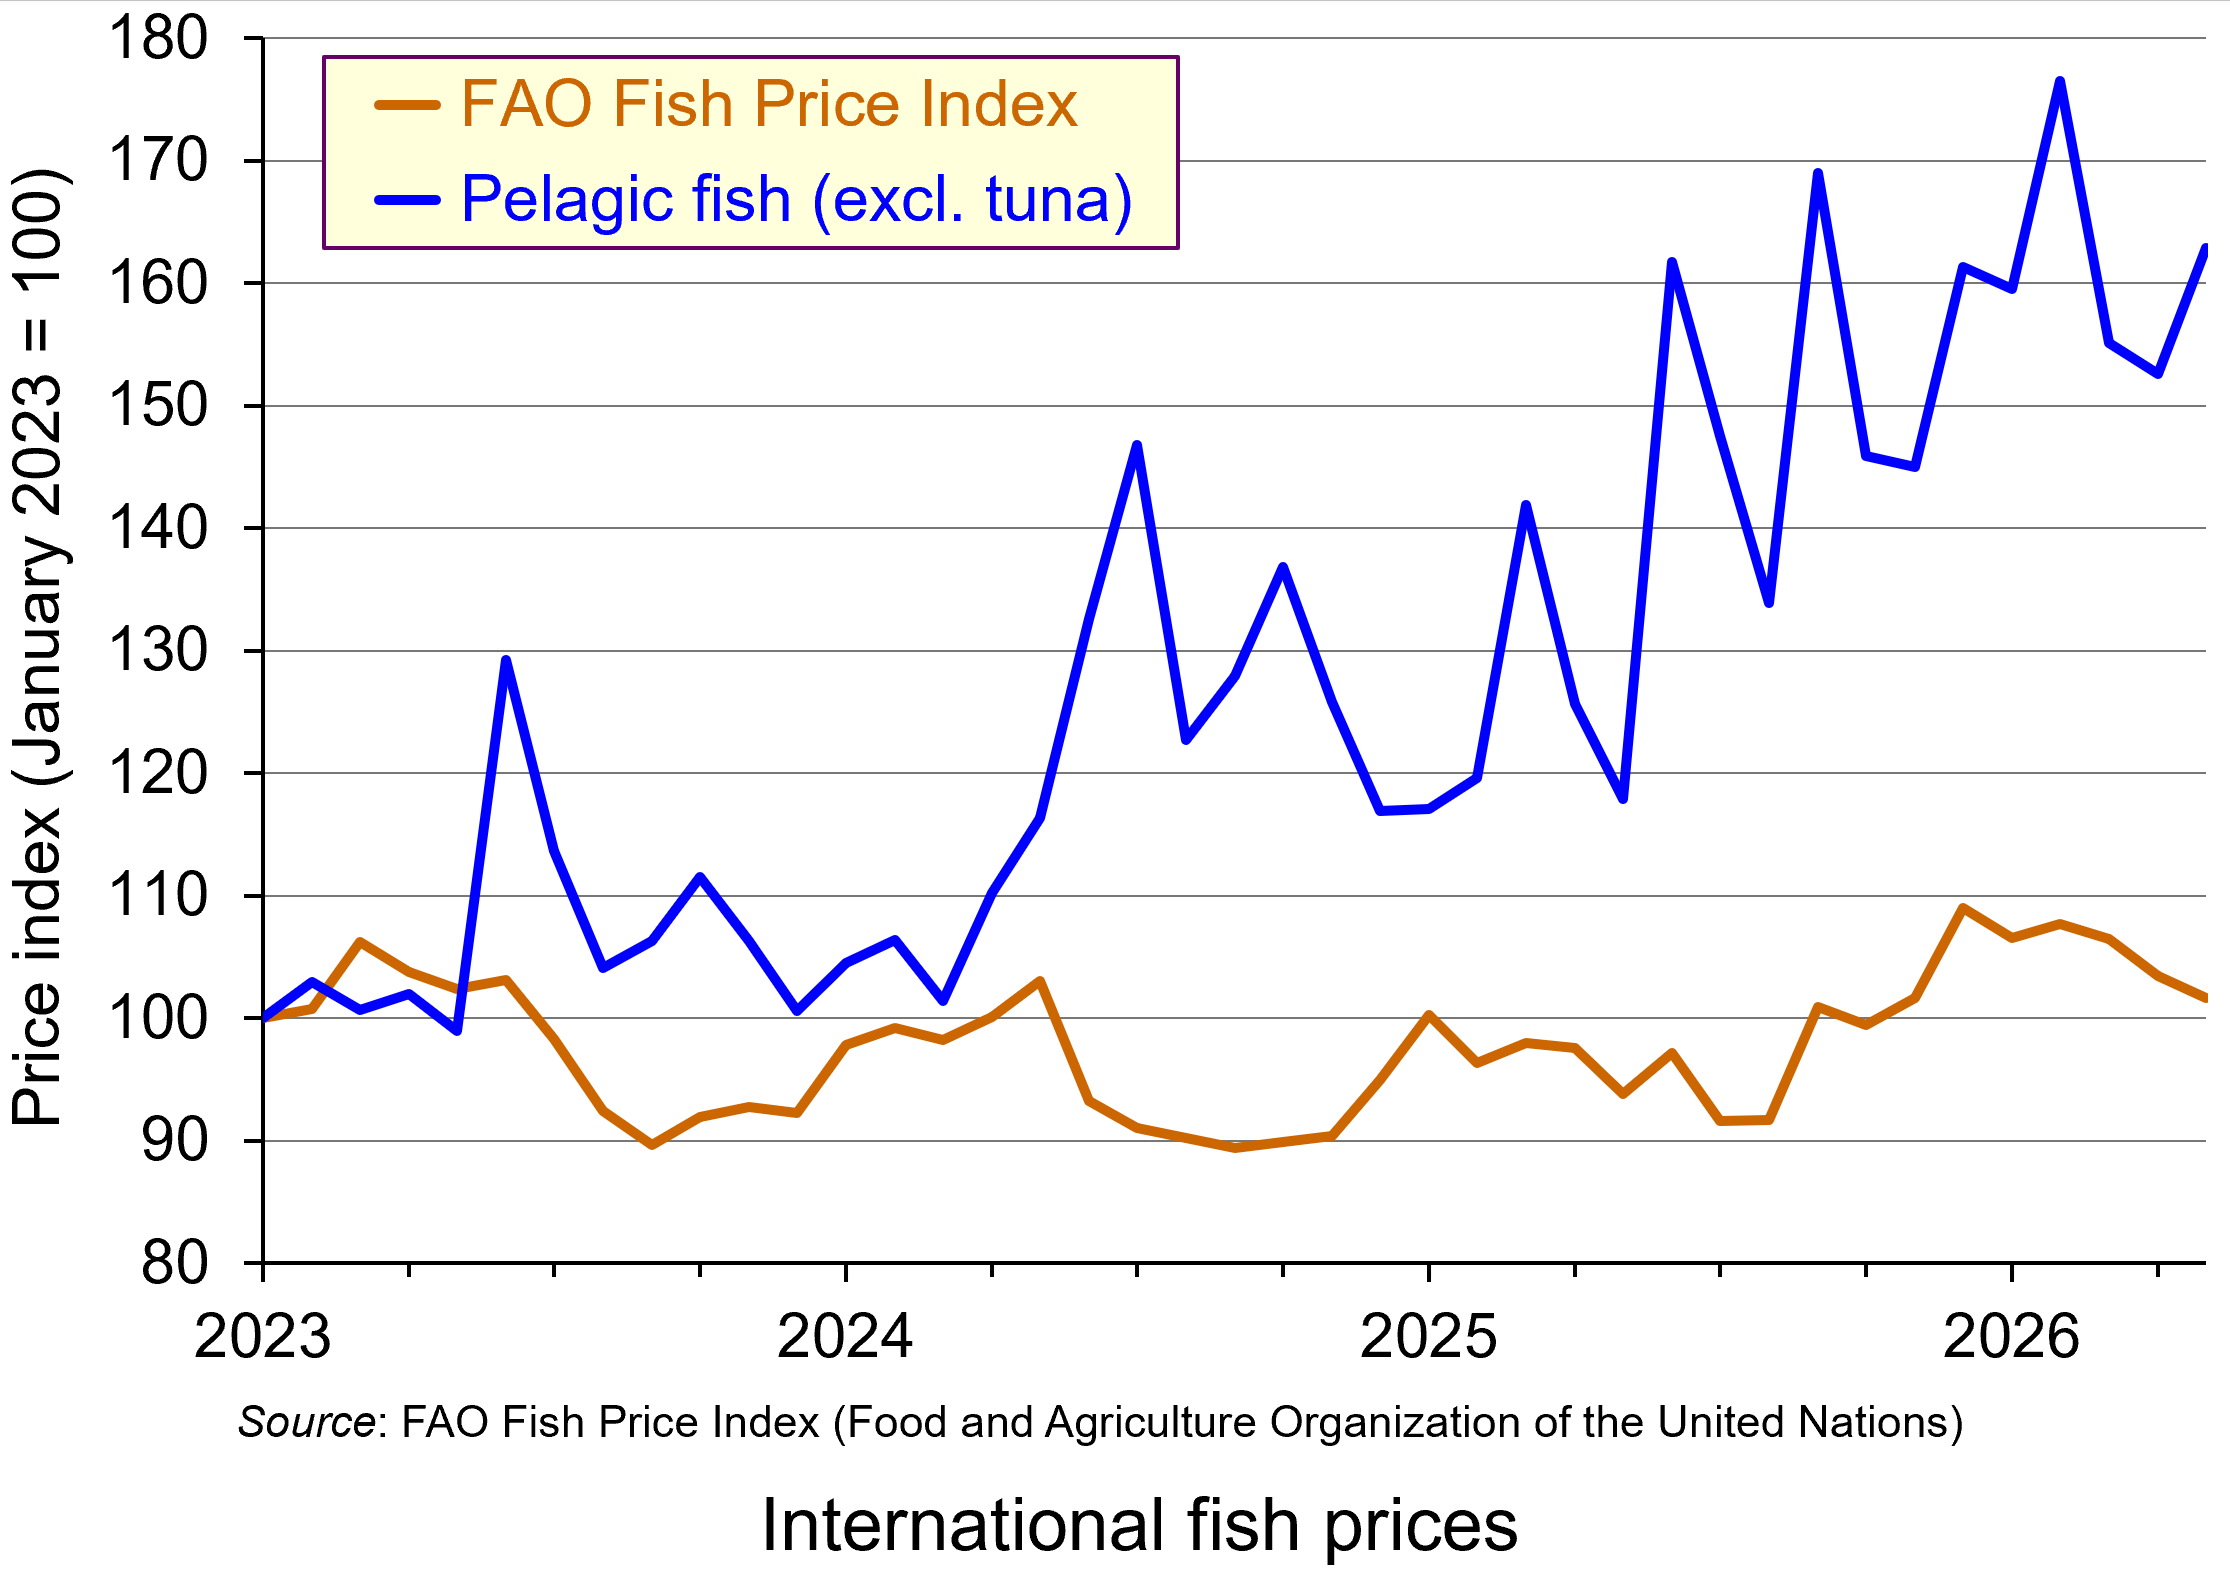 From January 2023 to May 2026, the international price index of pelagic fish rose by 69%. In 2025, UK supermarket fresh, chilled smoked and tinned mackerel prices rose by an average of 25%; and over the first part of 2026, some tinned mackerel product lines have increased by as much 55%. In February 2026, Waitrose announced that it would suspend sales of fresh and chilled mackerel and tinned mackerel once current stocks had been cleared. It cited overfishing and sustainability concerns.
Supply and demand
But why have mackerel prices risen so much? The price of fish is determined by demand and supply. So what has changed? The main changes have been on the supply side.
Supply. Most of the world’s supply of mackerel comes from the Northeast Atlantic. These waters have been overfished for many years, thereby depleting the stock of the fish and reducing the amount of mackerel caught.
 To arrest the decline and allow stocks to rebuild, the International Council for the Exploration of the Sea (ICES) recommended a quota of 174,357 tonnes for 2026. This would represent a 70% cut from 2025. The main fishing countries – Norway, the UK, the Faroe Islands and Iceland – eventually agreed to a quota of 299,010 tonnes: a cut of 48%. After a series of bilateral agreements between the four countries over access to each other’s waters, this resulted in the following quota shares: UK 30.55%, Norway 26.4%, Faroes 12% and Iceland 10.5%. The remaining 20.55% would be for the EU, Greenland and Russia.
Despite these other countries not being part of the deal, in May 2026 the EU agreed to reduce its catch by 48% too. Russia, however, set its own quota of 67,548 tonnes, which is 22.6% of the total 299,010 quota, above the 20.55% set aside for the EU, Russia and Greenland combined and almost almost five times Russia’s historic quota share! The UK, EU and Iceland responded by agreeing to bar Russian vessels carrying mackerel from entering their ports.
The quotas have added to the decline in supply, even though the aim is to increase supply in the future as stocks are rebuilt. In May this year, the Norwegian catch was down nearly 85% – well below the 48% reduction in the quota.
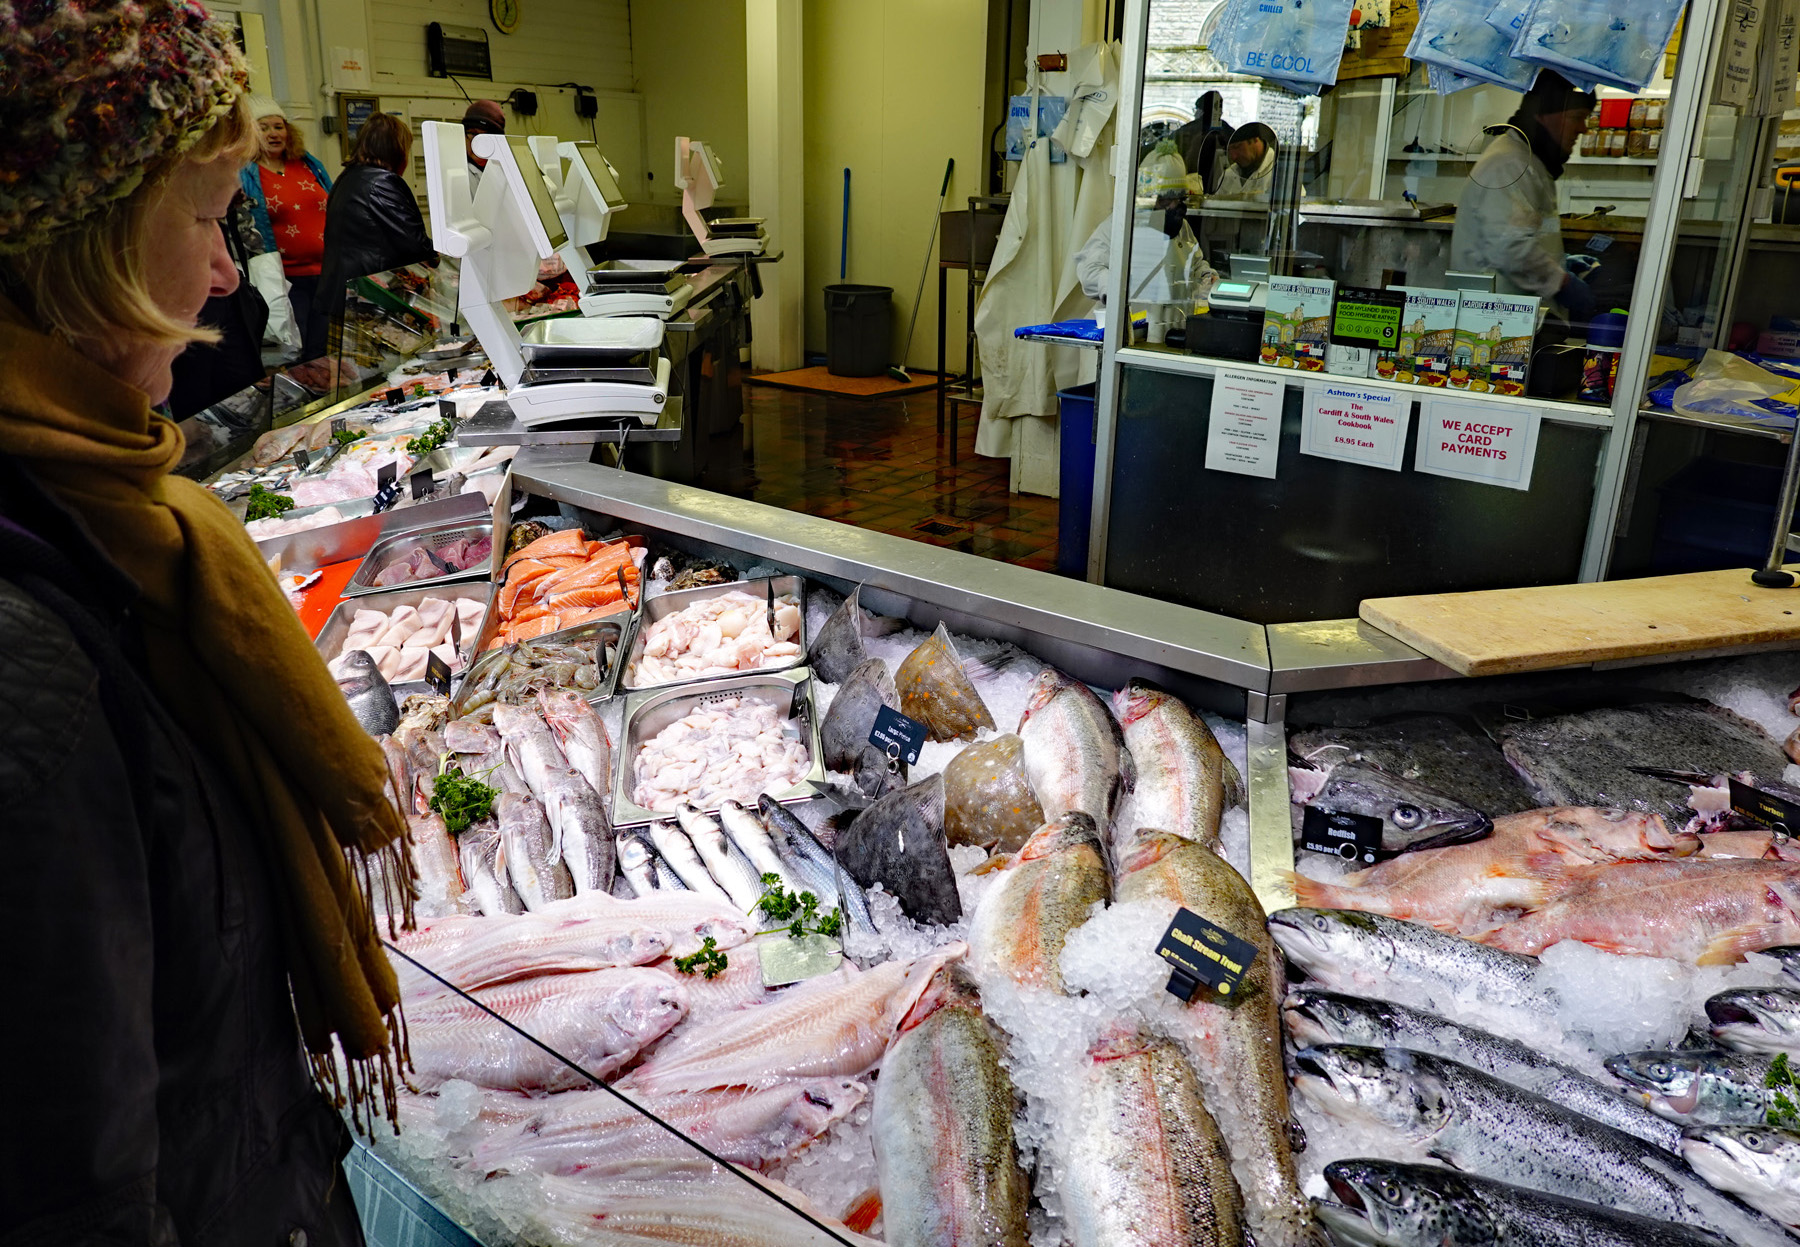 Demand. Despite higher prices, demand has remained strong. Part of the reason is that demand is relatively inelastic. This is because, despite its increase in price, mackerel remains a relatively cheap fish and thus there is little option to switch to cheaper alternative fish. Indeed, with other fish going up in price, and meat too, some people may even switch to mackerel.
Another reason for strong demand is the growing market outside Europe, especially in southeast Asia, China, South Korea and Japan. In some of these countries, mackerel is seen as a luxury fish and people are prepared to pay higher prices, making demand relatively inelastic but at the other end of the market. In 2025, imports of frozen whole mackerel into the region rose by nearly 9%, despite rising prices.
However, Norwegian exports to the region have been falling, reflecting lower quotas in 2025 and lower still in 2026. This has further exacerbated the rise in price and intensified competition between Asian importers. For example, in July 2026, Korea sent a ‘mackerel envoy’ to Norway and other major exporters to seek to secure additional supplies.
The future
With supply restricted by declining stocks and tighter quotas, and with a price inelastic and growing demand, the high prices of mackerel in all forms look set to last – at least until stocks rebuild and quotas can be relaxed. But, with total quotas well above the level suggested by the ICES, rebuilding could take a long time.
Articles
- Norwegian Mackerel Prices Drive Record Pelagic Values in 2025
The Fishing Daily, Oliver McBride (25/5/26)
- Mackerel prices soar as demand and supply pressures take hold
The Grocer, Charles Elliman (23/1/26)
- Mackerel Prices Have Broken Historical Highs And May See Another Surge in 2026
Caharbor Import and Export Co., Ltd, China (12/1/26)
- Waitrose to suspend mackerel sales due to overfishing concerns
BBC News, Emer Moreau (27/2/26)
- Holy mackerel! The fish Waitrose removed from its shelves
Epigram (University of Bristol student newspaper), Grace Golby (6/6/26)
- Four Northeast Atlantic coastal parties agree on 2026 mackerel quotas, shares; EU left out again
SeafoodSource, Regin Winther Poulsen (17/12/25)
- EU Raises Mackerel Quotas despite Scientific Overfishing Warnings
The Fishing Daily, Oliver McBride (30/3/26)
- High Mackerel Prices Reshape Asian Small Pelagic Trade
The Fishing Daily, Oliver McBride (2/6/26)
- Korea dispatches ‘mackerel envoy’ to Norway as prices spike
Korea JoongAng Daily, Ahn Hyo-Seong (6/7/26)
- Norwegian Mackerel Supply Plunges, Korean Catch Regains Price Edge
Seoul Economic Daily, Nam Yoon-jung (28/6/26)
- Geopolitical unrest, currency effects and quota cuts led to a decline in the value of Norwegian seafood exports in the first half of the year
Norwegian Seafood Council, Press Release (3/7/26)
- Norwegian Seafood Exports: Frozen Mackerel and Herring Prices Surge in Week 26 of 2026
IndexBox (1/7/26)
- New sanctions on Russia following huge unilateral increase in mackerel quota
Fishing News, Steve Mackinson (9/7/26)
Data
Questions
- Draw a supply and demand diagram to illustrate what has happened to mackerel prices.
- What is the effective price elasticity of supply of mackerel?
- Why is demand for mackerel relatively price inelastic in the UK, except when prices rise above a certain level?
- Why is demand for mackerel relatively price inelastic in certain Asian countries, such as Japan and South Korea?
- In which country is demand for mackerel likely to be more income elastic: the UK or Japan?
- Under what circumstances might the price of mackerel in five years’ time be (a) higher than now; (b) lower than now? What will determine which is more likely?
- Should other supermarkets follow Waitrose’s lead in stopping the sale of mackerel?
- What is the ‘tragedy of the commons’? Why is a common resource such as fish in the open seas likely to result in the tragedy?
 The election of Donald Trump saw the market price of bitcoin rise from $67 839 on election day (5 November 2024) to £106 168 on 18 December: a rise of 56%. It was $104 441 the day before inauguration (20 January 2025).
Trump has been a keen supporter of cryptocurrencies. He has stated that he wants the USA to become the world’s ‘crypto capital’. Indeed, he and Melania Trump have launched their own meme coins hosted on the Solana blockchain. Meme coins are tokens, a form of cryptocurrency, inspired by specific individuals, characters, cartoons or artwork.
On 23 January, three days after his inauguration, President Trump signed an Executive Order. This states that it is:
…the policy of my Administration to support the responsible growth and use of digital assets, blockchain technology, and related technologies across all sectors of the economy, including by … protecting and promoting the ability of individual citizens and private-sector entities alike to access and use for lawful purposes open public blockchain networks without persecution, including the ability to develop and deploy software, to participate in mining and validating, to transact with other persons without unlawful censorship, and to maintain self-custody of digital assets…
The full Executive Order can be read here.
Cryptocurrencies
Although cryptocurrencies can be used for certain transactions and avoid the need for banks, their use as a medium of exchange or unit of account is limited by their price volatility. The supply of national or regional currencies, such as the US dollar, the euro and the pound sterling is controlled by central banks, and central banks have a key mandate of achieving price stability, where price is in terms of their currency’s consumer price index. Although exchange rates fluctuate and thereby affect the prices of internationally traded goods and assets, such fluctuations are small in comparison with crypto price fluctuations.
 The supply of many cryptocurrencies is not controlled with the objective of achieving price stability. Indeed, certain cryptocurrencies, such as bitcoin (the coins with the highest total market value of approximately $2060bn) have a limited maximum supply. The supply of bitcoin in January 2025 is officially 19.81m, 94.3% of the eventual official total of 21m. However, with some 1.8m coins lost, the current effective total supply is more like 18m and the ceiling 19.2m. New coins are created by ‘mining’, involving massive computer power to perform complex calculations. Coins in circulation at any one time are therefore fixed and increase only slowly and at a decelerating rate over time, with increased mining costs per coin. On any one day, however, the supply offered for sale can fluctuate wildly.
Some other crypto currencies also have a long-term supply ceiling and are created by mining. Others, such as ether (the coins with the second highest market value of approximately $394bn) do not have a fixed supply ceiling. They are not created by mining, but by a system known as ‘Proof-of-Stake (PoS)’. This uses the cryptocurrency’s owners, who stake some of their currency, to validate transactions on the Ethereum blockchain. They receive new ether as a reward. PoS uses considerably less energy than mining and hence is regarded as greener.
Unlike mined coins, Ethereum coins (ether) created by PoS can be ‘burned’: i.e. removed from circulating supply. This can more than offset new coins created and lead to a net decrease in supply. See the Fidelity Digital Assets and Paxful links below for a discussion of what determines the net burn/net creation rate of ether. Other coins, such as BNB (Binance’s cryptocurrency), have regular burns to control supply.
 There are some cryptocurrencies that are suitable as a medium of exchange and as a unit of value. These are ‘stablecoins’, whose value is linked 1:1 to a major currency, such as the US dollar or euro. Supply is adjusted to maintain this value. Stablecoins are used primarily for transactions. They account for some two-thirds of all transactions using crypto. They are particularly used for transactions in parts of the world with monetary instability and/or limited access to major currencies.
With the exception of stablecoins, crypto currencies are best seen as assets, rather than as a means of exchange or unit of account. As such, they are more comparable to gold than to conventional currencies.
The market for crypto in the long term
The market price of cryptocurrencies is determined by supply and demand. With limited supply, their price is likely to increase as demand is forecast to increase relative to supply. This is particularly the case with mined cryptocurrencies where there is a ceiling to supply. But even with PoS-created currencies, the amount supplied is likely to increase more slowly than demand, especially with burn mechanisms in place.
With many countries recognising and embracing cryptocurrencies as an asset, so the long-term price should rise. The endorsement by Donald Trump is likely to hasten this process.
The market for crypto in the short term
While the total supply of cryptocurrency is limited, the supply to market can fluctuate wildly, as can demand. This can cause huge gyrations in price.
Short-run demand and supply decisions are governed largely by expectations of future price changes, over anything from the next few hours to the coming months. If people think the price will rise, people will demand more, while those already holding crypto and thinking of selling will hold back. These actions will amplify the very effect they had predicted, namely a rise in price.
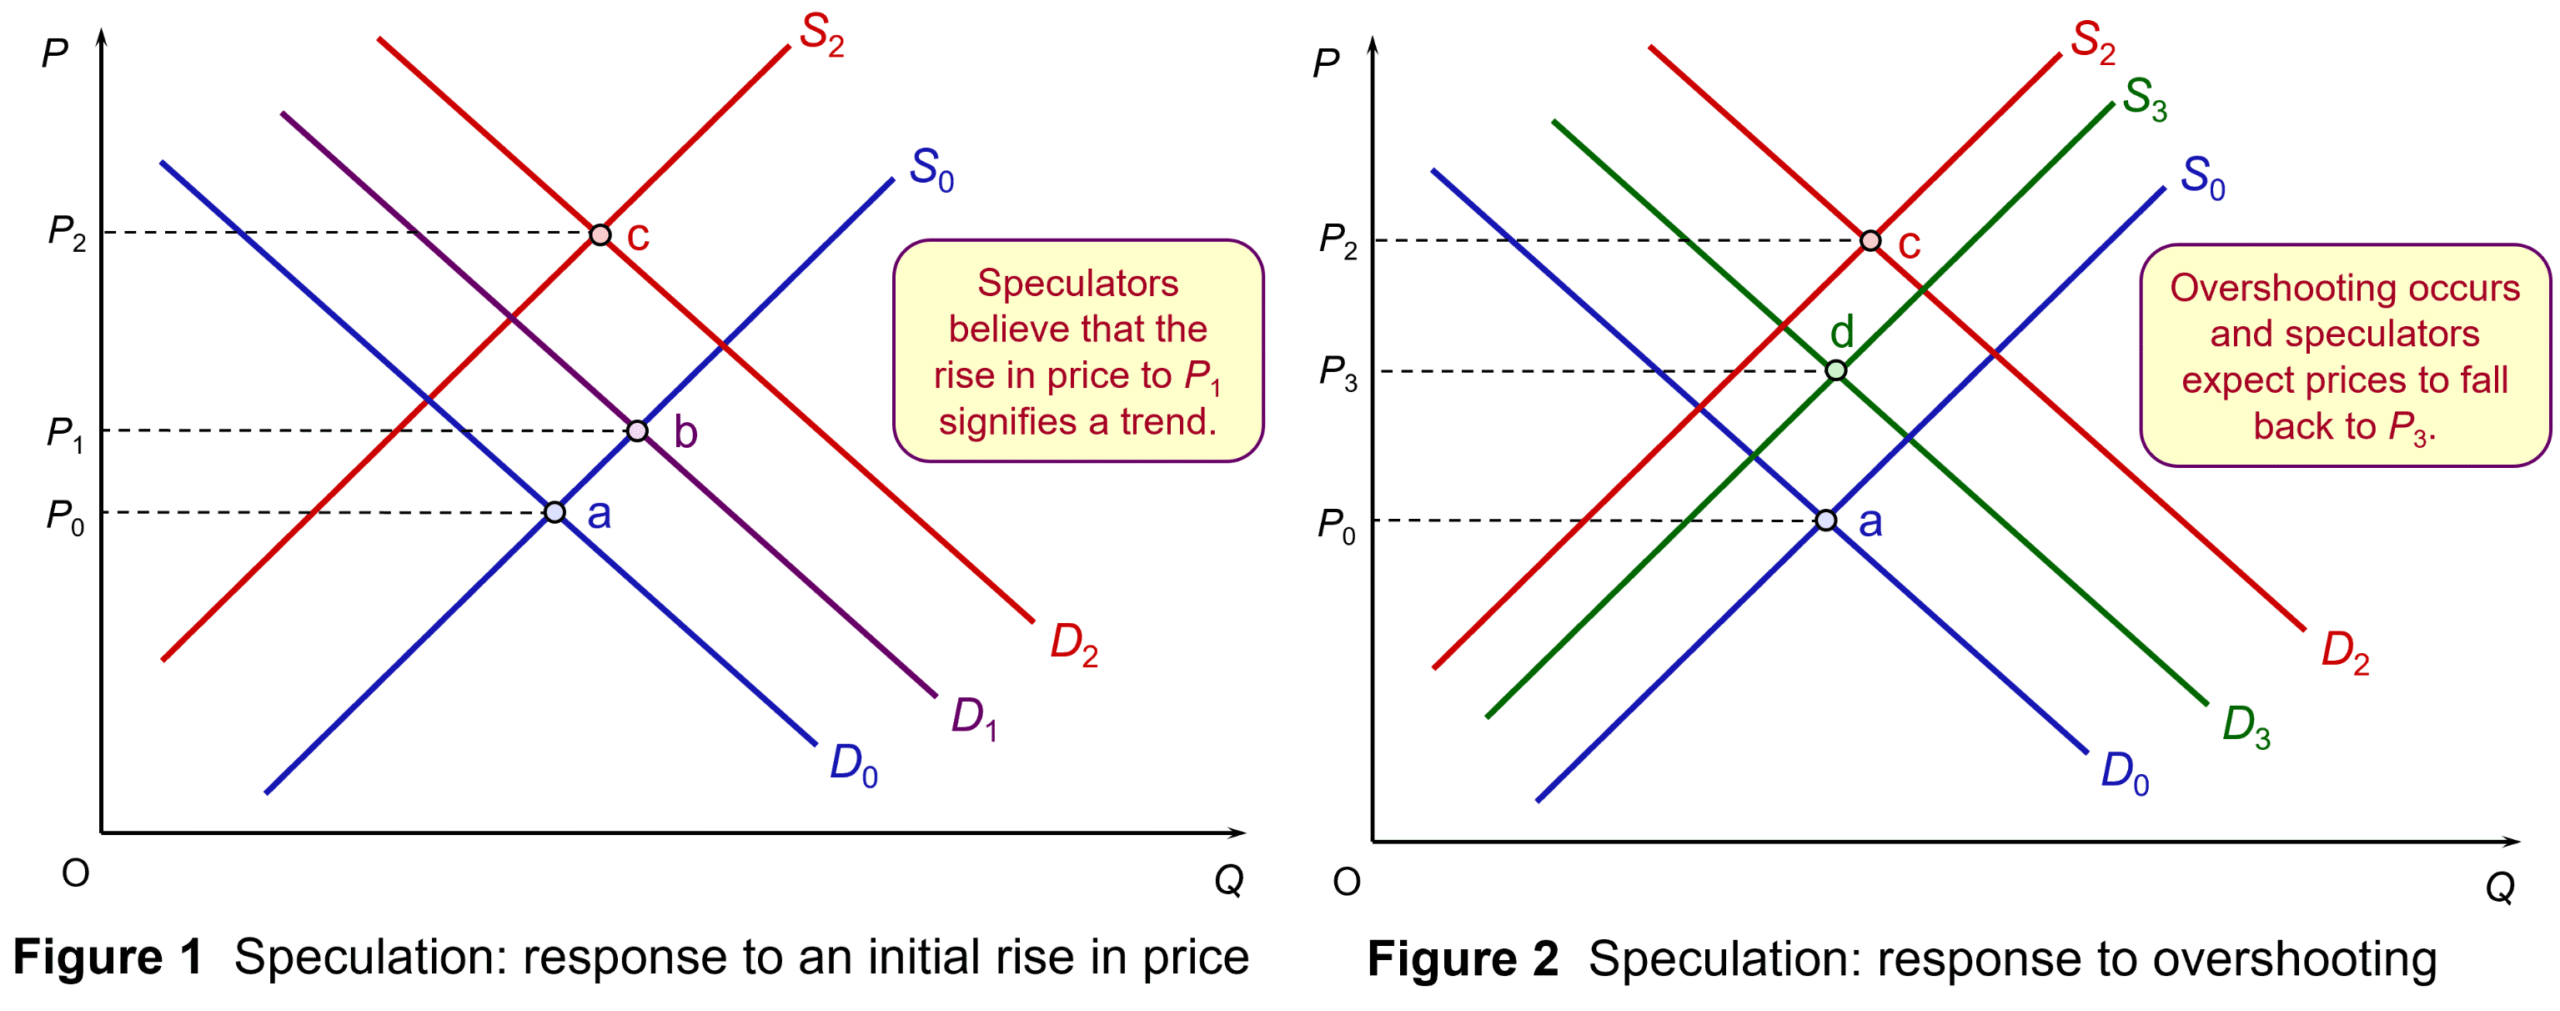
This is illustrated in Figure 1. Assume an initial rise in demand for a particular cryptocurrency from D0 to D1. Equilibrium moves from point a to point b and the price of the cryptocurrency rises from P0 to P1. Speculators believe that this is a trend and that prices will rise further. Demand increases to D2 as purchasers rush to buy; and supply falls to S2 as potential sellers of the crypto hold back. Equilibrium moves to point c and price rises to P2.
But in their exuberance, people may have pushed the price above the level that reflects underlying demand and supply. People respond to this overshooting by selling some of the currency to take advantage of what they see as a temporary high price. In Figure 2, supply rises from S2 to S3. Meanwhile, potential purchasers wait until price has settled back somewhat. Demand falls from D2 to D3. Equilibrium moves to point d, with price falling to P3. (Click here for a PowerPoint of the two diagrams.)

A similar process of speculation takes place when people expect prices to fall, with price potentially plummeting before it then recovers somewhat.
With computer algorithms interpreting underlying economic/political data, the price changes are likely to be frequent, with speculation amplifying these changes.
Articles
- Trump orders crypto working group to draft new regulations, explore national stockpile
Reuters, Hannah Lang and Trevor Hunnicutt (24/1/25)
- Bitcoin soars past $109,000 ahead of possible early action on crypto by Trump
MSN, Alan Suderman (20/1/25)
- 3 Things to Watch as Trump Becomes Memecoin Billionaire and US President
PYMNTS (20/1/25)
- Crypto Community Reacts to Trump and Melania Meme Coins as Market Sinks
Decrypt, Vismaya V (20/1/25)
- Trump’s plan for a strategic bitcoin reserve could trigger a crypto ‘arms race’ and reshape the global economic order
The Conversation, Huw Macartney, Erin McCracken and Robert Elliott (14/1/25)
- Bitcoin’s resurgence: A regulatory reset and a path to innovation
crypto.news, editorial (17/1/25)
- Bitcoin Retreats As Traders Await Trump Crypto Executive Order
Bloomberg on NDTV Profit (21/1/25)
- Bitcoin edges higher as investors shake off initial Trump Day One disappointment
Reuters, Tom Westbrook and Elizabeth Howcroft (21/1/25)
- Has bitcoin’s limited supply driven its rally? Experts weigh in
ABC News, Max Zahn (10/12/24)
Background information
Data
Questions
- What determines the supply of cryptocurrencies (a) in circulation; (b) to the market at any given time?
- Why are the prices of digital currencies so volatile?
- Why or why not are cryptocurrencies a good asset to hold?
- How may speculation (a) amplify and (b) dampen price fluctuations?
- What determines the net burn/net creation rate of ether?
- Should cryptocurrencies be classified as ‘money’?
 Coffee prices have been soaring in recent months. This applies to the prices of both coffee beans on international markets, coffee in supermarkets and coffee in coffee shops. In this blog we examine the causes and what is likely to happen over the coming months.
As we shall see, demand and supply analysis provides a powerful explanation of what has been happening in the various sectors of the industry and the likely future path of prices.
The coffee industry
The cultivating, processing and retailing of coffee is big business. It is the second most widely traded commodity after oil and around 2.5 billion cups are consumed worldwide on a daily basis. In the UK nearly 100 million cups of coffee a day are drunk, with coffee consumers spending around £4 billion per year on sit-down and takeaway coffees and on coffee bought in supermarkets and other shops for making at home. The average takeaway coffee costs around £3.40 per cup with speciality coffees costing more.
Global production in the coffee year 2023/24 was 178 million 60 kg bags (10.7 million tonnes) and the annual income of the whole sector exceeds $200 billion. Around 25 million farmers spread across 50 countries harvest coffee. The majority of these farms are small and family run. Some 100 million families worldwide depend on coffee for their living.
Brazil is by far the biggest producer and accounts for nearly 40% of the market. A good or poor harvest in Brazil can have a significant impact on prices. Vietnam and Columbia are the second and third biggest producers respectively and, with Brazil, account for over 60% of global production.
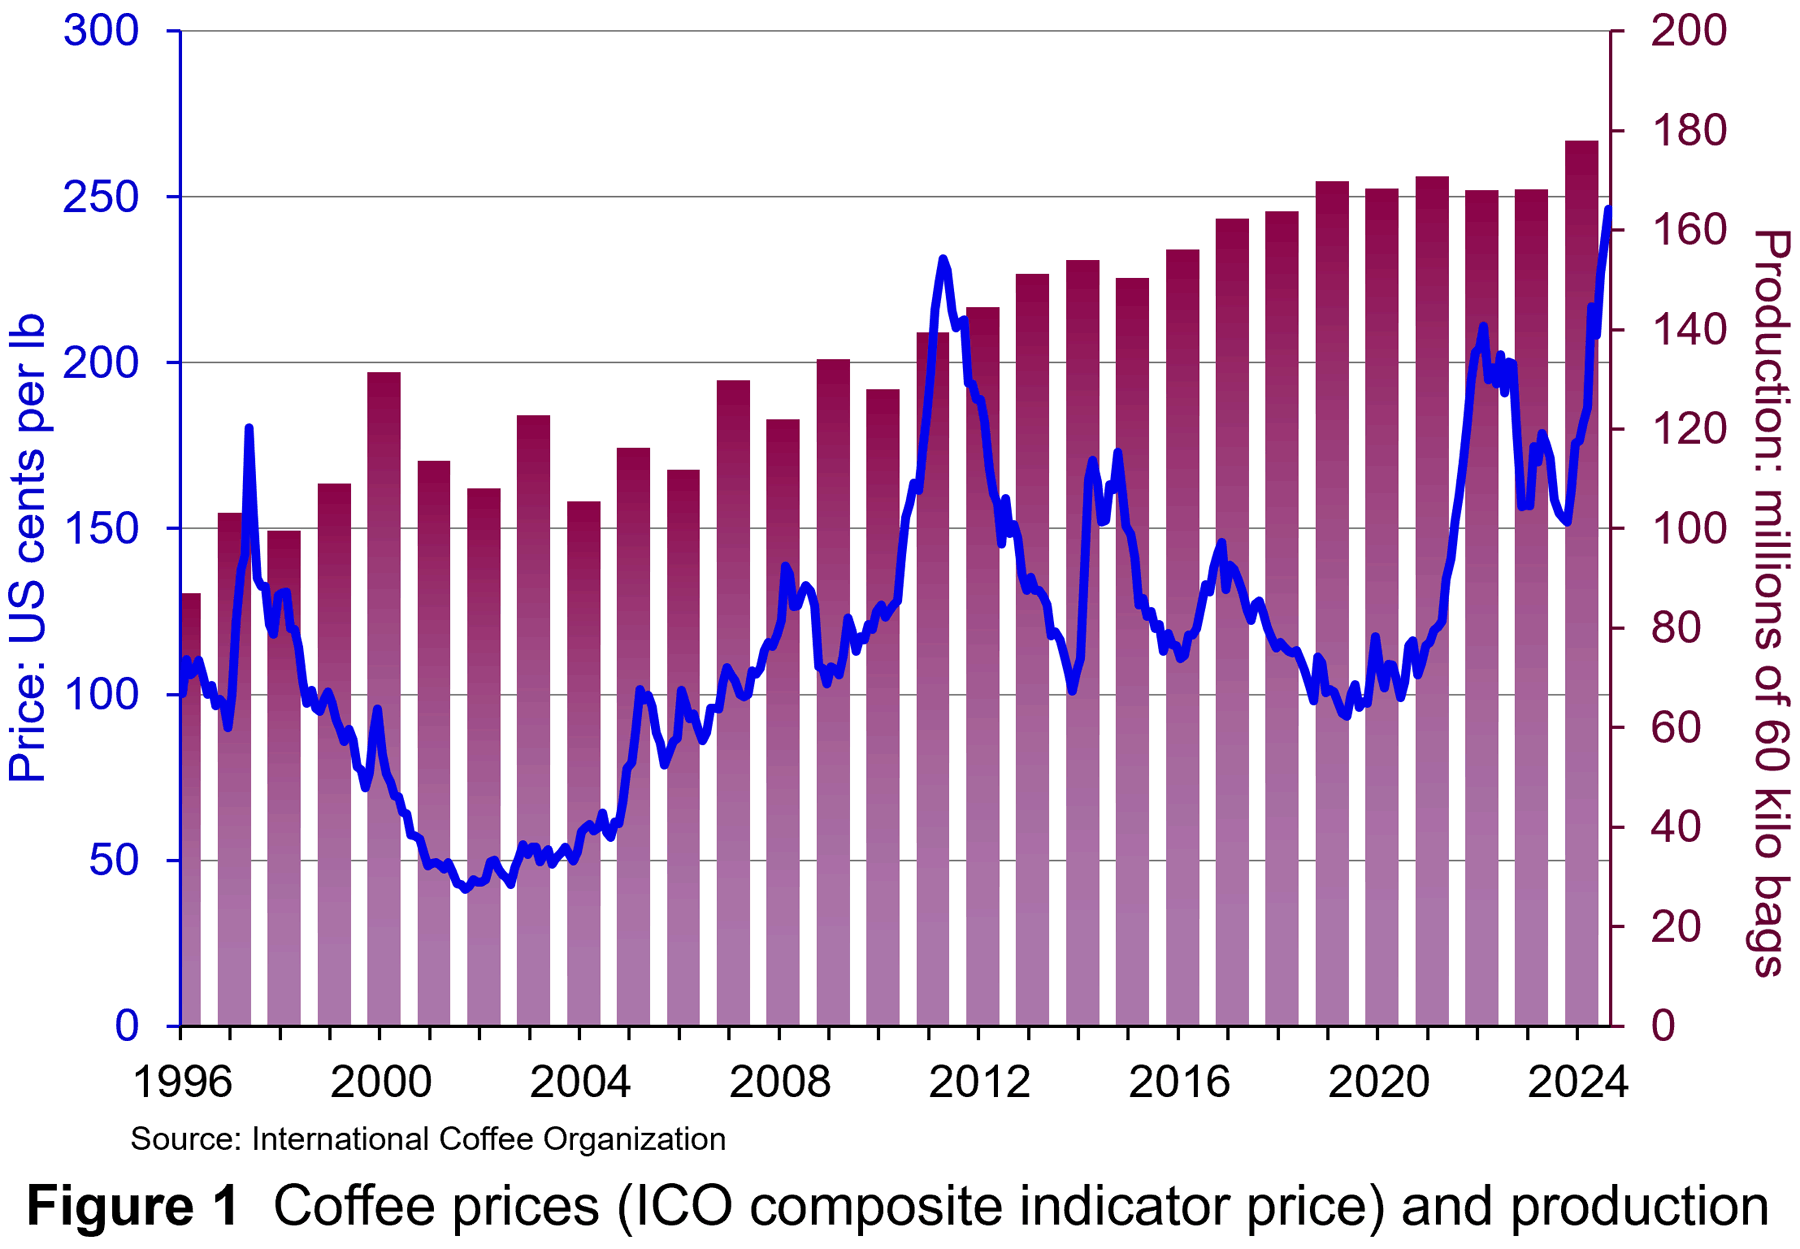 Coffee prices are extremely volatile – more so than production, which does, nevertheless, fluctuate with the harvest. Figure 1 shows global coffee production and prices since 1996. The price is the International Coffee Organization’s composite indicator price (I-CIP) in US cents per pound (lb). It is a weighted average of four prices: Colombian milds (Arabica), Other milds (Arabica), Brazilian naturals (mainly Arabica) and Robusta. Production is measured in 60 kilo bags.
Case Study 2.3 on the student website for Economics 11th edition, looks at the various events that caused the fluctuations in prices and supply illustrated in Figure 1 (click here for a PowerPoint). In this blog we focus on recent events.
Why are coffee prices rising?
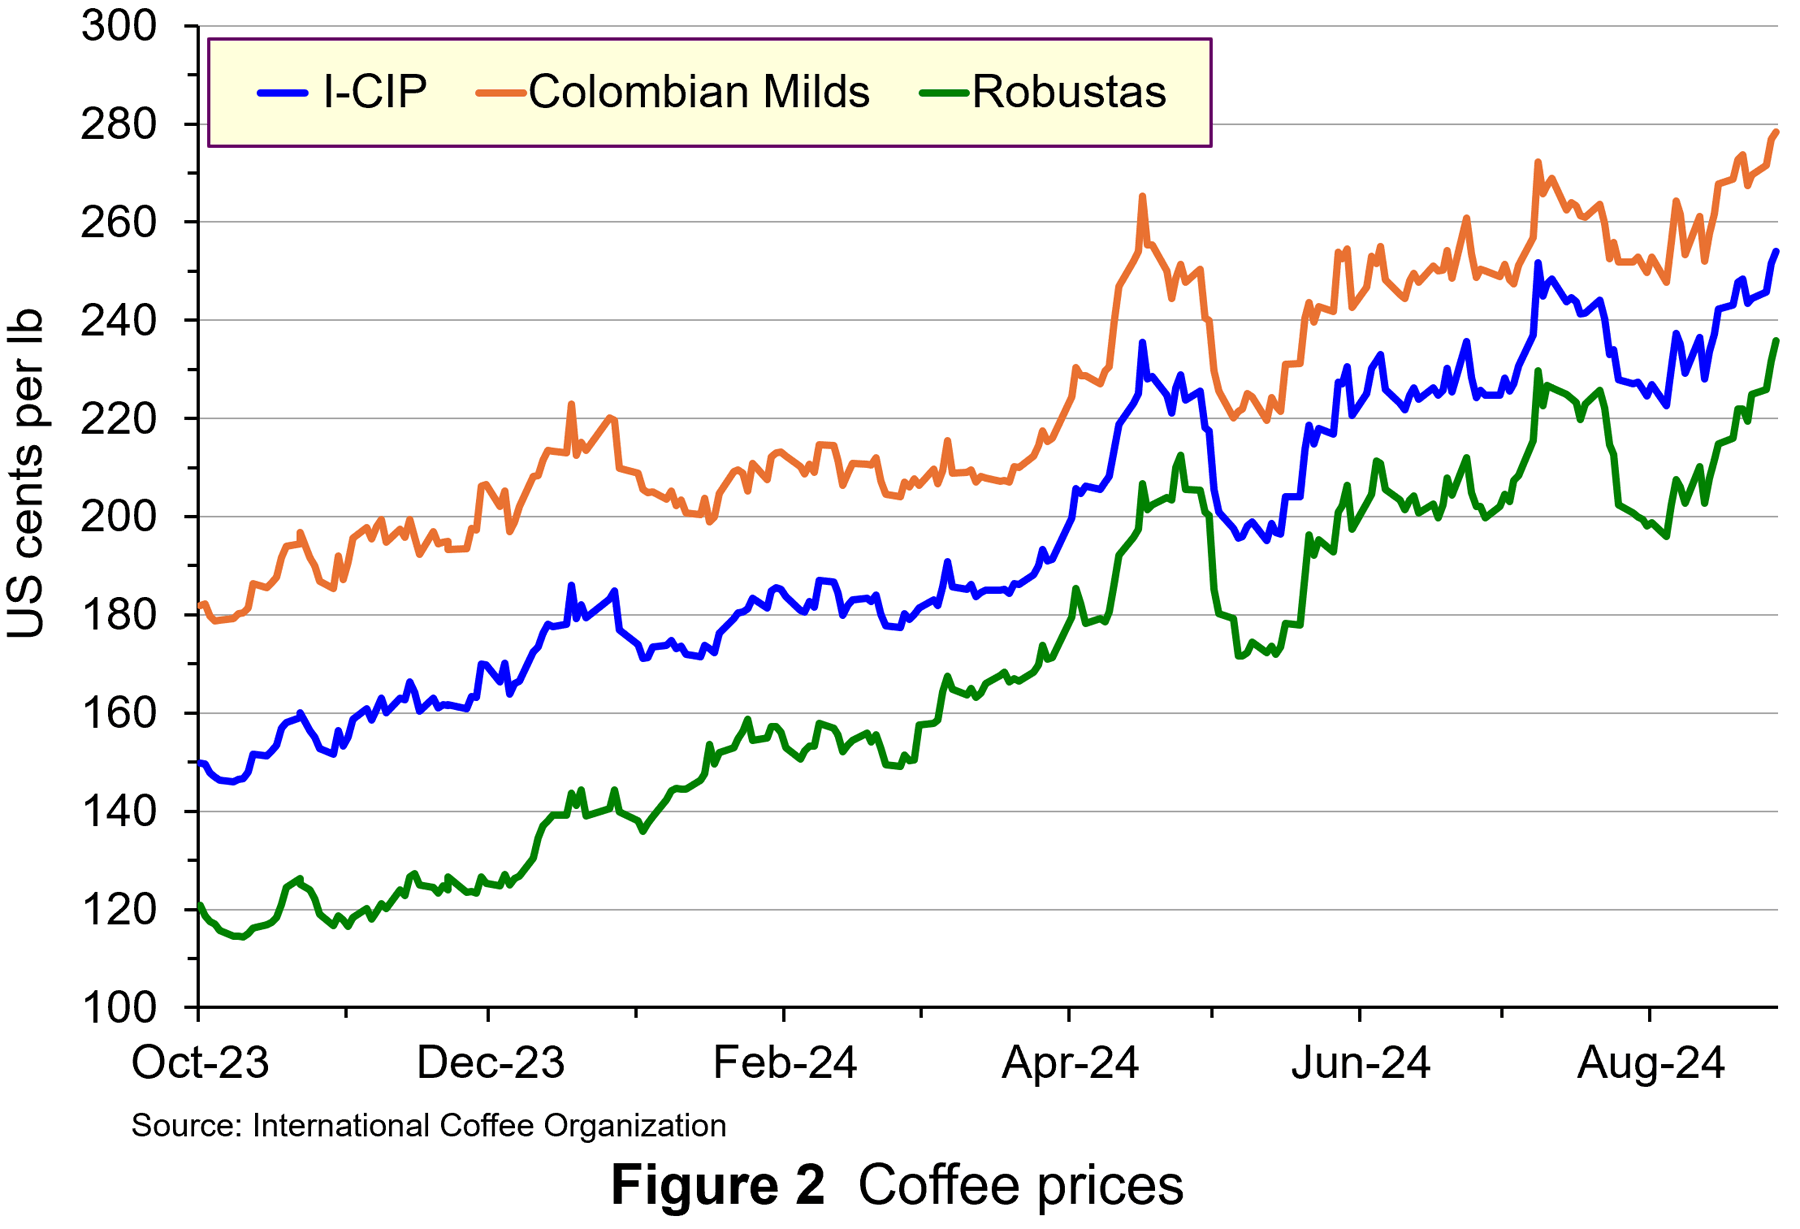 In early October 2023, the ICO composite indicator price (I-CIP), was $1.46 per lb. By 28 August, it had reached $2.54 – a rise of 74%. Colombian milds (high-quality Arabica) had risen from $1.79 per lb to $2.78 – a rise of 55%. Robusta coffee is normally cheaper than Arabica. It is mainly used in instant coffee and for espressos. As the price of Arabica rose, so there was some substitution, with Robusta coffees being added to blends. But as this process took place, so the gap between the Arabica and Robusta prices narrowed. Robusta prices rose from $1.14 in early October 2023 to £2.36 in late August – a rise of 107%. These prices are illustrated in Figure 2 (click here for a PowerPoint).
This dramatic rise in prices is the result of a number of factors.
 Supply-side factors. The first is poor harvests, which will affect future supply. Frosts in Brazil have affected Arabica production. Also, droughts – partly the result of climate change – have affected harvests in major Robusta-producing countries, such as Vietnam and Indonesia. With the extra demand from the substitution for Arabica, this has pushed up Robusta prices as shown in Figure 2. Another supply-side issue concerns the increasingly vulnerability of coffee crops to diseases, such as coffee rust, and pests. Both reduce yields and quality.
As prices have risen, so this has led to speculative buying of coffee futures by hedge funds and coffee companies. This has driven up futures prices, which will then have a knock-on effect on spot (current) prices as roasters attempt to build coffee stocks to beat the higher prices.
There have also been supply-chain problems. Attacks on shipping by Houthi rebels in the Red Sea have forced ships to take the longer route around the Cape of Good Hope. Again, this has particularly affected the supply of Robusta, largely grown in Asia and East Africa.
New EU regulation banning the import of coffee grown in areas of cleared rainforest will further reduce supply when it comes into force in 2025, or at least divert it away from the EU – a major coffee-consuming region.
 Demand-side factors. On the demand side, the rise of the coffee culture and a switch in demand from tea to coffee has led to a steady growth in demand. Growth in the coffee culture has been particularly high in Asian markets as rapid urbanistion, a growing middle class and changing lifestyles drive greater coffee consumption and greater use of coffee shops. This has more than offset a slight decline in coffee shop sales in the USA. In the UK, the number of coffee shops has risen steadily. In 2023, there were 3000 cafés, coffee chains and other venues serving coffee, of which 9885 were branded coffee shop outlets, such as Costa, Caffè Nero and Starbucks. Sales in such coffee chains rose by 11.9% in 2023. Similar patterns can be observed in other countries, all helping to drive a rise in demand.
But although demand for coffee in coffee shops is growing, the rise in the price of coffee beans should have only a modest effect on the price of a cup of coffee. The cost of coffee beans purchased by a coffee shop accounts for only around 10% of the price of a cup. To take account of the costs to the supplier (roasting, distribution costs, overheads, etc), this price paid by the coffee shop/chain is some 5 times the cost of unroasted coffee beans on international markets. In other words, the international price of coffee beans accounts for only around 2% of the cost of a cup of coffee in a coffee shop.
Higher coffee-shop prices are thus mainly the result of other factors. These include roasting and other supplier costs, rising wages, rents, business rates, other ingredients such as milk and sugar, coffee machines, takeaway cups, heating, lighting, repairs and maintenance and profit. The high inflation over the past two years, with several of these costs being particularly affected, has been the major driver of price increases in coffee shops.
The future
 The rise in demand and prices over the years has led to an increase in supply as more coffee bushes are planted. As Figure 1 shows, world supply increased from 87 million in 1995/6 to 178 million 60 kilo bags in 2023/4 – a rise of 105%. The current high prices may stimulate farmers to plant more. But as it can take four years for coffee plants to reach maturity, it may take time for supply to respond. Later on, a glut might even develop! This would be a case of the famous cobweb model (see Case Study 3.13 on the Essentials of Economics 9th edition student website).
Nevertheless, climate change is making coffee production more vulnerable and demand is likely to continue to outstrip supply. Much of the land currently used to produce Arabica will no longer be suitable in a couple of decades. New strains of bean may be developed that are more hardy, such as variants of the more robust Robusta beans. Whether this will allow supply to keep up with demand remains to be seen.
Articles
- Even more expensive coffee prices are brewing, but there are some good reasons why
The Conversation, Jonathan Morris (31/7/24)
- Coffee is becoming a luxury, and there’s no escaping it
AccuWeather, Erika Tulfo (1/8/24)
- Coffee prices will rise even higher, says Giuseppe Lavazza
The Guardian, Jonathan Yeboah (9/7/24)
- Coffee prices set to rise even higher, warns Italian roaster Lavazza
Financial Times, Susannah Savage (9/7/24)
- Soaring coffee prices force roasters to add lower-cost beans to blends
Financial Times, Susannah Savage (24/8/24)
- Soaring coffee prices foretell a financial grind
Reuters, Robert Cyran (31/8/24)
- Projected Coffee Price Increase Due to Supply Shortages and Rising Demand
ISN Magazine: International Supermarket News (14/8/24)
- Coffee Market Report
International Coffee Organization (July 2024)
- Strengthening global robusta production: an update
World Coffee Research: News (4/12/23)
- Houthi rebels and the EU make your coffee more expensive
Politico, Carlo Martuscelli (13/8/24)
Data
Questions
- Use a demand and supply diagram to compare the coffee market in August 2024 with that in October 2023.
- How is the price elasticity of demand relevant to determining the size of price fluctuations in response to fluctuations in the supply of coffee? Demonstrate this with a supply and demand diagram.
- How has speculation affected coffee prices?
- What are ‘coffee futures’? How do futures prices relate to spot prices?
- What is likely to happen to coffee prices in the coming months? Explain.
- Why have Robusta prices risen by a larger percentage than Arabica prices? Is this trend likely to continue?
- Look at the price of Colombian Arabica coffee in your local supermarket. Work out what the price would be per lb and convert it to US dollars. How does this retail price compare with the current international price for Colombian milds and what accounts for the difference? (For current information on Colombian milds, see the third data link above.)
- Distinguish between the fixed and variable costs of an independent coffee shop. How should the coffee shop set its prices in relation to these costs and to demand?
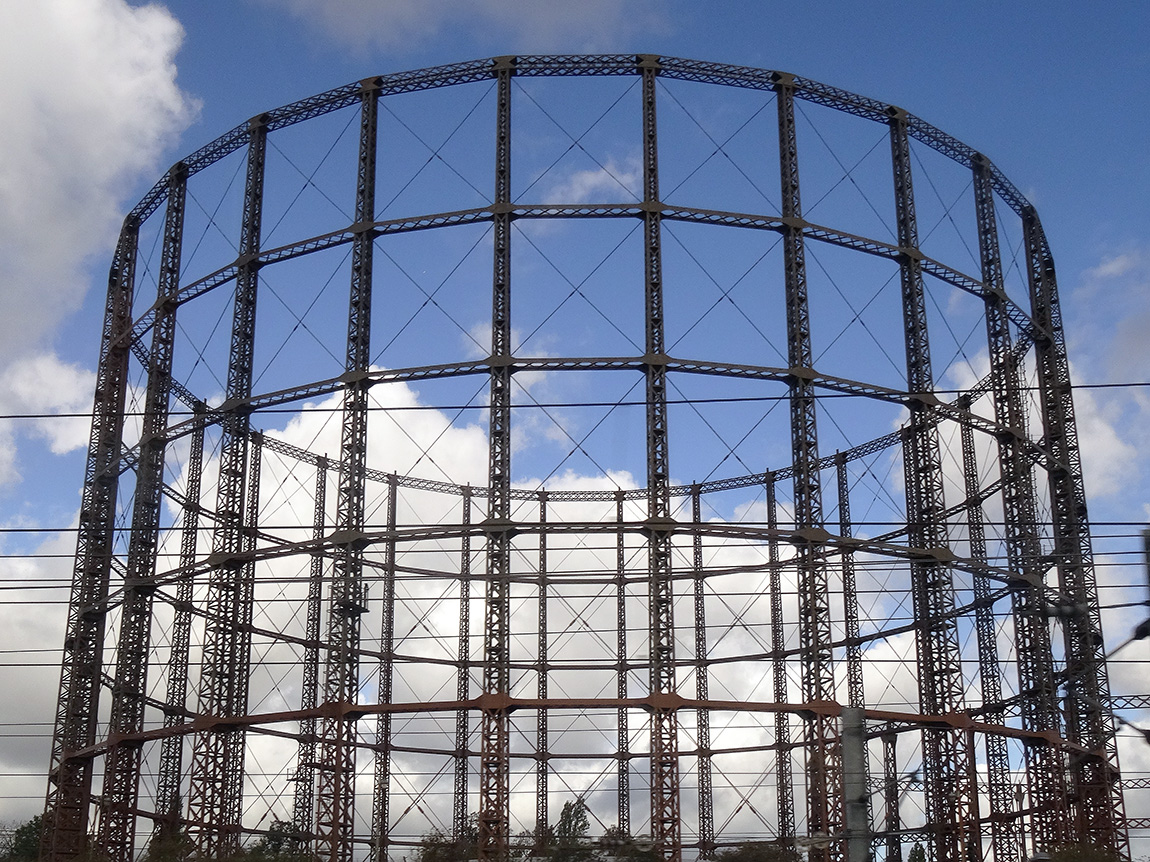 The global battle for fuel is expected to peak this winter. The combination of rising demand and a tightening of supply has sparked concerns of shortages in the market. Some people are worried about another ‘winter of discontent’. Gas prices have risen fivefold in Europe as a whole.
In the UK, consumers are likely to find that the natural gas needed to heat their homes this October will cost at least five times more than it did a year ago. This surge in wholesale gas prices has seen several UK energy suppliers stop trading as they are unable to make a profit. This is because of an energy price cap for some consumers and various fixed price deals they had signed with their customers.
There are thus fears of an energy crisis in the UK, especially if there is a cold winter. There are even warnings that during a cold snap, gas supply to various energy-intensive firms may be cut off. This comes at a time when some of these industries are struggling to make a profit.
Demand and supply
The current situation is a combination of long- and short-term factors. In spring 2020, the demand for gas actually decreased due to the pandemic. This resulted in low gas prices, reduced UK production and delayed maintenance work and investment along global supply chains. However, since early 2021, consumer demand for gas has soared. First, there was an increased demand due to the Artic weather conditions last winter. This was then followed by heatwaves in the USA and Europe over the summer, which saw an increase in the use of air conditioning units. With the increased demand combined with calm weather conditions, wind turbines couldn’t supply enough power to meet demand.
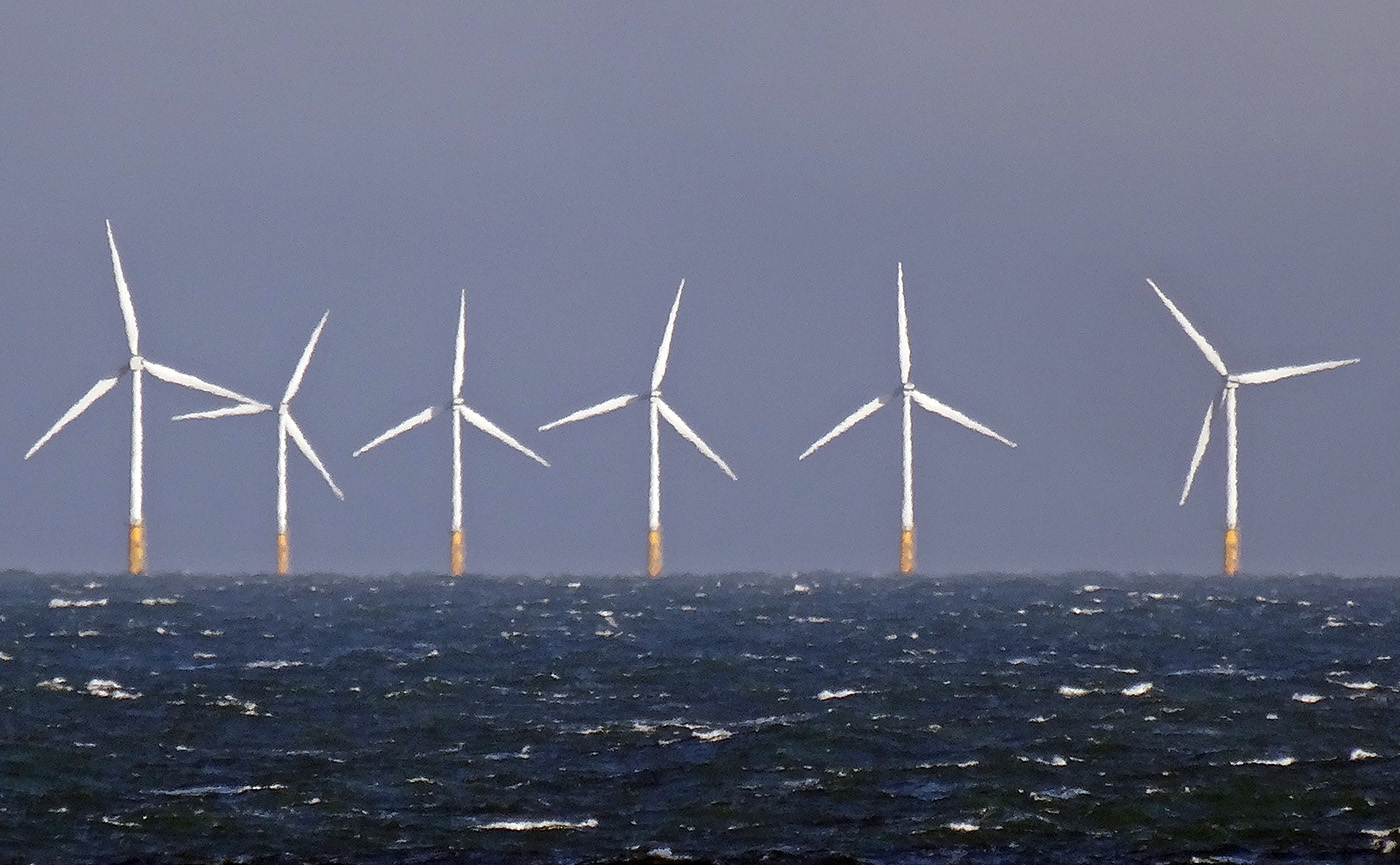 There has also been a longer-term impact on demand throughout the industry due to the move to cleaner energy. The transitioning to wind and solar has seen a medium-term increase in the demand for gas. There is also a long-term impact of the target for net zero economies in the UK and Europe. This has hindered investors’ willingness to invest in developing supplies of fossil fuels due the fact they could become obsolete over the next few decades.
Nations have also been unable to build up enough supplies for winter. This is partly due to Europe’s domestic gas stocks having declined by 30% per cent in the past decade. This heightened situation is leading to concerns that there will be black-outs or cut-offs in gas this winter.
Importation of gas
 A concern for the UK is that it has scant storage facilities with no long-term storage. The UK currently has very modest amounts of storage – less than 6% of annual demand and some five times less than the average in the rest of Europe. It has been increasingly operating a ‘just-in-time model’, which is more affected by short-term price fluctuations in the wholesale gas market. With wind power generation remaining lower than average during summer 2021, more gas than usual has been used to generate electricity, leaving less gas to go into storage.
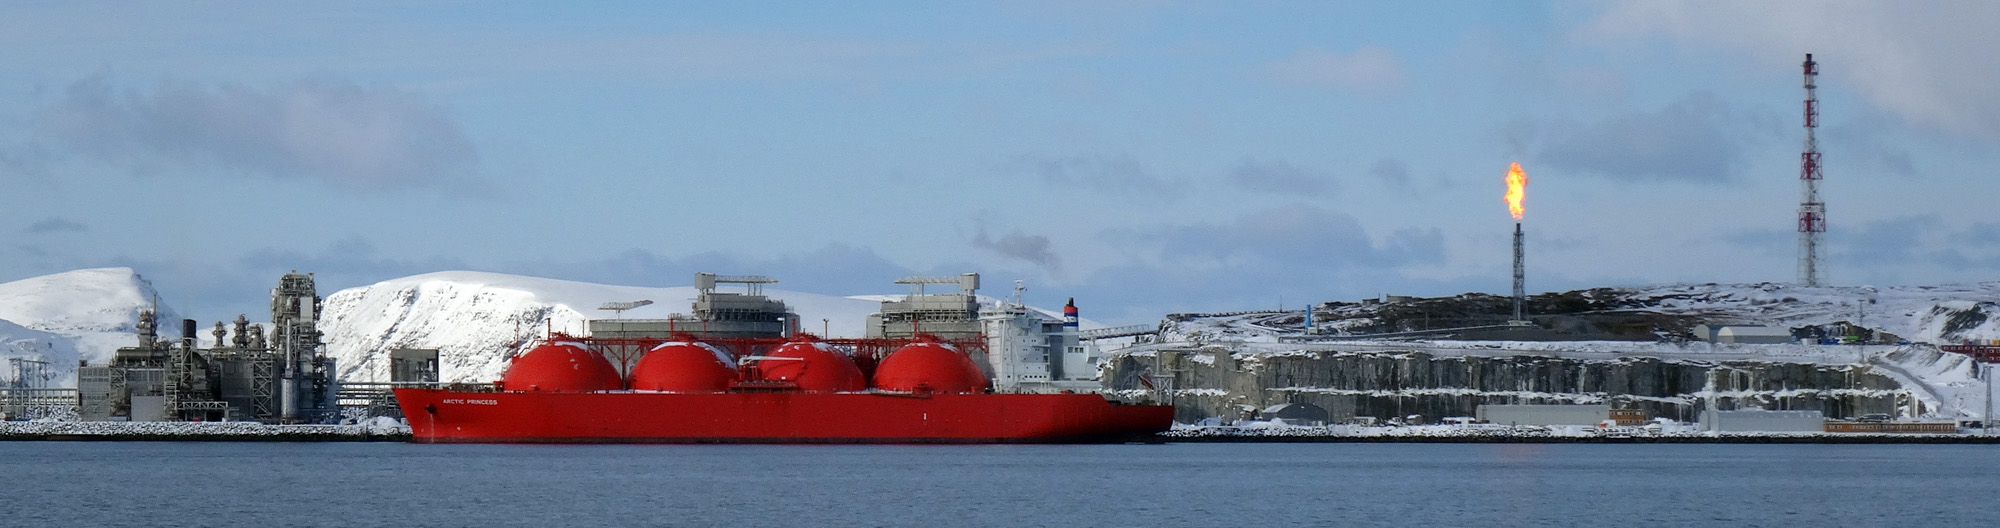
However, some argue that the problem is not just the UK’s physical supply of gas but demand for gas from elsewhere. Around half of the UK’s supply comes from its own production sites, while the rest is piped in from Europe or shipped in as liquefied natural gas (LNG) from the USA, Qatar and Russia. In 2019, the UK imported almost 20% of its gas through LNG shipments. However, Asian gas demand has grown rapidly, expanding by 50% over the past decade. This has meant that LNG has now become much harder to secure.
The issue is the price the UK has to pay to continue receiving these supplies. Some in the gas industry believe the price surge is only temporary, caused by economic disruptions, while many others say it highlights a structural weakness in a continent that has become too reliant on imported gas. It can be argued that the gas crisis has highlighted the lack of a coherent strategy to manage the gas industry as the UK transitions to a net zero economy. The lack of any industry investment in new capacity suggests that there is currently no business case for new long-term storage in the UK, especially as gas demand is expected to continue falling over the longer term.
Impact on consumers and industry
 Gas prices for suppliers have increased fivefold over the past year. Therefore, many companies face a considerable rise in their bills. MSome may need to reduce or pause production – or even cease trading – which could cause job losses. Alternatively, they could pass on their increased costs to customers by charging them higher prices. Although energy-intensive industries are particularly exposed, every company that has to pay energy bills will be affected. Due to the growing concerns about the security of winter gas supplies those industries reliant on gas, such as the fertiliser industry, are restricting production, threatening various supply chains.
Most big domestic gas suppliers buy their gas months in advance, meaning they will most likely pass on the higher price rises they have experienced in the past few months. The increased demand and decreased supply has already meant meant that customers have faced higher prices for their energy. The UK has been badly hit because it’s one of Europe’s biggest users of natural gas – 85% of homes use gas central heating – and it also generates a third of the country’s electricity.
The rising bills are particularly an issue for those customers on a variable tariff. About 15 million households have seen their energy bills rise by 12% since the beginning of October due to the rise in the government’s energy price cap calculated by the regulator, Ofgem. A major concern is that this increase in bills comes at a time when the need to use more heating and lighting is approaching. It also coincides with other price rises hitting family budgets and the withdrawal of COVID support schemes.
Government intervention – maximum pricing
If the government feels that the equilibrium price in a particular market is too high, it can intervene in the market and set a maximum price. When the government intervenes in this way, it sets a price ceiling on certain basic goods or services and does not permit the price to go above that set limit. A maximum price is normally set for reasons of fairness and to benefit consumers on low incomes. Examples include energy price caps to order to control fuel bills, rent controls in order to improve affordability of housing, a cap on mobile roaming charges within the EU and price capping for regional monopoly water companies.
The energy price cap
 Even without the prospect of a colder than normal winter, bills are still increasing. October’s increase in the fuel cap means that many annual household fuel bills will rise by £135 or more. The price cap sets the maximum price that suppliers in England, Wales and Scotland can charge domestic customers on a standard, or default tariff. The cap has come under the spotlight owing to the crisis among suppliers, which has seen eleven firms fold, with more expected.
The regulator Ofgem sets a price cap for domestic energy twice a year. The latest level came into place on 1 October. It is a cap on the price of energy that suppliers can charge. The price cap is based on a broad estimate of how much it costs a supplier to provide gas and electricity services to a customer. The calculation is mainly made up of wholesale energy costs, network costs such as maintaining pipes and wires, policy costs including Government social and environmental schemes, operating costs such as billing and metering services and VAT. Therefore, suppliers can only pass on legitimate costs of supplying energy and cannot charge more than the level of the price cap, although they can charge less. A household’s total bill is still determined by how much gas and electricity is used.
- Those on standard tariffs, with typical household levels of energy use, will see an increase of £139.
- People with prepayment meters, with average energy use, will see an annual increase of £153.
- Households on fixed tariffs will be unaffected. However, those coming to the end of a contract are automatically moved to a default tariff set at the new level.
Ordinarily, customers are able to shop around for cheaper deals, but currently, the high wholesale prices of gas means that cheaper deals are not available.
Despite the cap limiting how much providers can raise prices, the current increase is the biggest (and to the highest amount) since the cap was introduced in January 2019. As providers are scarcely making a profit on gas, there are concerns that a further increase in wholesale prices will cause more suppliers to be forced out of business. Ofgem said that the cap is likely to go up again in April, the next time it is reviewed.
Conclusion
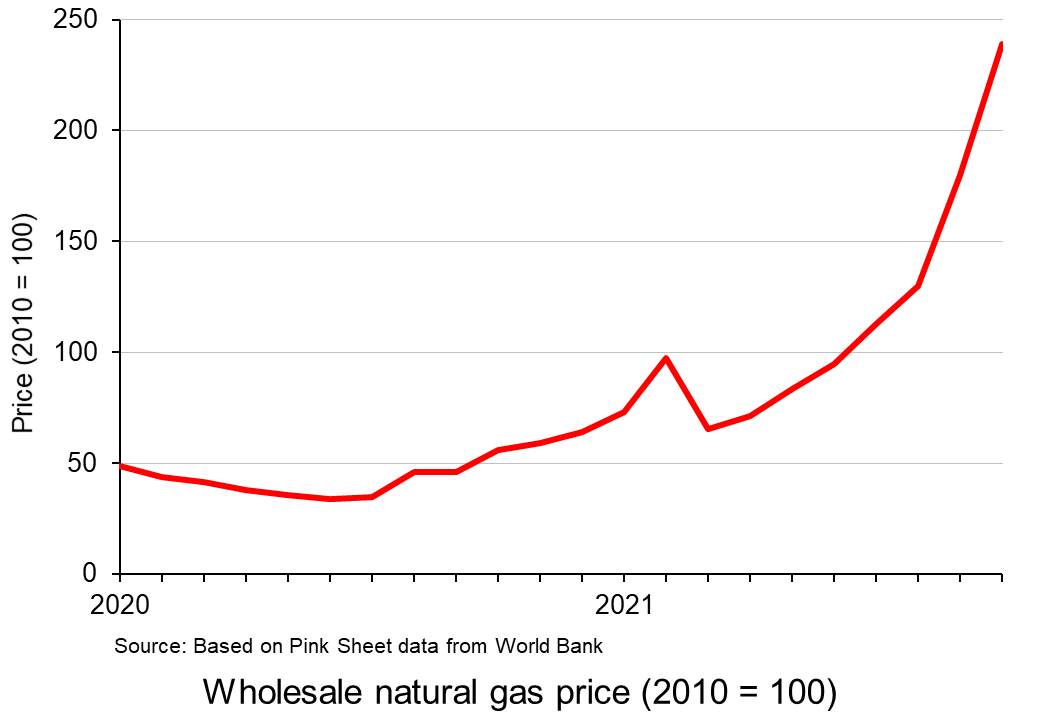 The record prices being paid by suppliers and deficits in gas supply across the world have stoked fears that the energy crisis will get worse. It comes at a time when households are already facing rising bills, while some energy-intensive industries have started to slow production. This has started to dent optimism around the post-pandemic economic recovery.
Historically, UK governments have trusted market mechanisms to deliver UK gas security. However, consumers are having to pay the cost of such an approach. The price cap has meant the UK’s gas bills have until now been typically lower than the EU average. However, the rise in prices comes on top of other economic problems such as labour shortages and increasing food prices, adding up to an unwelcome rise in the cost of living.
Video
Articles
UK government/Ofgem
Questions
- Using a supply and demand diagram, illustrate what has happened in the energy market over the past year.
- What are the advantages and disadvantages of government intervention in a free market?
- Explain why it is necessary for the regulator to intervene in the energy market.
- Using the concept of maximum pricing, illustrate how the price cap works.
 In its latest Commodity Special Feature (pages 43 to 53 of the October 2020 World Economic Outlook), the IMF examines the future of oil and other commodity prices. With the collapse in oil demand during the early stages of the coronavirus pandemic, oil prices plummeted. Brent crude fell from around $60 per barrel in late January to below $20 in April.
However, oil prices then rose somewhat and have typically been between $40 and $45 per barrel since June 2020 – still more than 35% lower than at the beginning of the year (see chart below: click here for a PowerPoint). This rise was caused by a slight recovery in demand but largely by supply reductions. These were the result partly of limits agreed by OPEC+ (OPEC, Russia and some other non-OPEC oil producing countries) and partly of reduced drilling in the USA and the closure of many shale oil wells which the lower prices had made unprofitable.
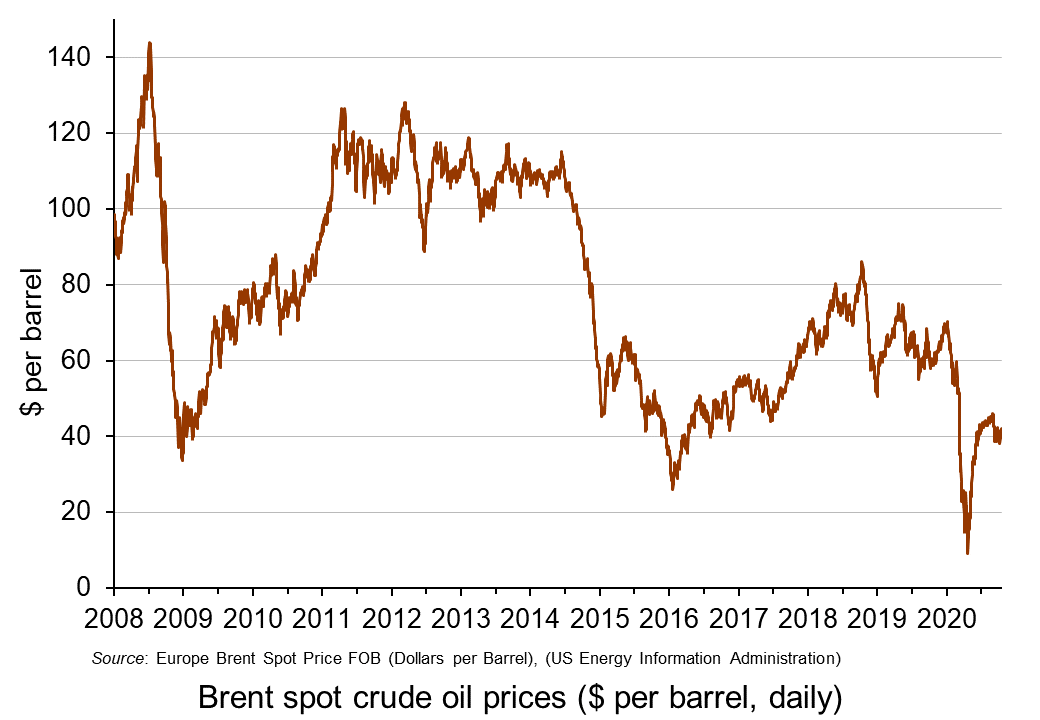 The IMF considers the future for oil prices and concludes that prices will remain subdued. It forecasts that petroleum spot prices will average $47 per barrel in 2021, up only slightly from the $42 average it predicts for 2020.
On the supply side it predicts that ‘stronger oil production growth in several non-OPEC+ countries, a faster normalization of Libya’s oil production, and a breakdown of the OPEC+ agreement’ will push up supply and push down prices. Even if the OPEC+ agreement holds, the members are set to ease their production cut by nearly 25% at the start of 2021. This rise in supply will be offset to some extent by possibly ‘excessive cuts in oil and gas upstream investments and further bankruptcies in the energy sector’.
On the demand side, the speed of the recovery from the pandemic will be a major determinant. If the second wave is long-lasting and deep, with a vaccine available to all still some way off, oil demand could remain subdued for many months. This will be compounded by the accelerating shift to renewable energy and electric vehicles and by government policies to reduce CO2 emissions.
Report
Articles
Oil price data
Questions
- Describe a scenario in which oil prices rebound significantly over the coming months. Illustrate your answer with a supply and demand diagram.
- Describe a scenario in which oil prices fall over the coming months. Again, illustrate your answer with a supply and demand diagram.
- How are the price elasticities of demand and supply relevant to the size of any oil price change?
- Project forward 10 years and predict whether oil prices will be higher or lower than now. What are the major determinants of supply and demand in your prediction?
- What are oil futures? What determines oil future prices?
- How does speculation affect oil prices?
