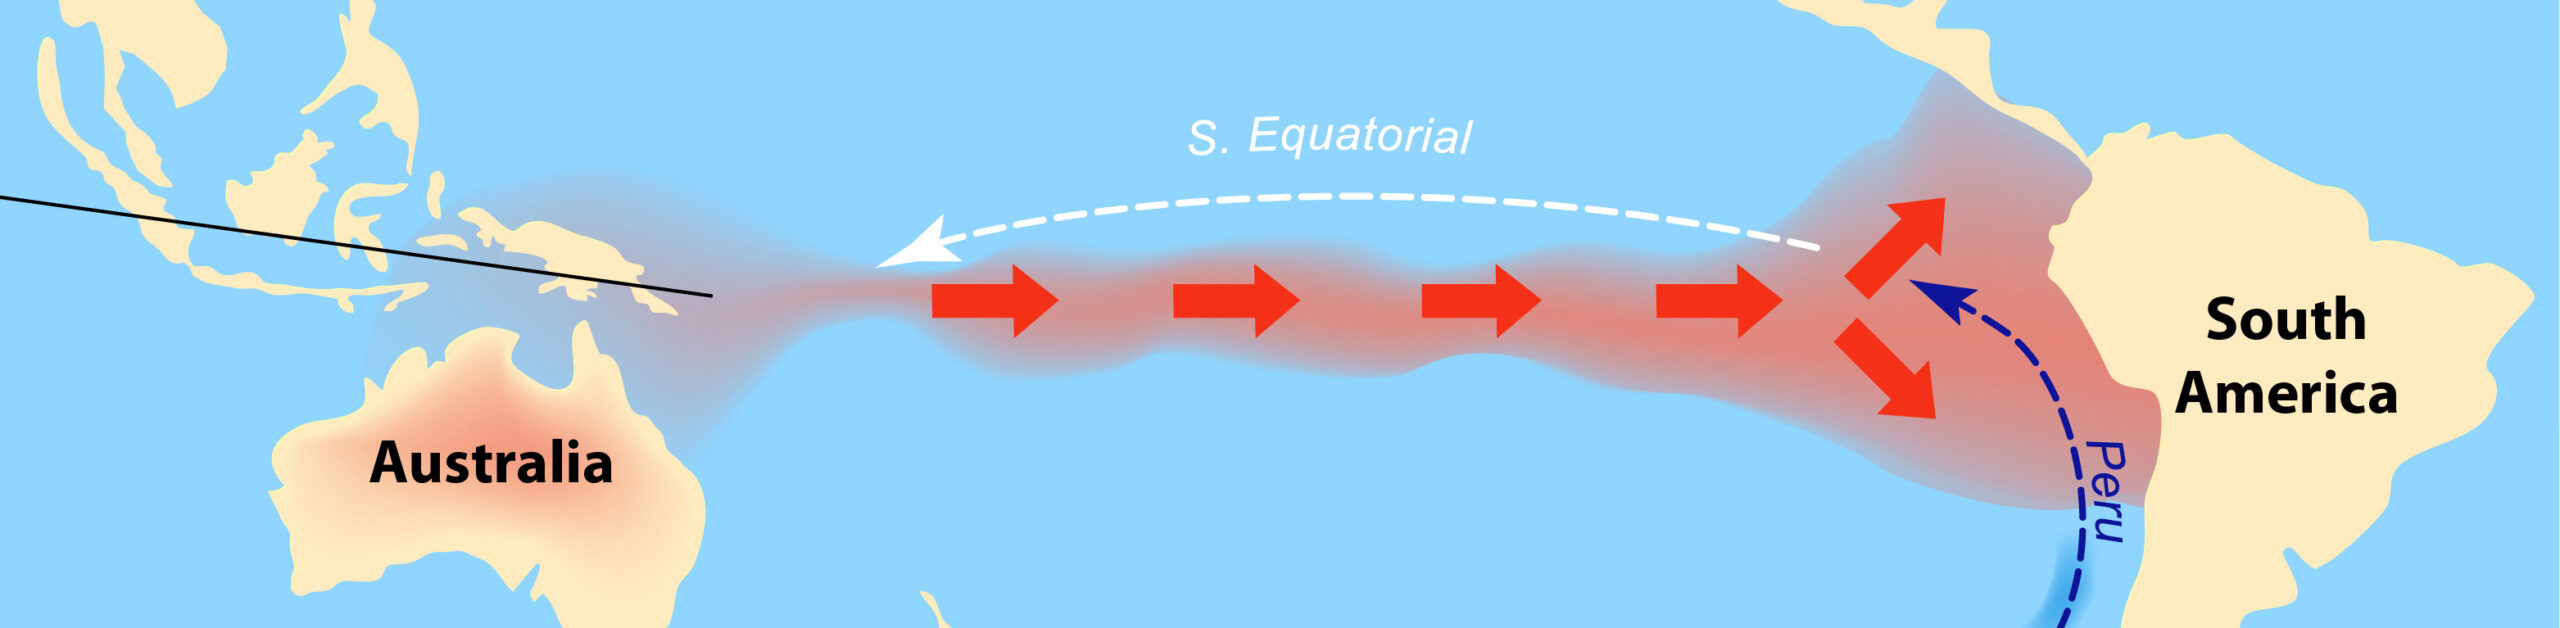
The World Meteorological Organization predicts that a ‘super El Niño’ is building. This has been nicknamed ‘Godzilla’. If forecasts are correct, this will be the most extreme El Niño in 1000 years.
El Niño is a natural phenomenon. It occurs when the surface temperatures in the central and eastern tropical Pacific Ocean warm and cause the trade winds that typically blow from east to west across the Pacific Ocean to weaken or even reverse direction. As well as increasing global temperatures and causing intense heatwaves, it can result in droughts in some parts of the world, such as eastern Australia, south-east Asia and southern Africa, and intense rain and flooding in parts of South America, eastern Africa and south-western North America.
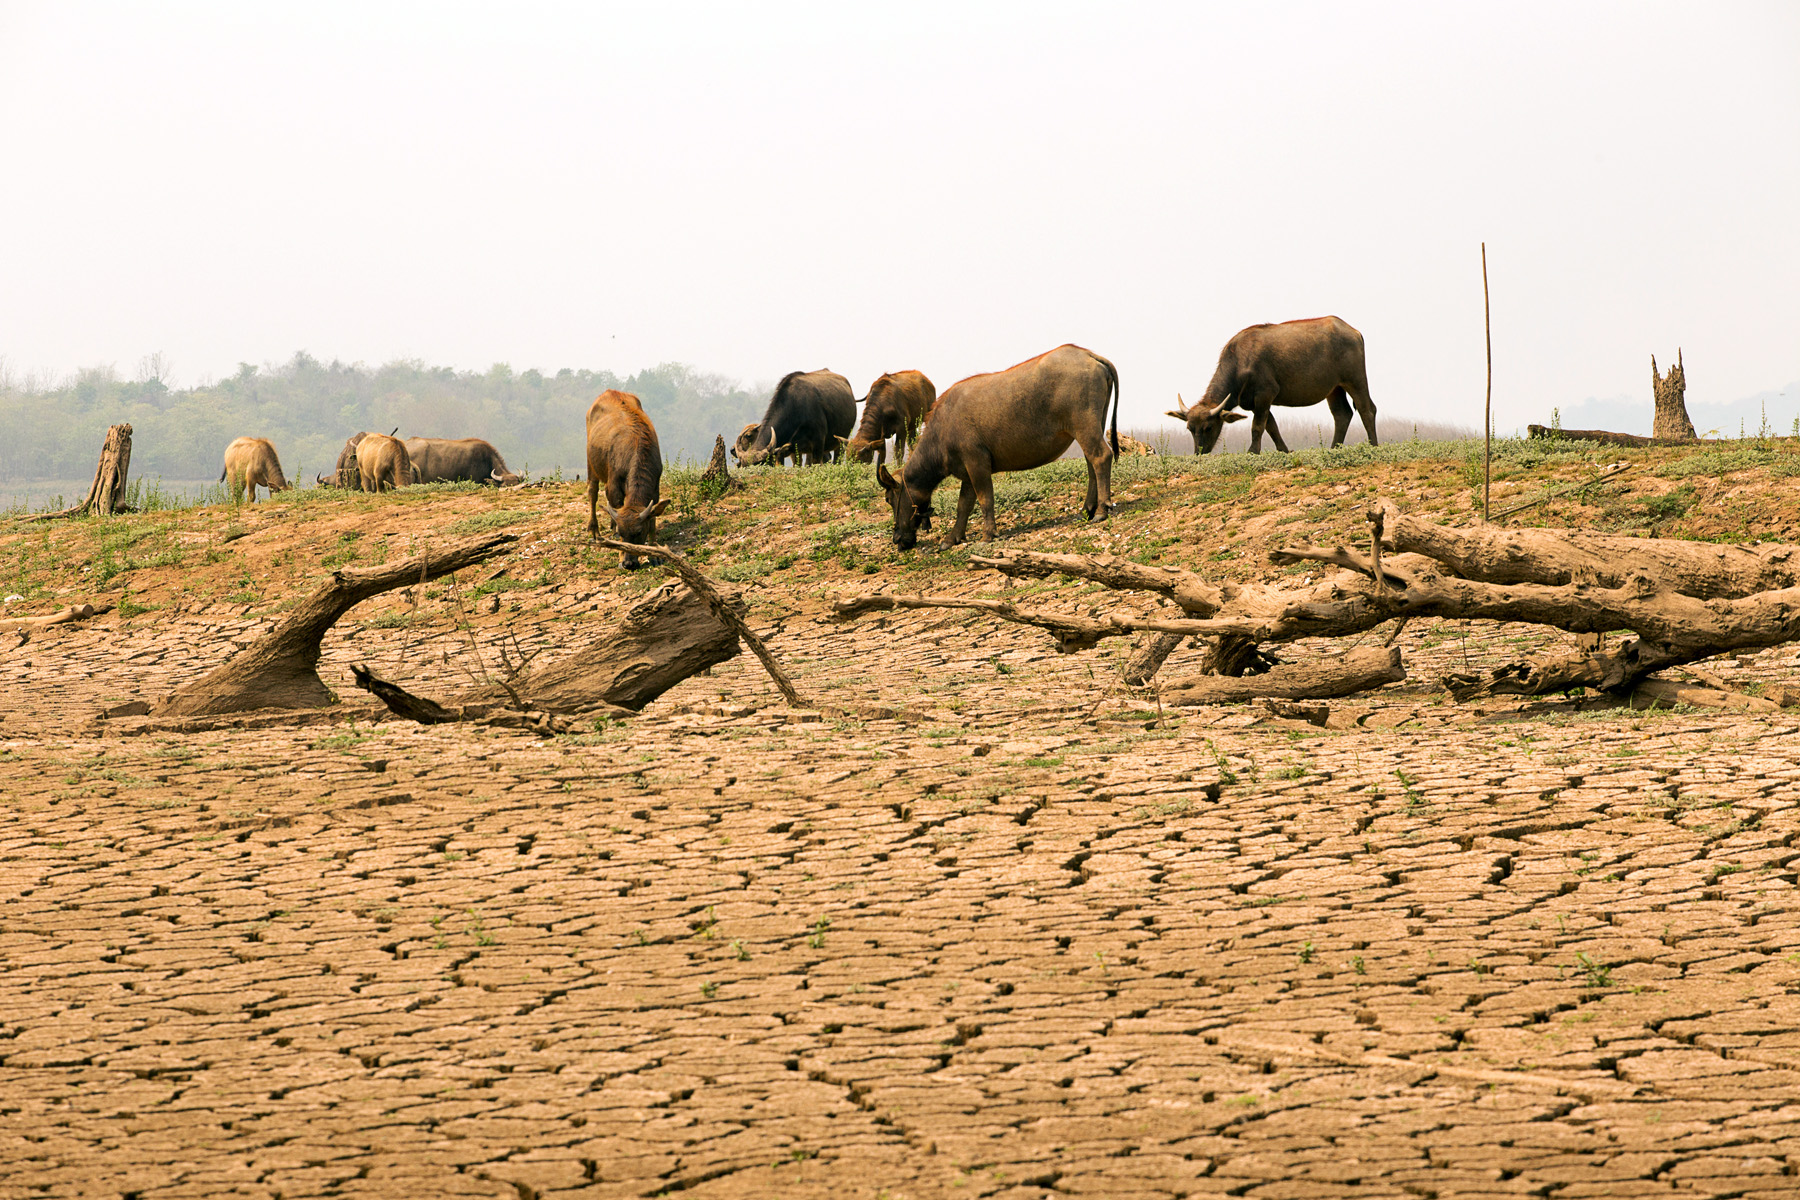
Typically, in an El-Niño event, the surface temperature of the central-eastern equatorial Pacific Ocean rises by 1°C to 1.5°C above the average. In the current El Niño, it is forecast to rise by up to 4°C by the end of 2026 and into 2027. It is already between 2.2°C and 2.6°C above the average. The effects could be catastrophic and hence the term ‘Godzilla’.
Although El Niño is a natural phenomenon, its severity is a direct result of climate change. This in turn is a direct result of economic decisions, and the effects will have severe economic consequences.
The economic causes
Climate change is an external cost of private economic decisions. When people or organisations burn fossil fuels, the climate costs of the CO2 emissions are not borne by the emitter. They are an external cost. This is illustrated in the diagram below, which shows the costs and benefits of electricity production from fossil fuels. (Click here for a PowerPoint.)
In this example, to make things simple, we assume that the external climate costs begin with the first unit of electricity generated and increase at a constant rate. The marginal social cost (MSC) of electricity generation equals the marginal private costs (MPC) to the generating company plus the marginal external cost in production MECP.
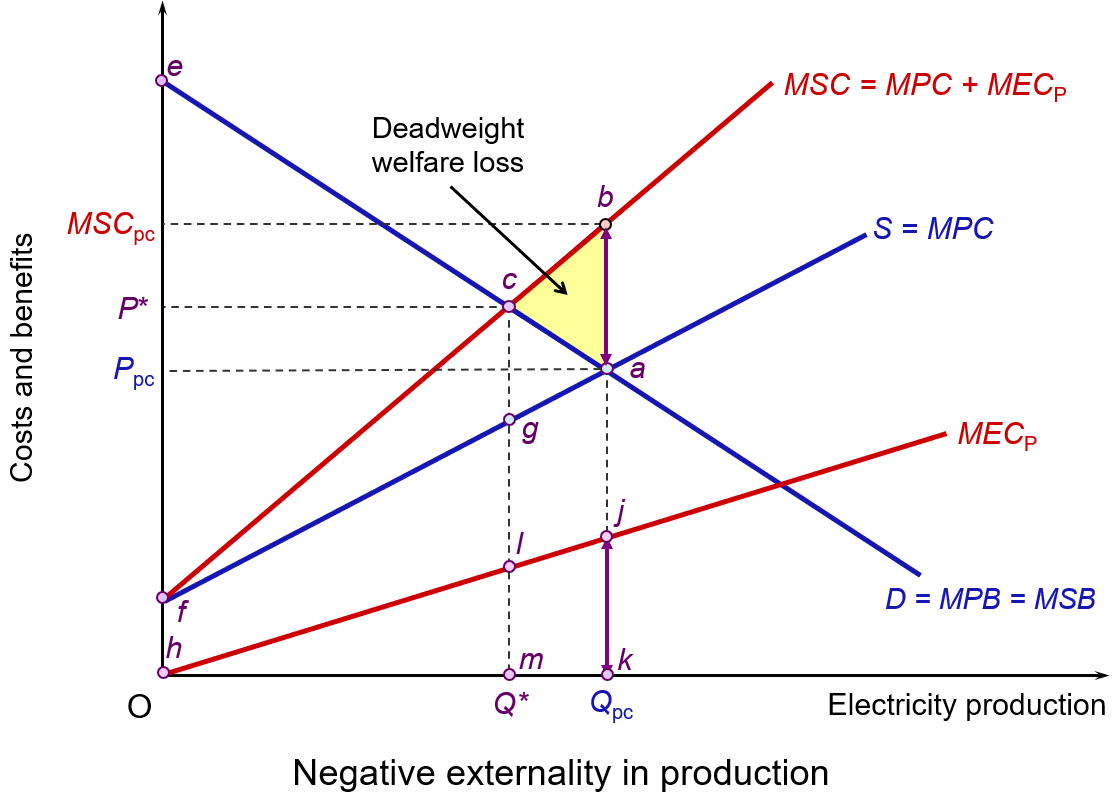 As you can see, the MSC curve is above the MPC curve. The vertical distance between them is equal to the MECP. It is also assumed that there are no externalities in consumption, which means that the marginal social benefit (MSB) curve is the same as the marginal private benefit (MPB) curve.
Competitive market forces, with producers and consumers responding only to private costs and benefits, will result in a market equilibrium at point a: i.e. where demand equals supply. The market equilibrium price is Ppc, while the market equilibrium quantity is Qpc. At Ppc, with no externalities on the consumption side, MPB is equal to MSB. The market price reflects both the private and social benefits from the last unit consumed. However, the presence of external costs in production means that MSC > MPC.
The socially optimal output would be Q*, where P = MSB = MSC, achieved at the socially optimal price of P*. This is illustrated at point c and clearly shows how external costs of production in a perfectly competitive market result in overproduction: i.e. Qpc > Q*. From society’s point of view, too much electricity is being produced from fossil fuels.
Total social surplus equals consumer surplus plus producer surplus minus the external costs. At the market equilibrium (Qpc) this is areas eaPpc+ Ppcaf – fba (or hjk, as it is the same size). At the socially optimal level of output (Q*) total social surplus is areas ecP* + P*cgf – fcg (or hlm).
Although consumer-plus-producer surplus is higher at the market equilibrium (Qpc) than at the socially optimum output (Q*) by the area cag, the external costs are higher still by the area cbag (or ljkm). Therefore, total social surplus at the market equilibrium is smaller than at the socially optimal point by area abc. This is a deadweight welfare loss and represents the excess of social costs over social benefits at all outputs above Q*. Put another way, moving from Qpc to Q* would represent a gain in social surplus of the area abc, as the fall in external costs outweighs the fall in consumer-plus-producer surplus.
One of the reasons why external environmental costs cause problems in a free-market economy is that no one has legal ownership of the atmosphere. Therefore, nobody has the ability either to prevent or to charge for their use as a ‘dumping ground’ for CO2. Such a ‘market’ is missing. Control must, therefore, be left to the government, international organisations, local authorities or regulators.
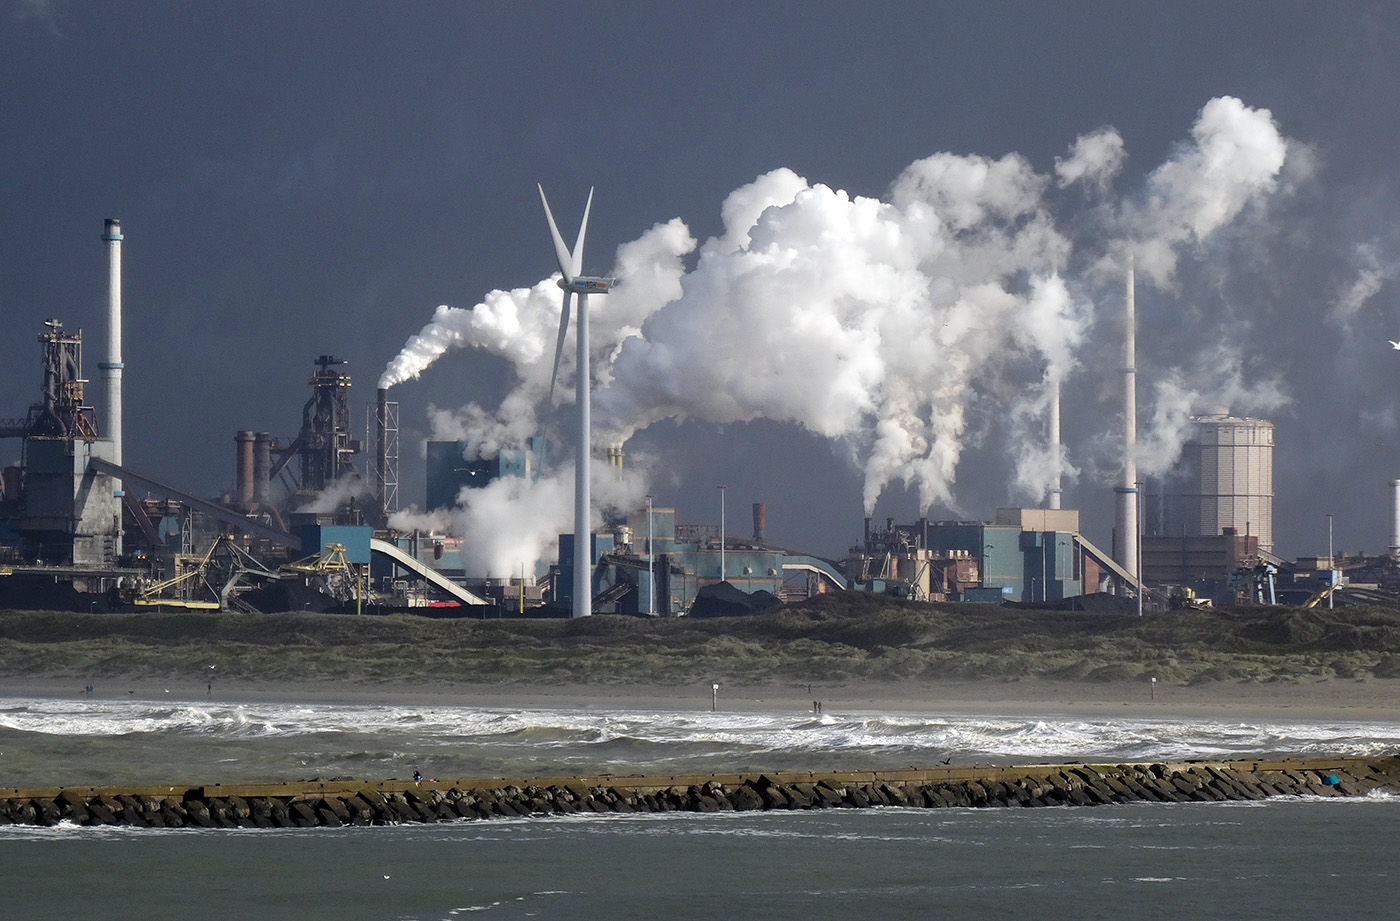 But such control is often too little. For example, when President Trump came to office in January 2025, he announced that the USA would withdraw from the UN’s Paris Agreement on climate change and that his policy towards oil production would be to ‘drill, baby, drill’. Indeed, governments globally spend hundreds of billions of dollars a year in subsidising oil, gas and coal production and its use, partly from pressure from the fossil fuel industry and partly to reduce the cost of living for consumers. This embeds fossil fuel dependence.
Game theory can help to explain the slow process of carbon reduction. For an individual country, such as the USA, it might argue that its optimum solution would be for other countries to cut their emissions, while maintaining its own levels. This approach would yield most of the benefits to the USA and none of the costs. However, when all countries argue like this, no progress is made. It’s a prisoners’ dilemma. Only if countries believe that the other countries will (a) ratify an agreement to cut emissions and (b) stick to the approved terms, is the agreement likely to succeed. This requires trust on all sides as well as the ability to monitor the outcomes.
Another major problem area concerns equity. Most countries will feel that they are being asked to do too much and that others are being asked to do too little. High-income countries will want to adopt a grandfathering approach. The starting point with this approach would be current levels of pollution. Every country would then be required to make the same percentage cut. Low-income countries, on the other hand, will want the bulk of the cuts, if not all of them, to be made by the rich countries. After all, the rich countries produce much higher levels of pollutants per capita than do the poor countries, and curbing growth in low-income countries would have a far more serious impact on levels of absolute poverty.
But will a supersized El Niño persuade countries to make deeper cuts in carbon emissions? In recent months commitments to achieving net zero emissions have waned. But the following economic consequences may encourage some countries to make deeper emissions cuts.
Economic consequences of a Godzilla El Niño
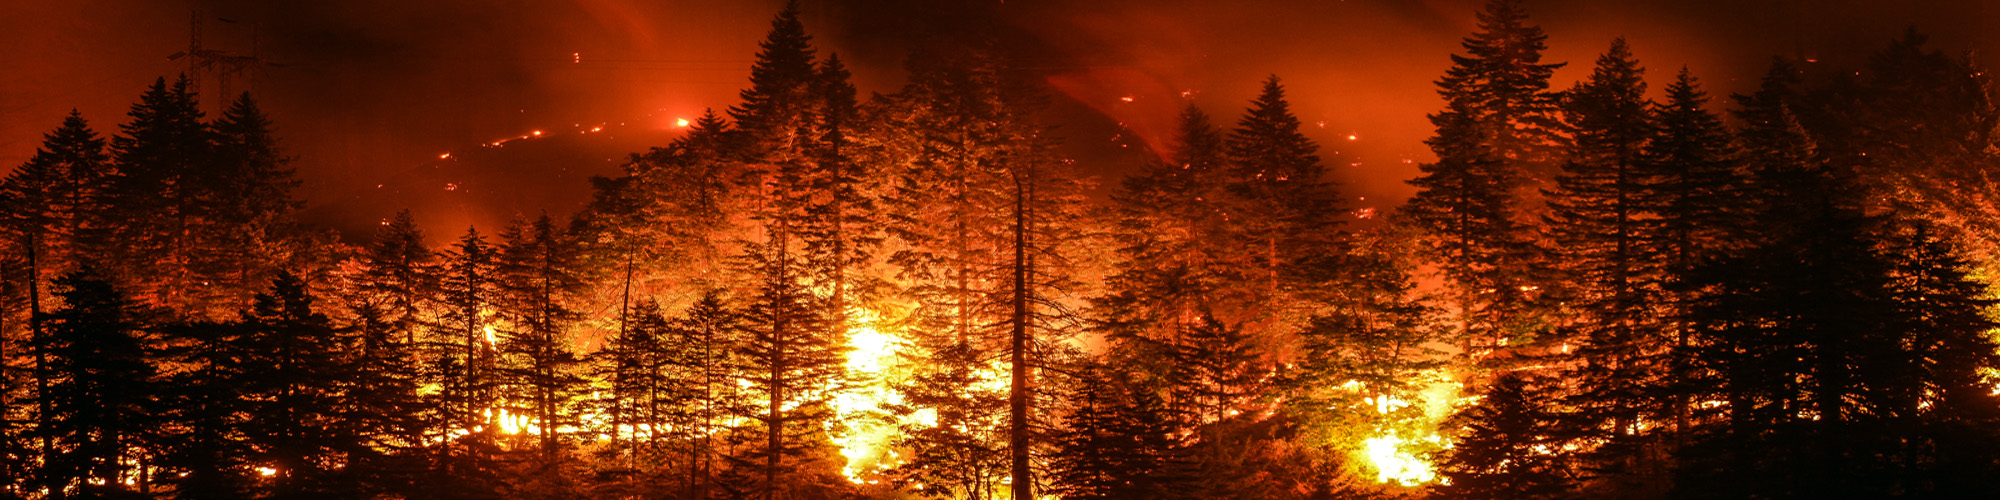
Extreme droughts, heat, wildfires and harvest failures in some areas and extreme rainfall and flooding in others will have severe economic consequences, often for the poorest people. There will be reductions in crop yields and loss of livelihood. Food prices will rise globally. This will add to the inflationary pressures from higher oil prices caused by the Iran war.
Droughts and wildfires in south-east Asia and Australia could have disastrous effects on harvests of palm oil, coffee, cocoa, rice, maize, wheat and various tropical fruits. Droughts and heat reduce output from hydropower and possibly wind energy, and industrial production may slow as a result of extreme heat in workplaces.
In Europe, warmer winters and unusually wet springs promote rapid plant growth. When this is followed by summer heatwaves, the undergrowth dries out and provides fuel for the wildfires. A super El Niño will amplify this. France and Spain have experienced massive wildfires these past few months. In the UK, the 2026 summer has been the hottest on record. The costs in Europe of the heat and wildfires in terms of lost crops and animals have been immense.
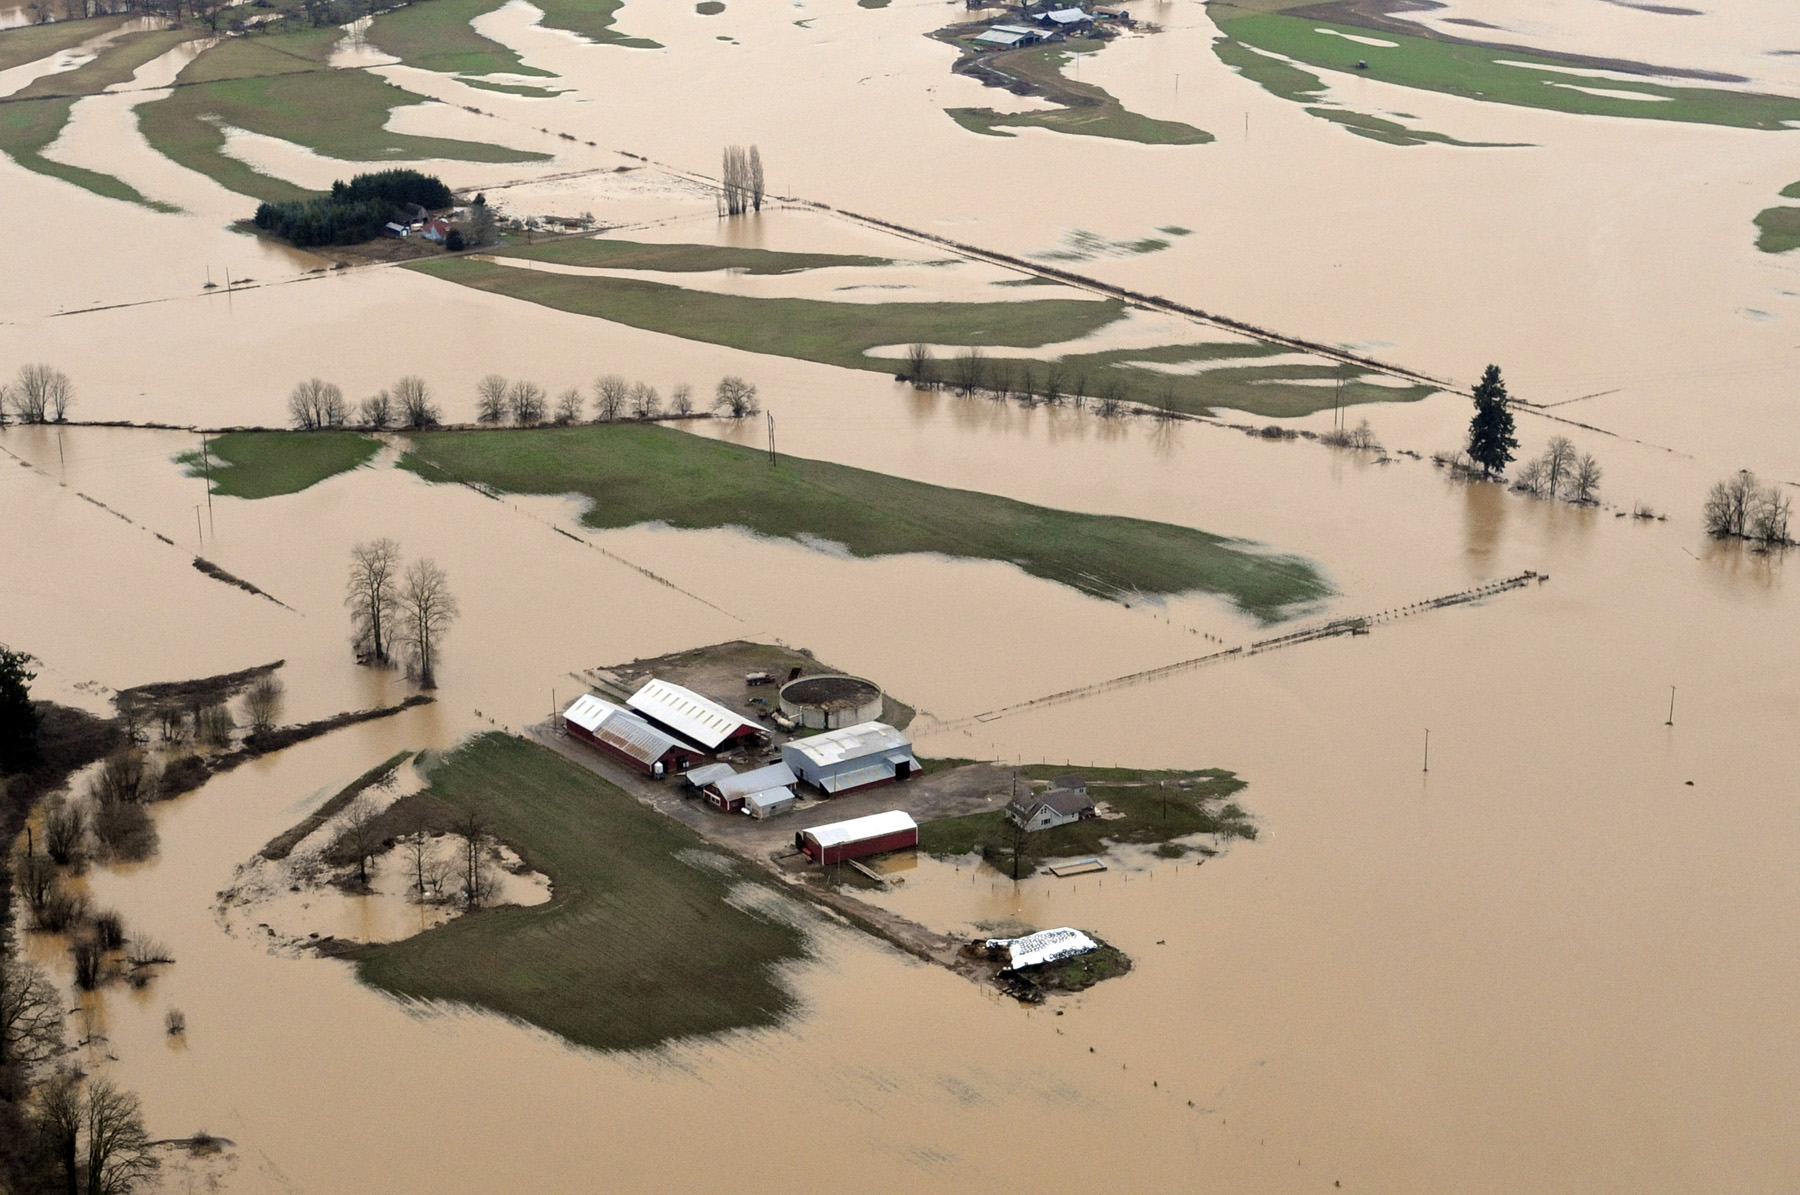 Floods and storms damage roads, power grids, railways and buildings. This forces governments to spend money on repairs instead of long-term investments. People are displaced and many are likely to lose their lives.
Fortunately, El Niños fade after a few months to be replaced by the cooler La Niña. The problem is that, with global warming, the next El Niño in a few years could be even more extreme with even more serious economic consequences.
The hope is that governments wake up to the pressing need to reduce carbon emissions.
Videos and podcast
Information
Articles
- Building climate-resilient agriculture in Europe: an economic perspective
European Environment Agency (17/3/26)
- What Super El Niño Means For Business Supply Chains And The Economy
Forbes, Chloe Demrovsky (25/8/26)
- A summer of extremes: Weathering a hotter world
CBS News, Jonathan Vigliotti (16/8/26)
- Area in Europe affected by wildfires could triple due to climate change
The National (UAE), Tariq Tahir (20/8/26)
- El Niño could drag down the global economy by almost $1 trillion or at least $7 trillion—and the choice is ours
Peterson Institute for International Economics, Cullen S Hendrix (26/7/26)
- UN warns of ‘supersized’ El Niño as countries prepare for impact
BBC News, Esme Stallard, Mark Poynting, Becky Dale, Yvette Tan, Tiffanie Turnbull and Nikita Yadav (3/9/26)
- Toxic haze from wildfires spreads across South East Asia as ‘super’ El Niño intensifies
BBC News (2/9/26)
- A Super El Niño is coming: 5 hard‑won lessons the world can learn from Africa
The Conversation, Tafadzwanashe Mabhaudhi and Mendy Ndlovu (5/7/26)
- ‘Supersizing before our eyes’: UN warns of record El Niño approaching
The Guardian, Damian Carrington (3/9/26)
- ‘Super’ El Niño could cause global food price shock lasting into 2028, analysts say
The Guardian, Richard Partington (12/7/26)
- Without action wildfires in Europe will increase 39% even in best-case climate scenario, study finds
The Guardian, Ajit Niranjan (20/8/26)
- From classrooms to climate action: ICSE 2026 charts new path for sustainability
Economic Times (Times of India) (2/9/26)
Questions
- What is the current state of progress towards meeting the goals of the UN Paris Climate Agreement?
- Are there any externalities in consumption that affect global warming?
- How might technological progress make it privately profitable to reduce carbon emissions?
- How might global supply chains and shipping be affected by a super El Niño?
- What role can education play in tackling climate change and its effects?
The prices of many species of fish have risen in recent months. Coastal pelagic fish, such as mackerel, herring and sardines have risen especially rapidly. Mackerel, once seen as a cheap source of protein, is no longer quite such a ‘bargain’.
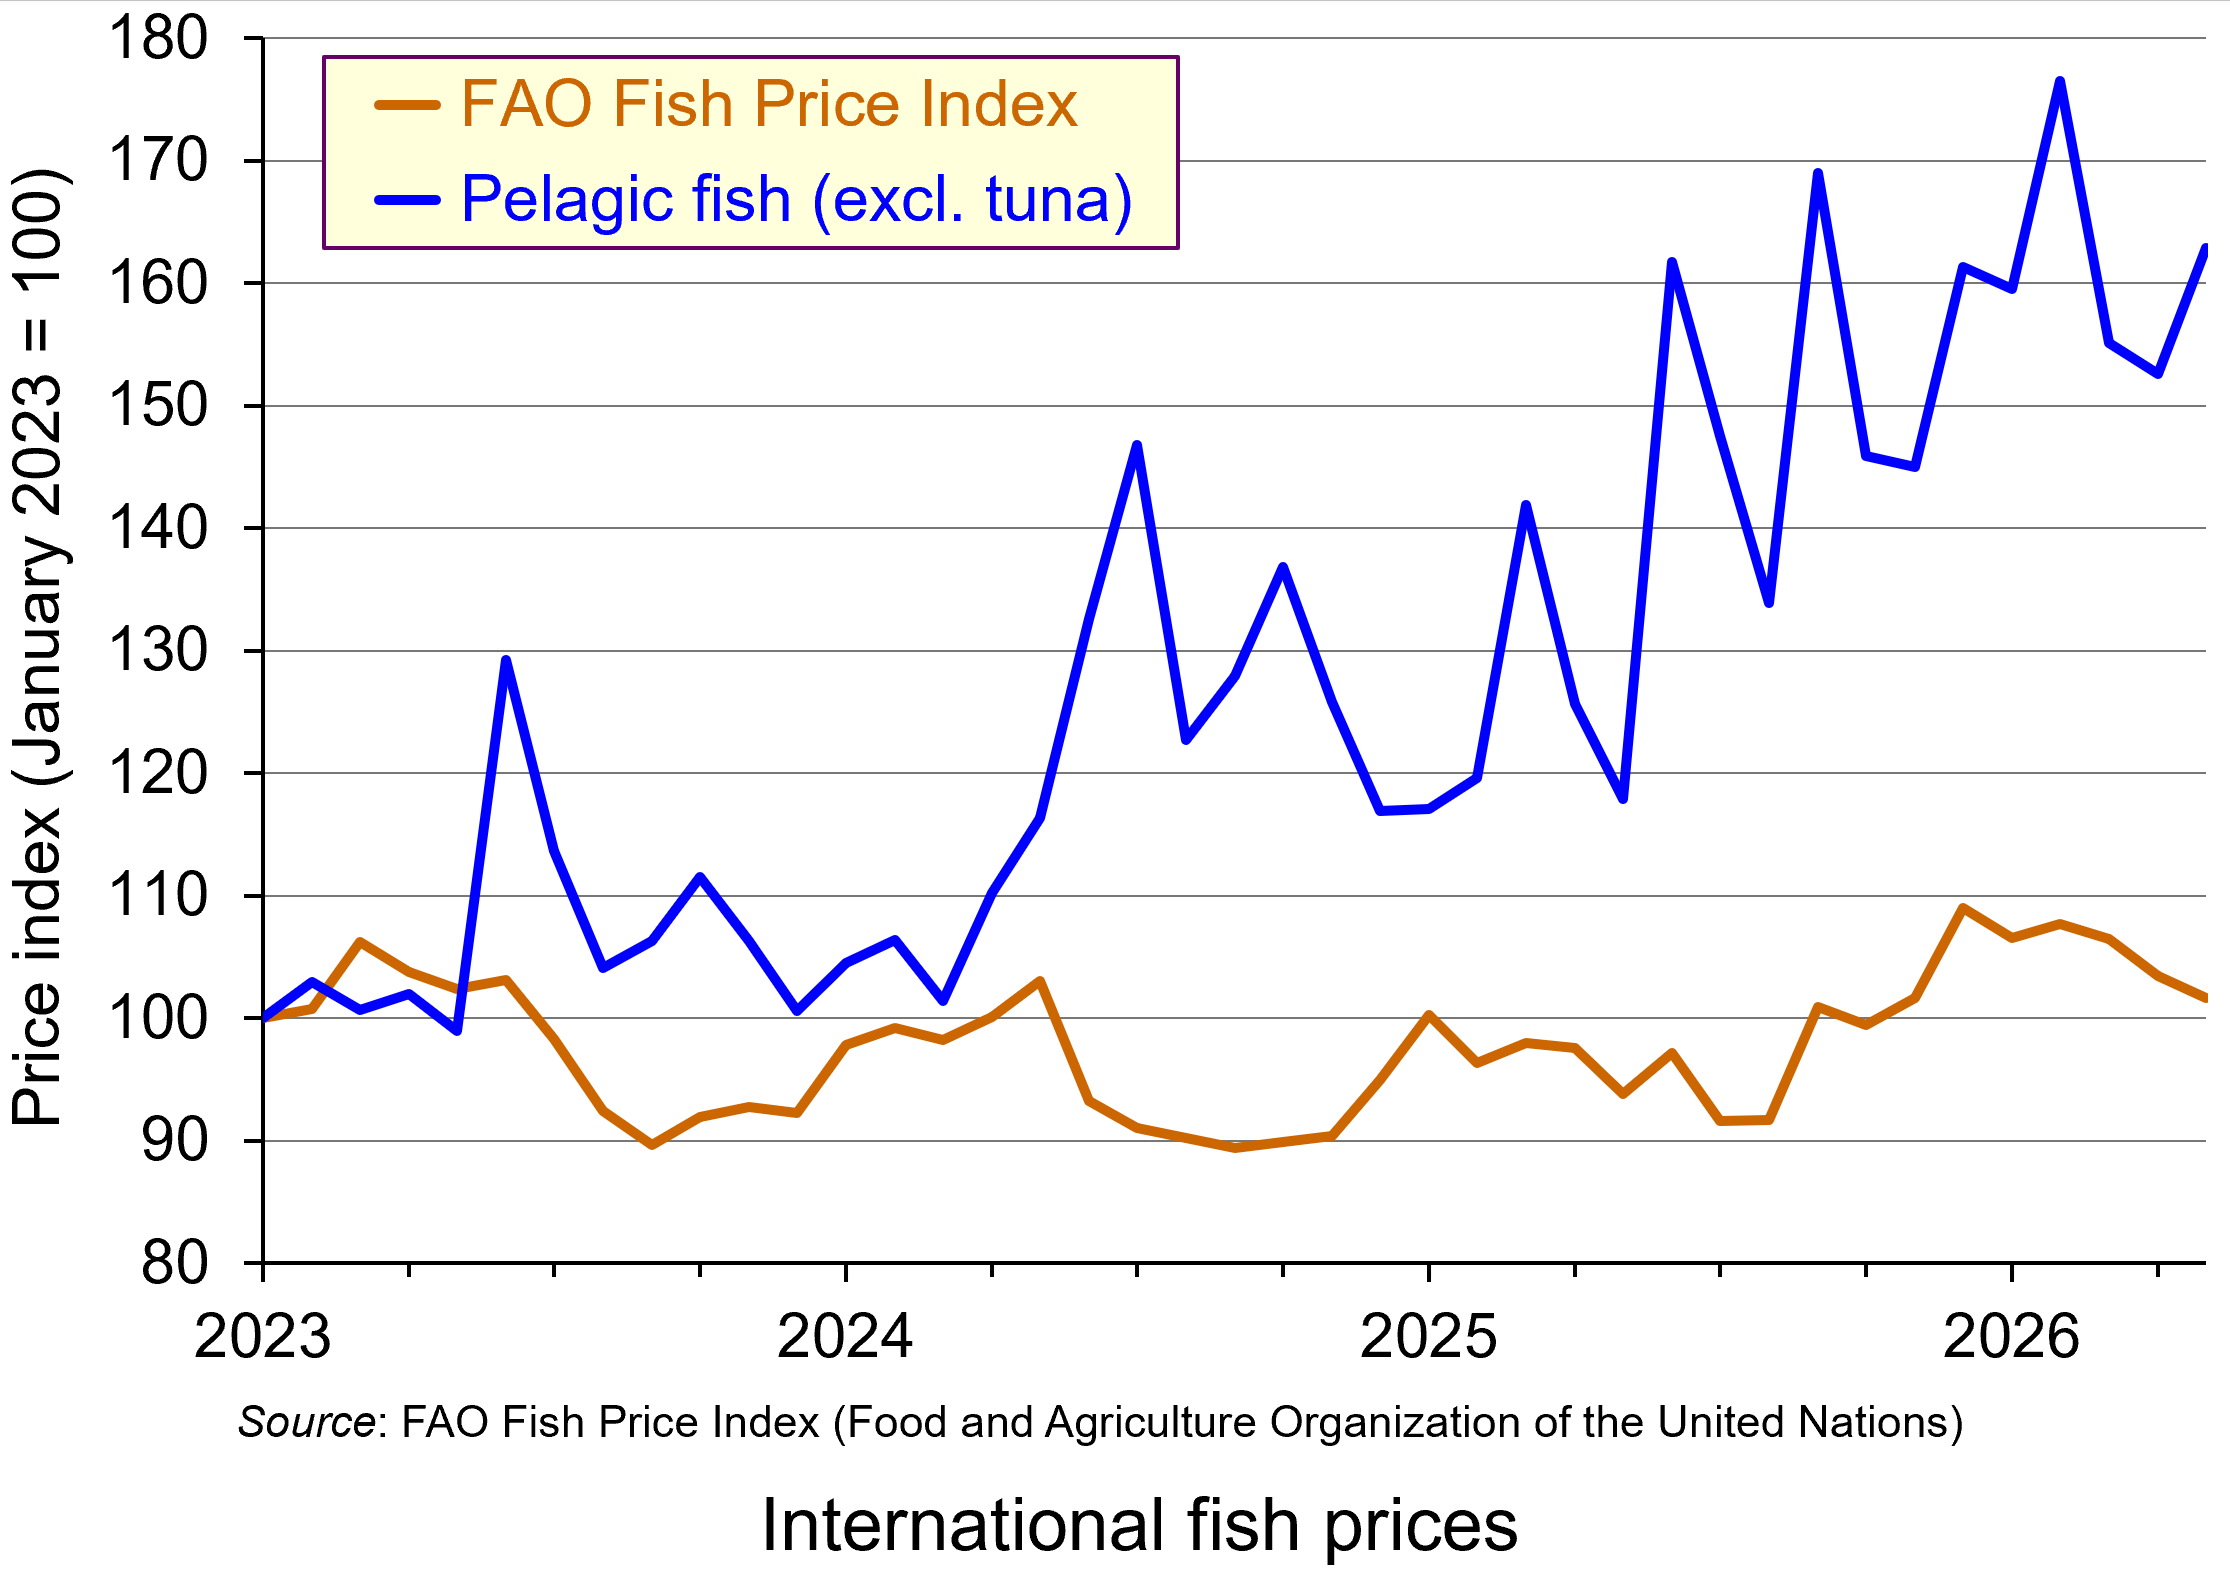 From January 2023 to May 2026, the international price index of pelagic fish rose by 69%. In 2025, UK supermarket fresh, chilled smoked and tinned mackerel prices rose by an average of 25%; and over the first part of 2026, some tinned mackerel product lines have increased by as much 55%. In February 2026, Waitrose announced that it would suspend sales of fresh and chilled mackerel and tinned mackerel once current stocks had been cleared. It cited overfishing and sustainability concerns.
Supply and demand
But why have mackerel prices risen so much? The price of fish is determined by demand and supply. So what has changed? The main changes have been on the supply side.
Supply. Most of the world’s supply of mackerel comes from the Northeast Atlantic. These waters have been overfished for many years, thereby depleting the stock of the fish and reducing the amount of mackerel caught.
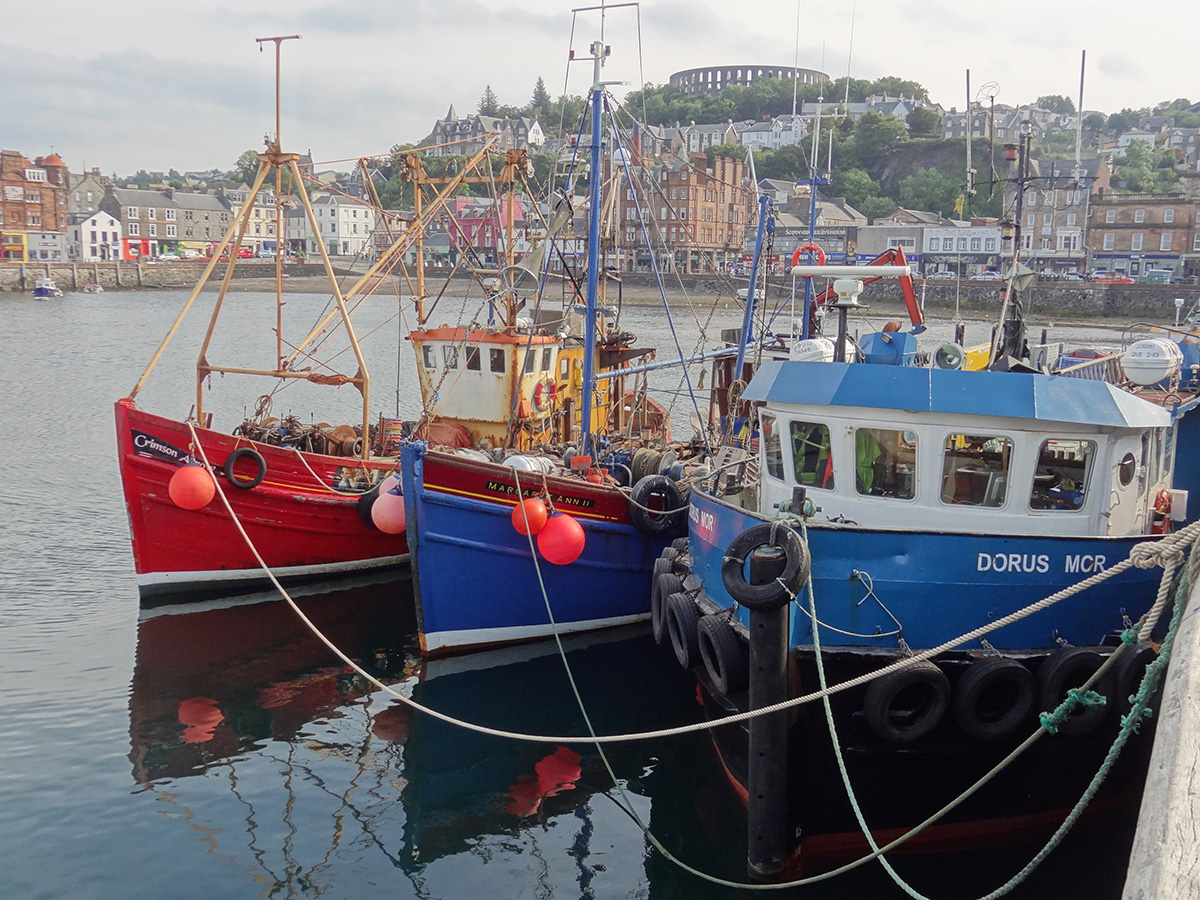 To arrest the decline and allow stocks to rebuild, the International Council for the Exploration of the Sea (ICES) recommended a quota of 174,357 tonnes for 2026. This would represent a 70% cut from 2025. The main fishing countries – Norway, the UK, the Faroe Islands and Iceland – eventually agreed to a quota of 299,010 tonnes: a cut of 48%. After a series of bilateral agreements between the four countries over access to each other’s waters, this resulted in the following quota shares: UK 30.55%, Norway 26.4%, Faroes 12% and Iceland 10.5%. The remaining 20.55% would be for the EU, Greenland and Russia.
Despite these other countries not being part of the deal, in May 2026 the EU agreed to reduce its catch by 48% too. Russia, however, set its own quota of 67,548 tonnes, which is 22.6% of the total 299,010 quota, above the 20.55% set aside for the EU, Russia and Greenland combined and almost almost five times Russia’s historic quota share! The UK, EU and Iceland responded by agreeing to bar Russian vessels carrying mackerel from entering their ports.
The quotas have added to the decline in supply, even though the aim is to increase supply in the future as stocks are rebuilt. In May this year, the Norwegian catch was down nearly 85% – well below the 48% reduction in the quota.
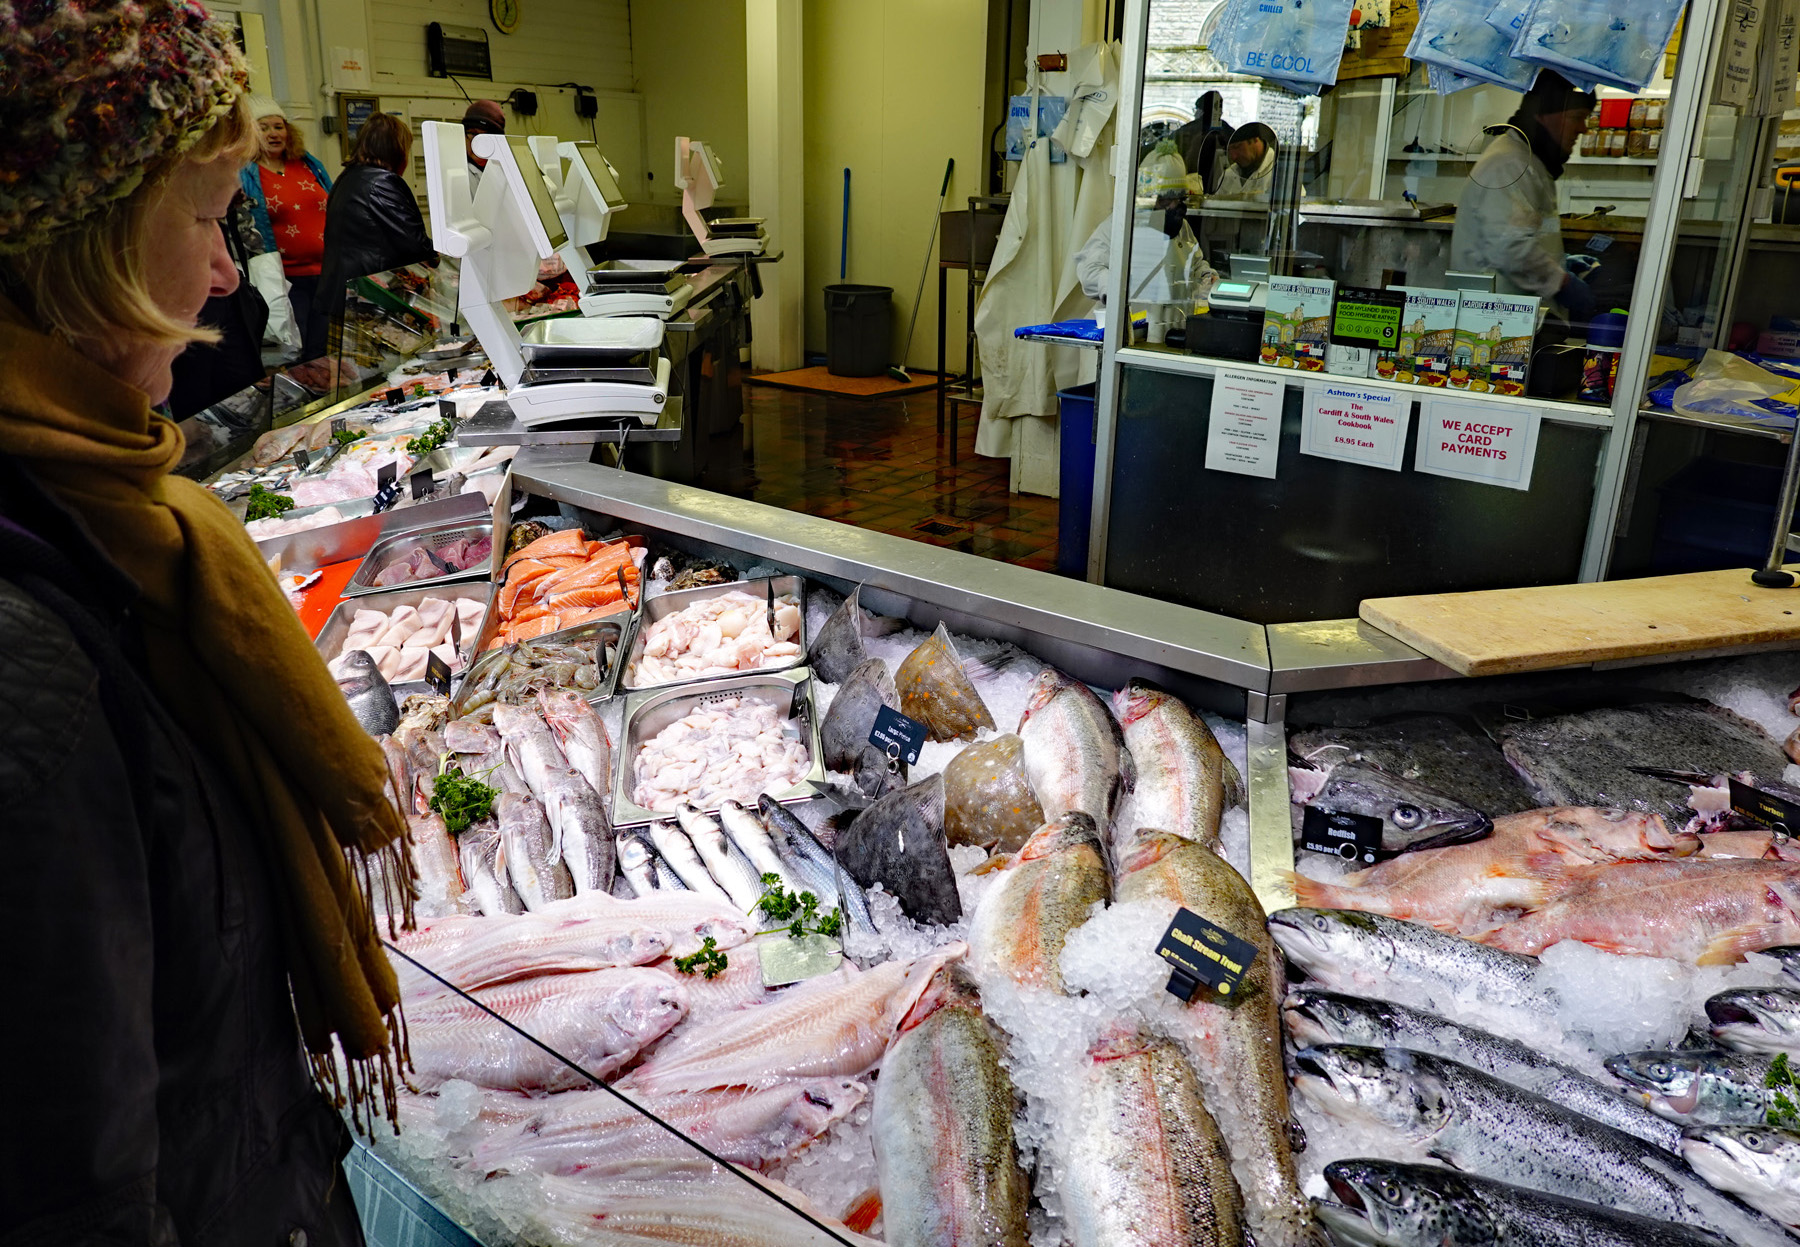 Demand. Despite higher prices, demand has remained strong. Part of the reason is that demand is relatively inelastic. This is because, despite its increase in price, mackerel remains a relatively cheap fish and thus there is little option to switch to cheaper alternative fish. Indeed, with other fish going up in price, and meat too, some people may even switch to mackerel.
Another reason for strong demand is the growing market outside Europe, especially in southeast Asia, China, South Korea and Japan. In some of these countries, mackerel is seen as a luxury fish and people are prepared to pay higher prices, making demand relatively inelastic but at the other end of the market. In 2025, imports of frozen whole mackerel into the region rose by nearly 9%, despite rising prices.
However, Norwegian exports to the region have been falling, reflecting lower quotas in 2025 and lower still in 2026. This has further exacerbated the rise in price and intensified competition between Asian importers. For example, in July 2026, Korea sent a ‘mackerel envoy’ to Norway and other major exporters to seek to secure additional supplies.
The future
With supply restricted by declining stocks and tighter quotas, and with a price inelastic and growing demand, the high prices of mackerel in all forms look set to last – at least until stocks rebuild and quotas can be relaxed. But, with total quotas well above the level suggested by the ICES, rebuilding could take a long time.
Articles
- Norwegian Mackerel Prices Drive Record Pelagic Values in 2025
The Fishing Daily, Oliver McBride (25/5/26)
- Mackerel prices soar as demand and supply pressures take hold
The Grocer, Charles Elliman (23/1/26)
- Mackerel Prices Have Broken Historical Highs And May See Another Surge in 2026
Caharbor Import and Export Co., Ltd, China (12/1/26)
- Waitrose to suspend mackerel sales due to overfishing concerns
BBC News, Emer Moreau (27/2/26)
- Holy mackerel! The fish Waitrose removed from its shelves
Epigram (University of Bristol student newspaper), Grace Golby (6/6/26)
- Four Northeast Atlantic coastal parties agree on 2026 mackerel quotas, shares; EU left out again
SeafoodSource, Regin Winther Poulsen (17/12/25)
- EU Raises Mackerel Quotas despite Scientific Overfishing Warnings
The Fishing Daily, Oliver McBride (30/3/26)
- High Mackerel Prices Reshape Asian Small Pelagic Trade
The Fishing Daily, Oliver McBride (2/6/26)
- Korea dispatches ‘mackerel envoy’ to Norway as prices spike
Korea JoongAng Daily, Ahn Hyo-Seong (6/7/26)
- Norwegian Mackerel Supply Plunges, Korean Catch Regains Price Edge
Seoul Economic Daily, Nam Yoon-jung (28/6/26)
- Geopolitical unrest, currency effects and quota cuts led to a decline in the value of Norwegian seafood exports in the first half of the year
Norwegian Seafood Council, Press Release (3/7/26)
- Norwegian Seafood Exports: Frozen Mackerel and Herring Prices Surge in Week 26 of 2026
IndexBox (1/7/26)
- New sanctions on Russia following huge unilateral increase in mackerel quota
Fishing News, Steve Mackinson (9/7/26)
Data
Questions
- Draw a supply and demand diagram to illustrate what has happened to mackerel prices.
- What is the effective price elasticity of supply of mackerel?
- Why is demand for mackerel relatively price inelastic in the UK, except when prices rise above a certain level?
- Why is demand for mackerel relatively price inelastic in certain Asian countries, such as Japan and South Korea?
- In which country is demand for mackerel likely to be more income elastic: the UK or Japan?
- Under what circumstances might the price of mackerel in five years’ time be (a) higher than now; (b) lower than now? What will determine which is more likely?
- Should other supermarkets follow Waitrose’s lead in stopping the sale of mackerel?
- What is the ‘tragedy of the commons’? Why is a common resource such as fish in the open seas likely to result in the tragedy?
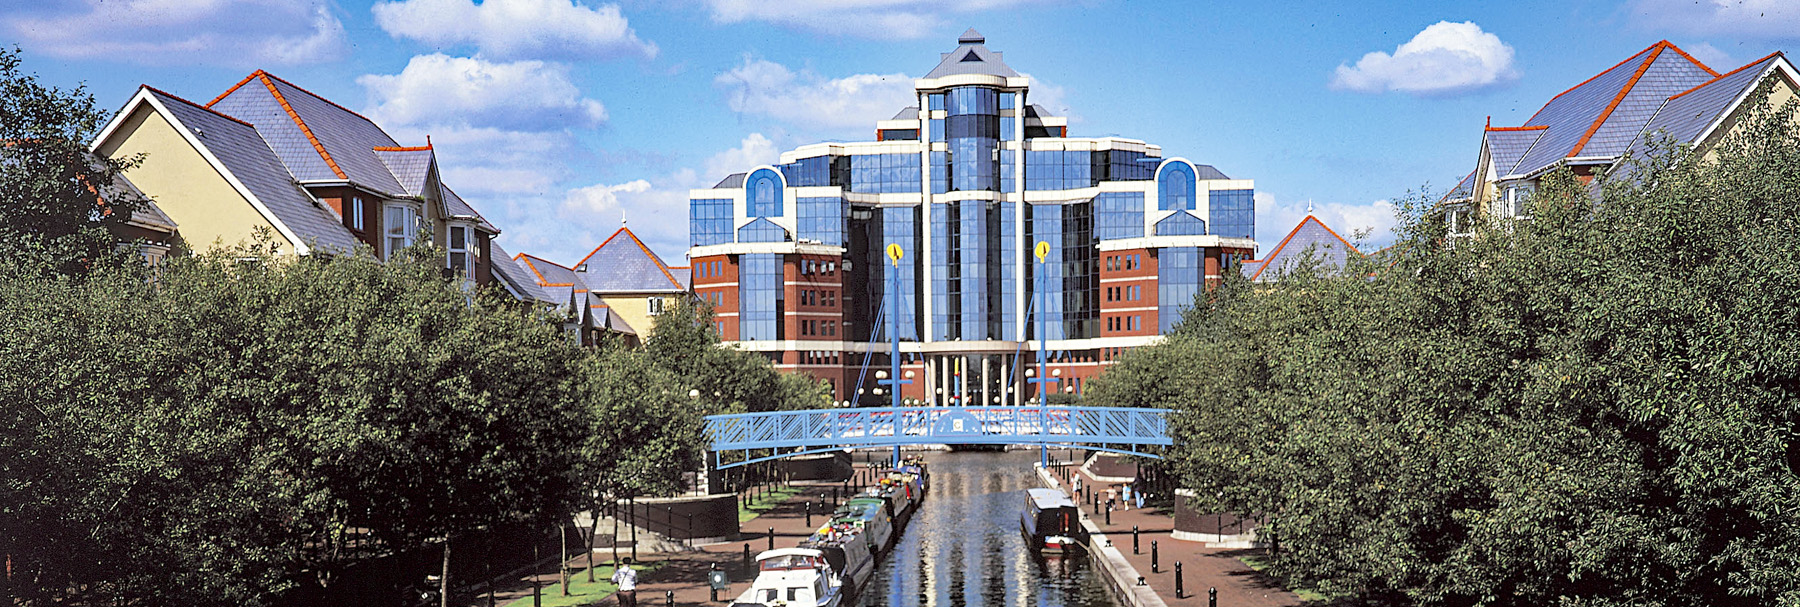
Andy Burnham is set to become UK Prime Minister on 20 July if no-one else stands to replace Keir Starmer. In a speech on 29 June, he outlined his economic vision. Central to this is devolution, where a greater number of economic decisions would be taken locally rather than by central government. This approach has been dubbed ‘Manchesterism’, in reference to his time as Mayor of Greater Manchester from 2017 to earlier this year. Under his mayoralty, Greater Manchester (GM) achieved faster economic growth than other regions or cities in the UK. From 2017 to 2023, GM’s gross value added grew by an average of 6.6% per annum and the city of Manchester’s by 8.4% – the highest of any city in the UK. The UK average was 4.9% and London’s was 4.6%.
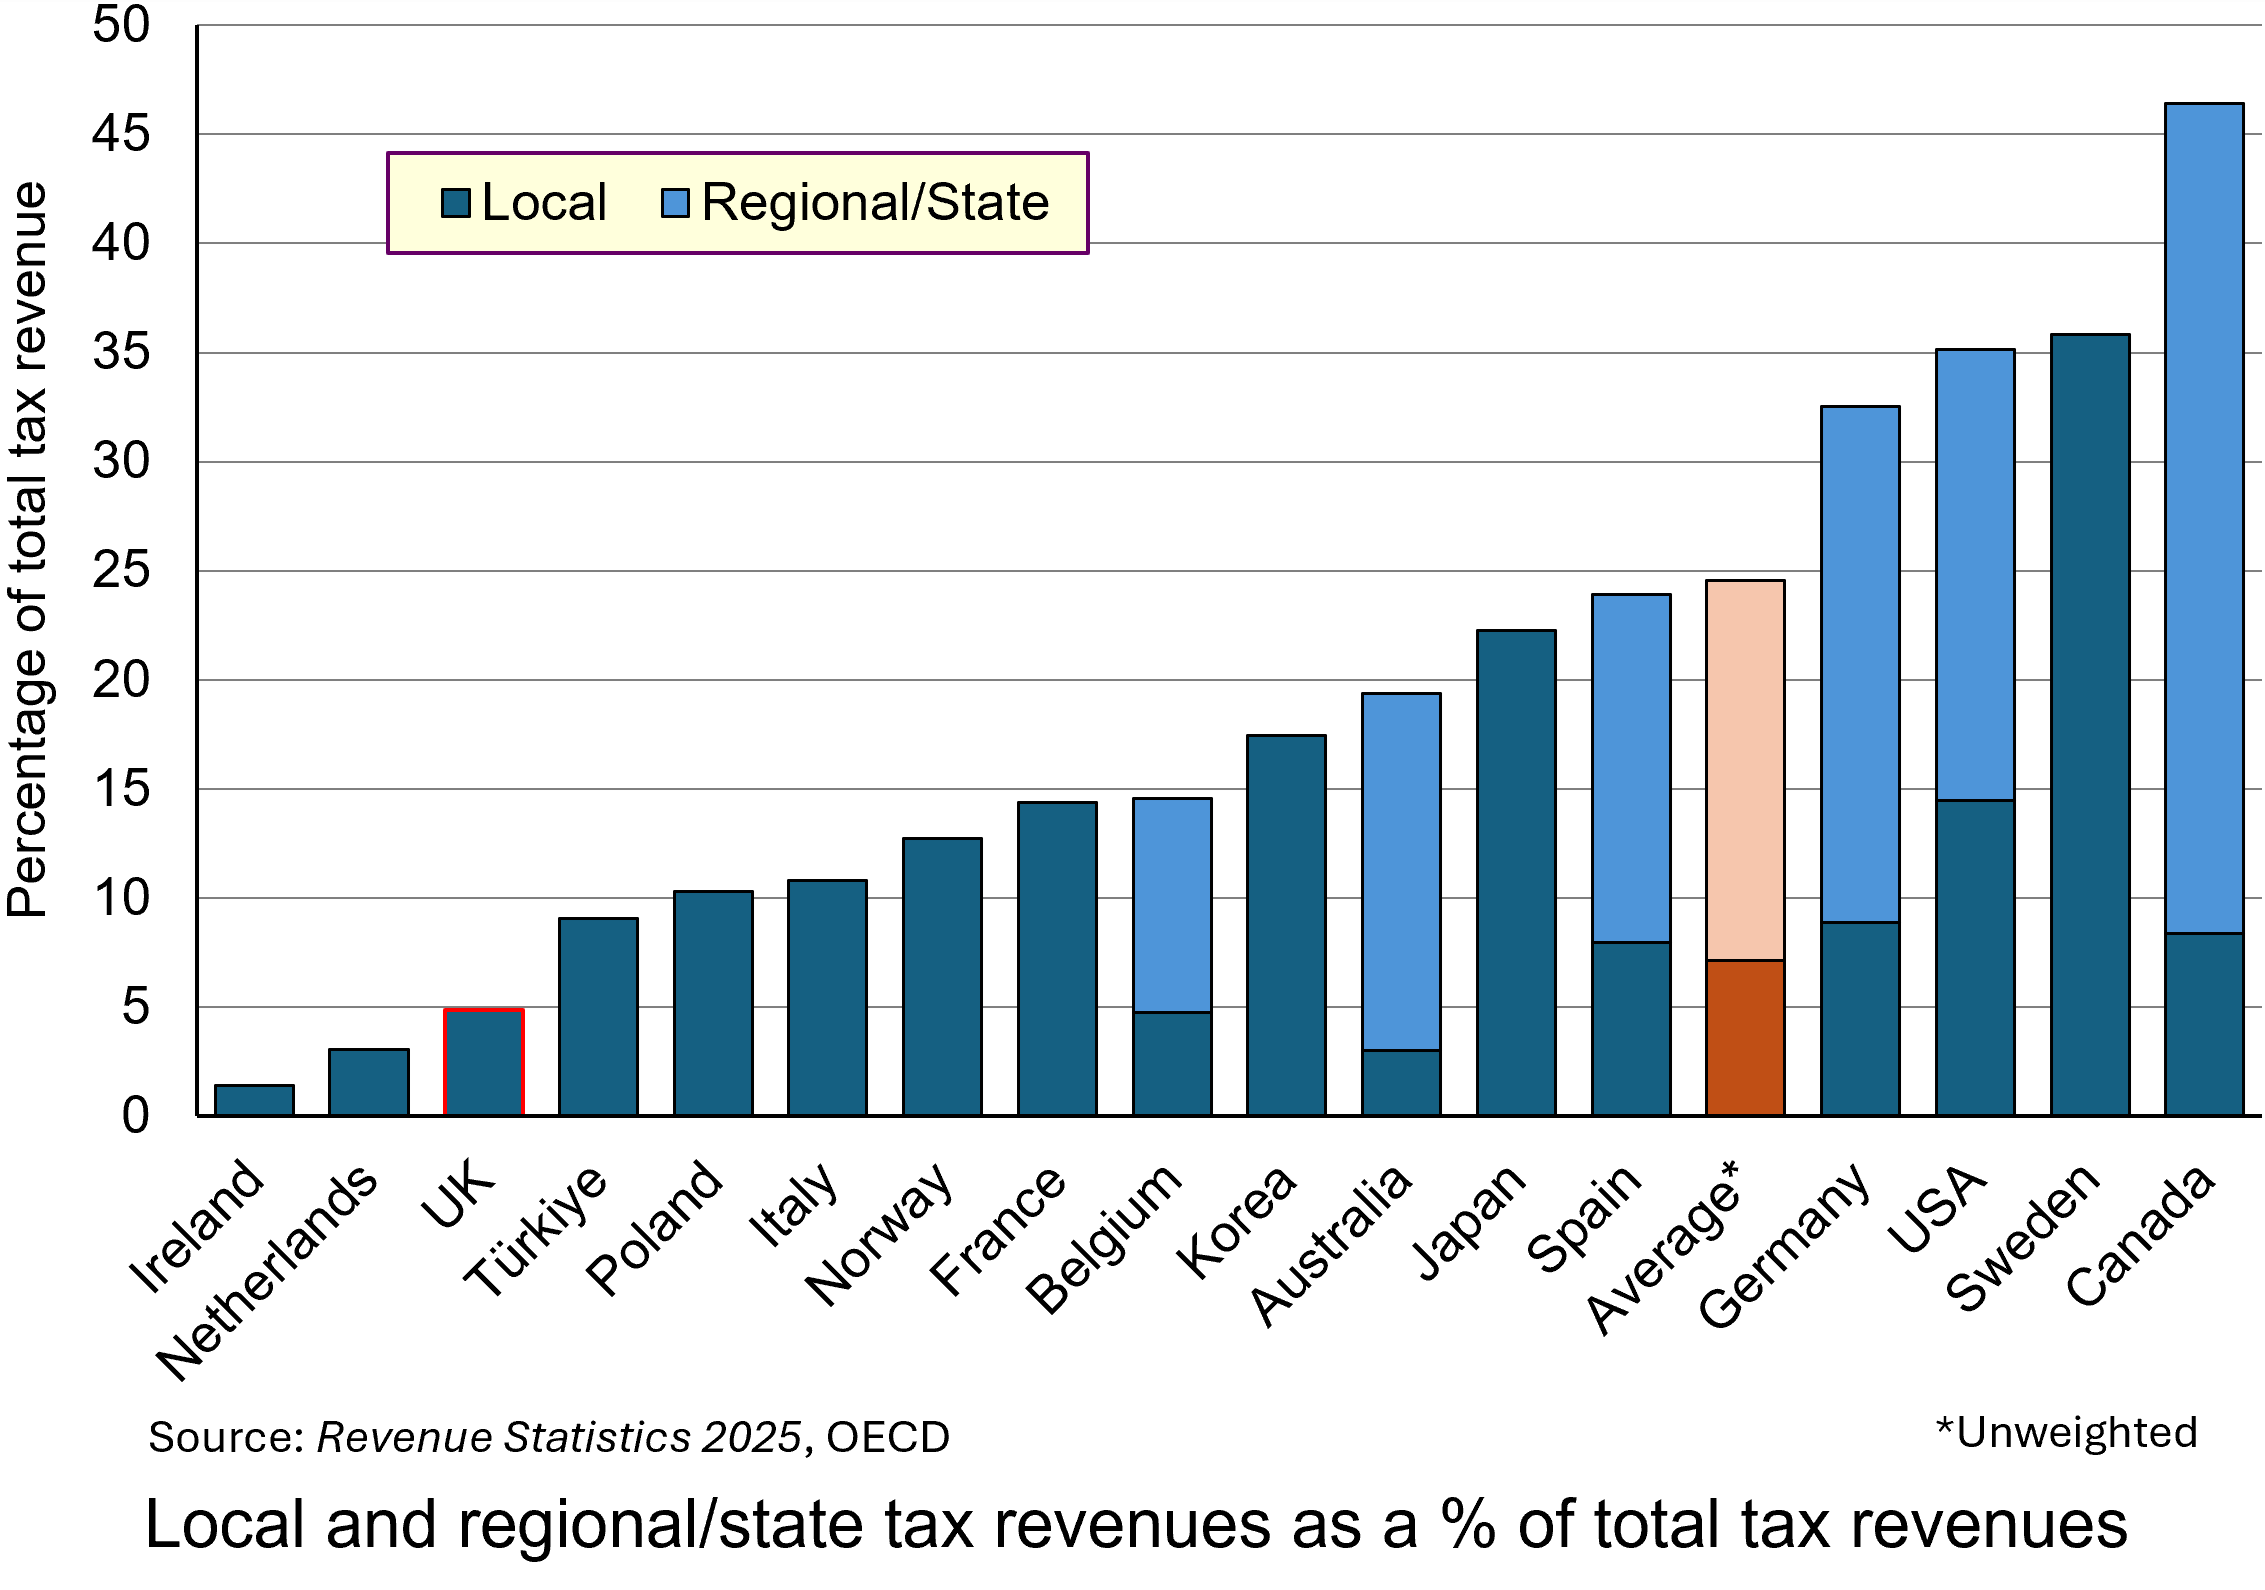 The UK, especially England, is one of the least devolved of the OECD countries. One aspect of this is taxation. The chart shows local taxes and, in the case of federal countries, state/regional/provincial taxes too. (Click here for a PowerPoint.)
Only 4.9% of UK tax revenue is in the form of local taxes (council tax and 50% of business rates) and the amount that can be raised in council tax is capped by the central government. The remainder of UK tax revenue goes to central government in the form of income taxes, social security taxes (national insurance), VAT, excise duties, etc. This compares with an average of 7.1% local taxes and 24.5% local plus regional taxes across the 17 OECD countries shown in the chart.
Andy Burnham plans to shift some of the spending and tax-raising powers from Whitehall to metro mayors and local councils. The aim is to stimulate productivity and economic growth at a regional and local level by tailoring support and incentives to local needs and strengths. Local leaders will be best positioned to understand these needs and strengths and will be able to customise spending and support appropriately.
 Examples of the types of greater autonomy over decision making would include:
- Control over adult education budgets to allow them to be tailored to provide training and apprenticeships to meet the skills requirements of existing and emerging industries in the area;
- Forming partnerships with local universities to support research and development that complements regional economic growth;
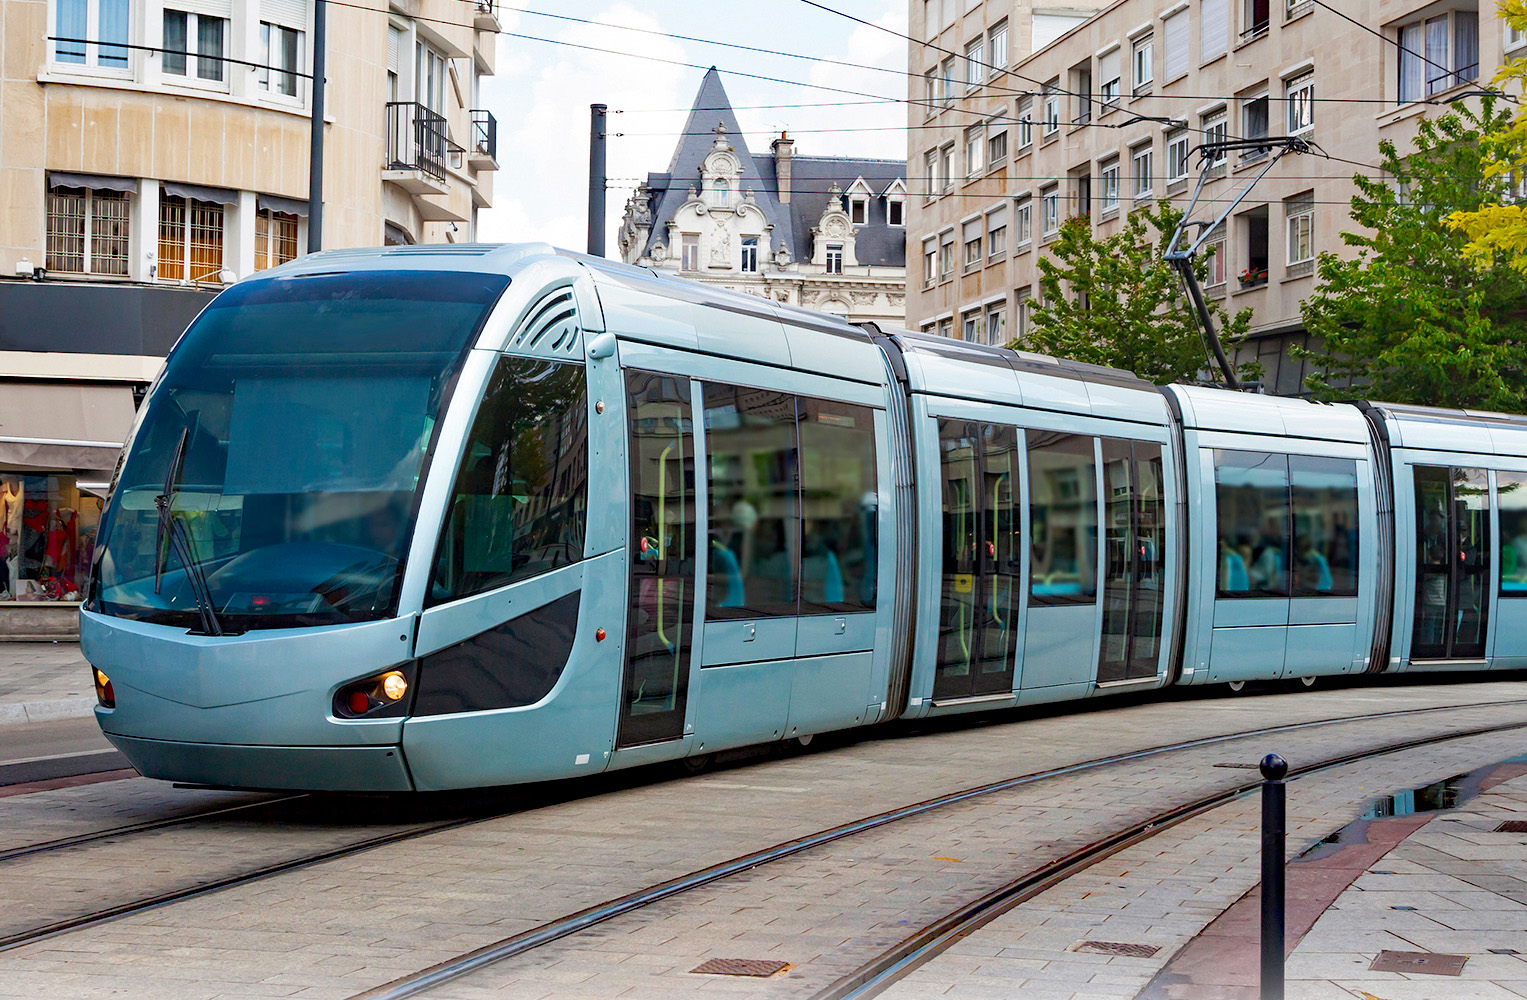
- Providing greater funding for and control over local transport infrastructure, including roads, buses, trams, trains, etc., with local consultation to make them fit for the local population and businesses;
- Tailoring business incentives to local needs and to the needs of the businesses themselves so as to attract an increase in investment;
- Greatly expanding council house building, which has virtually dried up in recent years, with mayors and/or local authorities empowered to develop local housing strategies, including affordable housing programmes, and to direct housing investment funding to particular housing developments in areas of greatest need.
Andy Burnham has pledged to stick to the government’s two existing fiscal rules:
a) The Stability Rule (Fiscal Mandate): the current (day-to-day) budget must be in balance or surplus. In other words the provision of salaries, public services, state pensions, welfare, etc. must be covered by government revenues (largely taxation). The government should borrow only to fund long-term investment.
b) The Debt Rule (Stock Mandate): each year, public-sector net financial liabilities (PSNFL) must be forecast by the OBR to be falling as a share of GDP compared to the previous year in three years’ time. This acts as a break on the amount of borrowing for long-term investment.
It is likely, therefore, that there will be little extra government money for investment. Rather, the policy involves a redistribution of public-sector investment from central government to mayoral/local authorities.
 In theory, such a policy of devolution need not see a redistribution from richer to poorer regions, but that might be part of the policy when the details are published. The UK has a bigger gap in productivity (GDP per worker) between its capital city and other large cities than in do other countries. Birmingham, Sheffield, Leeds, Newcastle, etc., as well as Cardiff, Glasgow, Edinburgh and Belfast, lag further behind London in output per head and economic growth than do other European countries lag behind their capital city. Thus the gap between Paris and Lyon, Toulouse and Marseille is narrower; as is that between Belin and Munich, Hamburg and Frankfurt. It is a similar picture in Spain and Italy. In the USA, some cities, such as San Francisco, outperform Washington DC and New York. A redistribution of government funding from London to the regions could see their incomes rise faster without having too much impact on London, which would still continue to attract large amounts of private investment.
Overall, there would be little increase in government funding. ‘Manchesterism’ is not, therefore, a demand-side policy. It is a supply-side policy – directing funds to areas where, combined with local incentives and local knowledge, the funding could yield greater returns and thereby increase potential GDP.
But this is not to say that there is no effect on aggregate demand. The hope is that devolution along the lines outlined by Andy Burnham will attract increased private investment, thereby increasing actual GDP as well as further increasing potential GDP.
We wait to see the details over the coming weeks.
Articles
- Will Andy Burnham’s devolution plan raise economic growth?
BBC Verify, Ben Chu (29/6/26)
- Burnham’s ‘Manchesterism’ could change the UK, but is not yet a full economic plan
BBC News, Faisal Islam (29/6/26)
- Burnham’s ‘Manchesterism’ got him to No 10 – but will it work for the UK?
BBC News, Faisal Islam (17/7/26)
- Burnham says there is some room for movement on tax
BBC News, Kate Wannel and Joshua Nevett (3/7/26)
- England’s mayors should be given sweeping new powers, says devolution expert
The Guardian, Kiran Stacey (2/7/26)
- What is Andy Burnham’s economic and political blueprint for Britain?
The Guardian, Richard Partington and Jessica Elgot (29/6/26)
- Why Andy Burnham’s radical plan relies on the Treasury being a friend of devolution
The Conversation, Dave Richards and Sam Warner (26/6/26)
- How Andy Burnham may try to give the UK economy a boost in his ‘10‑year plan’
The Conversation, Steve Schifferes (29/6/26)
- Could Andy Burnham let mayors raise more taxes?
House of Commons Research Briefing, Mark Sandford (2/7/26)
- Andy Burnham sets out policy plans in first major speech in PM leadership bid: Legal comments
Browne Jacobson, Dan Robinson (29/6/26)
- What does Andy Burnham think ‘Good Growth’ is?
Centre for Cities, Jess Tulasiewicz (30/6/26)
- Manchester’s digital transformation could be a blueprint for other parts of the UK
The Conversation, Richard Whittle (21/7/26)
Videos
Data
Questions
- Use an aggregate demand and supply diagram (simple or dynamic) to illustrate the effects on real GDP of a successful devolution strategy.
- Find out the details of the last Conservative government’s ‘levelling up’ policy. Was it similar in aims to that of ‘Manchesterism’?
- How could a policy of devolution as outlined by Andy Burnham affect income distribution within regions?
- Find out about the approach to regional policy in the EU. Is it similar to that being advocated by Andy Burnham?
- What is meant by ‘regional multipliers’? Why might they differ from the national multiplier?
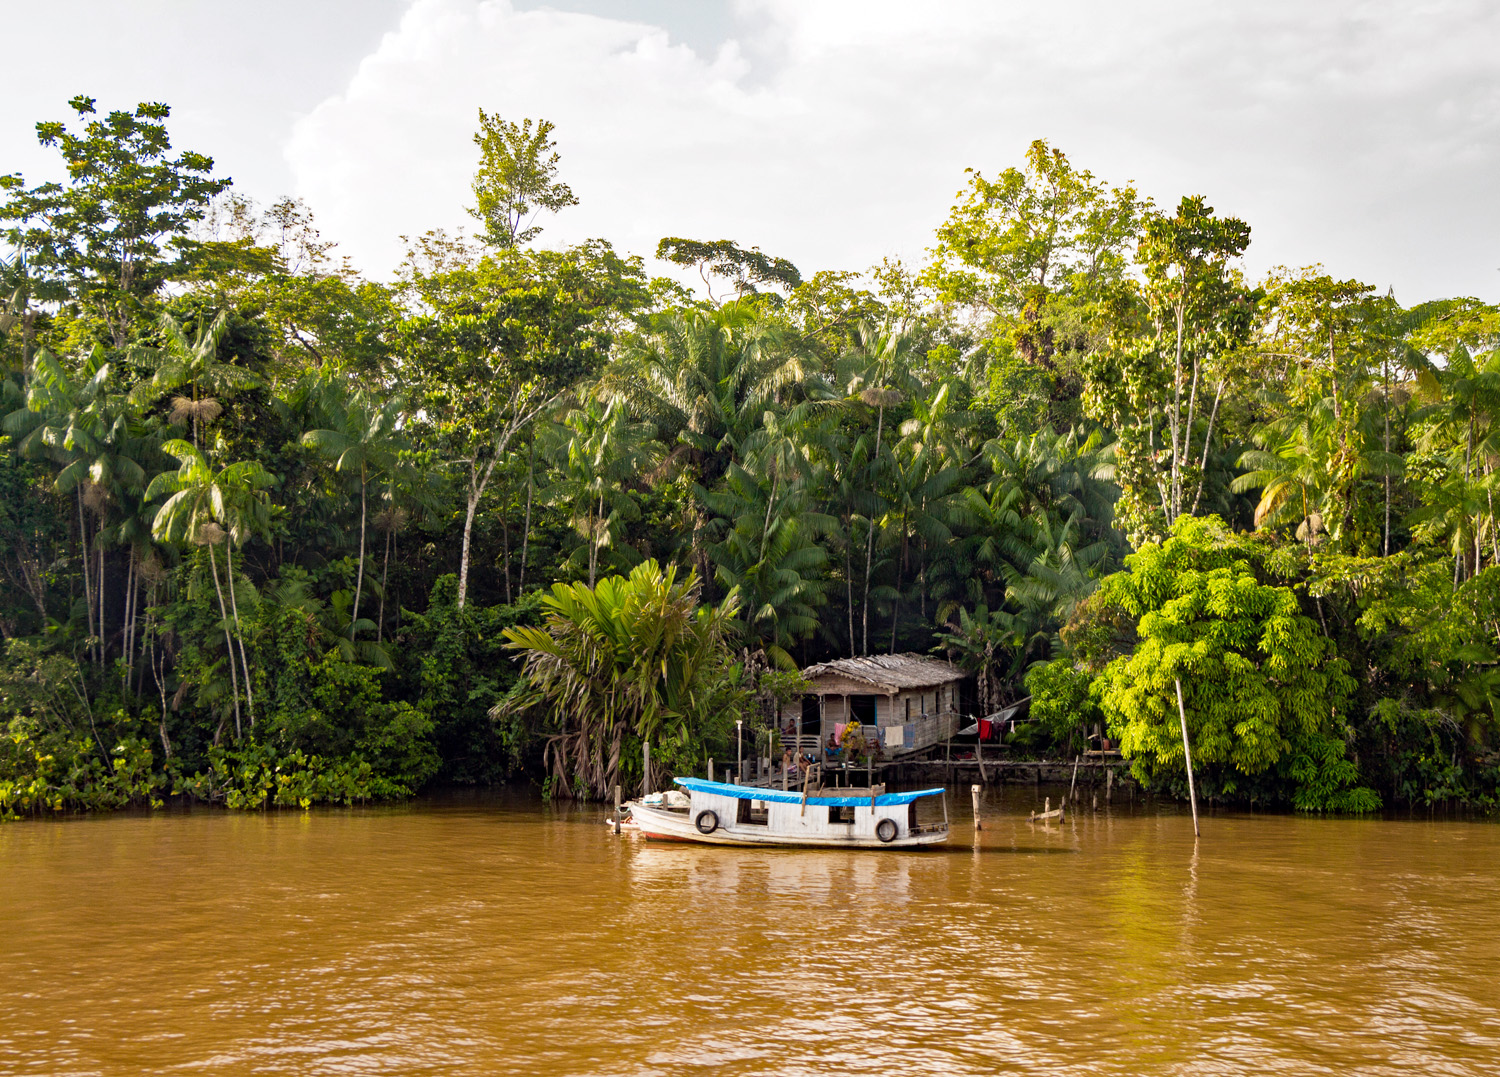 Every year, world leaders gather to find ways of limiting global warming. The latest of these ‘COP’ meetings, COP30, is in Belém, Brazil from 10 to 20 November 2025. COP stands for ‘Conference of the Parties’, the decision-making body of the United Nations Framework Convention on Climate Change (UNFCCC).
Perhaps the best-known of these meetings was in Paris in 2015. This resulted in the Paris Agreement. This is a legally-binding international treaty to limit global warming to well below 2°C and preferably to 1.5°C above pre-industrial levels. This would involve reducing greenhouse gas emissions and/or taking carbon absorbing measures. All UN countries except for Iran, Libya and Yemen are signatories to the agreement.
However, on coming to office in January 2025, President Trump announced that the USA will withdraw from the agreement in January 2026. Instead, he would prioritise fossil fuel production, under the mantra, ‘drill, baby, drill’. Previously he had claimed that global warming is a hoax concocted by China designed to undermine the competitive power of the USA.
Progress in reducing emissions and mitigating climate change
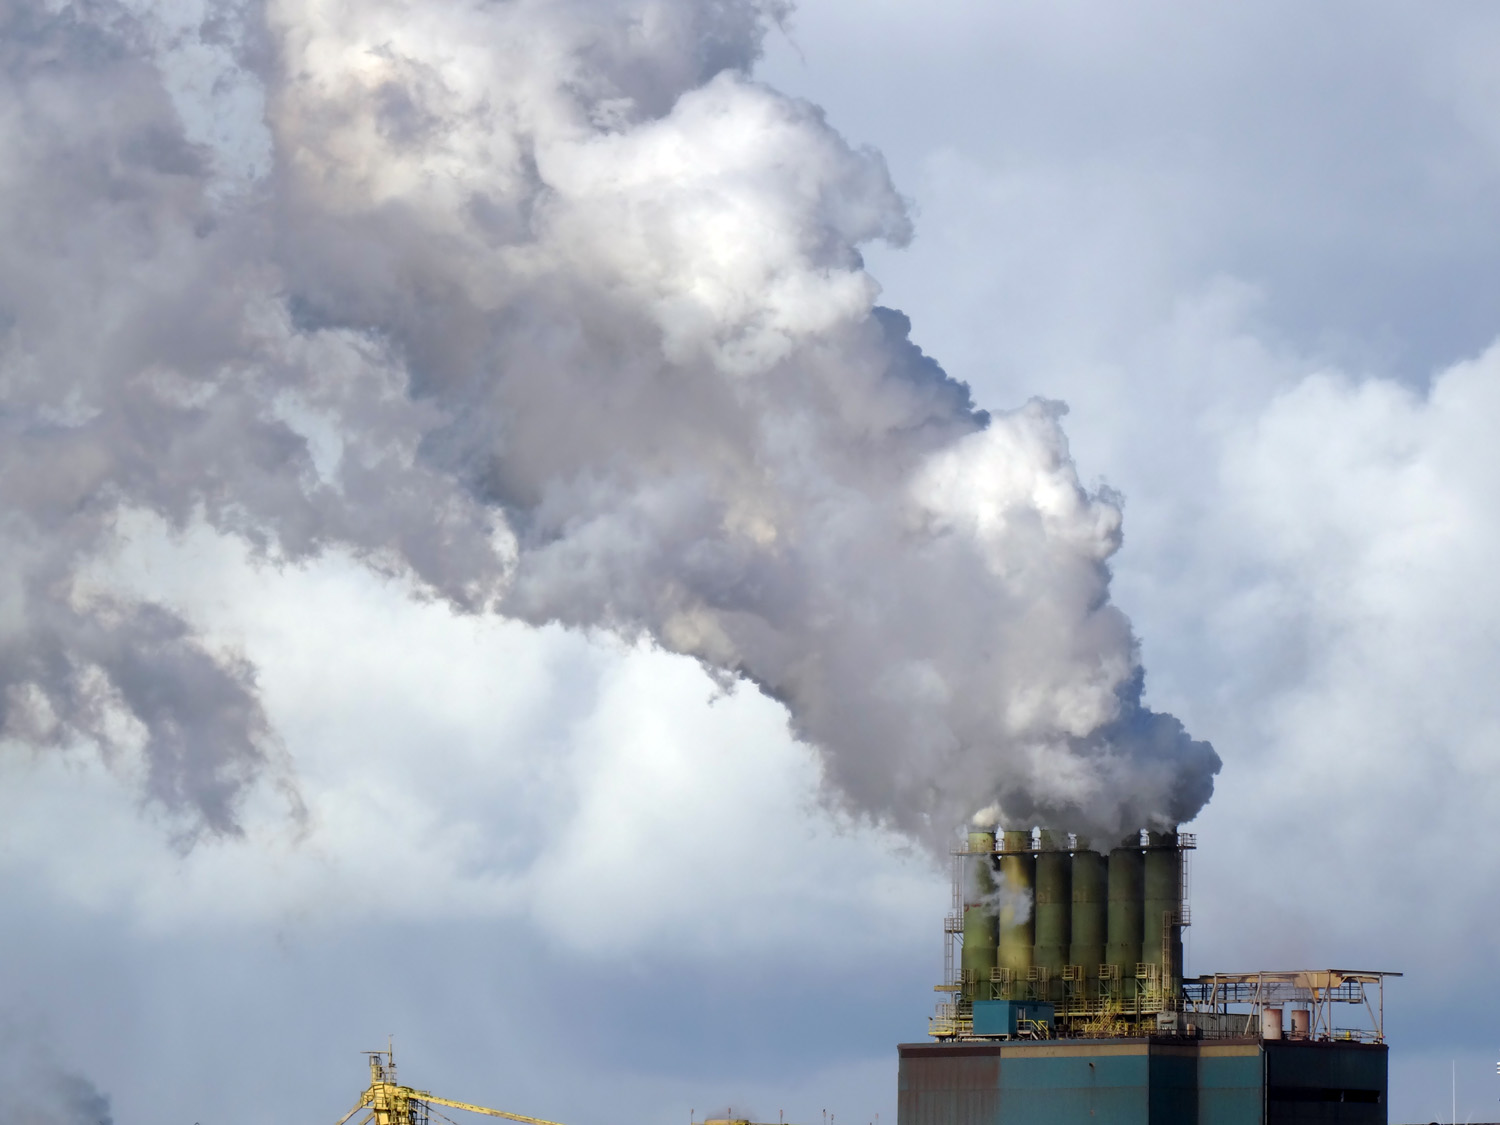 Since 2020, each country has been required to submit its own emissions-reduction targets, known as ‘nationally determined contributions’ (NDCs), and the actions it will take to meet them. Every five years each country must submit a new NDC more ambitious than the last. New NDCs are due this year. As of 12 November, 112 of the 197 countries had submitted a new NDC (including the USA, China, the EU and the UK). These 112 countries account for around 71 per cent of global emissions.
Implementing all new NDCs would reduce global CO2 emissions by between 15 and 25 per cent from current levels by 2035. But this would merely reduce global warming to around 2.6°C above pre-industrial levels. Approximately 35 per cent emissions reductions by 2035 would be required to restrict global warming to 2°C and 55 per cent to restrict it to 1.5°C.
But implementing the Paris Agreement has still had a high degree of success. Without the action taken and being taken over the past 10 years, it is predicted that global temperatures by 2050 would rise by 3–3.5°C.
Rich countries are expected to provide finance to low-income countries. This is required to help such countries adopt green technologies and to adapt to the harmful effects of climate change (e.g. through irrigation schemes and flood defences). At COP29 in Azerbaijan, the ‘Baku Finance Goal’ was agreed. This is an agreement to provide climate finance of $1.3 trillion per year by 2035 to developing countries from all public and private sources.
The subsequent ‘Baku to Belém Roadmap’ provides a set of suggested actions for governments, financial institutions and the private sector to bridge the gap between current climate finance flows and the $1.3 trillion agreed to meet global climate goals. The roadmap is a central focus of the COP30 conference in Belém, with discussions between countries on how to translate the Baku finance goal into concrete, tangible actions and integrate it into formal decisions.
The role of Donald Trump
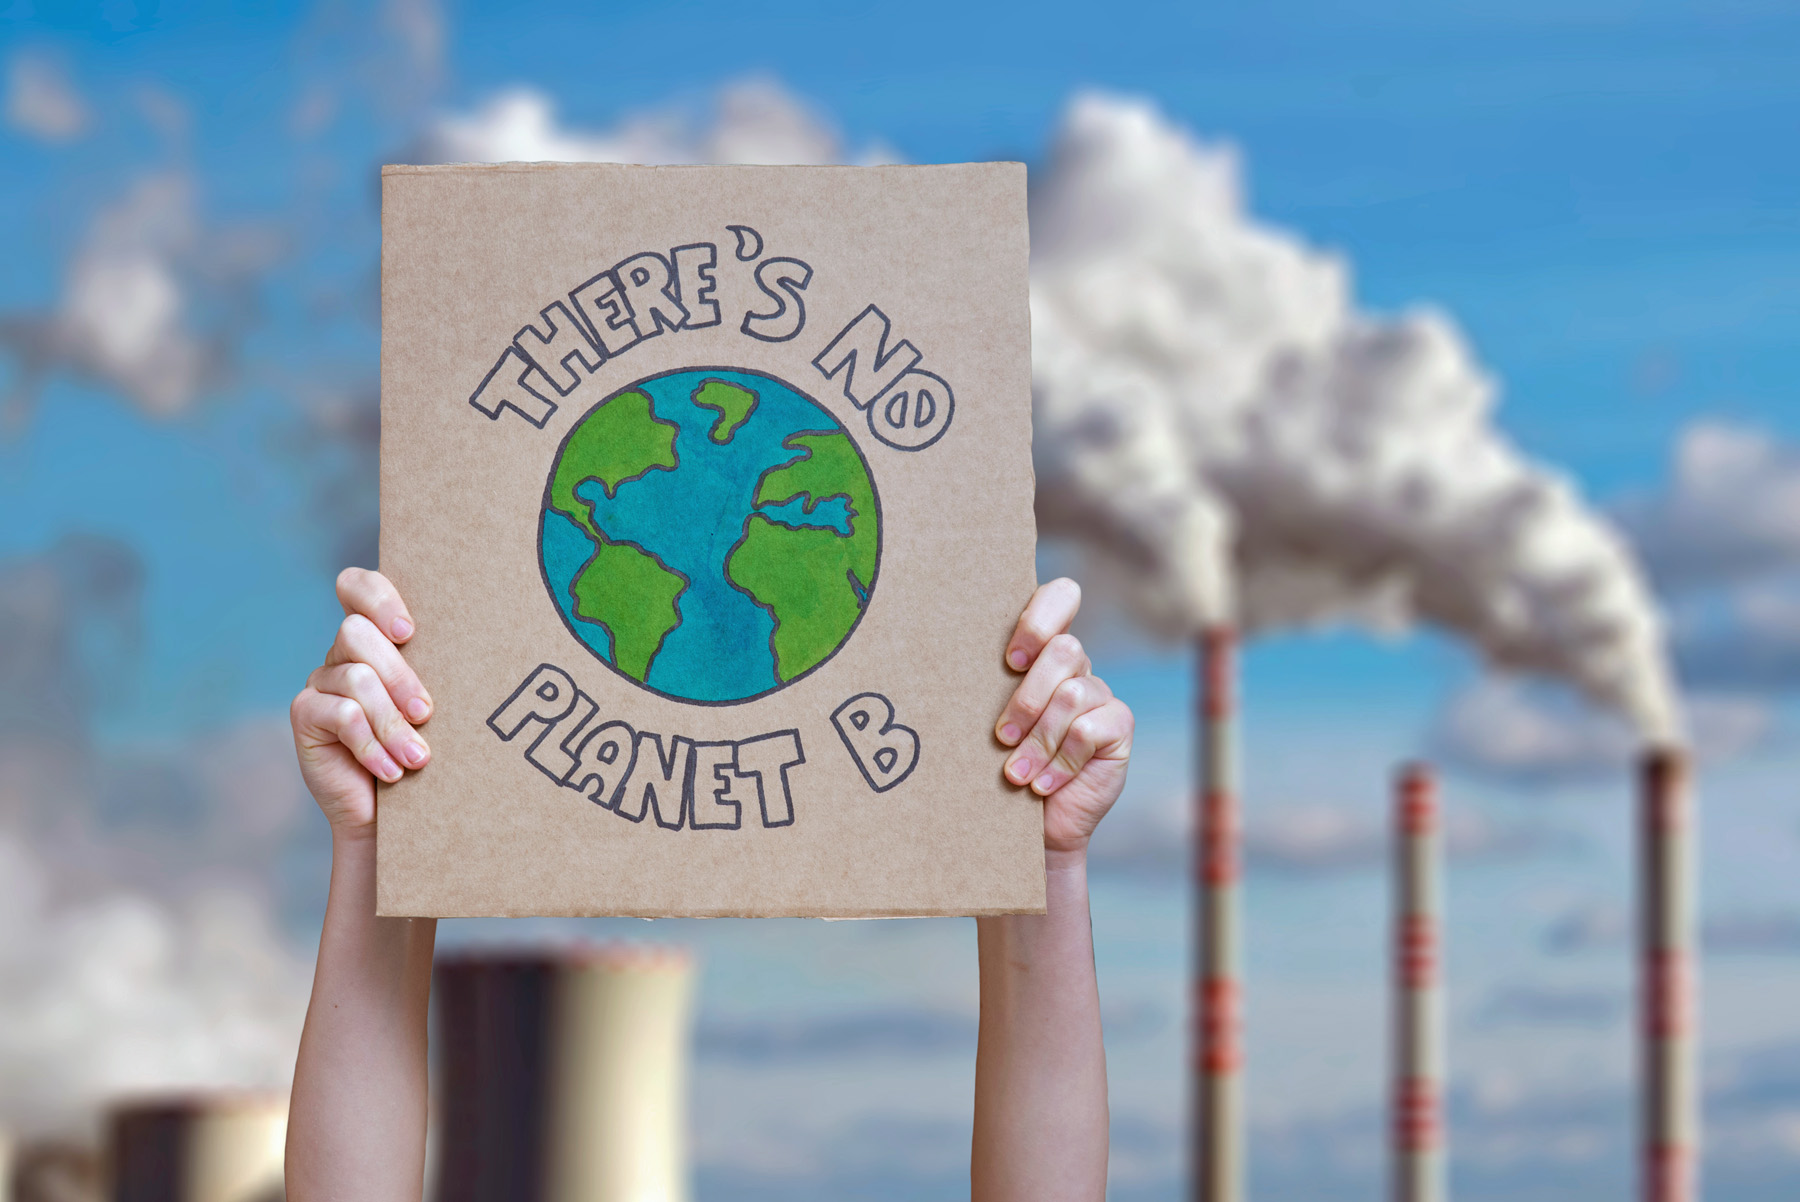 As well as announcing that the USA will withdraw from the Paris Agreement in January 2026, since coming to office in 2025, President Trump has given billions of dollars of tax cuts to fossil fuel firms and allowed drilling for oil and gas on federal lands. At the same time, he has described renewable energy as ‘a joke’ that will bankrupt countries and has slashed subsidies and tax breaks for solar and wind power, withdrawn permits for wind and solar farms, and cut funding for green energy research.
He wants the USA to be world leader in fossil fuel energy, calling on governments to buy US oil and gas, threatening some countries with tariffs if they do not. Already, Japan, South Korea and several European countries have agreed to buy huge quantities of US oil and liquefied natural gas (LNG). A worry is that other similarly inclined governments, such as Argentina, may roll back on their commitments to a green transition and instead boost their fossil fuel industries.
This gives added urgency to the Belém talks. It is crucial for the rest of the world to stick together in pushing ahead to combat global warming and in adopting and sticking to tough NDCs. It is also crucial for rich countries to support dlow-income countries in adopting climate-friendly investment and in measures to mitigate the effects of global warming.
The economics of climate change
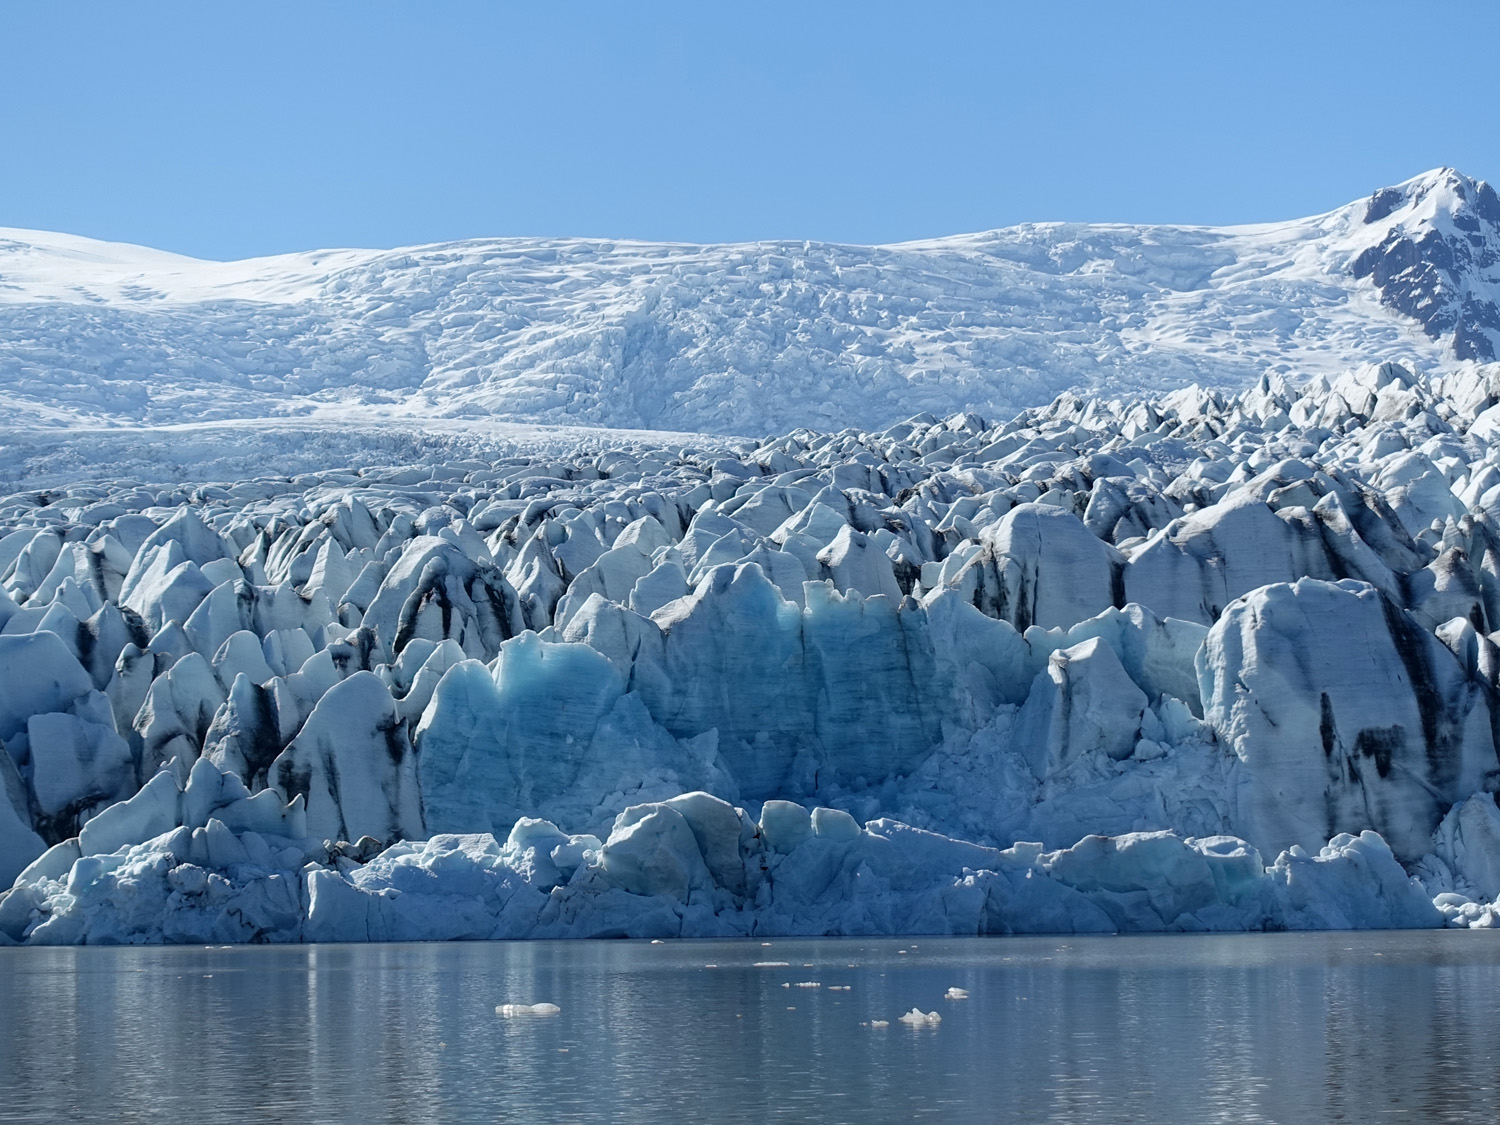 Climate change is directly caused by market failures. One of the most important of these is that the atmosphere is a common resource: it is not privately owned; it is a global ‘commons’. Individuals and firms use it at a zero price. If the price of any good or service to the user is zero, there is no incentive to economise on its use. Thus for the emitter there are no private costs of using the atmosphere in this way as a ‘dump’ for their emissions and, in a free market, no incentive to reduce the climate costs.
And yet when firms emit greenhouse gases into the atmosphere there are costs to other people. To the extent that they contribute to global warming, part of these costs will be borne by the residents of that country; but a large part will be borne by inhabitants of other countries.
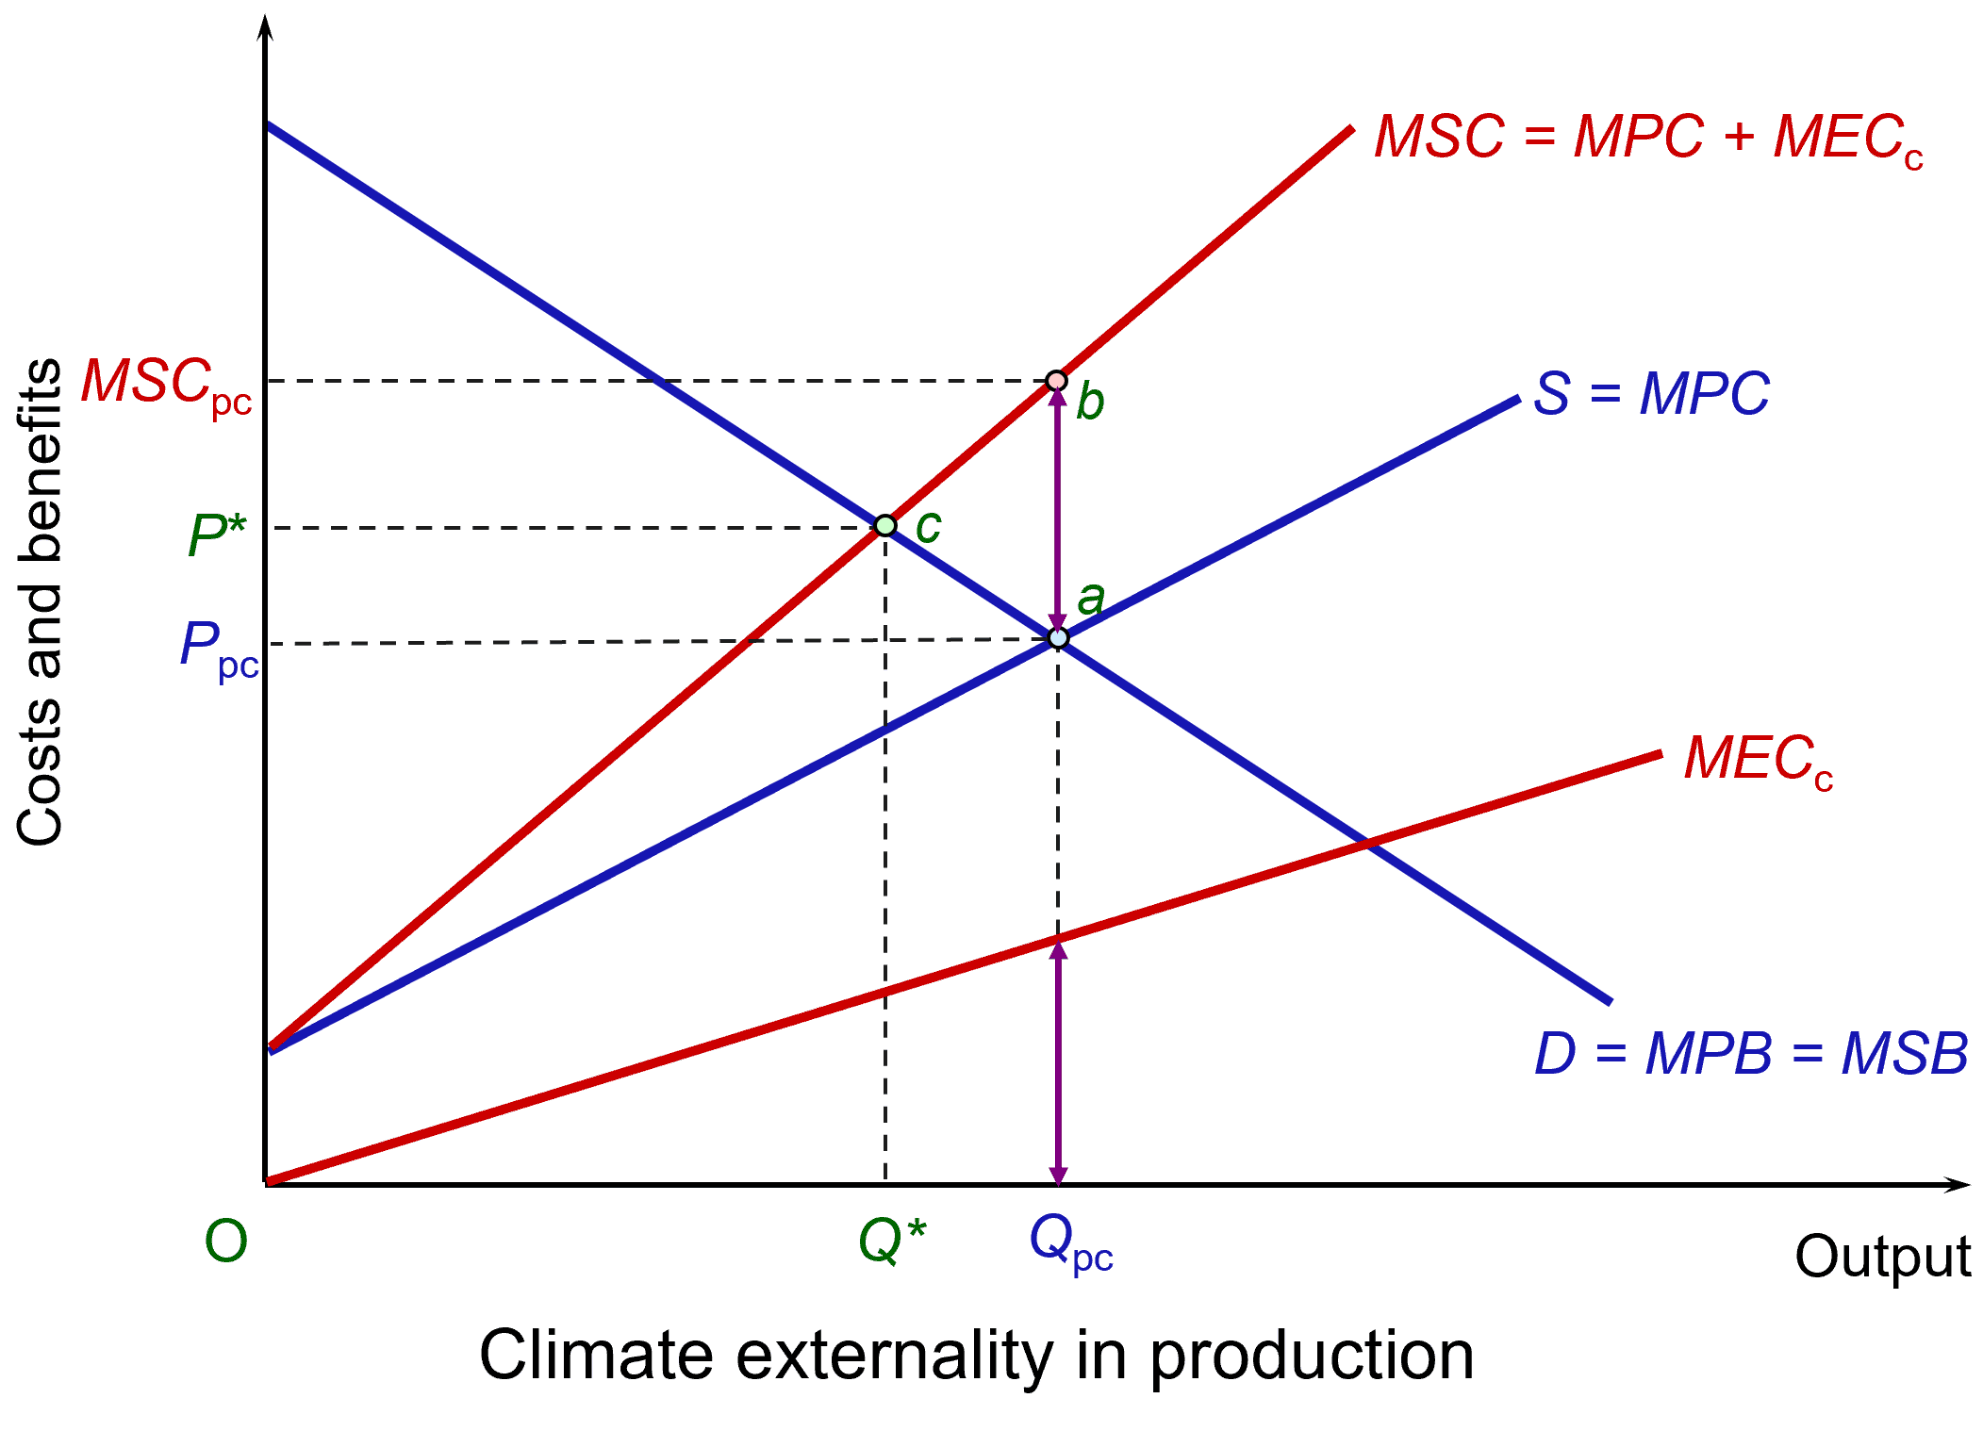 These climate costs are external costs to the firm and are illustrated in the figure. It shows an industry that emits CO2. To keep the analysis simple, assume that it is a perfectly competitive industry with demand and supply given by curves D and S, which are equal to the marginal private benefits (MPB) and marginal private costs (MPC), respectively. There are no externalities on the demand side and hence MPB equals the marginal social cost (MSB). Market equilibrium is at point a, with output at Qpc and price at Ppc. (Click here for a PowerPoint.)
Assume that the emissions create a marginal cost to society equal to MECc. Assume that the MEC increases as output and total emissions increase. The MECc line is thus upward sloping. At the market price of Qpc, these external climate costs are equal to the purple vertical line. When these external climate costs are added to private costs, this gives a marginal social cost given by MSC = MPC + MECc. The gives a socially optimal level of output of the product of Q* at a price of P*, with the optimum point of c.
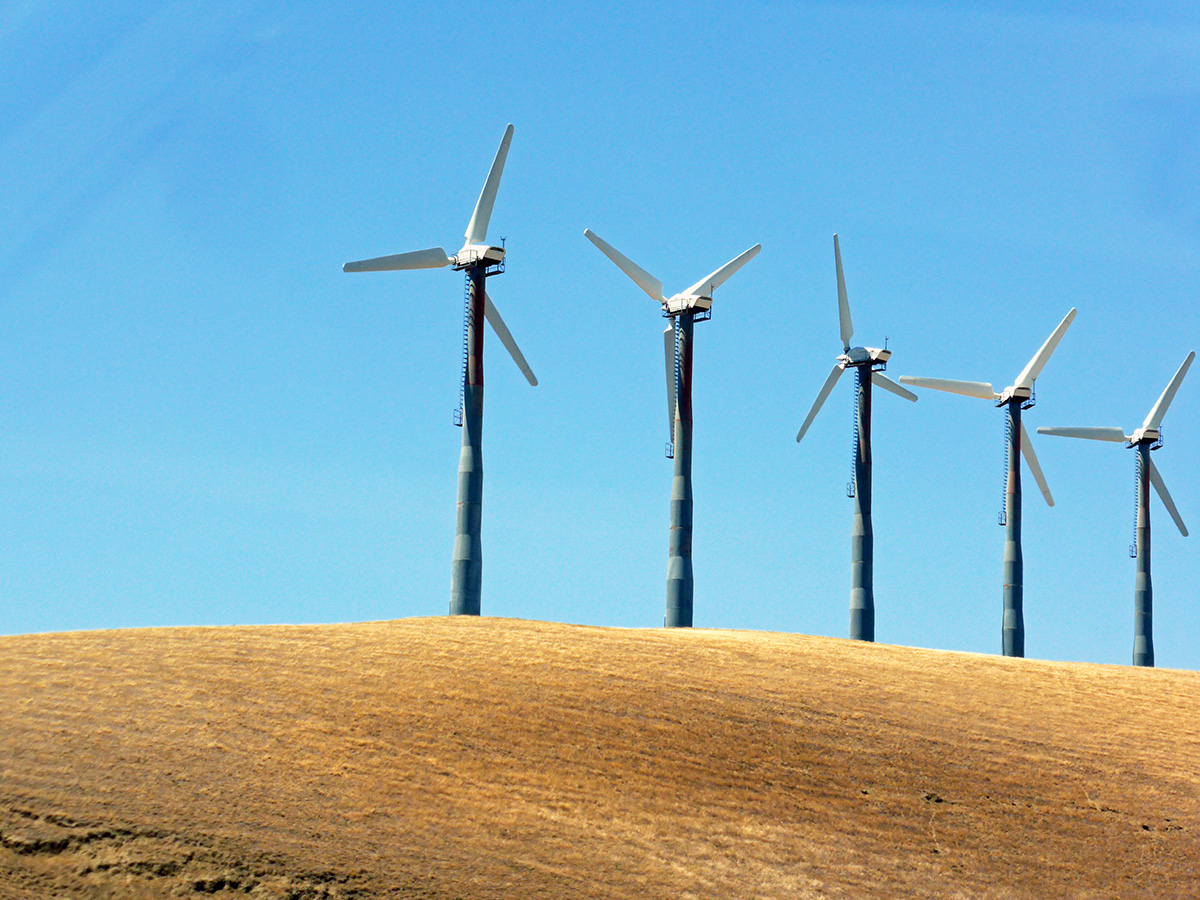 In other words, other things being equal, the free market overproduces products with climate externalities. If the output is to be reduced to the social optimum of Q*, then the government will need to take measures such as those advocated in the Paris Agreement. These could include imposing taxes on products, such as electricity generated by fossil fuels, or on the emissions themselves. Or green alternatives, such as wind power, could be subsidised.
Alternatively, regulations could be used to cap the production of products creating emissions, or caps on the emissions themselves could be imposed. Emissions permits could be issued or auctioned. Only firms in possession of the permits would be allowed to emit and the permits would cap emissions below free-market levels. These permits could be traded under a cap-and-trade scheme, such as the EU’s Emissions Trading Scheme. Again, such schemes are advocated under the Paris Agreement.
COP30 and progress in tackling climate change
 The USA is not attending COP30 in Brazil. Nor is the Chinese leader, Xi Jinping. However, there are growing opportunities for translating aims into practical policies for specific sectors, such as energy, transport and carbon-intensive industries. These policies may require some degree of government action – taxes, subsidies or regulation – to internalise climate externalities. But increasingly, green alternatives are becoming economically viable without subsidies or with just initial government funding to ‘crowd in’ private investment, which will then attract further private capital as external economies of scale kick in. Increasingly investors will find profitable opportunities in climate-friendly projects.
At the same time, while the USA is moving away from climate-friendly investment (as least for the term of the Trump Presidency), China is moving in the opposite direction, with massive investment in solar panels, wind turbines, EVs and batteries – investment that is bringing down their cost and thereby encouraging their adoption around the world. Such technologies create huge opportunities for low-income countries to provide affordable energy and to create local jobs, both skilled and unskilled. It also helps them achieve much greater energy security by reducing their reliance on fossil fuel imports
Chinese advances in green technology are also providing a stimulus to other countries to invest in renewable industries to prevent Chinese dominance. The danger, however, of Chinese dominance in the renewable sector in high-income countries is that it may encourage them to impose tariffs on Chinese imports of EVs, solar panels, etc. to protect their own industries.
But despite the growing opportunities for profitable adoption of green technologies without government support, there is still much that governments need to do to encourage the process. COP meetings are an important forum for discussing such policies and holding governments to account for meeting or not meeting their targets.
The agreement
The agreement reached at the end of the conference marked relatively small progress. There was agreement to increase finance from developed to developing countries to help them adapt to climate change. This would triple to $120bn per year, up from the previously agreed doubling, but the target date was pushed back to 2035 from the previously agreed 2030.
By the end of the conference, 122 of the 197 countries had submitted a new NDC – still 75 countries short, although others are expected.
The conference also agreed to establish a ‘just transition mechanism (JTM)’ to ‘enhance international cooperation, technical assistance, capacity-building and knowledge-sharing, and enable equitable, inclusive just transitions’. However, this is voluntary and no funding was attached, but it could act as the basis for future funding.
The biggest failure of the conference was probably the lack of agreement on phasing out of fossil fuels. This is not surprising given the opposition of the major oil producers. The hope is that the reduction in costs of renewable energy will drive the process anyway – a process that China is keen to accelerate with its investment in solar power and other renewable energy. One hopeful development, however, was the pledging of more than $9bn to halt deforestation, a major source of global warming. (See the Travers Smith article at the end of the Articles list below for a very useful summary of the outcome.)
Articles
- What is COP30 and why does it matter for the climate?
Chatham House, Anna Åberg (5/9/25)
- COP30 in Brazil: What is at stake for global collaboration on climate and nature?
World Economic Forum, Pim Valdre (5/11/25)
- What is COP30 and why does it matter?
CNN, Laura Paddison (11/11/25)
- Why COP 30 in Brazil Matters for a Thriving Economy and a Safe, Livable Planet
Union of Concerned Scientists (UCS),Rachel Cleetus (7/11/25)
- Nationally Determined Contributions: The Action Plans Behind Global Efforts To Fight the Climate Crisis
Center for American Progress (CAP, Kalina Gibson and Courtney Federico (22/9/25)
- New climate pledges only slightly lower dangerous global warming projections
UN Environment Programme, Press Release (4/11/25)
- COP30: Trump and many leaders are skipping it, so does the summit still have a point?
BBC News, Justin Rowlatt (10/11/25)
- Trump dismisses clean energy as ‘a joke.’ But Americans deserve facts, not fear
USA Today, Mark McNees (23/9/25)
- The surprising countries pulling off stunningly fast clean energy transitions
CNN, Ella Nilsen and Samuel Hart (7/11/25)
 Could the world’s biggest polluter be its savior against climate change?
CNN, Simone McCarthy (17/11/25)
- COP 2025: Outlook and Implications for Investors
RankiaPro, Joanna Piwko, Allegra Ianiri, Marie Lassegnore and Jean-Philippe Desmartin (10/11/25)
Post-agreement
- Belém: yet another cop out
Zero Hour, Allan Gray (25/11/25)
- Cop30’s watered-down agreements will do little for an ecosystem at tipping point
The Guardian, Fiona Harvey, Jonathan Watts, Damien Gayle and Damian Carrington (22/11/25)
- COP30: Five key takeaways from a deeply divisive climate summit
BBC News, Justin Rowlatt and Matt McGrath, (25/11/25)
- COP30: What were the key outcomes?
Travers Smith (1/12/25)
Information and Data
Questions
- Summarise the Paris Agreement.
- Summarise the Baku to Belém Roadmap to 1.3T.
- What incentives are there for countries to stick to their NCDs?
- Using a diagram similar to that above, illustrate how the free market will produce a sub-optimal amount of solar power because the marginal social benefit exceeds the marginal private benefit. How might the calculation be changing?
- How might game theory be used to analyse possible international decision making at COP conferences? How might this be affected by the attitudes of the Trump administration?
- Is it in America’s interests to cease investing in green energy and green production methods?
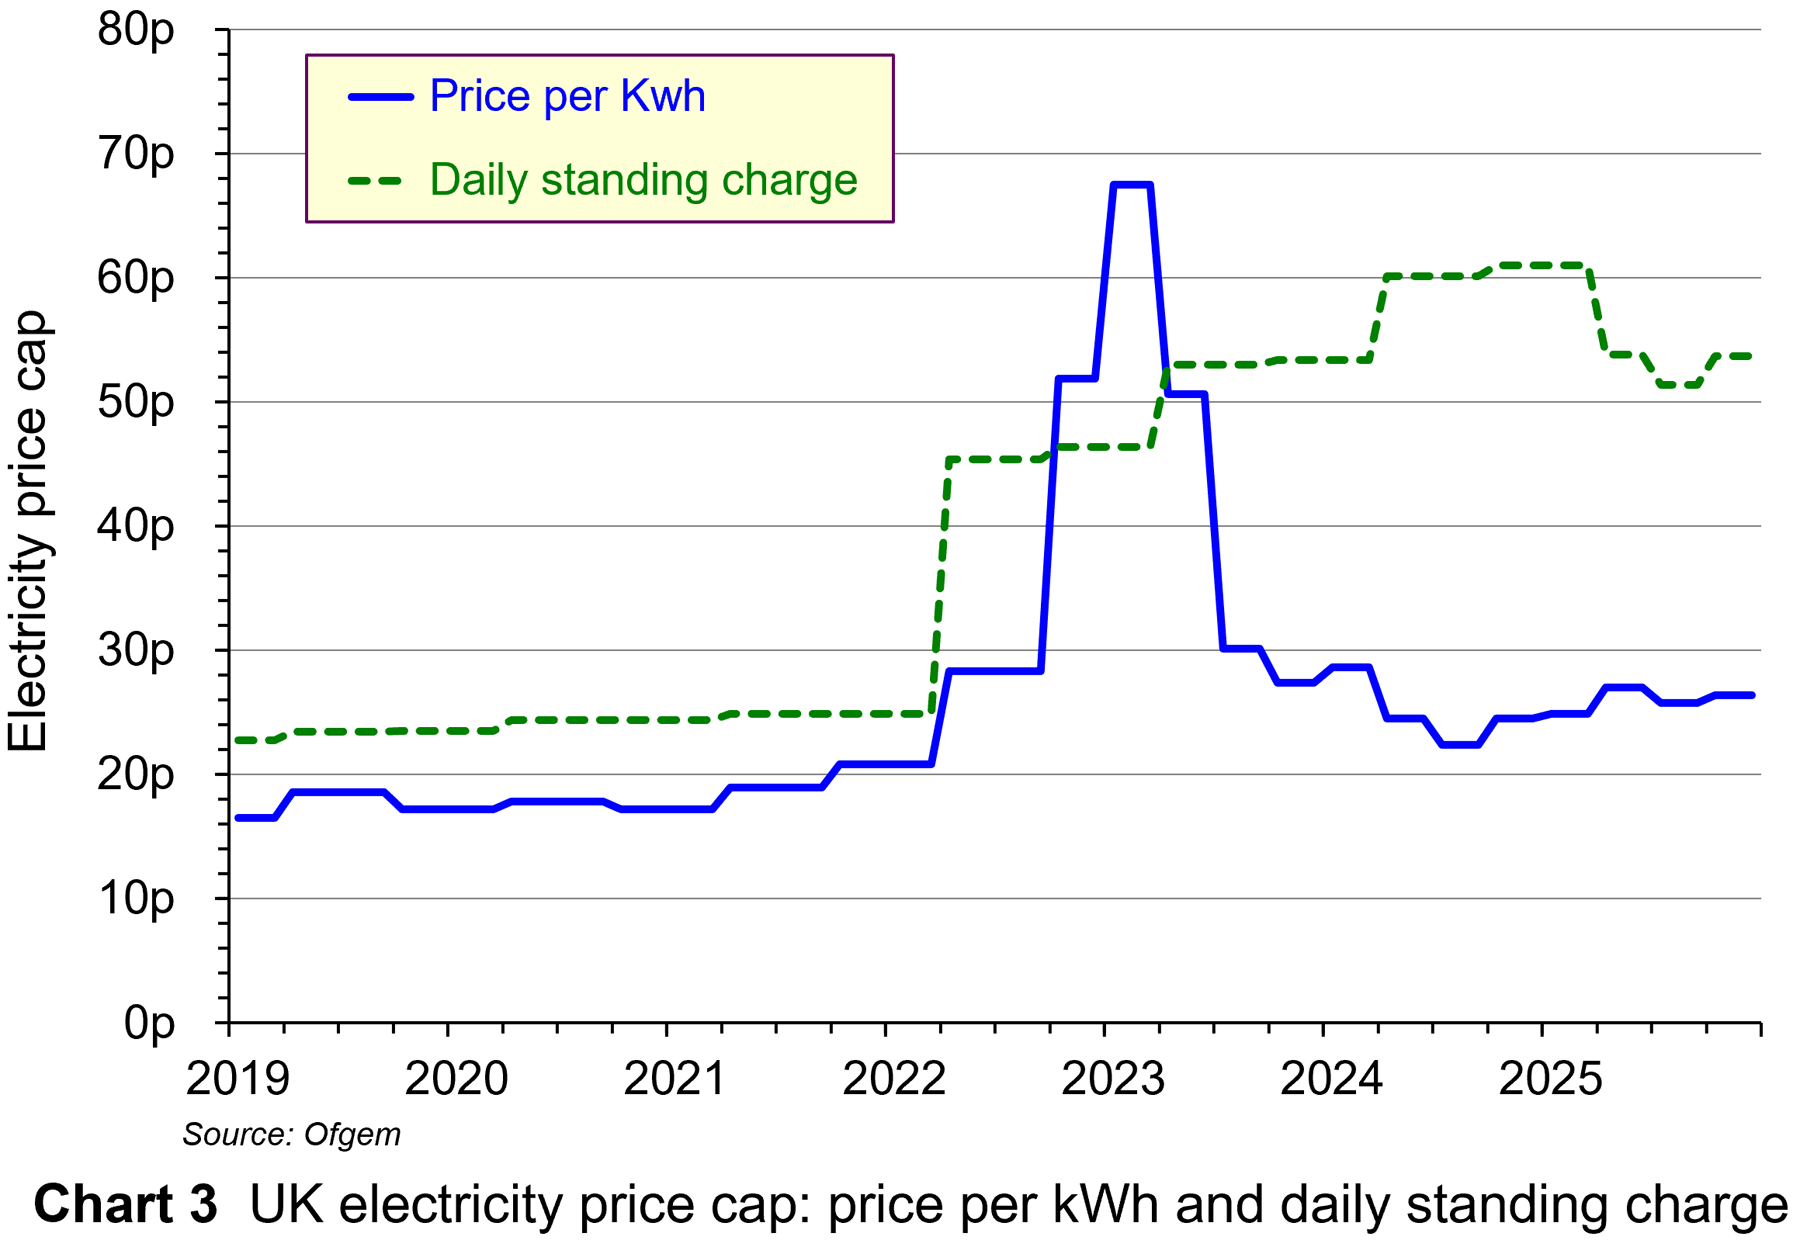
 The UK energy regulator, Ofgem, has announced that the UK energy price cap will rise in October by an average of 2%. The energy price cap sets the maximum prices for electricity and gas that can be charged by suppliers to households. For those paying by direct debit, the maximum electricity price per kilowatt-hour (kWh) will rise from 25.73p to 26.35p, with the maximum daily standing charge rising from 51.37p to 53.68p. As far as gas is concerned, the maximum price per kWh will fall slightly from 6.33p to 6.29p, with the maximum daily standing charge rising from 29.82p to 34.03p. Ofgem estimates that this will mean that the capped cost to the average household will rise from £1720 to £1755.
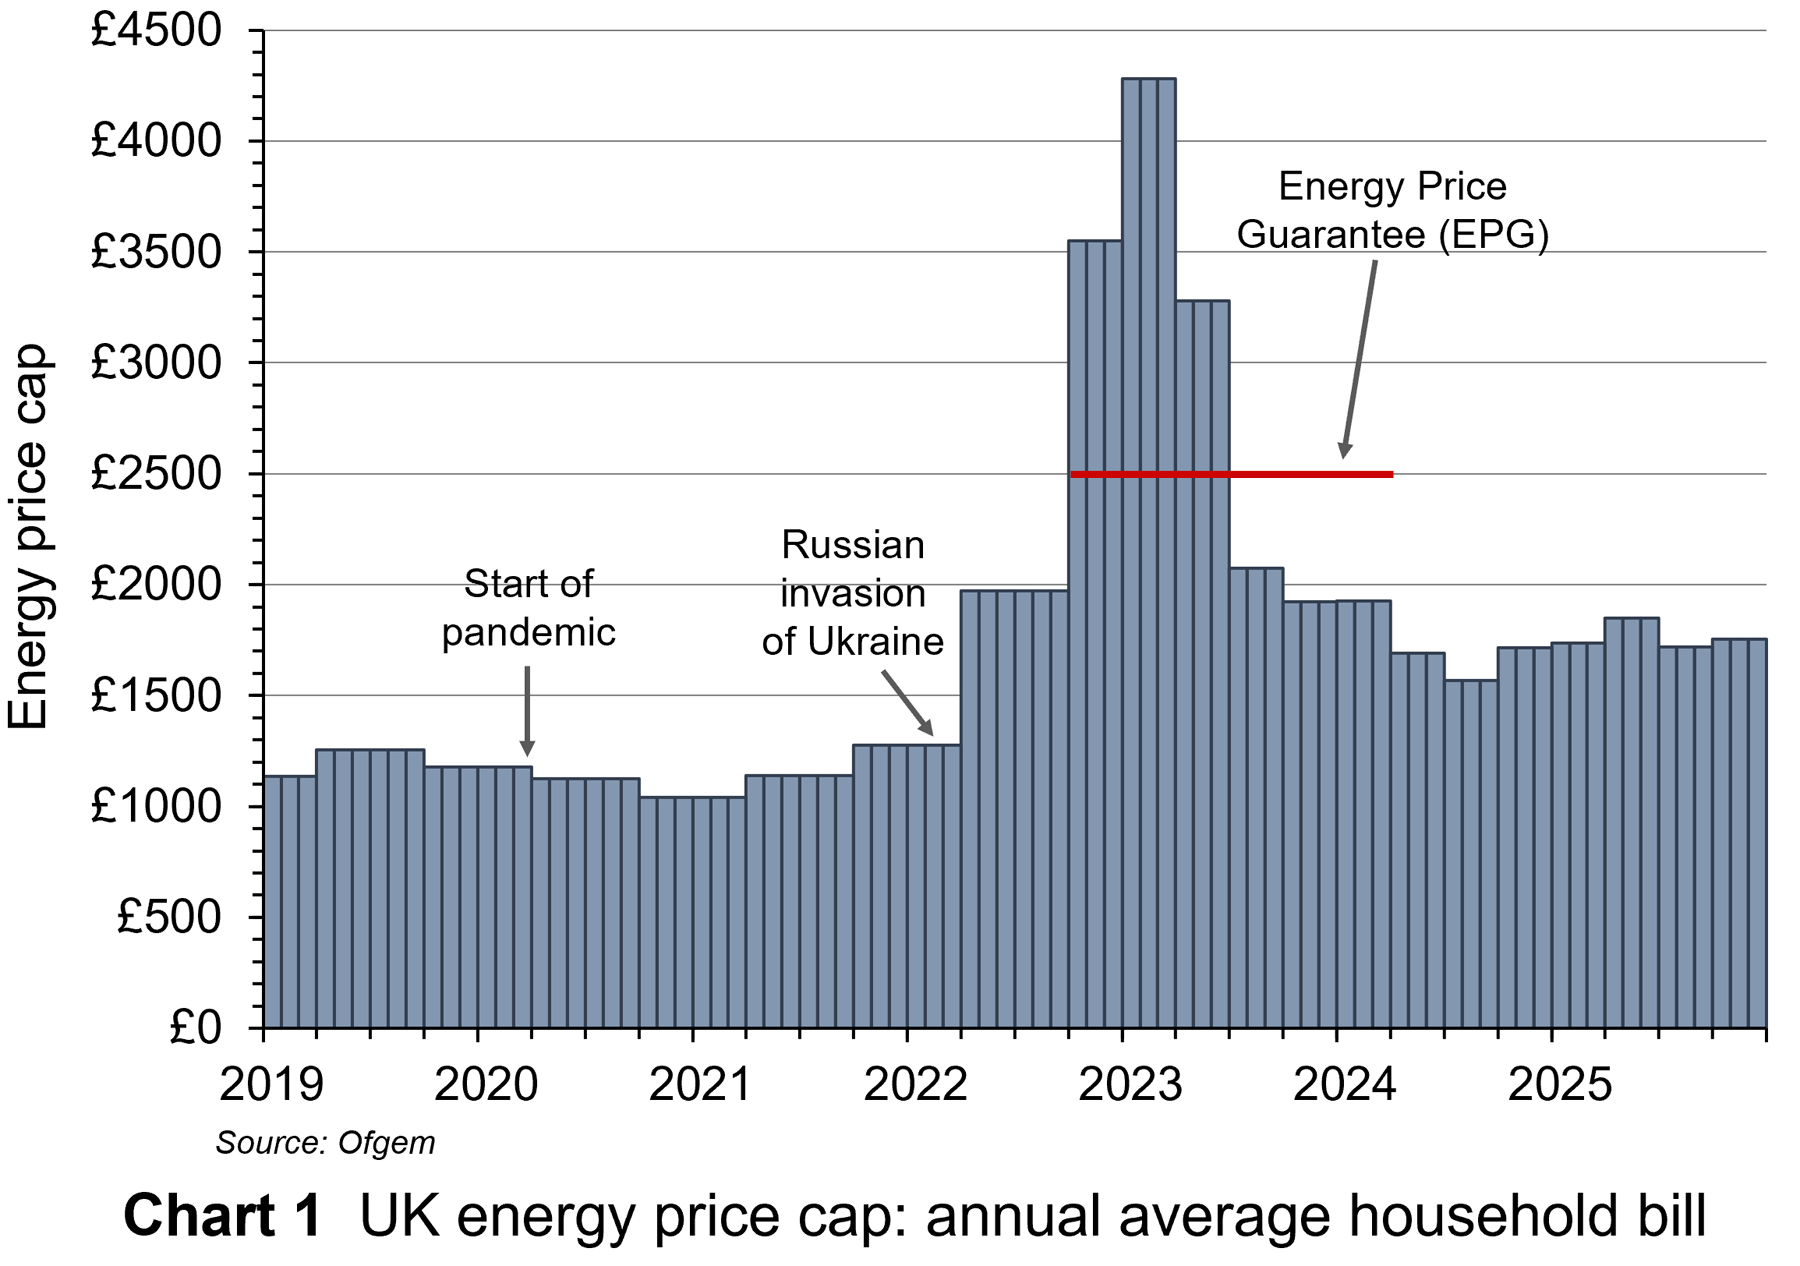 The average capped cost is now much lower than the peak of £4279 from January to March 2023. This followed the huge increase in international gas prices in the aftermath of the invasion of Ukraine and the cutting off of gas supplies from Russia. Note that although the suppliers received these capped prices, average consumers’ bills were limited to £2500 from October 2022 to March 2024 under the government’s Energy Price Guarantee scheme, with suppliers receiving a subsidy from the government to make up the shortfall. But despite today’s cap being much lower than at the peak, it is still much higher than the cap of £1277 prior to Russia’s invasion of Ukraine: see Chart 1 (click here for a PowerPoint).
So is the capped price purely a reflection of the international price of gas, or is it more complicated? The picture is slightly different for gas and electricity.
Gas prices
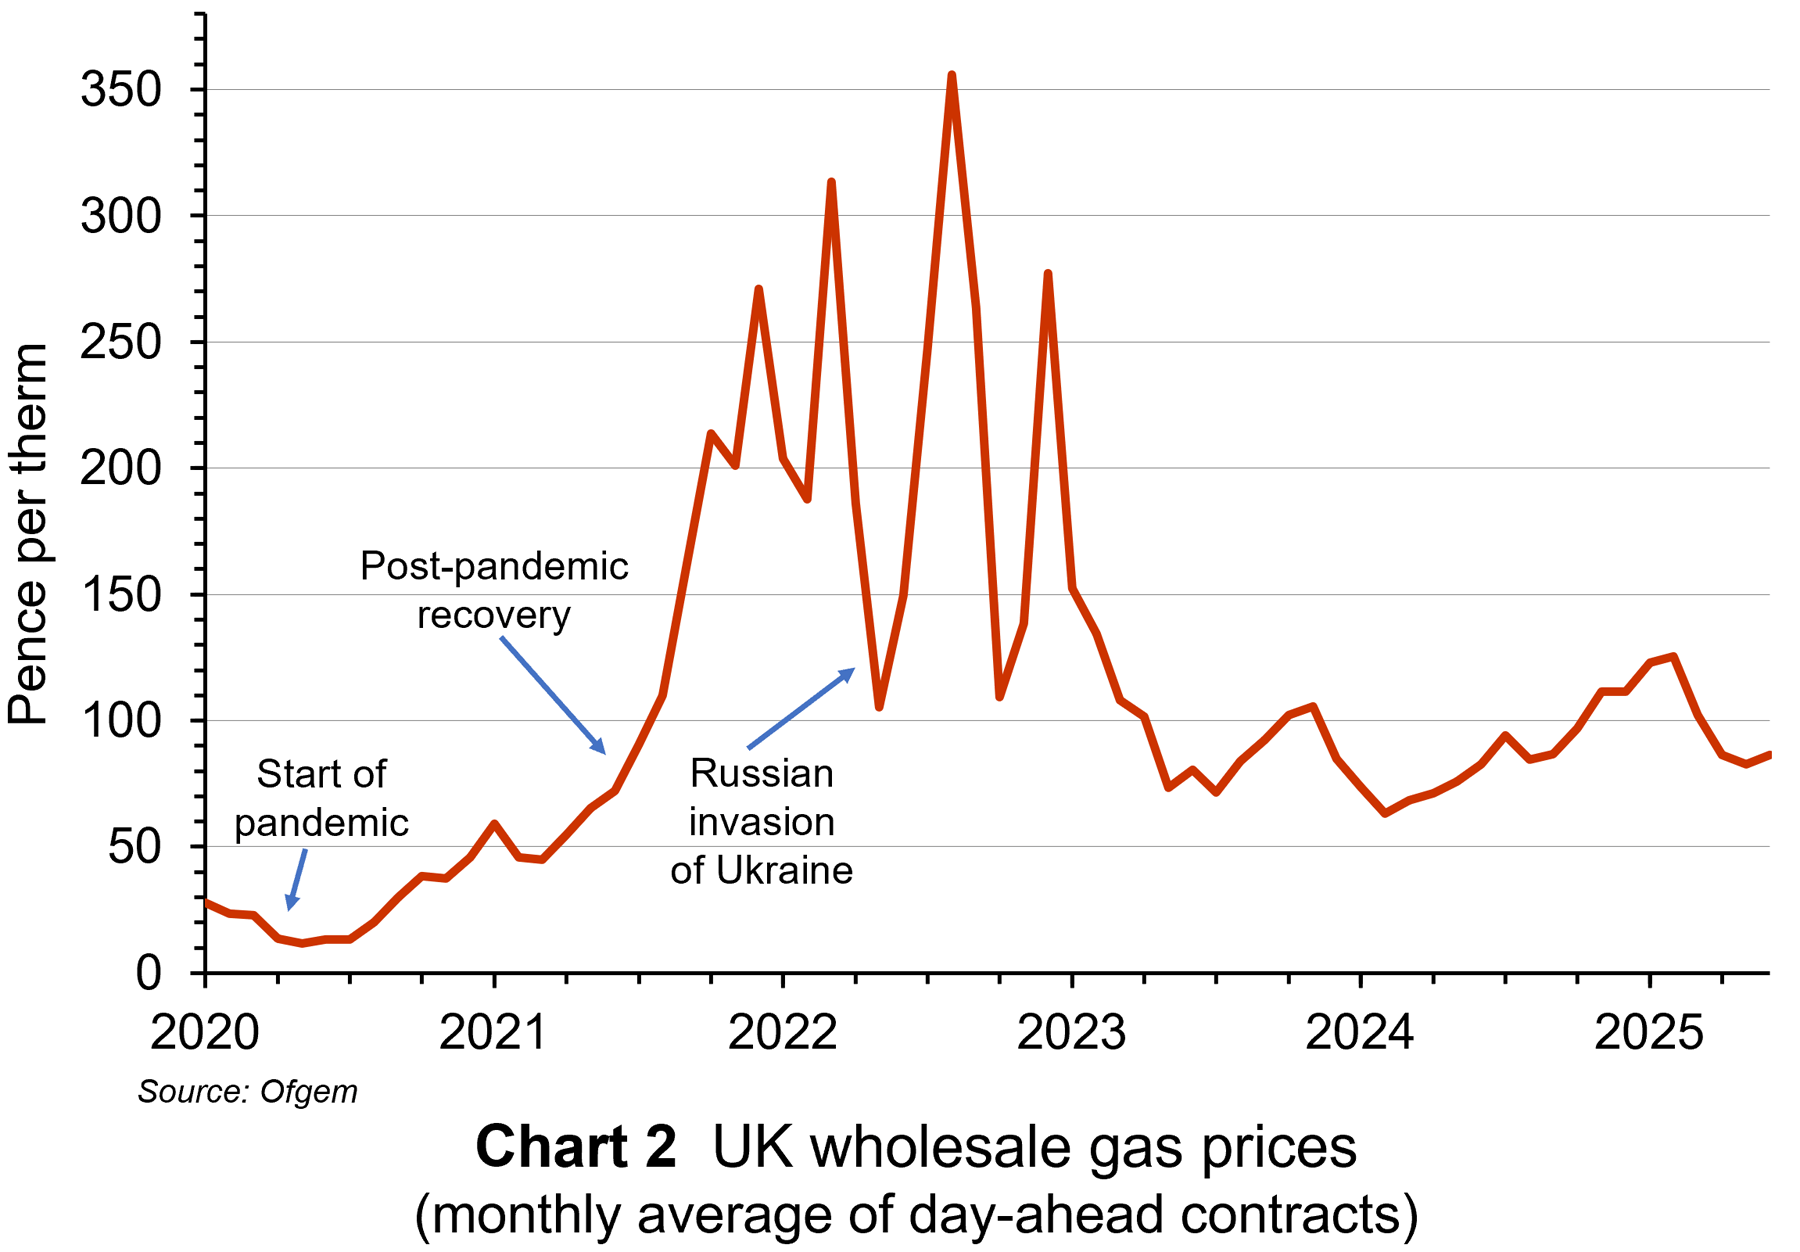 As far as gas prices are concerned, the price does largely reflect the international price: see Chart 2 (click here for a PowerPoint).
The UK is no longer self-sufficient in gas and relies in part on imported gas, with the price determined in volatile international markets. It also has low gas storage capacity compared with most other European countries. This leaves it highly reliant on volatile global markets in periods of prolonged high demand, like a cold winter. Is such cases, the UK often has to purchase more expensive liquefied natural gas (LNG) from global suppliers.
Additionally, taxes, environmental levies and the costs of the nationwide gas distribution network contribute to the overall price for consumers. Changes in these costs affect gas prices. These are itemised below in the case of electricity.
With electricity pricing, the picture is more complex.
Electricity prices
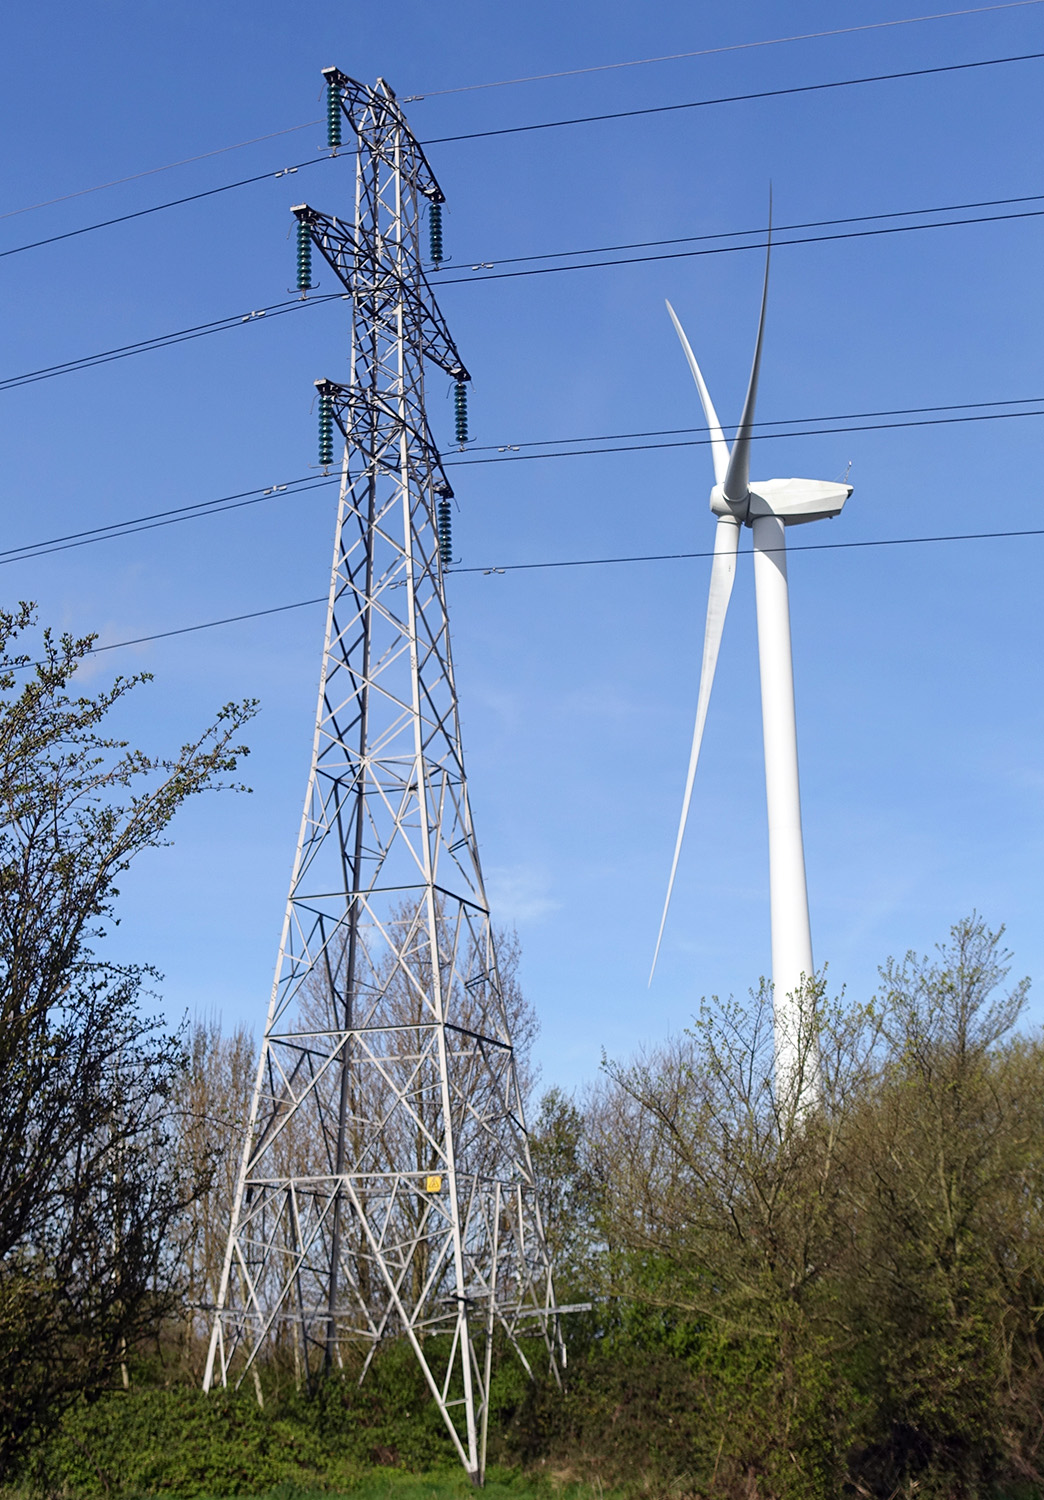
 Electricity generation costs vary considerably with the different methods. Renewable sources like wind and solar have the lowest marginal costs, while natural gas plants have the highest, although gas prices fluctuate considerably.
So how are consumer electricity prices determined? And how is the electricity price cap determined? The price cap for electricity per kWh and the daily standing charge for electricity are shown in Chart 3 (click here for a PowerPoint).
Marginal cost pricing. The wholesale price of electricity in the UK market is set by the most expensive power source needed to meet demand on a day-by-day basis. This is typically gas. This means that even when cheaper renewables (wind, solar, hydro) or nuclear power generate most of the electricity, high gas prices can increase the cost for all electricity. The wholesale price accounts for around 41% of the retail price paid by households.
 It also means that profits for low-marginal-cost producers could increase significantly when gas prices rise. To prevent such (low-carbon) suppliers making excess profits when the wholesale price is high and possibly making a loss when it is low, the actual prices that they receive is negotiated in advance and a contract is signed. These contracts are known as Contracts for Difference (CfDs). CfDs provide a fixed ‘strike price’ to low-carbon generators. The strike price is set so as to allow low-carbon generators to recoup capital costs and is thus set above the typical level of marginal cost. If the wholesale price is below the strike price, payments to generators to cover the difference are funded by amounts collected from electricity suppliers in advance using the CfD Supplier Obligation Levy. If the wholesale price is above the strike price, the difference is returned to consumers in terms of lower electricity bills.
Policy costs. Electricity bills include an element to fund various social and environmental objectives. This element is also included in the cap. From October to December 2025, this element of the cap will be 11.3%. The money helps to subsidise low-carbon energy generation and fund energy efficiency schemes. It also funds the Warm Home Discount (WHD). In the October to December 2025 price cap, this amounted to a discount for eligible low-income and vulnerable households of £150 per annum on their electricity bills. The WHD element is included in the standing charge in the price cap. From October 2025, more generous terms will mean that the number of households receiving WHD will increase from 3.4 million to 6.1 million households. This is the main reason for the £35 increase in the cap.
Network costs. These include the cost of building, maintaining and repairing the pipes and wires that deliver gas and electricity to homes. From October to December 2025, this element of the cap will be 22.6%.
Supplier business costs. These include operating costs (billing, metering, office costs, etc.) and servicing debt. From October to December 2025, this element of the cap will be 15.4%.
Profit Allowance. A small percentage is added to the price cap for energy suppliers’ profits. This is known as the Earnings Before Interest and Tax (EBIT) allowance and is around 2.4%. This has a fixed component that does not change when the overall price cap is updated and a variable component that rises or falls with changes in the cap.
Reliance on gas, low gas storage facilities, marginal cost pricing and the commitment to invest in low-carbon electricity and home heating all add to the costs of energy in the UK, making UK electricity prices among the highest in the world.
Articles
Information and Data
Questions
- Why are the UK’s energy prices among the highest in the world?
- What are the arguments for and against subsidising wind power?
- What is the Contracts for Difference scheme in low-carbon energy. What CfDs have been awarded? Assess the desirability of the scheme.
- Is the capping of gas and electricity prices the best way of providing support for low-income and vulnerable consumers?
- How are externalities relevant in determining the optimal pricing of electricity?
