Andy Burnham is set to become UK Prime Minister on 20 July if no-one else stands to replace Keir Starmer. In a speech on 29 June, he outlined his economic vision. Central to this is devolution, where a greater number of economic decisions would be taken locally rather than by central government. This approach has been dubbed ‘Manchesterism’, in reference to his time as Mayor of Greater Manchester from 2017 to earlier this year. Under his mayoralty, Greater Manchester (GM) achieved faster economic growth than other regions or cities in the UK. From 2017 to 2023, GM’s gross value added grew by an average of 6.6% per annum and the city of Manchester’s by 8.4% – the highest of any city in the UK. The UK average was 4.9% and London’s was 4.6%.
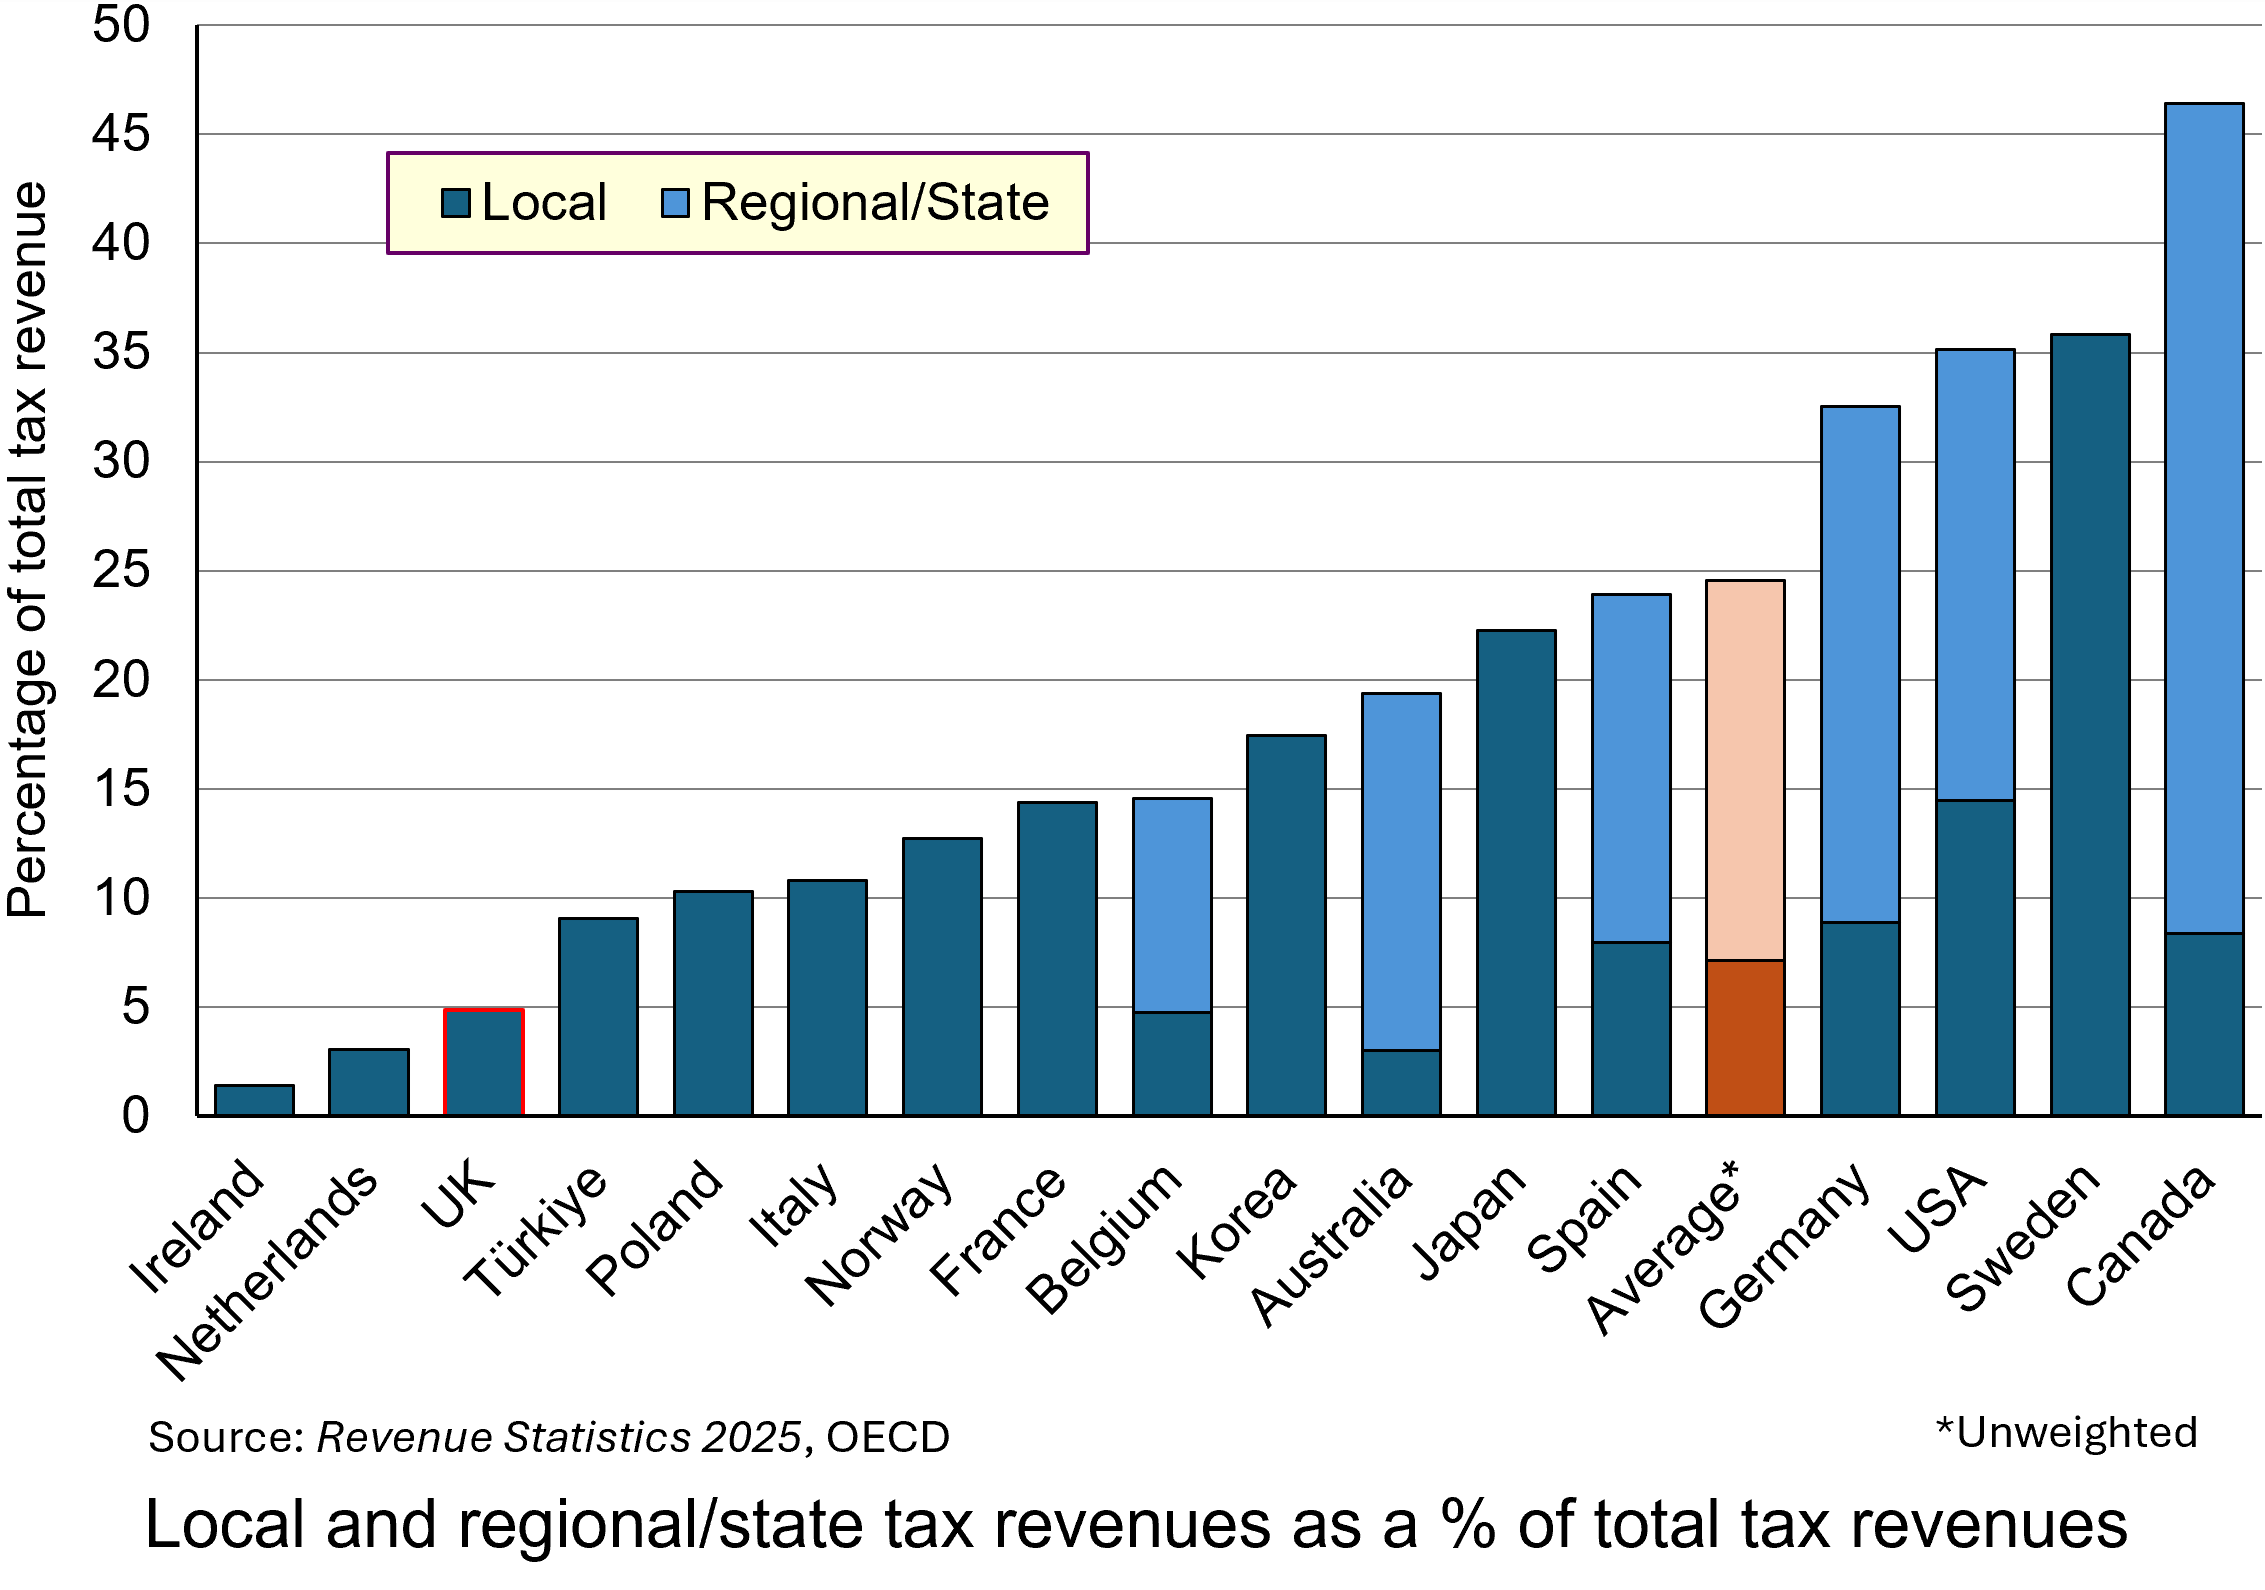 The UK, especially England, is one of the least devolved of the OECD countries. One aspect of this is taxation. The chart shows local taxes and, in the case of federal countries, state/regional/provincial taxes too. (Click here for a PowerPoint.)
Only 4.9% of UK tax revenue is in the form of local taxes (council tax and 50% of business rates) and the amount that can be raised in council tax is capped by the central government. The remainder of UK tax revenue goes to central government in the form of income taxes, social security taxes (national insurance), VAT, excise duties, etc. This compares with an average of 7.1% local taxes and 24.5% local plus regional taxes across the 17 OECD countries shown in the chart.
Andy Burnham plans to shift some of the spending and tax-raising powers from Whitehall to metro mayors and local councils. The aim is to stimulate productivity and economic growth at a regional and local level by tailoring support and incentives to local needs and strengths. Local leaders will be best positioned to understand these needs and strengths and will be able to customise spending and support appropriately.
 Examples of the types of greater autonomy over decision making would include:
- Control over adult education budgets to allow them to be tailored to provide training and apprenticeships to meet the skills requirements of existing and emerging industries in the area;
- Forming partnerships with local universities to support research and development that complements regional economic growth;
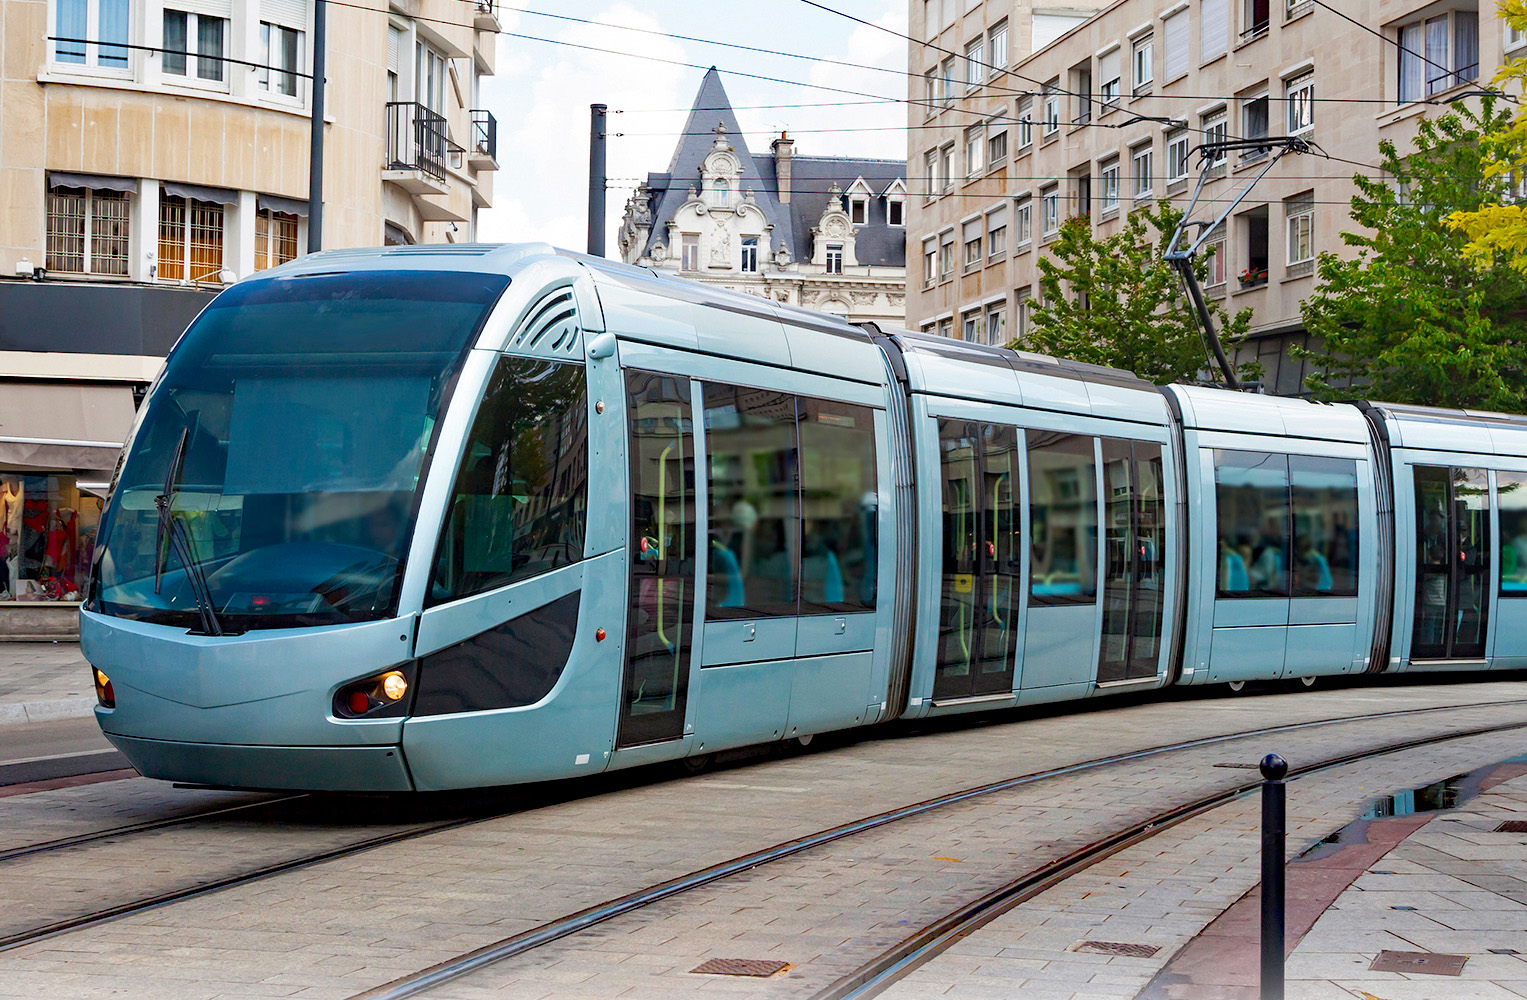
- Providing greater funding for and control over local transport infrastructure, including roads, buses, trams, trains, etc., with local consultation to make them fit for the local population and businesses;
- Tailoring business incentives to local needs and to the needs of the businesses themselves so as to attract an increase in investment;
- Greatly expanding council house building, which has virtually dried up in recent years, with mayors and/or local authorities empowered to develop local housing strategies, including affordable housing programmes, and to direct housing investment funding to particular housing developments in areas of greatest need.
Andy Burnham has pledged to stick to the government’s two existing fiscal rules:
a) The Stability Rule (Fiscal Mandate): the current (day-to-day) budget must be in balance or surplus. In other words the provision of salaries, public services, state pensions, welfare, etc. must be covered by government revenues (largely taxation). The government should borrow only to fund long-term investment.
b) The Debt Rule (Stock Mandate): each year, public-sector net financial liabilities (PSNFL) must be forecast by the OBR to be falling as a share of GDP compared to the previous year in three years’ time. This acts as a break on the amount of borrowing for long-term investment.
It is likely, therefore, that there will be little extra government money for investment. Rather, the policy involves a redistribution of public-sector investment from central government to mayoral/local authorities.
 In theory, such a policy of devolution need not see a redistribution from richer to poorer regions, but that might be part of the policy when the details are published. The UK has a bigger gap in productivity (GDP per worker) between its capital city and other large cities than in do other countries. Birmingham, Sheffield, Leeds, Newcastle, etc., as well as Cardiff, Glasgow, Edinburgh and Belfast, lag further behind London in output per head and economic growth than do other European countries lag behind their capital city. Thus the gap between Paris and Lyon, Toulouse and Marseille is narrower; as is that between Belin and Munich, Hamburg and Frankfurt. It is a similar picture in Spain and Italy. In the USA, some cities, such as San Francisco, outperform Washington DC and New York. A redistribution of government funding from London to the regions could see their incomes rise faster without having too much impact on London, which would still continue to attract large amounts of private investment.
Overall, there would be little increase in government funding. ‘Manchesterism’ is not, therefore, a demand-side policy. It is a supply-side policy – directing funds to areas where, combined with local incentives and local knowledge, the funding could yield greater returns and thereby increase potential GDP.
But this is not to say that there is no effect on aggregate demand. The hope is that devolution along the lines outlined by Andy Burnham will attract increased private investment, thereby increasing actual GDP as well as further increasing potential GDP.
We wait to see the details over the coming weeks.
Articles
- Will Andy Burnham’s devolution plan raise economic growth?
BBC Verify, Ben Chu (29/6/26)
- Burnham’s ‘Manchesterism’ could change the UK, but is not yet a full economic plan
BBC News, Faisal Islam (29/6/26)
- Burnham’s ‘Manchesterism’ got him to No 10 – but will it work for the UK?
BBC News, Faisal Islam (17/7/26)
- Burnham says there is some room for movement on tax
BBC News, Kate Wannel and Joshua Nevett (3/7/26)
- England’s mayors should be given sweeping new powers, says devolution expert
The Guardian, Kiran Stacey (2/7/26)
- What is Andy Burnham’s economic and political blueprint for Britain?
The Guardian, Richard Partington and Jessica Elgot (29/6/26)
- Why Andy Burnham’s radical plan relies on the Treasury being a friend of devolution
The Conversation, Dave Richards and Sam Warner (26/6/26)
- How Andy Burnham may try to give the UK economy a boost in his ‘10‑year plan’
The Conversation, Steve Schifferes (29/6/26)
- Could Andy Burnham let mayors raise more taxes?
House of Commons Research Briefing, Mark Sandford (2/7/26)
- Andy Burnham sets out policy plans in first major speech in PM leadership bid: Legal comments
Browne Jacobson, Dan Robinson (29/6/26)
- What does Andy Burnham think ‘Good Growth’ is?
Centre for Cities, Jess Tulasiewicz (30/6/26)
- Manchester’s digital transformation could be a blueprint for other parts of the UK
The Conversation, Richard Whittle (21/7/26)
Videos
Data
Questions
- Use an aggregate demand and supply diagram (simple or dynamic) to illustrate the effects on real GDP of a successful devolution strategy.
- Find out the details of the last Conservative government’s ‘levelling up’ policy. Was it similar in aims to that of ‘Manchesterism’?
- How could a policy of devolution as outlined by Andy Burnham affect income distribution within regions?
- Find out about the approach to regional policy in the EU. Is it similar to that being advocated by Andy Burnham?
- What is meant by ‘regional multipliers’? Why might they differ from the national multiplier?
 Wes Streeting and Andy Burnham are seeking to become UK Prime Minister in a challenge to Keir Starmer. They have both responded to an essay by Tony Blair, former Labour Prime Minister, where he argued that current Labour policies were holding back business. But the essay never mentioned inequality. According to Burnham and Streeting, inequality and the related issue of poverty are fundamental to the crises facing society in western democracies. Countries’ economic success is typically measured in terms of growth in GDP. But when the benefits of growth go largely to those at the top of the income scale, while people on lower incomes struggle to make ends meet, this feeds resentment. Populist politicians stoke such resentment and offer simplistic solutions, such as protectionism, blaming outsiders and promising a return to better times.
But just what has happened to inequality over recent years and has poverty deepened? How are inequality and poverty affecting people’s lives and what is the impact on the economy? And what policies should governments follow to tackle the problem?
Income inequality
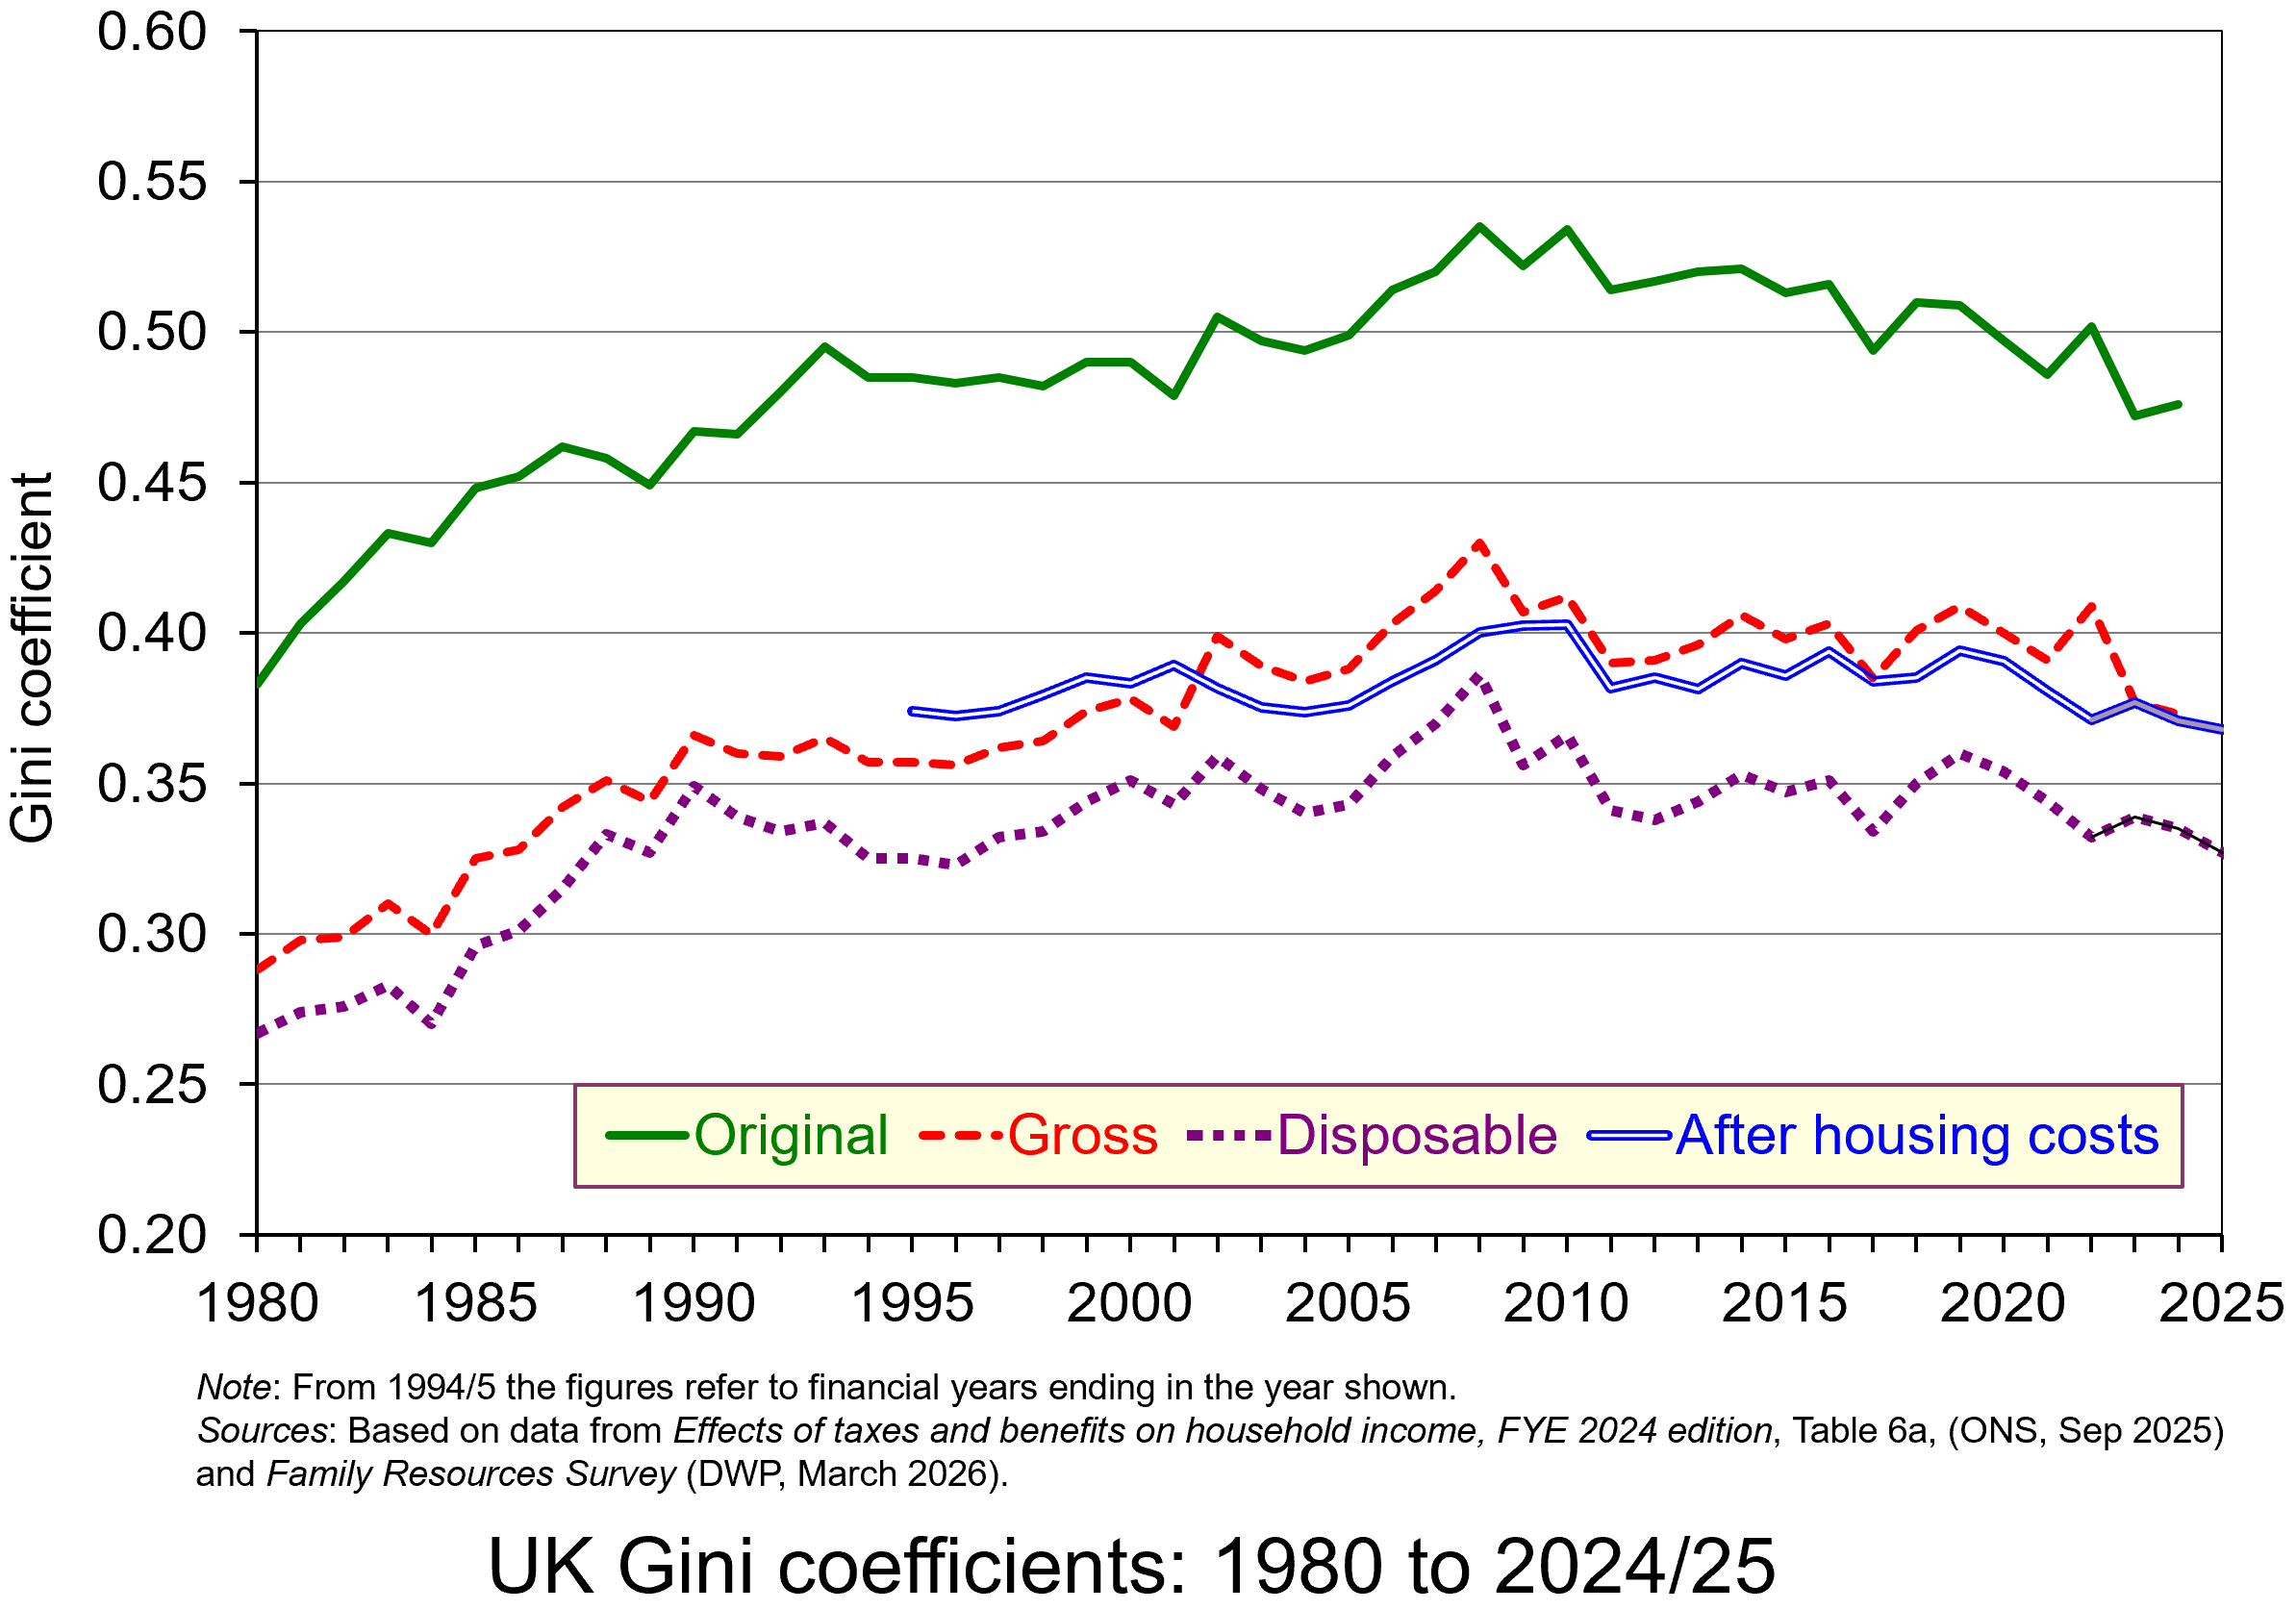 The chart shows UK inequality as given by the Gini coefficient, where 1 represents complete inequality, with one person earning the whole of national income and 0 represents perfect equality, with everyone earning the same. The higher the figure, therefore, the greater the inequality. As you can see, inequality is greatest when looking at original income – that is, income before taxes and benefits. Gross income includes benefits, and disposable income is income after both benefits and taxes. You can see that both benefits and taxes reduce inequality. When we take housing costs into account with the disposable income measure, however, inequality increases.
The chart shows that income inequality rose until the early 2000s, since when there have been only slight changes, although there has been a small decline recently.
The UK has higher income inequality than most high-income countries, although it is not as high as in the USA. It is sixth most unequal of the 38 OECD countries and the most unequal OECD member in Europe.
Globally, in 2025, the top 10% of the world’s population earned 53% of global income, while the bottom half earned just 8%. The reports listed below provide data and analysis on UK and global inequality.
Wealth inequality
 When we turn to wealth, inequality in the UK is even greater. The richest 10% of households hold around 41% of wealth, while the poorest 50% hold just under 10%. The Gini coefficient is around 0.6. This has been drive by a rise in property and share prices and the system of inheritance whereby family wealth can accumulate over the generations.
Globally, the top 10% of the world’s population held 75% of global wealth in 2025, whereas the bottom 50% held just 2%. And a tiny group of people – the top 0.001% of the adult population (about 56,000 individuals) – held about 6% of global wealth, up from 4% in 1995. Such extreme wealth inequality has thus increased.
Inequality and poverty
 There is no single measure of poverty. It could be measured in terms of basic needs. Here poverty would be where a person is unable to afford basic food, shelter, heating and lighting, clothing, footwear and basic toiletries. Normally, however, it is measured in relative terms. A typical measure, and one used by the Joseph Rowntree Foundation, is based on a proportion of median income. Poverty is defined as income below 60% of the median income, with deep poverty below 50% and very deep poverty below 40%.
In 2023/24, 14.2 million people were in poverty (20% of the population), of whom around 4.5 million were children. Of the 14.2 million, 6.8 million people (nearly half) were in very deep poverty,
 Causes of poverty include one or more of the following: low skills or education, low pay, unemployment, inadequate benefits or a benefit system that is confusing or difficult to access, chronic sickness, disability, unavailability or cost of suitable housing, discrimination, a breakdown of personal relationships, substance abuse, abuse from others, a criminal record. Once in poverty, it becomes difficult to escape as people become deskilled, demotivated and judged by society.
But even if people are not earning less than 60% of median income, they can still struggle to escape inequality. Many people have low skills; many routine jobs are being replaced by automation or AI; many graduates face high debts; people struggle to get on the housing ladder; the rising cost of basic items dampens real incomes, especially of the low paid; people may face discrimination of various sorts; people do not have an option of joining a union in their workplace; people may have a large number of dependants.
The policy agenda
If inequality rises up the political agenda in the UK, especially with a potential leadership race in the Labour party, what might politicians focus on? The government has already done the following:
- It has raised the minimum wage (the ‘National Living Wage’) substantially from £10.42 in 2023/24 to £11.44 in 2024/25, to £12.21 in 2025/26 and lowered the age limit from 23 to 21. There have been larger percentage rises for 18–20 year-olds and those under 18.
- The two-child limit to the child benefit element in Universal Credit has been scrapped and so now parents are eligible for benefits for all children.
- The Employment Rights Act has ended exploitative zero-hour contracts by providing rights to guaranteed hours.
- It has expanded free school meal entitlements.
- It has capped Universal Credit debt deductions at 15% of increased incomes (down from 25%) to help the poorest households retain more of their monthly income.
- It has expanded free school meals and made more money available for free nursery place.
- Landlords can no longer evict tenants for no reason; they must have a valid reason such as wanting to sell the property or severe rent arrears.
- Landlords cannot increase rents more than once per year and tenants can appeal excessive or above-market rent increases to an independent tribunal.
But despite these policy measures, many claim that they will do too little to tackle inequality and poverty. Some on the left argue that taxes on property and other forms of wealth will be required to tackle wealth inequality. Others argue that more emphasis on education and training is necessary to provide workers with the skills to earn more in the labour market. Others argue for greater expenditure on public services.
Generally, however, measures to tackle inequality and poverty require government expenditure, which must be funded. This is why many on the centre left argue that economic growth is a necessary condition for any significant redistribution. It is, they argue, the best way of providing the tax revenue to fund redistribution.
Incentives and disincentives
 Many on the right argue that redistributing incomes through higher taxes and benefits will act as a disincentive to work and to invest. As we argue in Essentials of Economics, higher income taxes could discourage people from working and investing; higher wealth taxes could discourage people from saving and investing.
The key to analysing these arguments is to distinguish between the income effect and the substitution effect of raising taxes. Raising income tax does two things.
- It reduces disposable incomes. People therefore are encouraged to work more in an attempt to maintain their consumption of goods and services. This is the income effect. ‘I have to work more to make up for the higher taxes’, a person might say.
- It reduces the opportunity cost of leisure. Since higher income taxes reduce take-home pay, an extra hour taken in leisure now involves a smaller sacrifice in consumption. Thus people may substitute leisure for consumption, and work less. This is called the substitution effect. ‘What is the point of doing overtime’, another person might say, ‘if so much of the overtime pay is going in taxes?’
The relative size of the income and substitution effects is likely to differ for different types of people. For example, the income effect is likely to dominate for those people with a substantial proportion of long-term commitments, such as those with families, with mortgages and other debts. They may feel forced to work more to maintain their disposable income. Clearly for such people, higher taxes are not a disincentive to work. The income effect is also likely to be relatively large for people on higher incomes, for whom an increase in tax rates represents a substantial cut in income.
The substitution effect is likely to dominate for those with few commitments: those whose families have left home, the single, and second income earners in families where that second income is not relied on for ‘essential’ consumption. A rise in tax rates for these people is likely to encourage them to work less.
Although high income earners may work more when there is a tax rise, they may still be discouraged by a steeply progressive tax structure. If they have to pay very high marginal rates of tax, it may simply not be worth their while seeking promotion or working harder.
What those on the centre and left argue is that tackling inequality and poverty requires more than just changing the tax and benefits system. What is required is policies that encourage greater upward social mobility, greater social cohesion and greater expenditure on infrastructure that will support the poor, such as greater expenditure on education and training, on support for very young children, on preventative healthcare, on social housing and on local public transport.
Articles
- Burnham and Streeting accuse Blair of ignoring inequality as they hit back at ex-PM
BBC News, Brian Wheeler and Richard Wheeler (27/5/26)
- Streeting and Burnham accuse Blair of failing to confront inequality in Labour criticism
The Guardian, Jessica Elgot (27/5/26)
- Alan Milburn is right, a young generation has been betrayed. Forget Tony Blair: we must attend to this
The Guardian, Polly Toynbee (28/5/26)
- Blair wants to leave our future to the markets. I believe democracy can still shape our lives for the better
The Guardian, Wes Streeting (27/5/26)
- New evidence on international inequality of opportunity – how does the UK rank?
The Sutton Trust, Opinion, Esme Lillywhite (25/9/25)
- Sorry, comrade Burnham. Inequality is a good thing
Telegraph on archive.today, Luke Johnson (29/5/26)
- Why America’s rich keep getting richer
CNN, David Goldman (29/5/26)
- Concern about inequality is not mere envy
LSE blogs, David Lay Williams (13/1/26)
- Are new technologies fuelling wage inequality? Evidence from Spain
LSE blogs, Raquel Sebastián, Pedro Salas-Rojo, Juan César Palomino and Juan Gabriel Rodríguez (24/3/26)
- 56,000 people own three times more wealth than half of humanity
LSE blogs, Ricardo Gómez-Carrera (12/5/26)
- The broad economic impact of inequality
Harvard Institute for Business in Global Society, Drew Keller and Susan Milligan (8/7/25)
- The New Inequality
Substack, Paul Krugman (31/5/26)
- Global Justice Report: the World Inequality Lab maps a path to €5,000-a-month average incomes for all countries within +1.8°C of warming
World Inequality Lab (4/6/26)
- ‘An equal and habitable world is possible’: academics set out sweeping vision for planetary survival
The Guardian, Jonathan Watts (4/6/26)
Reports
- Living standards, poverty and inequality in the UK
Institute for Fiscal Studies (26/3/26)
- Are fewer people living in poverty than previously thought?
Institute for Fiscal Studies, Jed Michael, Sam Ray-Chaudhuri and Tom Wernham (26/3/26)
- Income inequality in the UK
House of Commons Library, Brigid Francis-Devine (14/5/26)
- The Scale of Economic Inequality in the UK
Equality Trust
- Causes of inequality
Equality Trust
- UK Poverty 2026
Joseph Rowntree Foundation (27/1/26)
- Households Below Average Income: An analysis of the UK income distribution: FYE 1995 to FYE 2025
Department for Work & Pensions (26/3/26)
- Household income inequality, UK: financial year ending 2024
ONS (2/5/25)
- Unequal Chances: Children and economic inequality
UNICEF Innocenti (May 2026)
- To Have and Have Not – How to Bridge the Gap in Opportunities
OECD (22/9/25)
- World Inequality Report 2026
World Inequality Lab, Lucas Chance, Ricardo Gómez-Carrera (Lead Author), Rowaida Moshrif and Thomas Piketty
- The Global Justice Report
World Inequality Lab, L Chance, C Mohren, R Moshrif, M Odersky, T Piketty, A Somanchi, et al (4/6/26)
Data
Questions
- Is the UK becoming more or less equal? Does the answer depend on how inequality is measured?
- Is the world becoming more or less equal?
- Summarise the arguments against redistributing incomes from the rich to the poor.
- Summarise the arguments in favour of redistributing incomes from the rich to the poor.
- Explain the income and substitution effects of making income tax more progressive.
- How is the greater adoption of AI likely to affect income distribution?
- How does social mobility affect income distribution? What measures can be adopted to increase social mobility?
- Compare the relative merits and problems of raising income taxes, wealth taxes and expenditure taxes as means of redistributing incomes more equally.
 Can Andy Burnham deliver on his promise to rewire Britain’s economy?