
Andy Burnham is set to become UK Prime Minister on 20 July if no-one else stands to replace Keir Starmer. In a speech on 29 June, he outlined his economic vision. Central to this is devolution, where a greater number of economic decisions would be taken locally rather than by central government. This approach has been dubbed ‘Manchesterism’, in reference to his time as Mayor of Greater Manchester from 2017 to earlier this year. Under his mayoralty, Greater Manchester (GM) achieved faster economic growth than other regions or cities in the UK. From 2017 to 2023, GM’s gross value added grew by an average of 6.6% per annum and the city of Manchester’s by 8.4% – the highest of any city in the UK. The UK average was 4.9% and London’s was 4.6%.
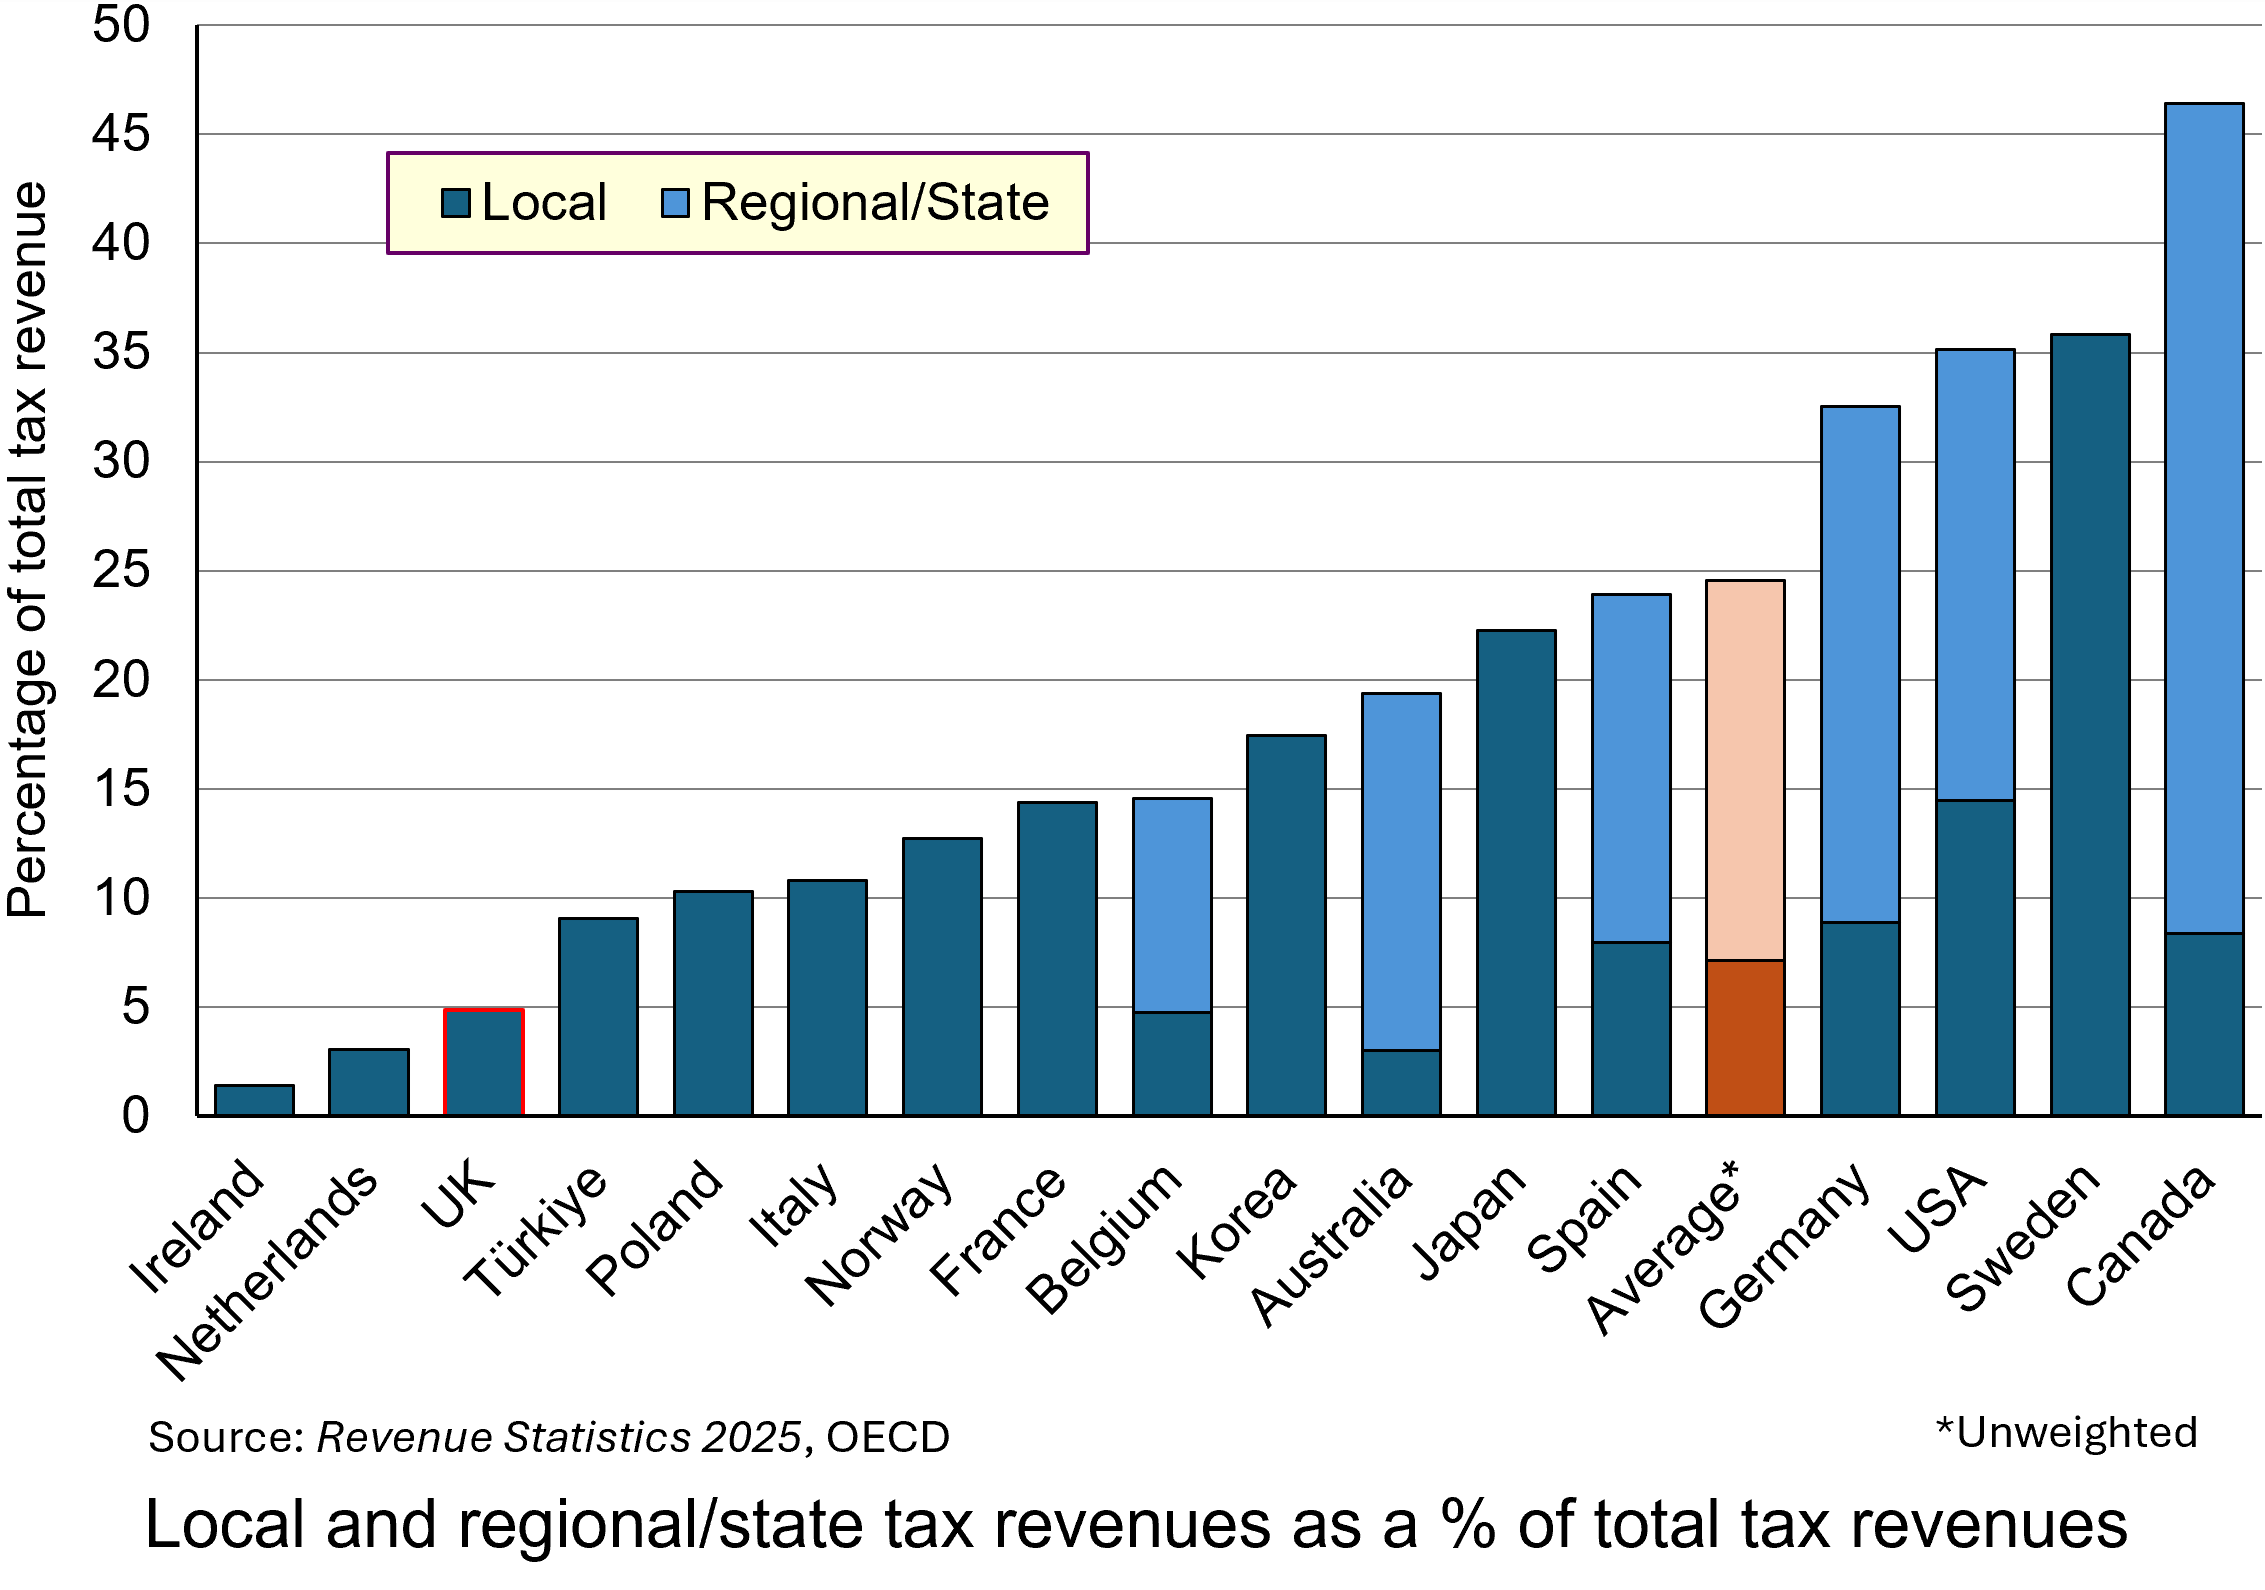 The UK, especially England, is one of the least devolved of the OECD countries. One aspect of this is taxation. The chart shows local taxes and, in the case of federal countries, state/regional/provincial taxes too. (Click here for a PowerPoint.)
Only 4.9% of UK tax revenue is in the form of local taxes (council tax and 50% of business rates) and the amount that can be raised in council tax is capped by the central government. The remainder of UK tax revenue goes to central government in the form of income taxes, social security taxes (national insurance), VAT, excise duties, etc. This compares with an average of 7.1% local taxes and 24.5% local plus regional taxes across the 17 OECD countries shown in the chart.
Andy Burnham plans to shift some of the spending and tax-raising powers from Whitehall to metro mayors and local councils. The aim is to stimulate productivity and economic growth at a regional and local level by tailoring support and incentives to local needs and strengths. Local leaders will be best positioned to understand these needs and strengths and will be able to customise spending and support appropriately.
 Examples of the types of greater autonomy over decision making would include:
- Control over adult education budgets to allow them to be tailored to provide training and apprenticeships to meet the skills requirements of existing and emerging industries in the area;
- Forming partnerships with local universities to support research and development that complements regional economic growth;
- Providing greater funding for and control over local transport infrastructure, including roads, buses, trams, trains, etc., with local consultation to make them fit for the local population and businesses;
- Tailoring business incentives to local needs and to the needs of the businesses themselves so as to attract an increase in investment;
- Greatly expanding council house building, which has virtually dried up in recent years, with mayors and/or local authorities empowered to develop local housing strategies, including affordable housing programmes, and to direct housing investment funding to particular housing developments in areas of greatest need.
Andy Burnham has pledged to stick to the government’s two existing fiscal rules:
a) The Stability Rule (Fiscal Mandate): the current (day-to-day) budget must be in balance or surplus. In other words the provision of salaries, public services, state pensions, welfare, etc. must be covered by government revenues (largely taxation). The government should borrow only to fund long-term investment.
b) The Debt Rule (Stock Mandate): each year, public-sector net financial liabilities (PSNFL) must be forecast by the OBR to be falling as a share of GDP compared to the previous year in three years’ time. This acts as a break on the amount of borrowing for long-term investment.
It is likely, therefore, that there will be little extra government money for investment. Rather, the policy involves a redistribution of public-sector investment from central government to mayoral/local authorities.
 In theory, such a policy of devolution need not see a redistribution from richer to poorer regions, but that might be part of the policy when the details are published. The UK has a bigger gap in productivity (GDP per worker) between its capital city and other large cities than in do other countries. Birmingham, Sheffield, Leeds, Newcastle, etc., as well as Cardiff, Glasgow, Edinburgh and Belfast, lag further behind London in output per head and economic growth than do other European countries lag behind their capital city. Thus the gap between Paris and Lyon, Toulouse and Marseille is narrower; as is that between Belin and Munich, Hamburg and Frankfurt. It is a similar picture in Spain and Italy. In the USA, some cities, such as San Francisco, outperform Washington DC and New York. A redistribution of government funding from London to the regions could see their incomes rise faster without having too much impact on London, which would still continue to attract large amounts of private investment.
Overall, there would be little increase in government funding. ‘Manchesterism’ is not, therefore, a demand-side policy. It is a supply-side policy – directing funds to areas where, combined with local incentives and local knowledge, the funding could yield greater returns and thereby increase potential GDP.
But this is not to say that there is no effect on aggregate demand. The hope is that devolution along the lines outlined by Andy Burnham will attract increased private investment, thereby increasing actual GDP as well as further increasing potential GDP.
We wait to see the details over the coming weeks.
Articles
- Will Andy Burnham’s devolution plan raise economic growth?
BBC Verify, Ben Chu (29/6/26)
- Burnham’s ‘Manchesterism’ could change the UK, but is not yet a full economic plan
BBC News, Faisal Islam (29/6/26)
- Burnham’s ‘Manchesterism’ got him to No 10 – but will it work for the UK?
BBC News, Faisal Islam (17/7/26)
- Burnham says there is some room for movement on tax
BBC News, Kate Wannel and Joshua Nevett (3/7/26)
- England’s mayors should be given sweeping new powers, says devolution expert
The Guardian, Kiran Stacey (2/7/26)
- What is Andy Burnham’s economic and political blueprint for Britain?
The Guardian, Richard Partington and Jessica Elgot (29/6/26)
- Why Andy Burnham’s radical plan relies on the Treasury being a friend of devolution
The Conversation, Dave Richards and Sam Warner (26/6/26)
- How Andy Burnham may try to give the UK economy a boost in his ‘10‑year plan’
The Conversation, Steve Schifferes (29/6/26)
- Could Andy Burnham let mayors raise more taxes?
House of Commons Research Briefing, Mark Sandford (2/7/26)
- Andy Burnham sets out policy plans in first major speech in PM leadership bid: Legal comments
Browne Jacobson, Dan Robinson (29/6/26)
- What does Andy Burnham think ‘Good Growth’ is?
Centre for Cities, Jess Tulasiewicz (30/6/26)
- Manchester’s digital transformation could be a blueprint for other parts of the UK
The Conversation, Richard Whittle (21/7/26)
Videos
Data
Questions
- Use an aggregate demand and supply diagram (simple or dynamic) to illustrate the effects on real GDP of a successful devolution strategy.
- Find out the details of the last Conservative government’s ‘levelling up’ policy. Was it similar in aims to that of ‘Manchesterism’?
- How could a policy of devolution as outlined by Andy Burnham affect income distribution within regions?
- Find out about the approach to regional policy in the EU. Is it similar to that being advocated by Andy Burnham?
- What is meant by ‘regional multipliers’? Why might they differ from the national multiplier?
 It is 10 years since the Brexit referendum. From an electorate of 46,501,251 people, 17,410,742 (37.4%) voted to leave, 16,141,241 (34.7%) voted to remain and 12,949,258 (27.8%) did not vote. The UK left the EU on 31 January 2020 at 11:00 pm, but remained in the single market and customs union during a transition period lasting for a further 11 months until December 31 2020.
To mark the 10th anniversary of the vote a number of articles have been written assessing the effects of Brexit. Here we look at the economic effects, as do the articles linked below. This blog updates the analysis of an earlier one, The costs of Brexit: a clearer picture.
Trade
After the referendum, extensive negotiations took place on the trading arrangements between the UK and EU that would exist once Brexit was finalised.
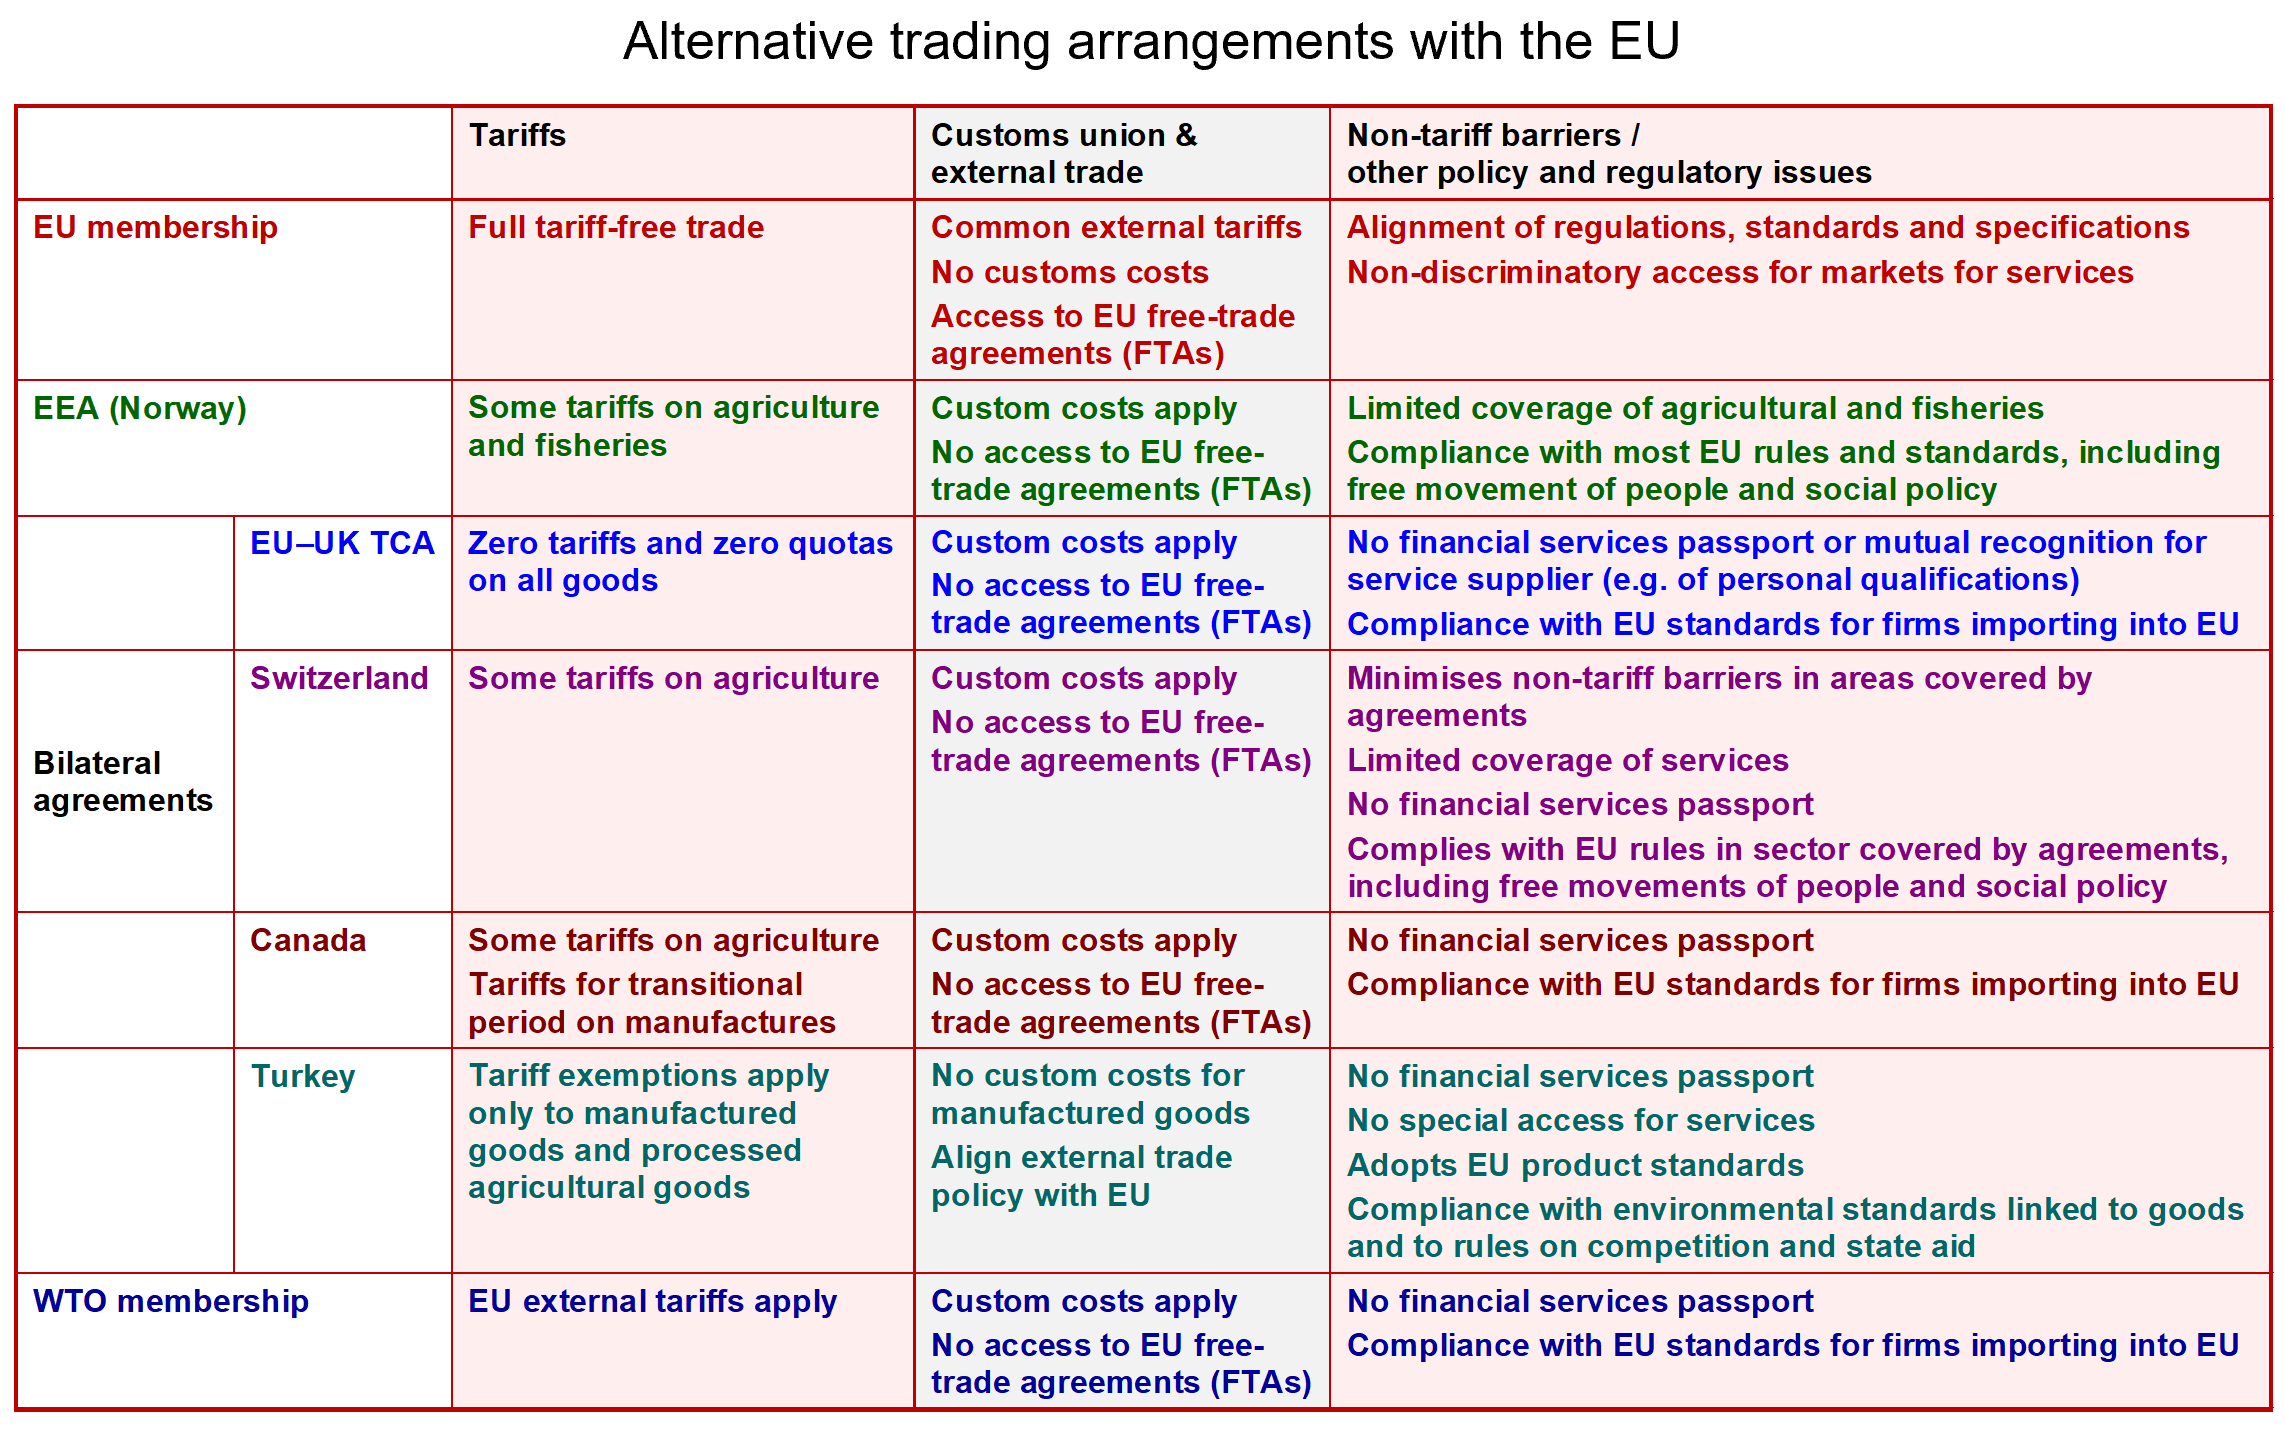
One possibility was ‘The Norwegian model’, which would have seen the UK join the European Economic Area (EEA), giving it access to the single market, but removing regulation in some key areas, such as fisheries and home affairs. This was ruled out in favour of a bilateral trade agreement. Three main types were available:
- Swiss model, where the UK would negotiate a series of bilateral agreements with the EU, including selective or general access to the single market.
- Canadian model, where the UK would form a comprehensive trade agreement with the EU to lower customs tariffs and other barriers to trade.
- Turkish model, where the UK would form a customs union with the EU. In Turkey’s case the agreement relates principally to manufactured goods.
The agreement reached, the Trade and Cooperation Agreement (TCA) was a version of the Canadian model. The UK would leave the single market and customs union, but there would be tariff-free and quota-free trade in goods between the UK and the EU. However, to ensure that it was EU and UK business that would benefit from these ‘trade preferences’, businesses must show that their products fulfil ‘rules of origin’ requirements.
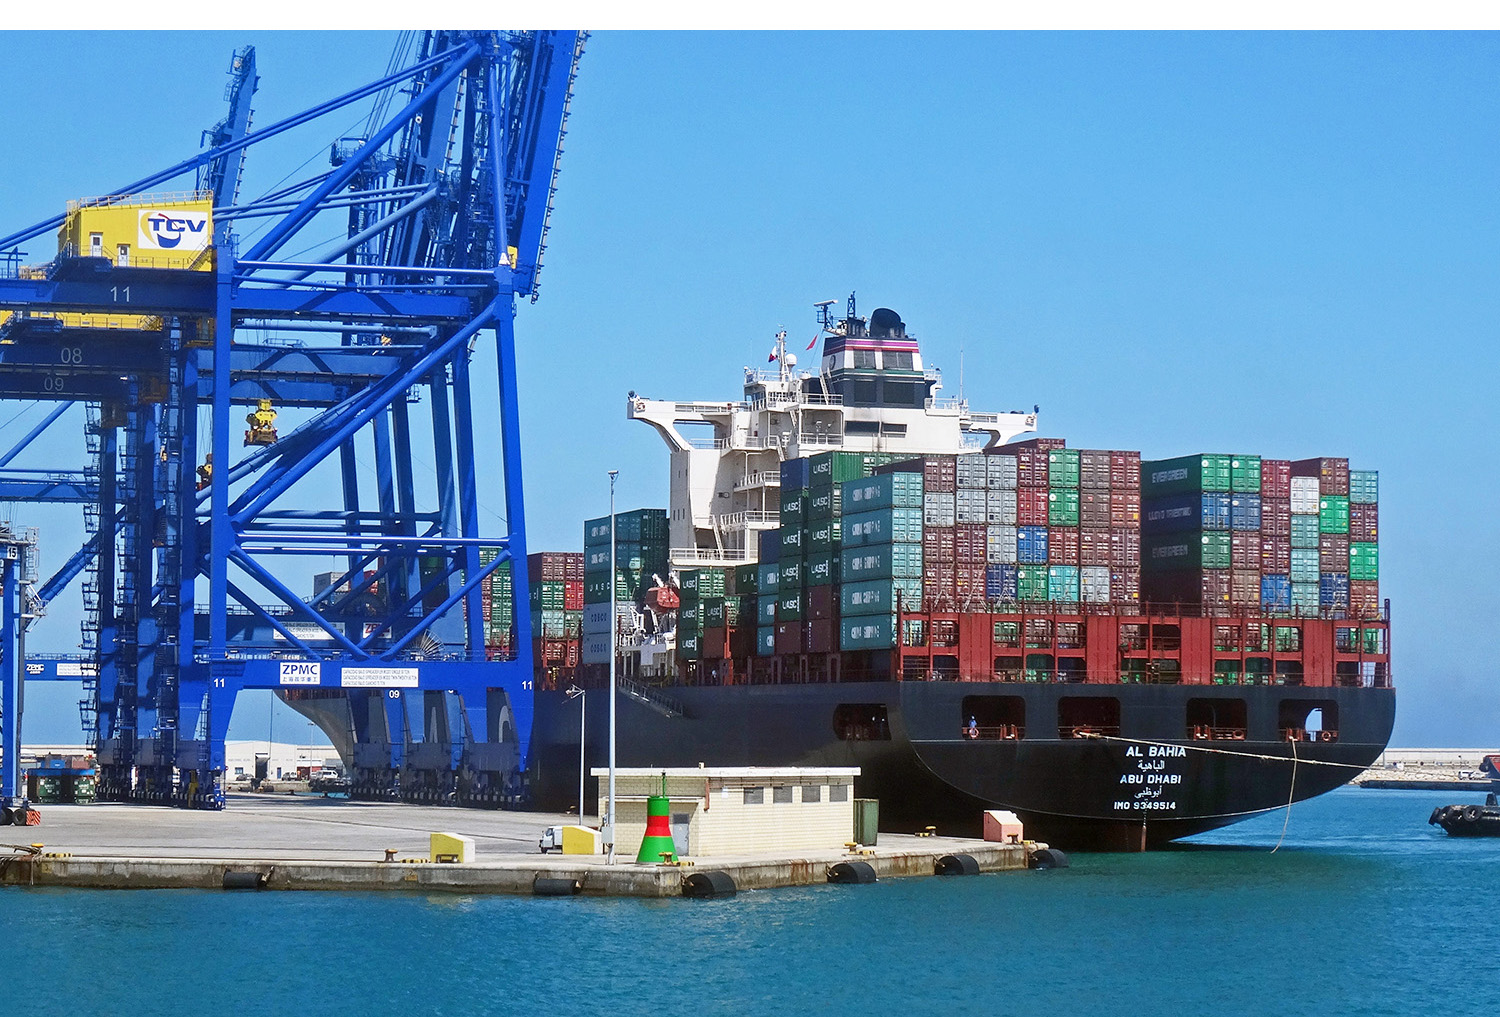 Rules of origin. Under rules of origin requirements, when a good is imported into the UK from outside the EU and then has value added to it by processing, packaging, cleaning, remixing, preserving, refashioning, etc., it can only count as a UK good if sufficient value or weight is added. The proportions vary by product, but generally goods must have approximately 50% UK content (or 80% of the weight of foodstuffs) to qualify for tariff-free access to the EU. For example, in the case of a petrol car, 55% of its value must have been created in either the EU or UK.
Meeting rules of origin has created a large amount of paperwork for businesses and this has created a significant barrier to trade. What is more, exporters are required to complete import/export declarations. Also, agri-food goods are subject to strict physical border controls. These barriers have increased the costs of trade and reduced its volume.
Services. Free trade in services is not provided by the TCA. Instead, services exporters face various barriers, such as certain professional qualifications no longer being recognised in EU countries and a loss of ‘passporting’ rights that previously allowed cross-border financial operations with minimal extra permissions.
Brexit impact. Despite new barriers to trade in services, they are generally less significant than the barriers for trade in goods, particularly in a digital age. Indeed, UK services exports have held up well. Although they fell in 2020, they have grown significantly since. According to House of Commons Library Statistics on UK-EU trade (see link below):
In 2025, UK exports of services to the EU were 28% above their 2019 level in real terms. Exports to non-EU countries were 26% above their 2019 level.
UK exports of goods to the EU, however, have fared less well. In 2025 they were 14% below their 2019 level in real terms. This is partly the effect of COVID and the Ukraine war, but exports to non-EU countries were only 8% lower than 2019. According to research by economists John Springford and Anton Spisak for the Centre for European Reform (see link below), Brexit has depressed UK goods exports to the EU by 16%. According to the Office for Budget Responsibility, (see link below) both exports and imports in the long run will be around 15% lower than they would have been if the UK had remained in the EU. What is more, the growth of goods trade (exports plus imports) has fallen well behind the average of the rest of the G7. And according to British Chambers of Commerce research (see link below), 54% of UK exporters think the TCA is making it harder to export and the need for change is urgent.
The new barriers reduce market access, while lower export volumes reduce competition and economies of scale. There is less competition too from imports, with many EU firms no longer exporting to the UK because of the costs. The barriers lead to a misallocation of resources, with highly productive UK firms exporting less, with less productive firms in the UK and EU focusing purely on their domestic markets. The barriers thus impose an impediment to the exploitation of comparative advantage
Investment
 Both domestic and foreign direct investment (FDI) in the UK have been adversely affected by Brexit. Bloom et al., in their paper for the NBER (see link below), estimate that by 2025, investment was 12–18% lower than it would have been without Brexit.
In the early years after the referendum, lower capital investment was mainly the result of uncertainty and devoting significant resources to administrative Brexit preparations. Later it was largely the result of the trade barriers themselves. Not surprisingly, firms in the UK with high exposure to EU markets experienced a sharper decline in investment than less-exposed ones.
The end of the single market and customs union reduced the attractiveness of the UK as a hub for FDI relative to competitor countries. And UK firms were encouraged to invest in the EU to create hubs for selling within the EU, thereby allowing them to avoid the trade barriers.
According to the Bloom et al. analysis, the effect of lower investment and less competition has been a fall in UK productivity of around 3% to 4% compared to remaining in the EU. The Office For Budget Responsibility argues that the post-Brexit trading relationship will reduce long-run productivity by 4% relative to remaining in the EU.
Growth in GDP
Lower investment, lower productivity and trade barriers have had a negative impact on economic growth. According to analysis by the National Institute of Economic and Social Research (NIESR) (see link below), by the end of 2023, UK real GDP was some 2–3% lower solely as a result of Brexit – in other words, after having taken into account the effects of COVID-19 and the Russia-Ukraine war. This corresponds to a per capita income loss of approximately £850. The NIESR analysis predicts that this will rise to some 5–6% of GDP, or about £2,300 per capita, by 2035.
Bank of England data, based on surveys of chief financial officers of over 2000 firms (small, medium and large), suggest that the UK economy is some 6% smaller than it would have been without Brexit. The Office for Budget Responsibility estimates that Brexit has caused a long-run reduction in GDP of 4% as a result of a similar percentage reduction in productivity.
The growth of small and medium-sized enterprises (SMEs) has been disproportionately dampened by the compliance costs of trade with the EU. Some SMEs, especially in the food and drink sector, have ceased exporting to the EU altogether.
Labour supply and migration
Halting the right of EU workers to move freely to the UK for work created acute labour shortages in specific sectors such as hospitality, health and social care, logistics, construction and agriculture. However, while immigration from the EU fell dramatically, this was more than offset by increased immigration from non-EU countries. But this was unable to fill shortfalls in some sectors.
 The loss of free movement of labour means that UK workers now face restrictions on working in the EU. These include obtaining a work visa, which requires a formal job offer, sponsorship and meeting strict salary thresholds. While business trips for meetings, conferences, trade fairs, etc. are generally exempt, if the work involves remuneration, then normally a work visa will be required. The terms of work visas vary between member states. This has created a considerable barrier for touring bands and other artists. Short-term self-employed or freelance work is highly restricted, with virtually no work permit options available for visiting UK nationals.
Because employing UK nationals now imposes extra administrative and time-consuming burdens on local EU employers, many now prioritize applicants from EU nations who can start immediately.
Articles
- Ten years on, Brexit’s economic impact is becoming clearer
BBC News, Faisal Islam (24/6/26)
- How Brexit is estimated to have hit the UK economy
Reuters, David Milliken (17/6/26)
- Ten years on, Britain counts the cost of Brexit
CNN, Hanna Ziady (22/6/26)
- Brexit at 10: The economy
Institute for Government: Comment, Giles Wilkes (16/6/26)
- Brexit has been an economic failure
LSE Blogs, Thomas Sampsos (16/6/26)
- Ten years after the referendum, how Brexit could have been done differently
The Conversation, Renaud Foucart (22/6/26)
- How Brexit has made Britain poorer – in charts
The Guardian, Richard Partington (14/6/26)
- The cost of Brexit, ten years on: The impact of leaving the customs union and single market on UK trade
Centre for European Reform, John Springford and Anton Spisak (18/6/26)
- Rejoining customs union would not fix damage caused by Brexit, research finds
The Guardian, Heather Stewart (18/6/26)
- The Economic Impact of Brexit
National Bureau of Economic Research , Nicholas Bloom, Philip Bunn, Paul Mizen, Pawel Smietanka, Gregory Thwaites and Sasha Abrahams (revised June 2026)
- Brexit’s impact on the UK economy
UK in a Changing Europe: blog, Gregory Thwaites, Nicholas Bloom, Paul Mizen, Pawel Smietanka and Philip Bunn (4/12/25)
- What the NBER gets wrong on the ‘Economic Impact of Brexit’
Julian Jessop (24/11/25)
- Brexit burden must be cut
British Chambers of Commerce (22/6/26)
- Brexit impact will be negative ‘for the foreseeable future,’ Bank of England governor warns
Business Matters, Jamie Young (19/10/25)
- Brexit knocked 6% off the UK economy, Bank of England company data suggests
Business Matters, Jamie Young (22/6/26)
- Brexit ten years on: the economy
UK in a Changing Europe: blog, Jonathan Portes (2/6/26)
- Brexit 10 years later: How the UK economy and politics changed, in charts
CNBC, Joseph Wilkins and Chloe Taylor (23/6/26)
- Ten Years of Brexit: An Assessment of the Macroeconomic, Regional, and Sectoral Impacts
NIESR blog (19/6/26)
- Brexit was supposed to limit immigration – it did the opposite
LSE blogs, Alan Manning (22/6/26)
Videos
Reports, Research, Analysis and Data
- Brexit analysis
OBR
- Brexit: research and analysis
UK Parliament
- Brexit analyses
Centre for Economic Performance (LSE)
- Trading relationship with the EU
House of Commons Library, Ilze Jozepa, Dominic Webb and Matthew Ward (25/4/25)
- Statistics on UK-EU trade
House of Commons Library, Matthew Ward and Dominic Webb (12/6/26)
- How are our Brexit trade forecast assumptions performing?
Office for Budget Responsibility, Economic and fiscal outlook – March 2024, Box 2.4
- Revisiting the Effect of Brexit
National Institute of Economic and Social Research, Ahmet Ihsan Kaya, Iana Liadze, Hailey Low, Patricia Sánchez Juanino and Stephen Millard (16/11/23)
- Net migration to the UK
The Migration Observatory, Madeleine Sumption, Ben Brindle and Peter William Walsh (27/5/26)
Questions
- Summarise the negative effects of Brexit on the UK economy.
- Why is it difficult to quantify these effects?
- How have UK firms attempted to reduce the costs of exporting to the EU?
- Why have goods exports been worse affected by Brexit than services exports?
- What difficulties would lie in the way of the UK negotiating a Turkish or Swiss model of trading relations with the EU?
- Have there been any economic benefits from Brexit and, if so, what?
 At the fourth anniversary of Russia’s invasion of Ukraine, we look at the effect of the war on the Russian economy. Two years ago, in the blog The Russian economy after two years of war, we argued that the Russian economy had seemingly weathered the war successfully.
Unlike Ukraine, very little of its infrastructure had been destroyed; it had started the war with a current account balance of payments surplus, a budget surplus and a low general government debt-to-GDP ratio; it had achieved a lot of success in diverting its exports, including oil, away from countries imposing sanctions to countries such as China and India; it was the same with imports, with China especially becoming a major suppliers of machinery, components and vehicles; it has a strong central bank, which engenders a high level of confidence in managing inflation; the military expenditure provided a Keynesian boost to the economy, with production and employment rising.
The situation today
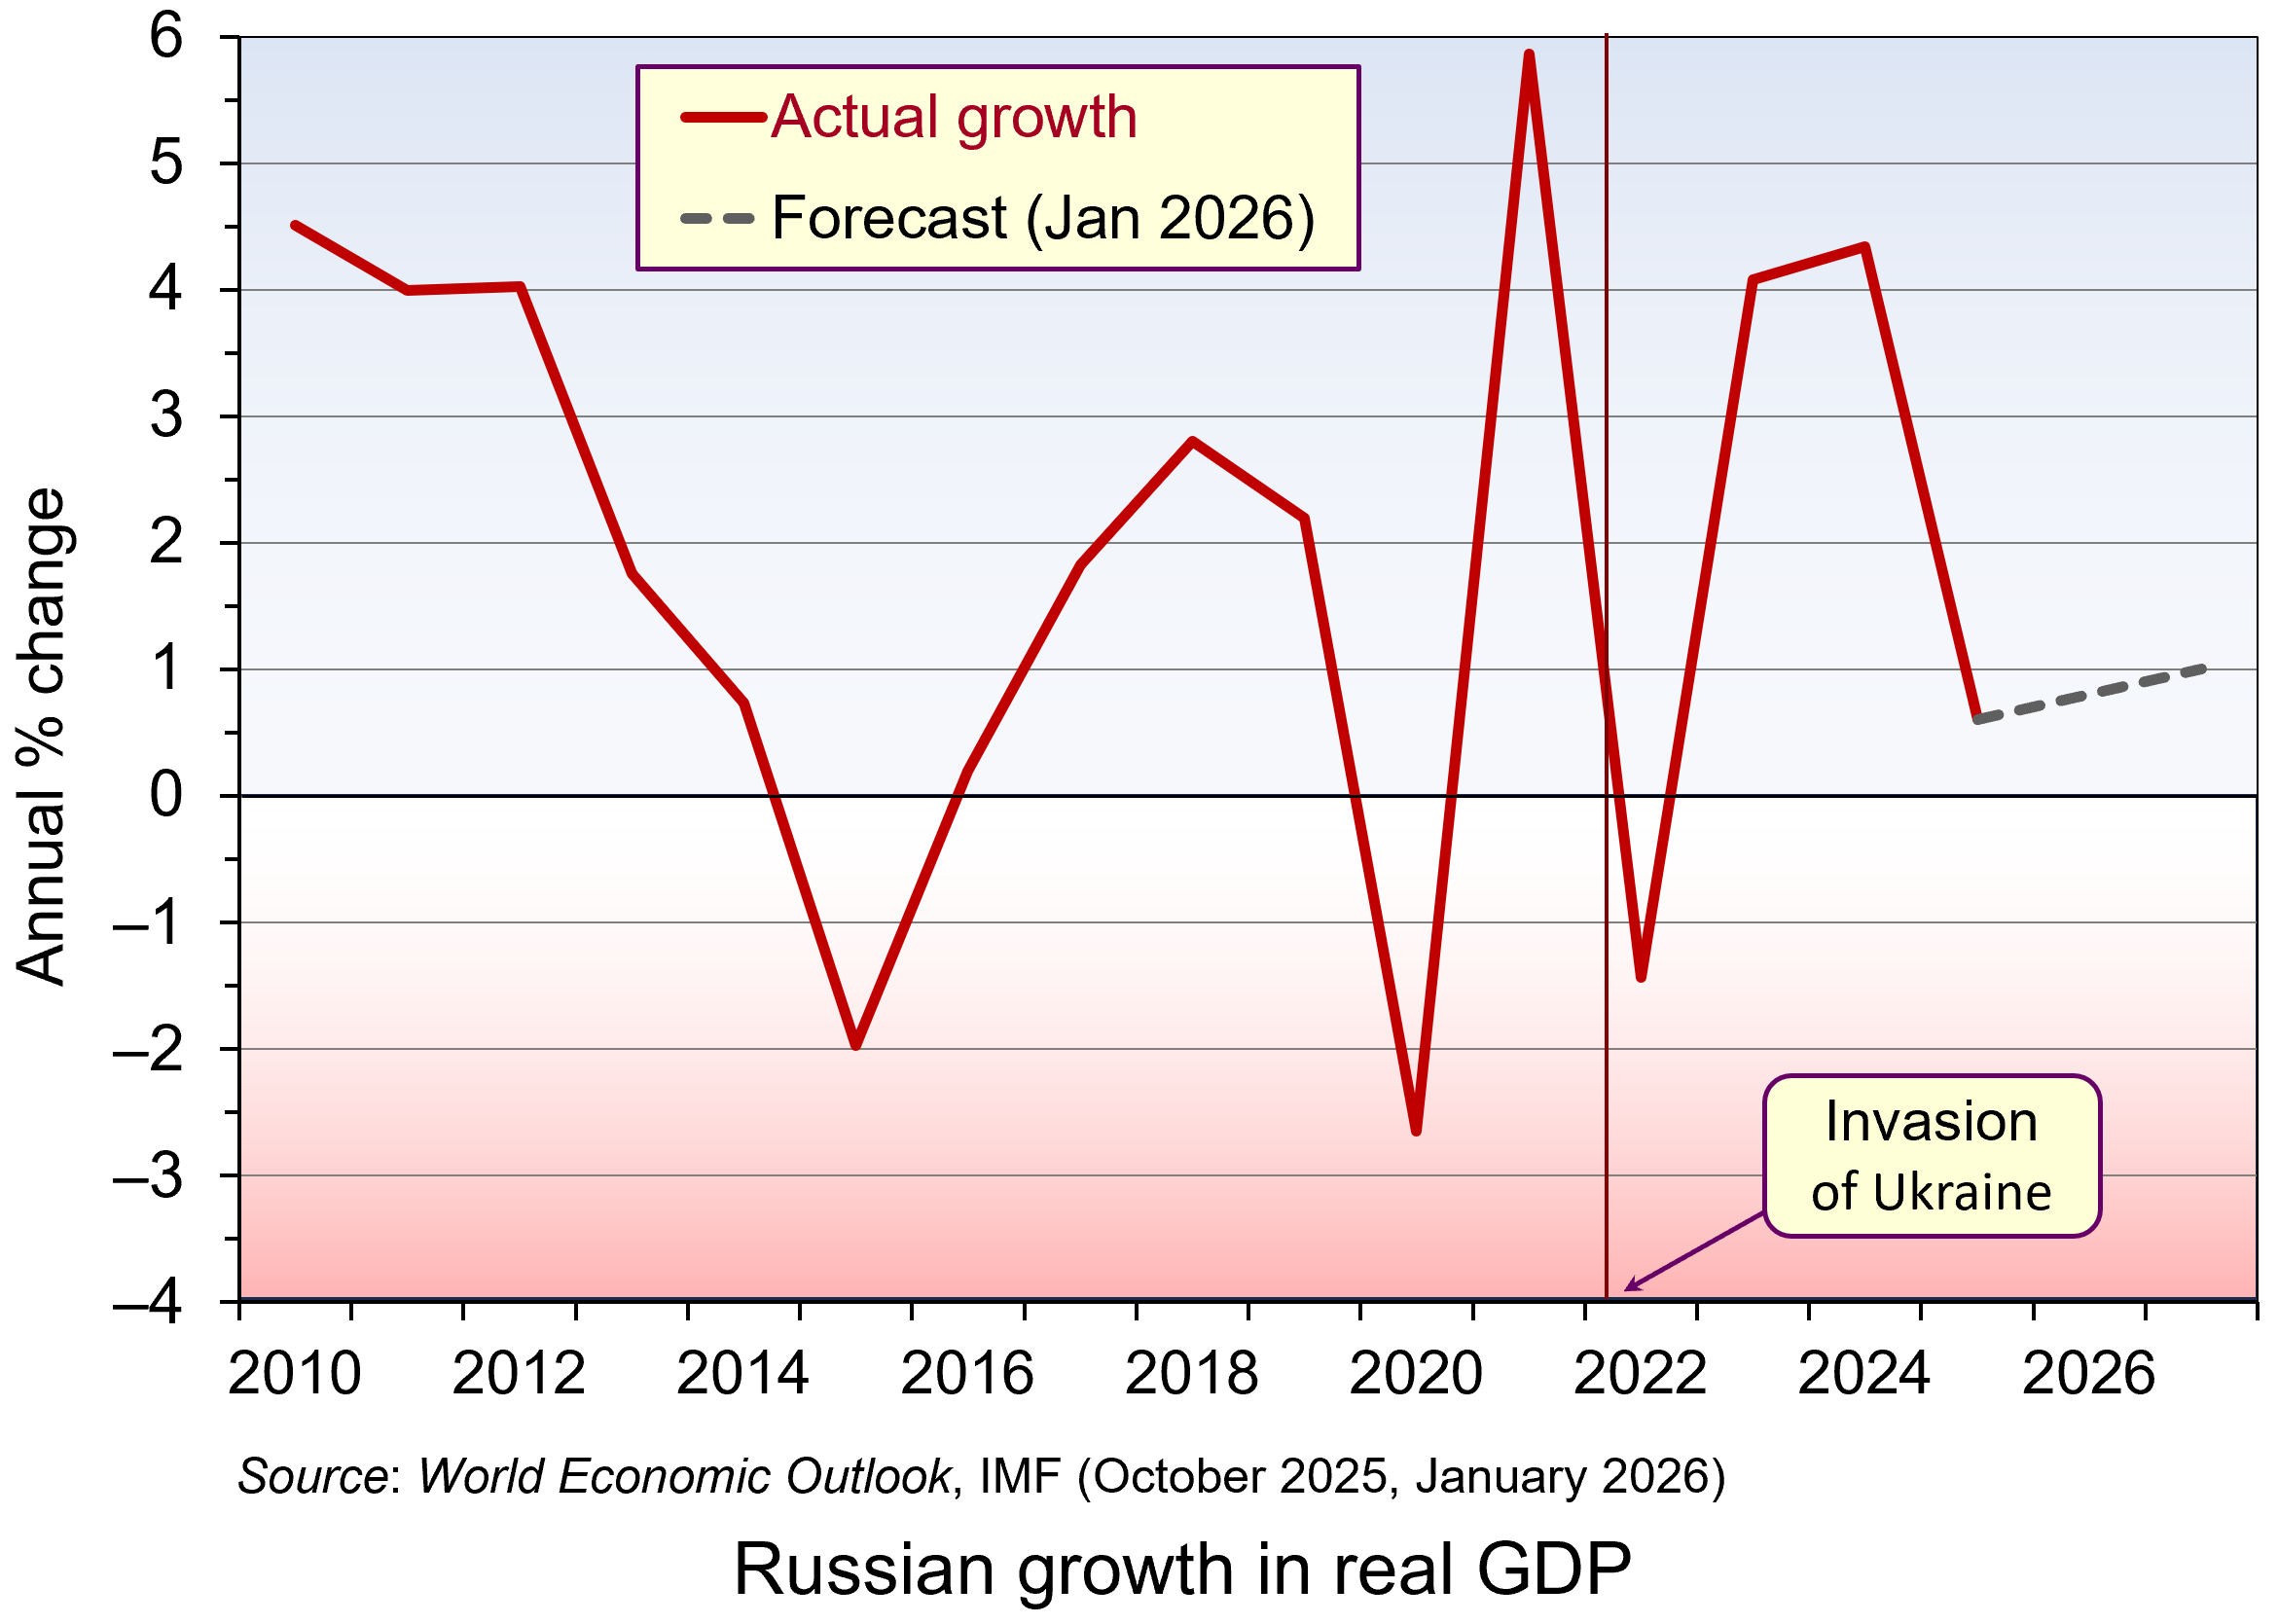 But two years further on, the Russian economy is looking a lot weaker and on the verge of recession. GDP growth fell to 0.6 per cent in 2025 and is forecast to be no more than 1 per cent for the next two years. (Click here for a PowerPoint of the chart.) And despite growth still being positive (just), this is largely because of the growth in military expenditure. Retail and wholesale trade fell by 1.1% in 2025, reflecting supply chain problems and high inflation dampening consumer demand.
With labour being diverted into the armaments and allied industries or into the armed forces, this has led to labour shortages. This has been compounded by the emigration of up to 1 million people by 2025 – often young, educated and skilled professionals.
 Official CPI inflation averaged 8.7 per cent in 2025, although the prices of food and other consumer essentials rose by more, especially in recent months. At the beginning of 2026, supermarket prices rose by 2.3% in just one month, made worse by a rise in VAT from 20% to 22%. The central bank has responded to the high inflation with high interest rates, which averaged 19.2% in 2025, giving a real rate of 10.5%. With such a high real rate, the response of households has been to save. This has masked the constraints on production, or imports, of consumer goods. Savings have also been boosted by large payments to soldiers and bereaved families, with the money saved by the recipients being used in part to fund future such payments. So far there has been trust in the banking system, but if that trust waned and people starting making large withdrawals of savings, it could be seriously destabilising.
Whilst the high real interest rates have helped to mask shortages of consumer goods, they have had a seriously dampening effect on investment by domestic companies. Gross capital formation fell by 3% in 2025, not helped by an increase in the corporation tax from 20% to 25%. At the same time, foreign direct investment remains subdued due to high perceived risks. The lack of investment, plus the labour shortages, will have profound effects on the supply side of the economy, with potential output in the non-military sector likely to decline over the medium term.
 The balance of payments and government finances are turning less favourable. The balance of trade surplus has declined from US$173bn in 2021 to US$67bn in 2025. This could decline further, or even become a deficit, if oil prices continue to be weak, if Western sanctions are tightened (such as stopping the flow of Russian oil exports in the ‘shadow’ fleet of tankers) or if major importing countries stop buying Russian oil. Indian refiners have announced that they are not taking Russian crude in March/April as India seeks to finalise a trade deal with the USA.
The budget balance has moved from a small surplus of 0.8% of GDP in 2021 to a deficit of 2.9% in 2025. Although the government debt-to-GDP ratio remains low by international standards at 23.1% of GDP in 2025, this was up from 16.5% in 2021 and is set to rise further as budget deficits deepen. Nevertheless, as long as the saving rate remains high, the debt can be serviced by domestic bond purchase.
Russia’s economy is definitely weakening and labour shortages and low investment will create major problems for the future. But whether this deterioration will be enough to change Russia’s stance on the war in Ukraine remains to be seen.
Articles
- The Russian economy is finally stagnating. What does it mean for the war – and for Putin?
The Guardian, Alex Clark (6/2/26)
- Exclusive: Russia’s budget deficit may almost triple this year as oil revenues decline
Reuters (4/2/26)
- Russia’s war economy is not collapsing, but neither is it stable
The Conversation, Yerzhan Tokbolat (17/12/25)
- Food prices are surging in Russia. Is the war hitting Russians in the pocket?
BBC News, Olga Shamina, Yaroslava Kiryukhina and Sergei Kagermazov (18/2/26)
- [Russian] GDP data — what it reveals, what it conceals
The Bell, Denis Kasyanchuk (18/2/26)
 What to Expect From the Russian Economy in 2026
Carnegie Endowment for International Peace, Alexandra Prokopenko and Alexander Gabuev (12/2/26)
- Indian refiners avoid Russian oil in push for US trade deal
Reuters, Nidhi Verma (8/2/26)
- What Breaks First – Russia’s Economy or Its War?
Visegrad Insight, Tomasz Kasprowicz (3/2/26)
Videos
Reports
Data
Questions
- What constraints are there currently on the supply side of the Russian economy?
- Some economists have argued that the economic effects of a stalemate in the Ukraine war would suit the Russian leadership more than peace or victory. Why might this be so?
- Under what circumstances might a deep recession in Russia be more likely than stagnation?
- In what ways does Russia’s current financial system resemble a pyramid scheme?
- What cannot a Keynesian boost contunue to support the Russian economy indefinitely?
 The approach towards mergers remains the most controversial area of competition policy. Some argue that policy makers in both the UK and EU have been too easily persuaded by the arguments put forward by firms and so have allowed too many mergers to proceed. Others claim that the opposite is true and that merger policy has prohibited mergers that should have been allowed to proceed. This, then, has a negative impact on investment, innovation, productivity and growth.
In recent years there has been more specific criticism of merger policy in the UK. The government has indicated that it wants the Competition and Markets Authority (CMA) to be less interventionist and take a more pro-growth approach.
 In February 2025, in response to this criticism, the CMA launched its new ‘4 Ps’ approach to merger policy: Pace, Predictability, Proportionality and Process. Various changes to the investigation process have been proposed in the past 12 months using this framework.
Pace. The time taken by the CMA to initially assess a merger before deciding whether a Phase 1 investigation is necessary (i.e. the pre-notification procedure) was reduced from 65 to 40 working days. Also, the target to complete straightforward Phase 1 investigations was reduced from 35 to 25 days.
Predictability. The proposed merger guidelines, published in October 2025, provide more detail on (a) what criteria will be used to measure market shares when applying the ‘share of supply test’ (this is where the combined UK market share of two merging businesses is at least 25%, provided one business has a UK turnover of at least £10 million), and (b) the factors that are likely to lead to the competition authorities concluding that one business has gained ‘material influence over another’. Businesses had complained that there was too much uncertainty about the way the share of supply test and material influence were applied. The CMA is also considering greater alignment with other international regulators over decision making rather than its previous policy of acting independently. All these measures should increase the predictability of the investigation process.
 Proportionality. Proportionality refers to the objective of addressing any competition issues in merger cases in a way that places the minimum burden on the businesses involved. To improve proportionality, the CMA has indicated that in future cases it will be more willing to use behavioural remedies – requiring firms to take or desist from certain actions. New draft guidelines identify more situations where the use of behavioural remedies may be appropriate. However, they also show that the CMA still views structural remedies (e.g. preventing the merger or requiring firms to demerge or to sell certain assets) as more effective in many situations. Another important measure to improve proportionality is the introduction of a new ‘wait and see’ approach to global mergers. The CMA will now wait to see if the actions taken by other competition authorities in global cases address any concerns in the UK market before deciding whether to launch a review.
Process. To improve the process, the CMA has announced plans to engage with businesses at a much earlier point in the process. For example, it has pledged to share its provisional thinking in the early stages of an investigation by implementing new ‘teach-in’ sessions and having more regular update meetings. Much earlier meetings that focus on possible remedies will also take place. This may make it possible for the CMA to assess the suitability of more complex remedies during a Phase 1 investigation rather than having to wait for a longer and more costly Phase 2 review. Phase 2 reviews will also no longer be managed by panels of independent experts. This role will now be carried out by the internal CMA board.
Some critics argue that the CMA has not fully considered the potential benefits of mergers in many cases. For example, a merger could (a) have procompetitive effects, known as rivalry enhancing efficiencies (REEs) and/or (b) benefits for consumers outside of the relevant market, known as relevant customer benefits (RCBs). In response to this criticism, the CMA is currently reassessing its approach to including evidence on REEs and RCBs.
The CMA is still currently consulting with interested parties about many of these proposed changes. It will be interesting to see what final decisions are made in the next couple of years.
Articles
- CMA consults on proposed changes to its merger remedies approach
CMA Press Release (15/10/25)
- New CMA proposals to drive growth, investment and business confidence
CMA Blog, Sarah Cardell (CMA Chief Executive) (13/2/25)
- Promoting competition and protecting consumers to drive growth and improve household prosperity
CMA Speech, Sarah Cardell (20/11/25)
- Steering the course: how the CMA is responding to the Government’s pro-growth agenda
Macfarlanes (21/2/25)
- 4Ps and 3 themes – An overview of the CMA’s merger remedies review
Hogan Lovells, Angus Coulter, Alice Wallace-Wright, Karman Gordon, and Denise Hotham-Kellner (1/4/25)
- CMA publishes updated guidance on UK merger procedure
Ashurst, Christopher Eberhardt, Emile Abdul-Wahab and Finlay Sadler-Wilson (11/11/25)
- Government ousts UK competition watchdog chair
BBC News, Simon Jack and Charlotte Edwards (21/1/25)
- UK competition watchdog drops Microsoft-OpenAI probe
BBC News, Imran Rahman-Jones (5/3/25)
- Does the government really know what it wants from the CMA?
The Guardian, Nils Pratley (13/2/25)
- This article is more than 9 months old ‘We must avoid a chilling effect’: the CMA chief on the UK’s pro-growth shift
The Guardian, John Collingridge (18/2/25)
- The CMA should be nudged on antitrust, not bullied
The Financial Times, John Gapper (6/2/25)
CMA documentation
Questions
- Of all the mergers considered by the CMA in 2024/25, find out what percentage were formally investigated. How many were blocked from taking place? Do you believe that this indicates that merger policy is too weak or too strong?
- What three criteria must be met for a business arrangement to be classed as a ‘relevant merger situation’ by the CMA?
- Identify some different methods that one business could use to gain material influence over the way another company operates.
- Outline the ‘turnover test’, the ‘share of supply test’ and the ‘hybrid test’.
- Discuss the potential advantages of using behavioural remedies as opposed to structural remedies in merger cases. Why has the CMA still preferred the use of structural remedies in most situations?
 The productivity gap between the UK and its main competitors is significant. In 2024, compared to the UK, output per hour worked was 10.0% higher in France, 19.8% higher in Germany and 41.1% higher in the USA. These percentages are in purchasing-power parity terms: in other words, they reflect the purchasing power of the respective currencies – the pound, the euro and the US dollar.
GDP per hour worked (in PPP terms) is normally regarded as the best measure of labour productivity. An alternative measure is GDP per worker, but this does not take into account the length of the working year. Using this measure, the gap with the USA is even higher as workers in the USA work longer hours and have fewer days holiday per year than in the UK.
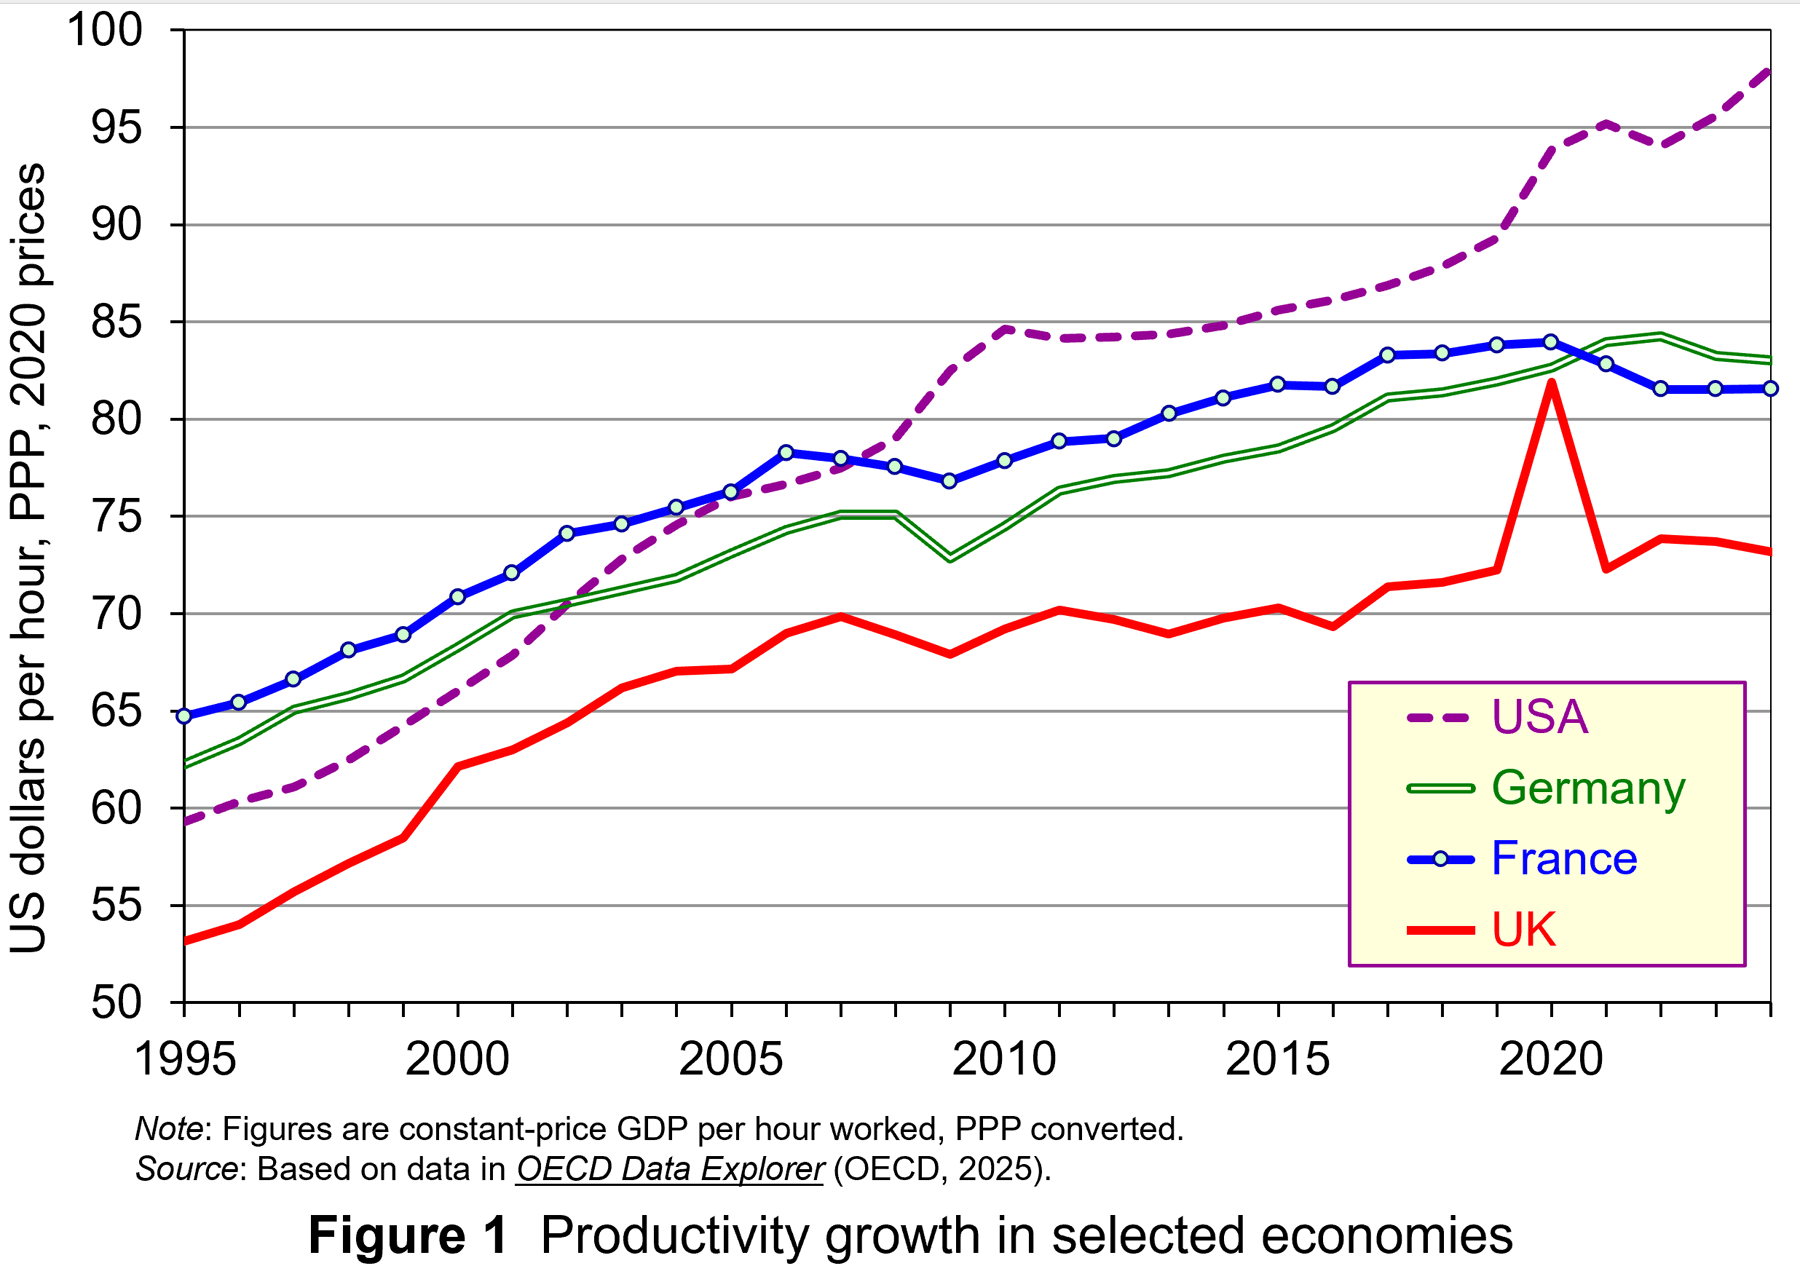 The productivity gap is not a new phenomenon. It has been substantial and growing over the past 20 years. (The exception was in 2020 during lockdowns when many of the least productive sectors, such as hospitality, were forced to close temporarily.)
The productivity gap is shown in the two figures. Both figures show labour productivity for the UK, France, Germany and the USA from 1995 to 2024.
Figure 1 shows output (GDP) per hour, measured in US dollars in PPP terms.
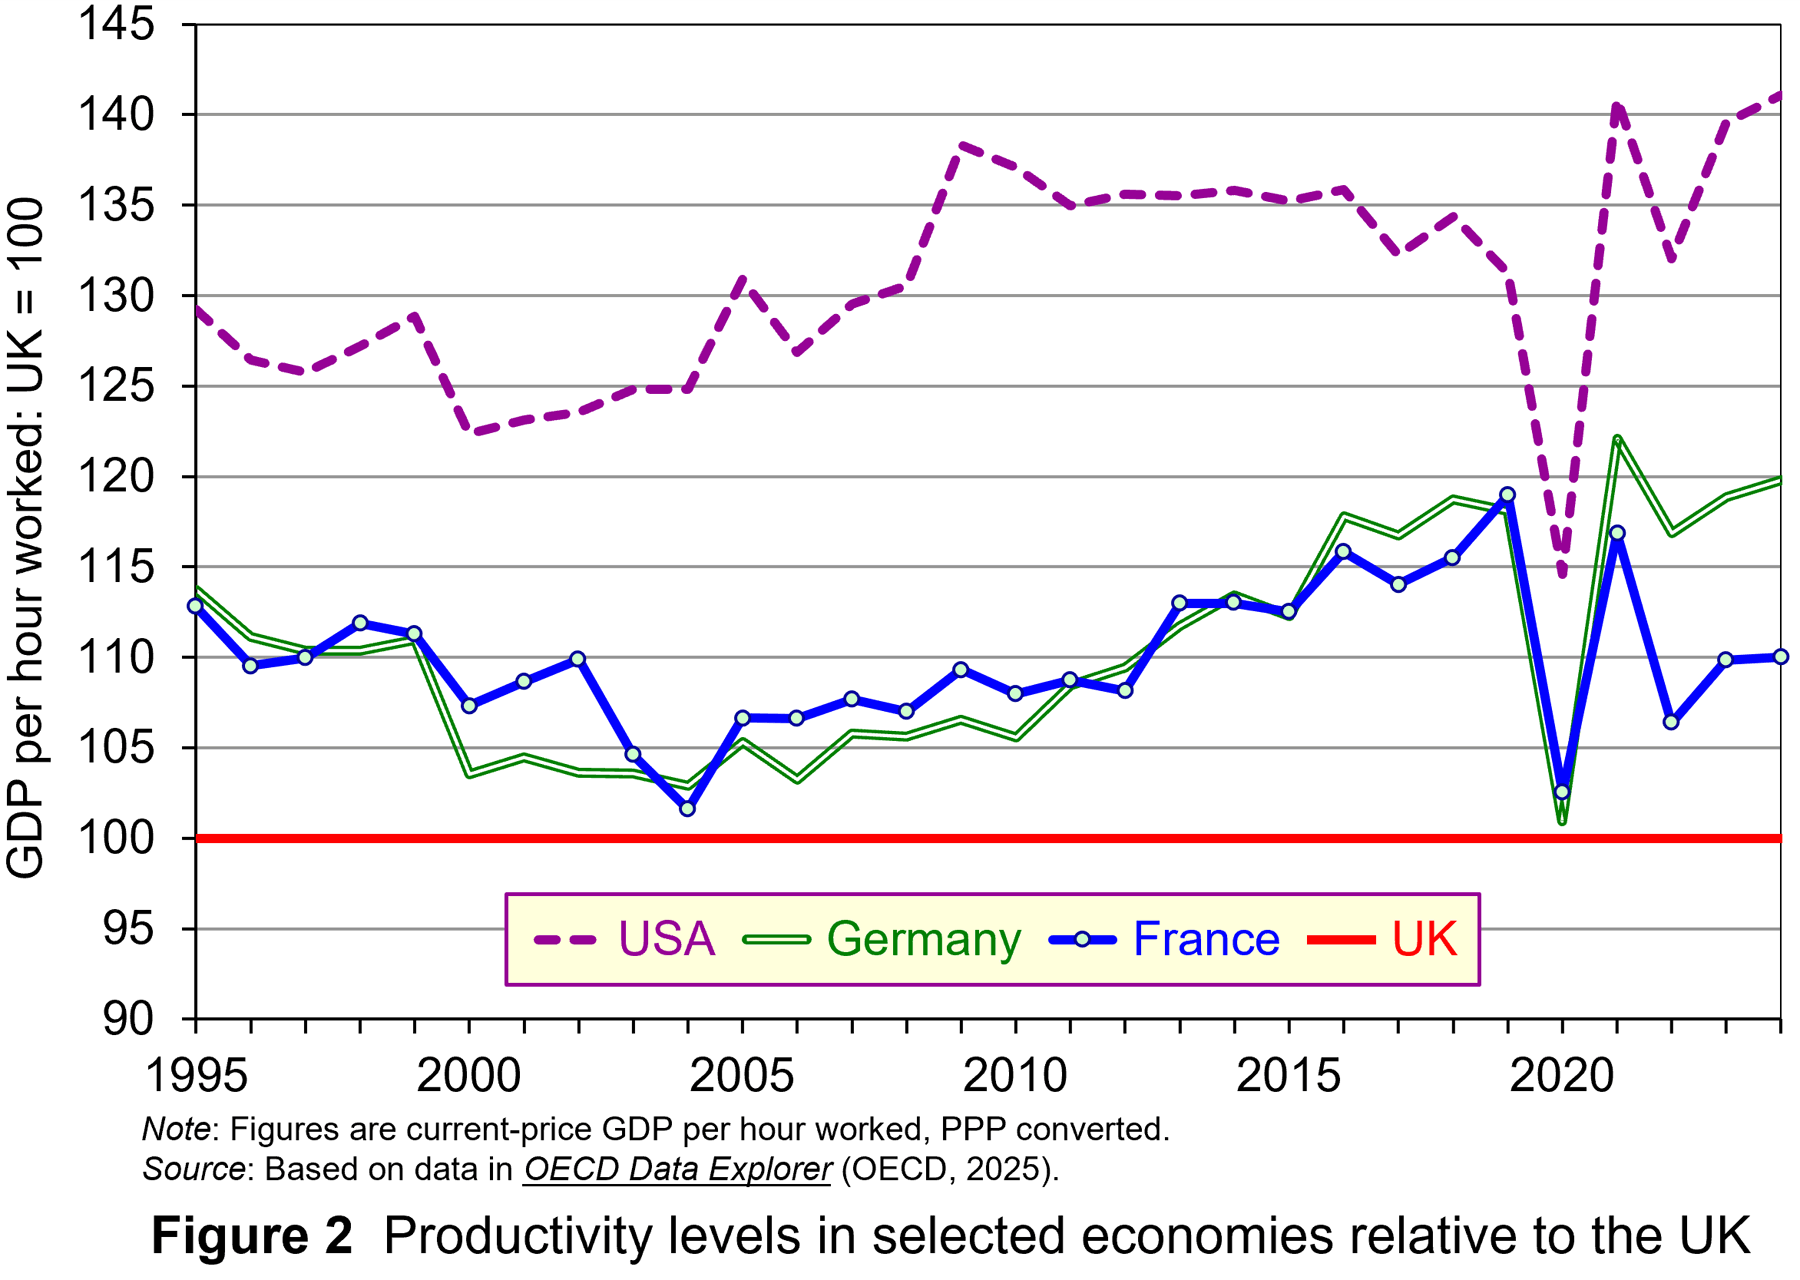 Figure 2 shows output (GDP) per hour relative to the UK, with the UK set at 100. The gap narrowed somewhat up to the early 2000s, but since then has widened.
Low UK productivity has been a source of concern for UK governments and business for many years. Not only does it constrain the growth in living standards, it also make the UK less attractive as a source of inward investment and less competitive internationally.
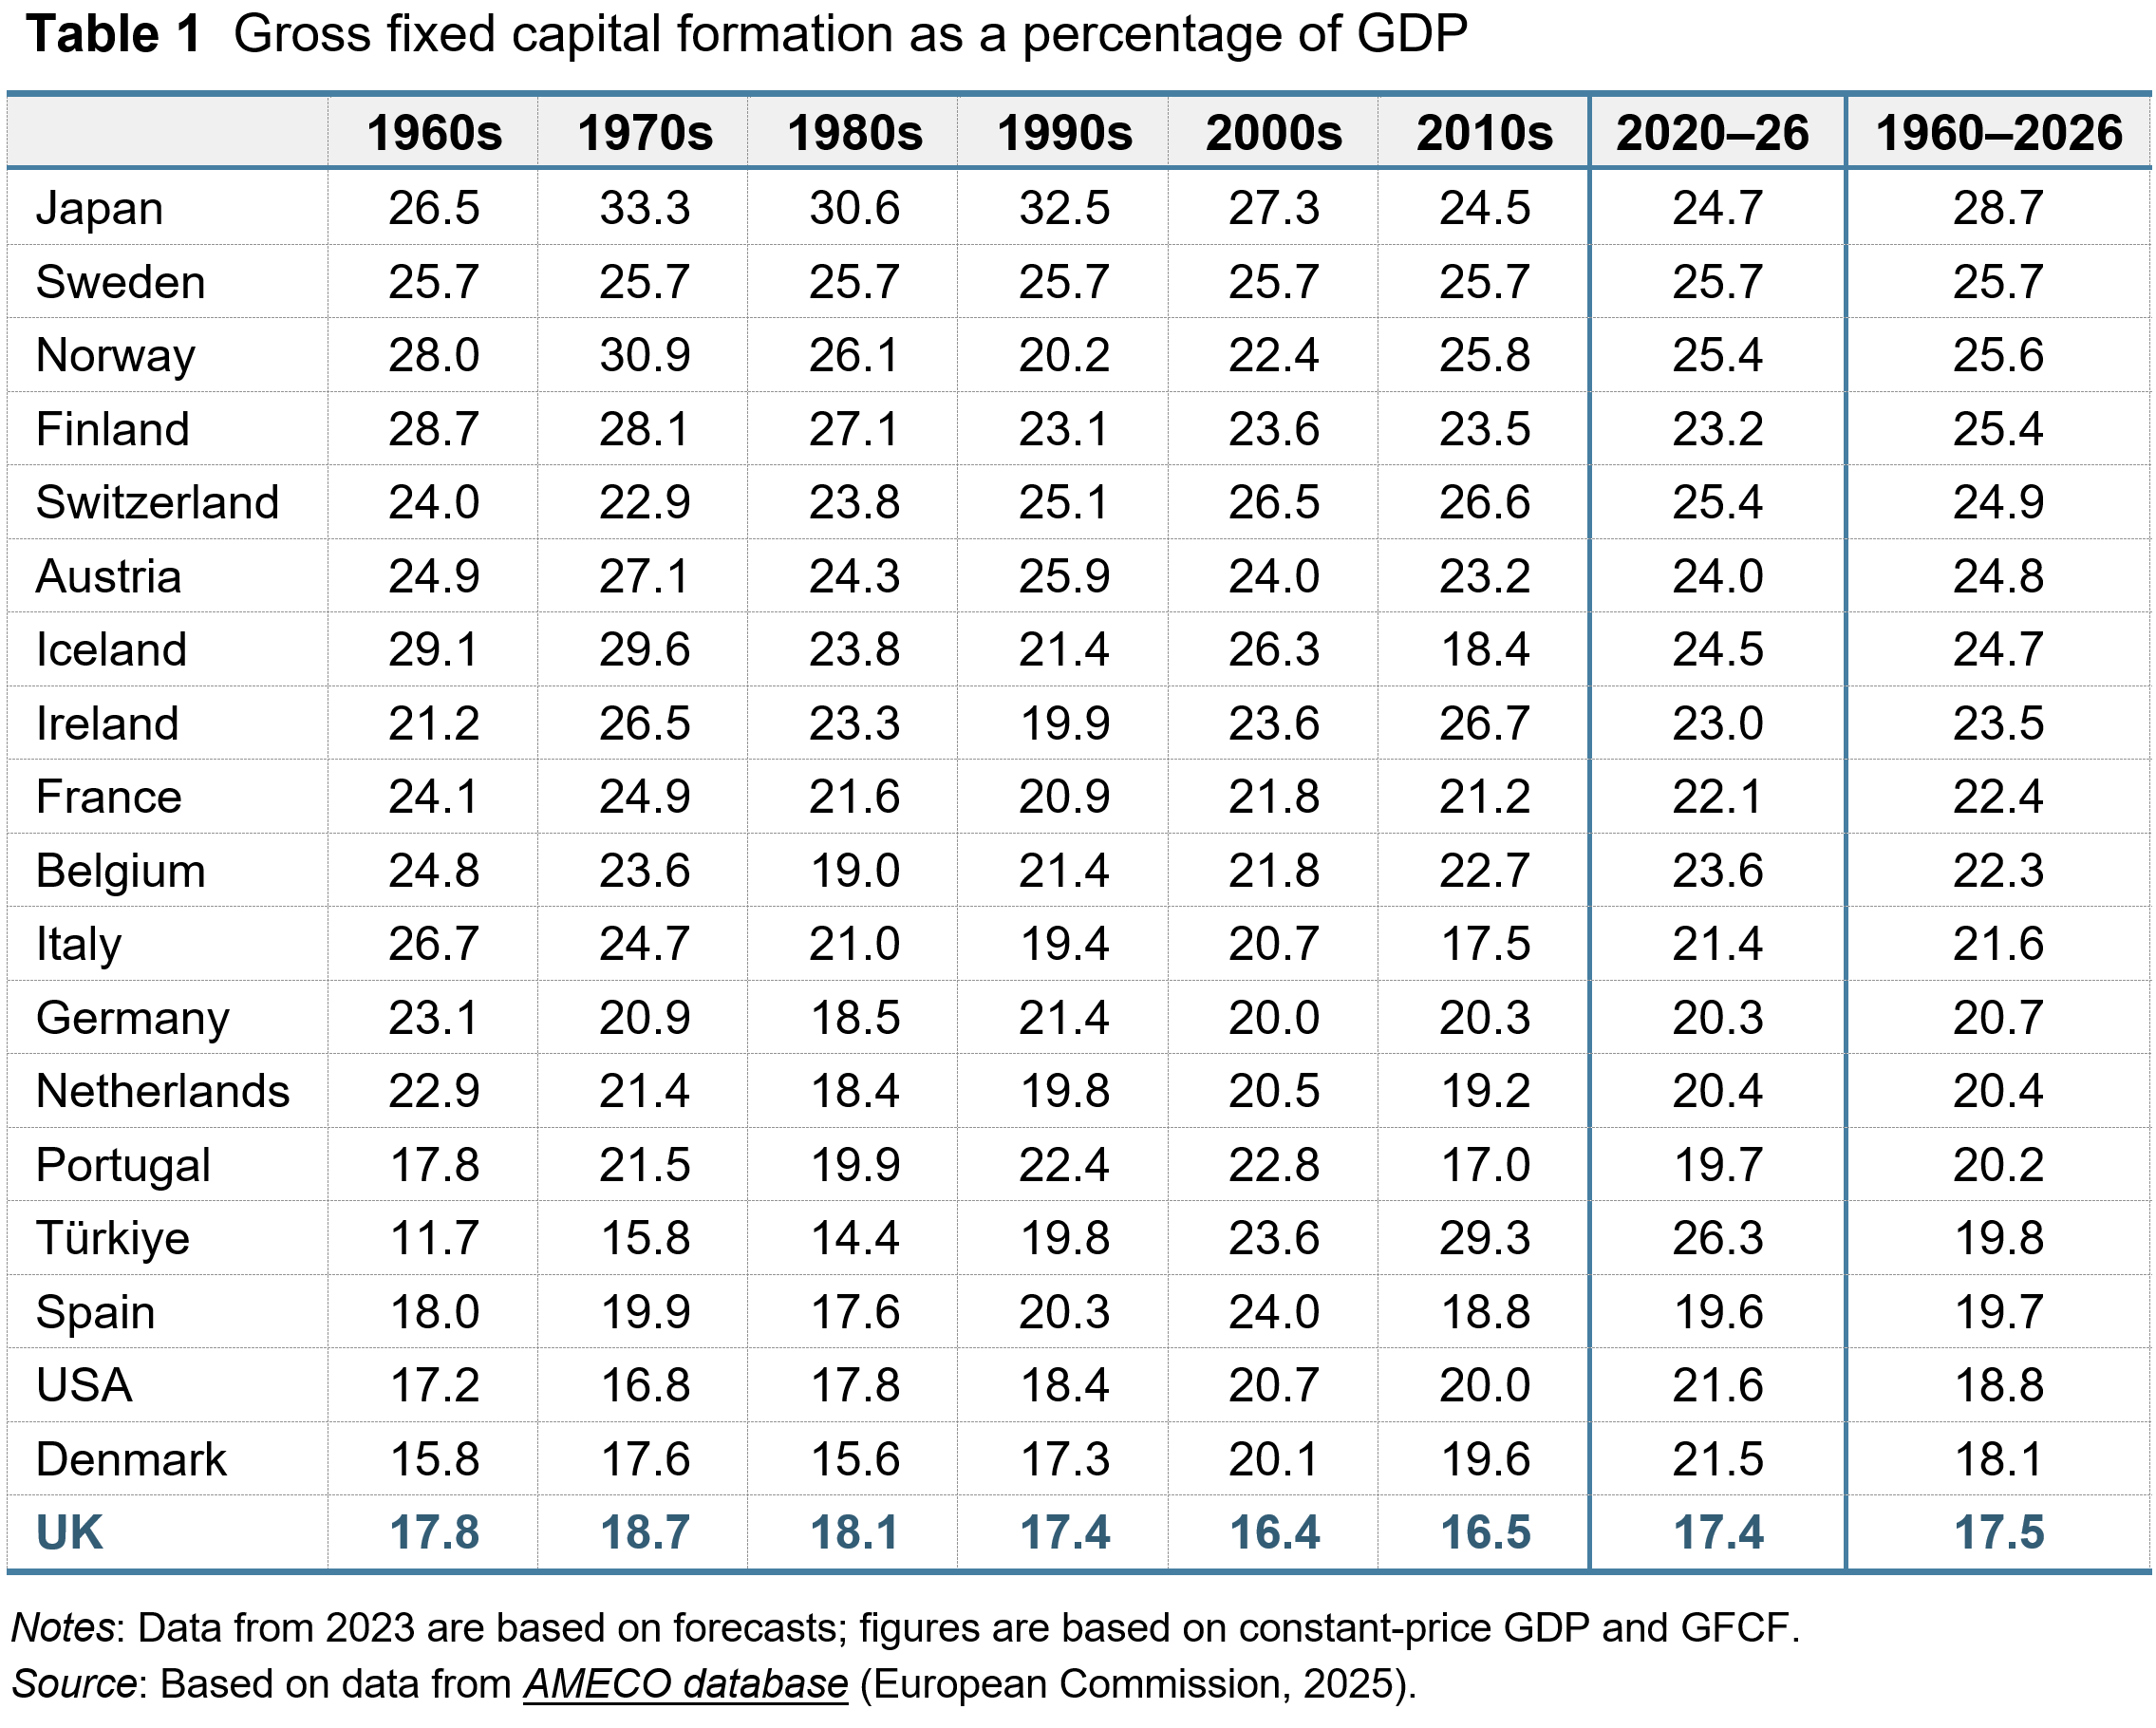
Part of the reason for low UK productivity compared to that in other countries is a low level of investment. As a proportion of GDP, the UK has persistently had the lowest, or almost the lowest, level of investment of its major competitors. This is illustrated in Table 1.
It is generally recognised by government, business and economists that if the economy is to be successful, the productivity gap must be closed. But there is no ‘quick fix’. The policies necessary to achieve increased productivity are long term. There is also a recognition that the productivity problem is a multi-faceted one and that to deal with it requires policy initiatives on a broad front: initiatives that encompass institutional changes as well as adjustments in policy.
So what can be done to improve productivity and how can this be achieved at the micro as well as the macro level?
Improving productivity: things that government can do
 Encouraging investment. Over the years, UK governments have increased investment allowances, enabling firms to offset the cost of investment against pre-tax profit, thereby reducing their tax liability. For example, in the UK, companies can offset a multiple of research and development costs against corporation tax. The rate of relief for small and medium-sized enterprises (SMEs) allows companies that work in science and technology to deduct an extra 86% of their qualifying expenditure from their trading profit in addition to the normal 100% deduction: i.e. a total of 186% deduction. Meanwhile, since April 2016, larger companies have been able to claim a R&D expenditure credit, initially worth 11 per cent of R&D expenditures, then 12 per cent from 2018 and 13 per cent from 2020. This was then raised to 20 per cent from 2023.
Strengthening competition. A number of studies have revealed that, with increasing market share, business productivity growth slows. As a result, government policy sought to strengthen competition policy. The Competition Act 1998, which came into force in March 2000, and the Enterprise Act of 2002, enhanced the powers of the Office of Fair Trading (OFT) (a predecessor to the Competition and Markets Authority) in respect to dealing with anti-competitive practices. It was given the ability to impose large fines on firms which had been found guilty of exploiting a dominant market position. Today, one of the strategic goals of the Competition and Markets Authority (CMA) is the aim of ‘extending competition frontiers’ in order to improve the way competition works.
Encouraging an enterprise culture. The creation of an enterprise culture is seen as a crucial factor not only to encourage innovation but also to stimulate technological progress. Innovation and technological progress are crucial to sustaining growth and raising living standards. The UK government launched the Small Business Service in April 2000, later renamed Business and Industry. Its role is to co-ordinate small-business policy within government and liaise with business, providing advice and information. However, according to the OECD, there remains considerable scope for increasing the level of government support for entrepreneurship in the UK.
Improving productivity: things that organisations can do
In the podcast from the BBC’s The Bottom Line series, titled ‘Productivity: How Can British Business Work Smarter’ (see link below), Evan Davis and guests discuss what productivity really looks like in practice – from offices and factories, to call centres and operating theatres.’ The episode identifies a number of ways in which labour productivity can be improved. These include:
- People could work harder;
- Workers could be better trained and more skilled and thus able to produce more per hour;
- Capital could be increased so that workers have more equipment or tools to enable them to produce more, or there could be greater automation, releasing labour to work on other tasks;
- Workplaces could be arranged more efficiently so that less time is spent moving from task to task;
- Systems could put in place to ensure that tasks are done correctly the first time and that time is not wasted having to repeat them or put them right;
- Workers could be better incentivised to work efficiently, whether through direct pay or promotion prospects, or by increasing job satisfaction or by management being better attuned to what motivates workers and makes them feel valued;
- Firms could move to higher-value products, so that workers produce a greater value of output per hour.
The three contributors to the programme discuss various initiatives in their organisations (an electronics manufacturer, NHS foundation trusts and a provider of office services to other organisations).
 They also discuss the role that AI plays, or could play, in doing otherwise time-consuming tasks, such as recording and paying invoices and record keeping in offices; writing grants or producing policy documents; analysing X-ray results in hospitals and performing preliminary diagnoses when patients present with various symptoms; recording conversations/consultations and then sorting, summarising and transcribing them; building AI capabilities into machines or robots to enable them to respond to different specifications or circumstances; software development where AI writes the code. Often, there is a shortage of time for workers to do more creative things. AI can help release more time by doing a lot of the mundane tasks or allowing people to do them much quicker.
There are huge possibilities for increasing labour productivity at an organisational level. The successful organisations will be those that can grasp these possibilities – and in many cases they will be incentivised to so so as it will improve their profitability or other outcomes.
Podcast
Articles
- Steeper UK productivity cut of more than £20bn makes tax rises more likely
The Guardian, Kalyeena Makortoff, Phillip Inman and Richard Partington (28/10/25)
- Reeves could face £20bn Budget hole as UK productivity downgraded
BBC News, Faisal Islam (27/10/25)
- To boost UK productivity, ordinary workers must bear more of the tax burden
Financial Times, Anatole Kaletsky (1/11/25)
- Neither China nor Japan – now it is the United States that adopts the brutal 9-9-6 model that redefines productivity and attrition
UnionRayo, Laura M. (1/11/25)
- ‘The money machine is misfiring’: City blames Brexit for UK’s £20bn productivity headache
The Guardian, Richard Partington (31/10/25)
- Organisations can achieve greater productivity and employee engagement with improved performance management, new research finds
WTW Press Release (29/10/25)
- Why does lower productivity mean tax rises are more likely?
BBC Verify, Ben Chu (4/11/25)
- Why is technology not making us more productive?
BBC News, Jonty Bloom (24/7/23)
Data
Questions
- In what different ways can productivity be measured? What is the most appropriate measure for assessing the effect of productivity on (a) GDP and (b) human welfare generally?
- Why has the UK had a lower level of labour productivity than France, Germany and the USA for many years? What can UK governments do to help close this gap?
- Find out how Japanese labour productivity has compared with that in the UK over the past 30 years and explain your findings.
- Research an organisation of your choice to find out ways in which labour productivity could be increased.
- Identify various ways in which AI can improve productivity. Will organisations be incentivised to adopt them?
- Has Brexit affected UK labour productivity and, if so, how and why?