
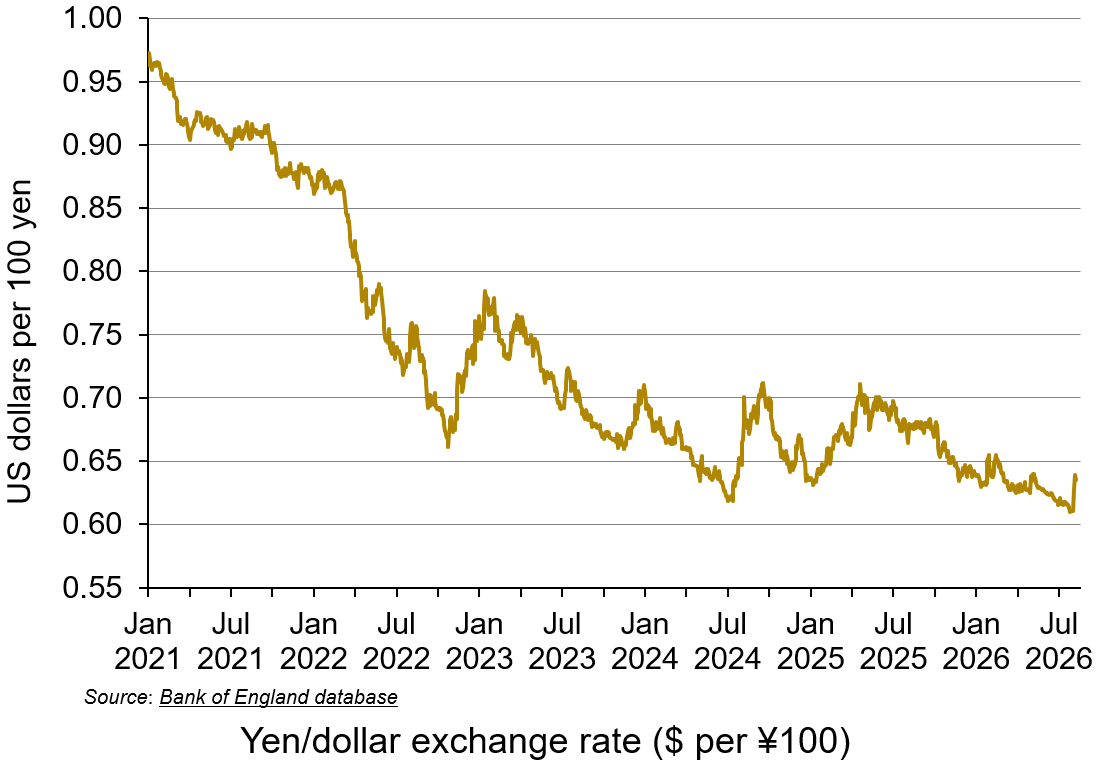
The yen has been depreciating against the dollar and other currencies for several months. It fell from 100 yen = $0.97 in January 2021 to $0.61 by the end of July 2026 – a fall of 37%. This marked a 40-year low. But then, at the end of July it rallied and by 3 August the rate was 100 yen = $0.64 – a rise of nearly 5%. But why did this happen and what will be the implications for Japan and the wider world economy?
Why has the yen fallen so much since 2021?
 There have been two main drivers.
The first is fiscal policy. For many years, Japan has been pursuing expansionary fiscal policy in an attempt to stimulate the sluggish economy. This has led to large budget deficits and public-sector debt. Since 2020, general government gross debt has been around 255% of GDP, the largest of any high-income economy.
Recently, the Japanese government has adopted aggressive supplementary budgets to fund, among other things, fuel subsidies and public-private investment initiatives. This has involved the issuance of more government bonds to fund the necessary borrowing.
 Fiscal pressures have also increased becase of demography. A rapidly aging population and declining birth rates have required substantial public spending on healthcare, social security and pensions. Meanwhile, the tax-paying working-age population has declined as a proportion of total population.
On the plus side, unlike most highly indebted nations, over 90% of Japan’s debt is held domestically by Japanese residents, Japanese institutional investors, banks and the Bank of Japan (BoJ). This lowers the risk of default and hence the risk premium on Japanese bonds.
 The second driver is monetary policy. Interest rates have been kept low over many years, including periods of negative rates, as the BoJ has attempted to stimulate the economy. Low interest rates have sometimes been backed up with quantitative easing to increase money supply.
Since March 2024, however, there have been four interest rate increases. The latest was in June 2026 when the BoJ raised the short-term policy rate from 0.75% to 1.0% – the highest level since 1995. Despite this, interest rates have remained below those in other countries, and this contributed to the continuing fall of the yen.
A falling yen has helped to increase Japanese exports by making them more competitive, but more expensive imports have contributed to rising Japanese inflation.
Low interest rates have also stimulated the yen-dollar carry trade. This is where investors borrow money in yen at low interest rates, convert it into US dollars and invest it in higher-yielding US assets, typically US government bonds (‘Treasury bonds’). This borrowing in yen to buy dollars further contributed to the depreciation of the yen against the dollar.
Co-ordinated intervention
 In an attempt to raise the value of the yen, the Bank of Japan and the US Federal Reserve acted together – their first joint currency rescue operation since 2011. The BoJ spent tens of billions of dollars to buy yen; the US Treasury bought yen by selling euros. Prior to the intervention, global hedge funds held near-record short positions against the yen, meaning that they sold yen at a current price, agreeing to buy them back at a particular later date, hoping that the yen would fall in the meantime and that they would therefore make a profit. The sudden joint intervention forced these traders to buy back the yen to cut their losses before the rate rose further. This accelerated the yen’s appreciation.
But why did the USA join Japan in intervening? Japan is the largest foreign holder of US Treasuries ($1.1 trillion). The USA intervened to discourage Japanese investors from selling US Treasuries in order to raise cash, thereby pushing up US borrowing costs.
The rise in the yen was also encouraged by speculators who are expecting further interest rate rises from the BoJ to counter inflation and support public finances, driving domestic bond yields higher. This will lead to a narrowing of interest rates between Japan and other countries.
Effects on the Japanese economy
 If the yen continues to appreciate, this will help to reduce inflation by making imports cheaper and will help to ease cost-of-living pressures on Japanese consumers. Japan is heavily reliant on imported energy and raw materials.
However, the decline in the yen over recent years has provided a large boost to Japanese exports. A sharp reversal in this could severely affect exporters’ profits and have a serious negative impact on economic growth.
If the appreciation continues, it would lead to an unwinding of the carry trade. To prevent mounting currency losses, highly leveraged institutional investors would be forced to sell assets, such as US and other countries’ shares and bonds to buy back yen and pay off their debts. This potentially massive unwinding would be likely to create global market volatility and drive up interest rates.
Articles
- Yen holds gains after Japan, US confirm joint intervention, signal more action
Reuters, Makiko Yamazaki and Leika Kihara (3/8/26)
- Yen surges to three-month peak, dollar pares losses after intervention
Reuters, Chibuike Oguh (3/8/26)
- US dollar weakens sharply against the Japanese yen after officials intervene in markets
ABC7 Eyewitness News, Mayuko Ono and Elaine Kurtenbach (3/8/26)
- Yen hits three-month high after Trump helps prop up currency
The Guardian, Graeme Wearden (3/8/26)
- Why has Trump stepped in to prop up Japan’s currency?
The Guardian, Jonathan Yerushalmy (3/8/26)
- Why the U.S. stepped in after decades to prop up Japan’s yen — and what’s at stake
CNBC, Lee Ying Shan (3/8/26)
- Politics & Policy Analysis: How Bessent is pushing Warsh’s Fed to expand backstop for Japan’s yen defense
CNBC, Matt Peterson (3/8/26)
- Why Japan is propping up the yen – and why the US helped
The Straits Times (4/8/26)
- The Pros and Cons of a Strong Dollar
Johnston Investment Counsel (3/8/26)
- Why the U.S. Stepped In to Prop Up Japan’s Yen Currency
Yahoo!Finance, Tiago Ventura (3/8/26)
- Why the U.S. Is Helping Prop Up Japan’s Weak Currency
The New York Times, Eshe Nelson (3/8/26)
- U.S.-Japan Intervention Triggers Yen Carry Trade Fears
The Chosun Daily, Lee Hai-woon (3/8/26)
- What top minds in markets are saying about the US intervention to prop up Japan’s currency
Business Insider, Jennifer Sor (3/8/26)
Data
Questions
- What have been the benefits and costs to Japan of a depreciating exchange rate?
- Explain the carry trade.
- Why might the yen-dollar carry trade unwind and what would be the consequences for Japan and the USA?
- Find out what has happened to the exchange rate between the yen and the euro. Has this been driven by the carry trade?
- For what reasons might the yen (a) now continue rising; (b) resume depreciating?
- Find out what has happened to the yen/dollar exchange rate since this blog was written. Explain your findings.
 At the fourth anniversary of Russia’s invasion of Ukraine, we look at the effect of the war on the Russian economy. Two years ago, in the blog The Russian economy after two years of war, we argued that the Russian economy had seemingly weathered the war successfully.
Unlike Ukraine, very little of its infrastructure had been destroyed; it had started the war with a current account balance of payments surplus, a budget surplus and a low general government debt-to-GDP ratio; it had achieved a lot of success in diverting its exports, including oil, away from countries imposing sanctions to countries such as China and India; it was the same with imports, with China especially becoming a major suppliers of machinery, components and vehicles; it has a strong central bank, which engenders a high level of confidence in managing inflation; the military expenditure provided a Keynesian boost to the economy, with production and employment rising.
The situation today
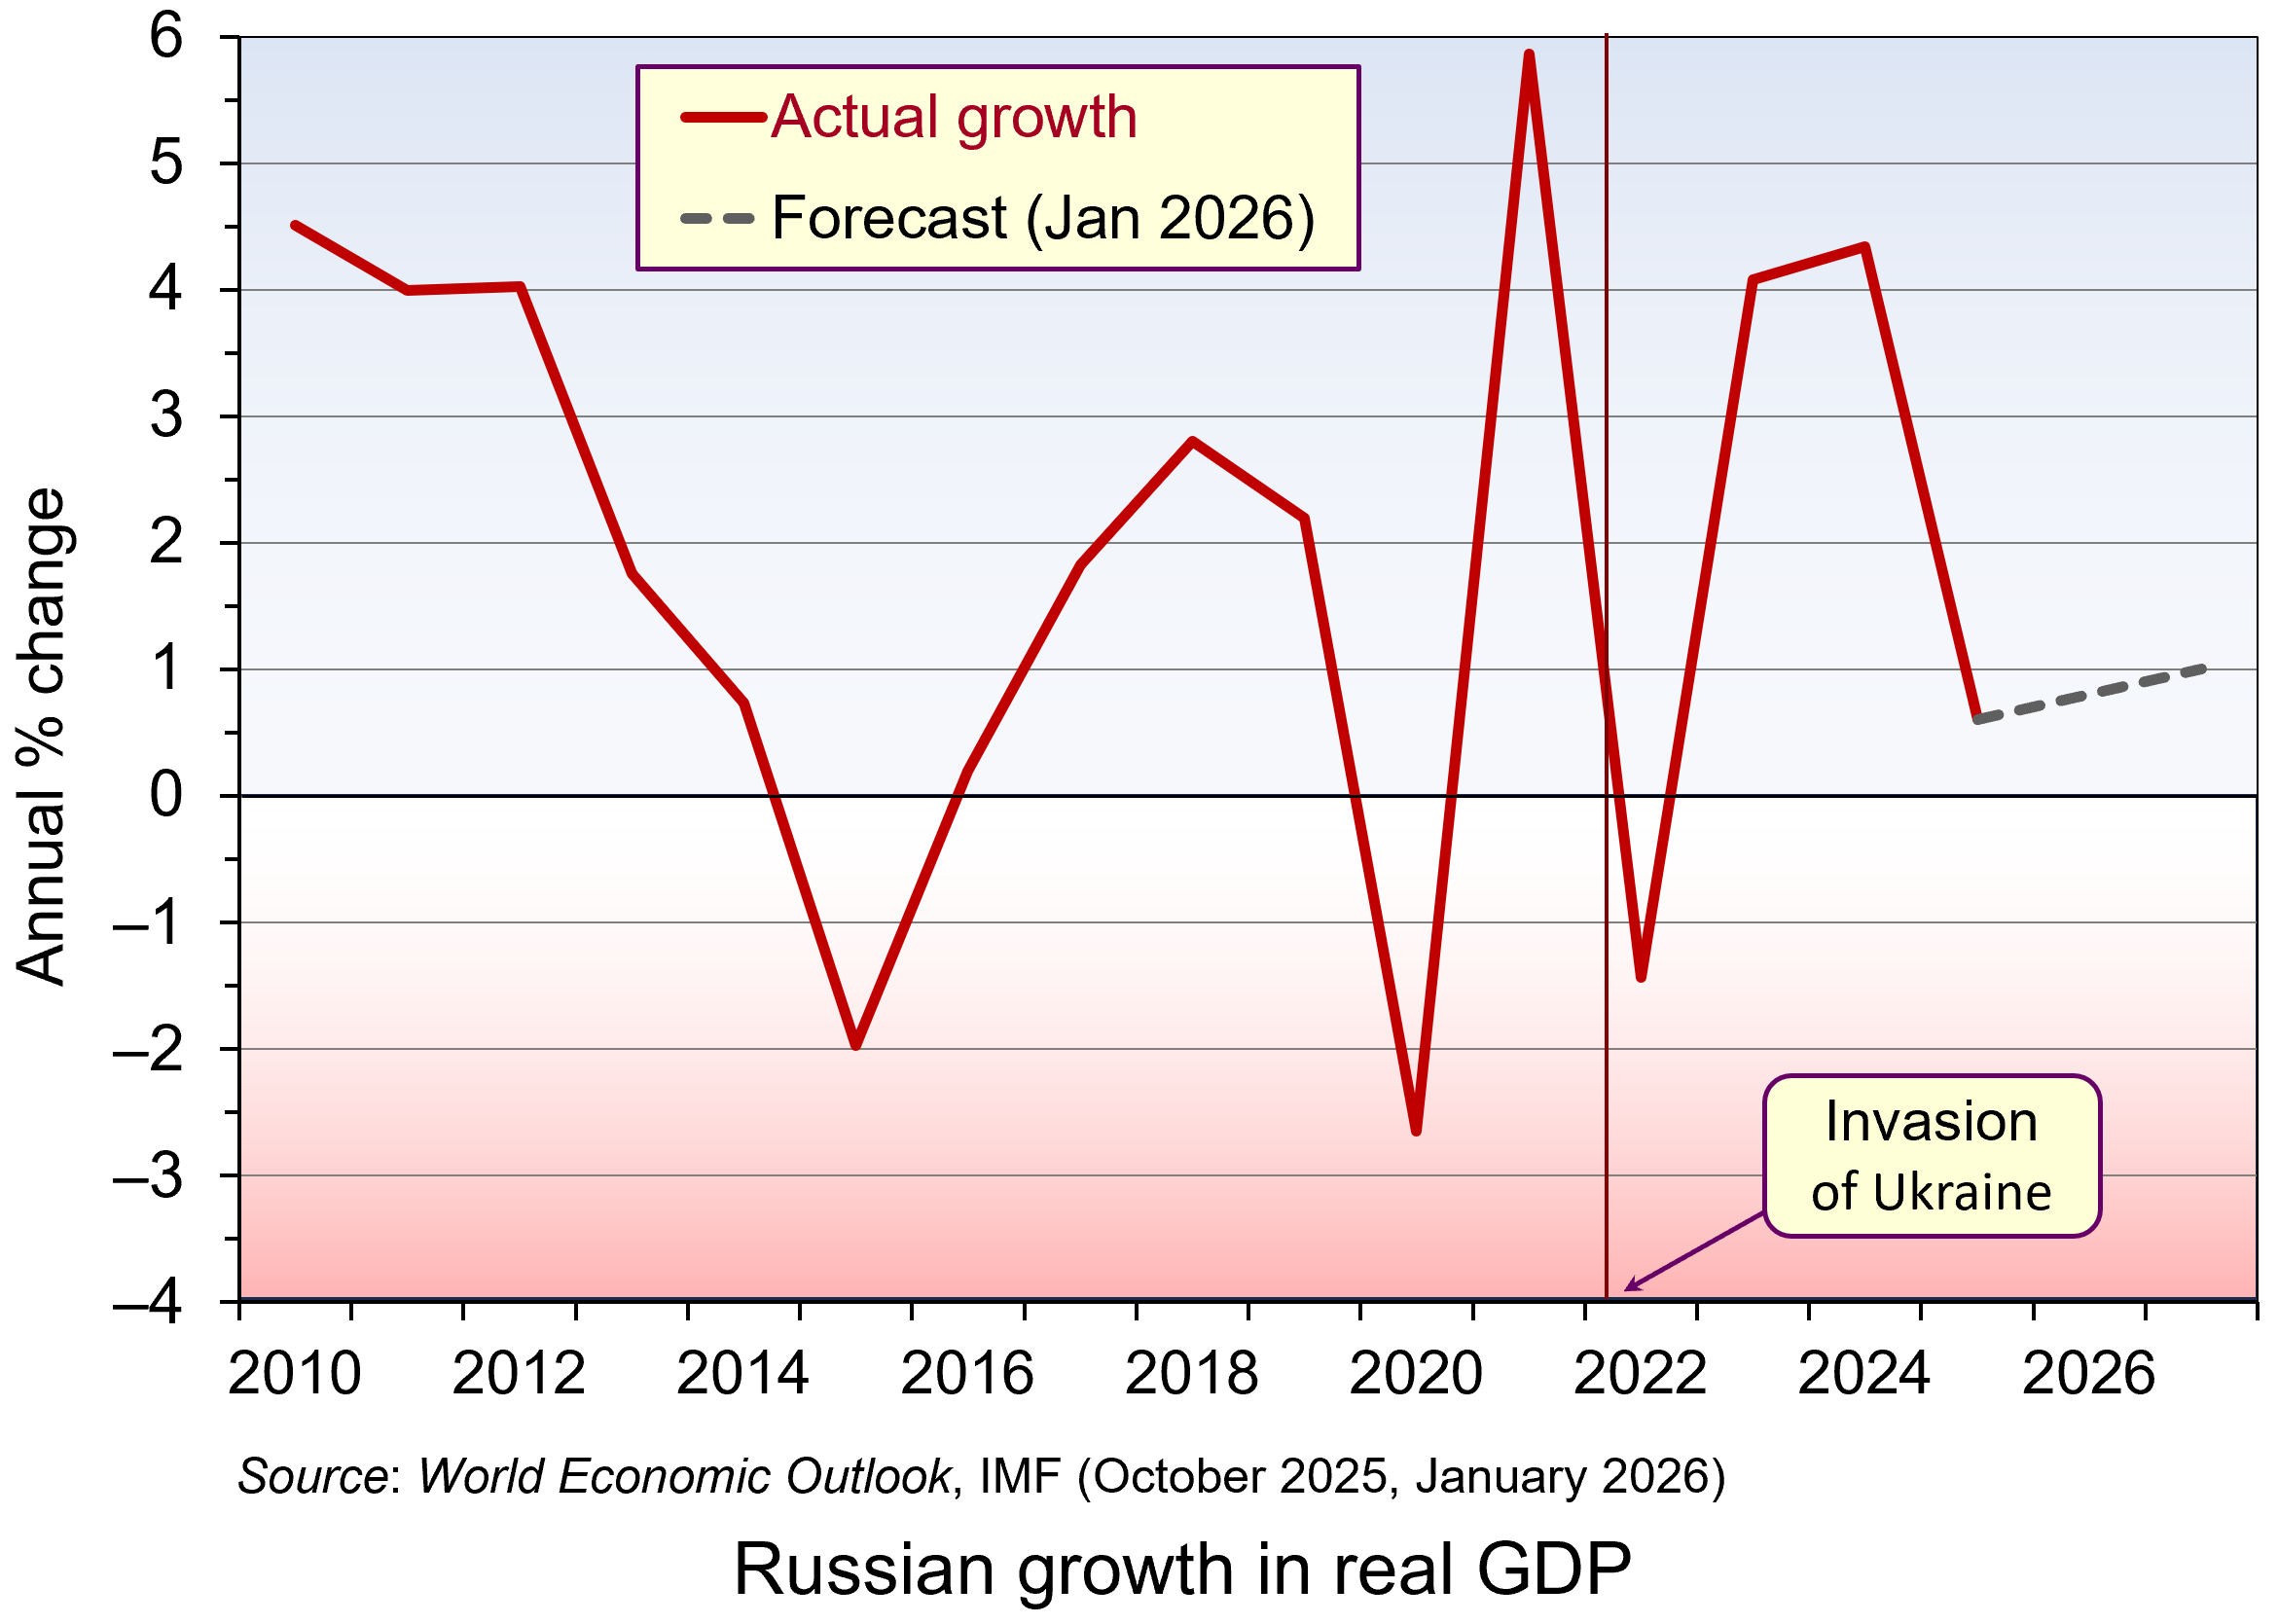 But two years further on, the Russian economy is looking a lot weaker and on the verge of recession. GDP growth fell to 0.6 per cent in 2025 and is forecast to be no more than 1 per cent for the next two years. (Click here for a PowerPoint of the chart.) And despite growth still being positive (just), this is largely because of the growth in military expenditure. Retail and wholesale trade fell by 1.1% in 2025, reflecting supply chain problems and high inflation dampening consumer demand.
With labour being diverted into the armaments and allied industries or into the armed forces, this has led to labour shortages. This has been compounded by the emigration of up to 1 million people by 2025 – often young, educated and skilled professionals.
 Official CPI inflation averaged 8.7 per cent in 2025, although the prices of food and other consumer essentials rose by more, especially in recent months. At the beginning of 2026, supermarket prices rose by 2.3% in just one month, made worse by a rise in VAT from 20% to 22%. The central bank has responded to the high inflation with high interest rates, which averaged 19.2% in 2025, giving a real rate of 10.5%. With such a high real rate, the response of households has been to save. This has masked the constraints on production, or imports, of consumer goods. Savings have also been boosted by large payments to soldiers and bereaved families, with the money saved by the recipients being used in part to fund future such payments. So far there has been trust in the banking system, but if that trust waned and people starting making large withdrawals of savings, it could be seriously destabilising.
Whilst the high real interest rates have helped to mask shortages of consumer goods, they have had a seriously dampening effect on investment by domestic companies. Gross capital formation fell by 3% in 2025, not helped by an increase in the corporation tax from 20% to 25%. At the same time, foreign direct investment remains subdued due to high perceived risks. The lack of investment, plus the labour shortages, will have profound effects on the supply side of the economy, with potential output in the non-military sector likely to decline over the medium term.
 The balance of payments and government finances are turning less favourable. The balance of trade surplus has declined from US$173bn in 2021 to US$67bn in 2025. This could decline further, or even become a deficit, if oil prices continue to be weak, if Western sanctions are tightened (such as stopping the flow of Russian oil exports in the ‘shadow’ fleet of tankers) or if major importing countries stop buying Russian oil. Indian refiners have announced that they are not taking Russian crude in March/April as India seeks to finalise a trade deal with the USA.
The budget balance has moved from a small surplus of 0.8% of GDP in 2021 to a deficit of 2.9% in 2025. Although the government debt-to-GDP ratio remains low by international standards at 23.1% of GDP in 2025, this was up from 16.5% in 2021 and is set to rise further as budget deficits deepen. Nevertheless, as long as the saving rate remains high, the debt can be serviced by domestic bond purchase.
Russia’s economy is definitely weakening and labour shortages and low investment will create major problems for the future. But whether this deterioration will be enough to change Russia’s stance on the war in Ukraine remains to be seen.
Articles
- The Russian economy is finally stagnating. What does it mean for the war – and for Putin?
The Guardian, Alex Clark (6/2/26)
- Exclusive: Russia’s budget deficit may almost triple this year as oil revenues decline
Reuters (4/2/26)
- Russia’s war economy is not collapsing, but neither is it stable
The Conversation, Yerzhan Tokbolat (17/12/25)
- Food prices are surging in Russia. Is the war hitting Russians in the pocket?
BBC News, Olga Shamina, Yaroslava Kiryukhina and Sergei Kagermazov (18/2/26)
- [Russian] GDP data — what it reveals, what it conceals
The Bell, Denis Kasyanchuk (18/2/26)
 What to Expect From the Russian Economy in 2026
Carnegie Endowment for International Peace, Alexandra Prokopenko and Alexander Gabuev (12/2/26)
- Indian refiners avoid Russian oil in push for US trade deal
Reuters, Nidhi Verma (8/2/26)
- What Breaks First – Russia’s Economy or Its War?
Visegrad Insight, Tomasz Kasprowicz (3/2/26)
Videos
Reports
Data
Questions
- What constraints are there currently on the supply side of the Russian economy?
- Some economists have argued that the economic effects of a stalemate in the Ukraine war would suit the Russian leadership more than peace or victory. Why might this be so?
- Under what circumstances might a deep recession in Russia be more likely than stagnation?
- In what ways does Russia’s current financial system resemble a pyramid scheme?
- What cannot a Keynesian boost contunue to support the Russian economy indefinitely?
 On April 2nd, Donald Trump announced sweeping new ‘reciprocal’ tariffs. These would be in addition to 25% tariffs on imports of cars, steel and aluminium already announced and any other tariffs in place on individual countries, such as China. The new tariffs would apply to US imports from every country, except for Canada and Mexico where tariffs had already been imposed.
The new tariffs would depend on the size of the country’s trade in goods surplus with the USA (i.e. the USA’s trade in goods deficit with that country). The bigger the percentage surplus, the bigger the tariff. But, no matter how small a country’s surplus or even if it runs a deficit (i.e. imports more goods from the USA than it sells), it would still face a minimum 10% ‘baseline’ tariff.
President Trump stated that these tariffs are to counter what he claims as unfair trade practices inflicted on the USA. People had been expecting that these tariffs would reflect the tariffs applied by other countries on US goods and possibly also non-tariff barriers, such as the ban on chlorine-washed chicken or hormone-injected beef in the EU and UK. But, by basing them on the size of a country’s trade surplus, this meant imposing them on many countries with which the USA has a free-trade deal with no tariffs at all.
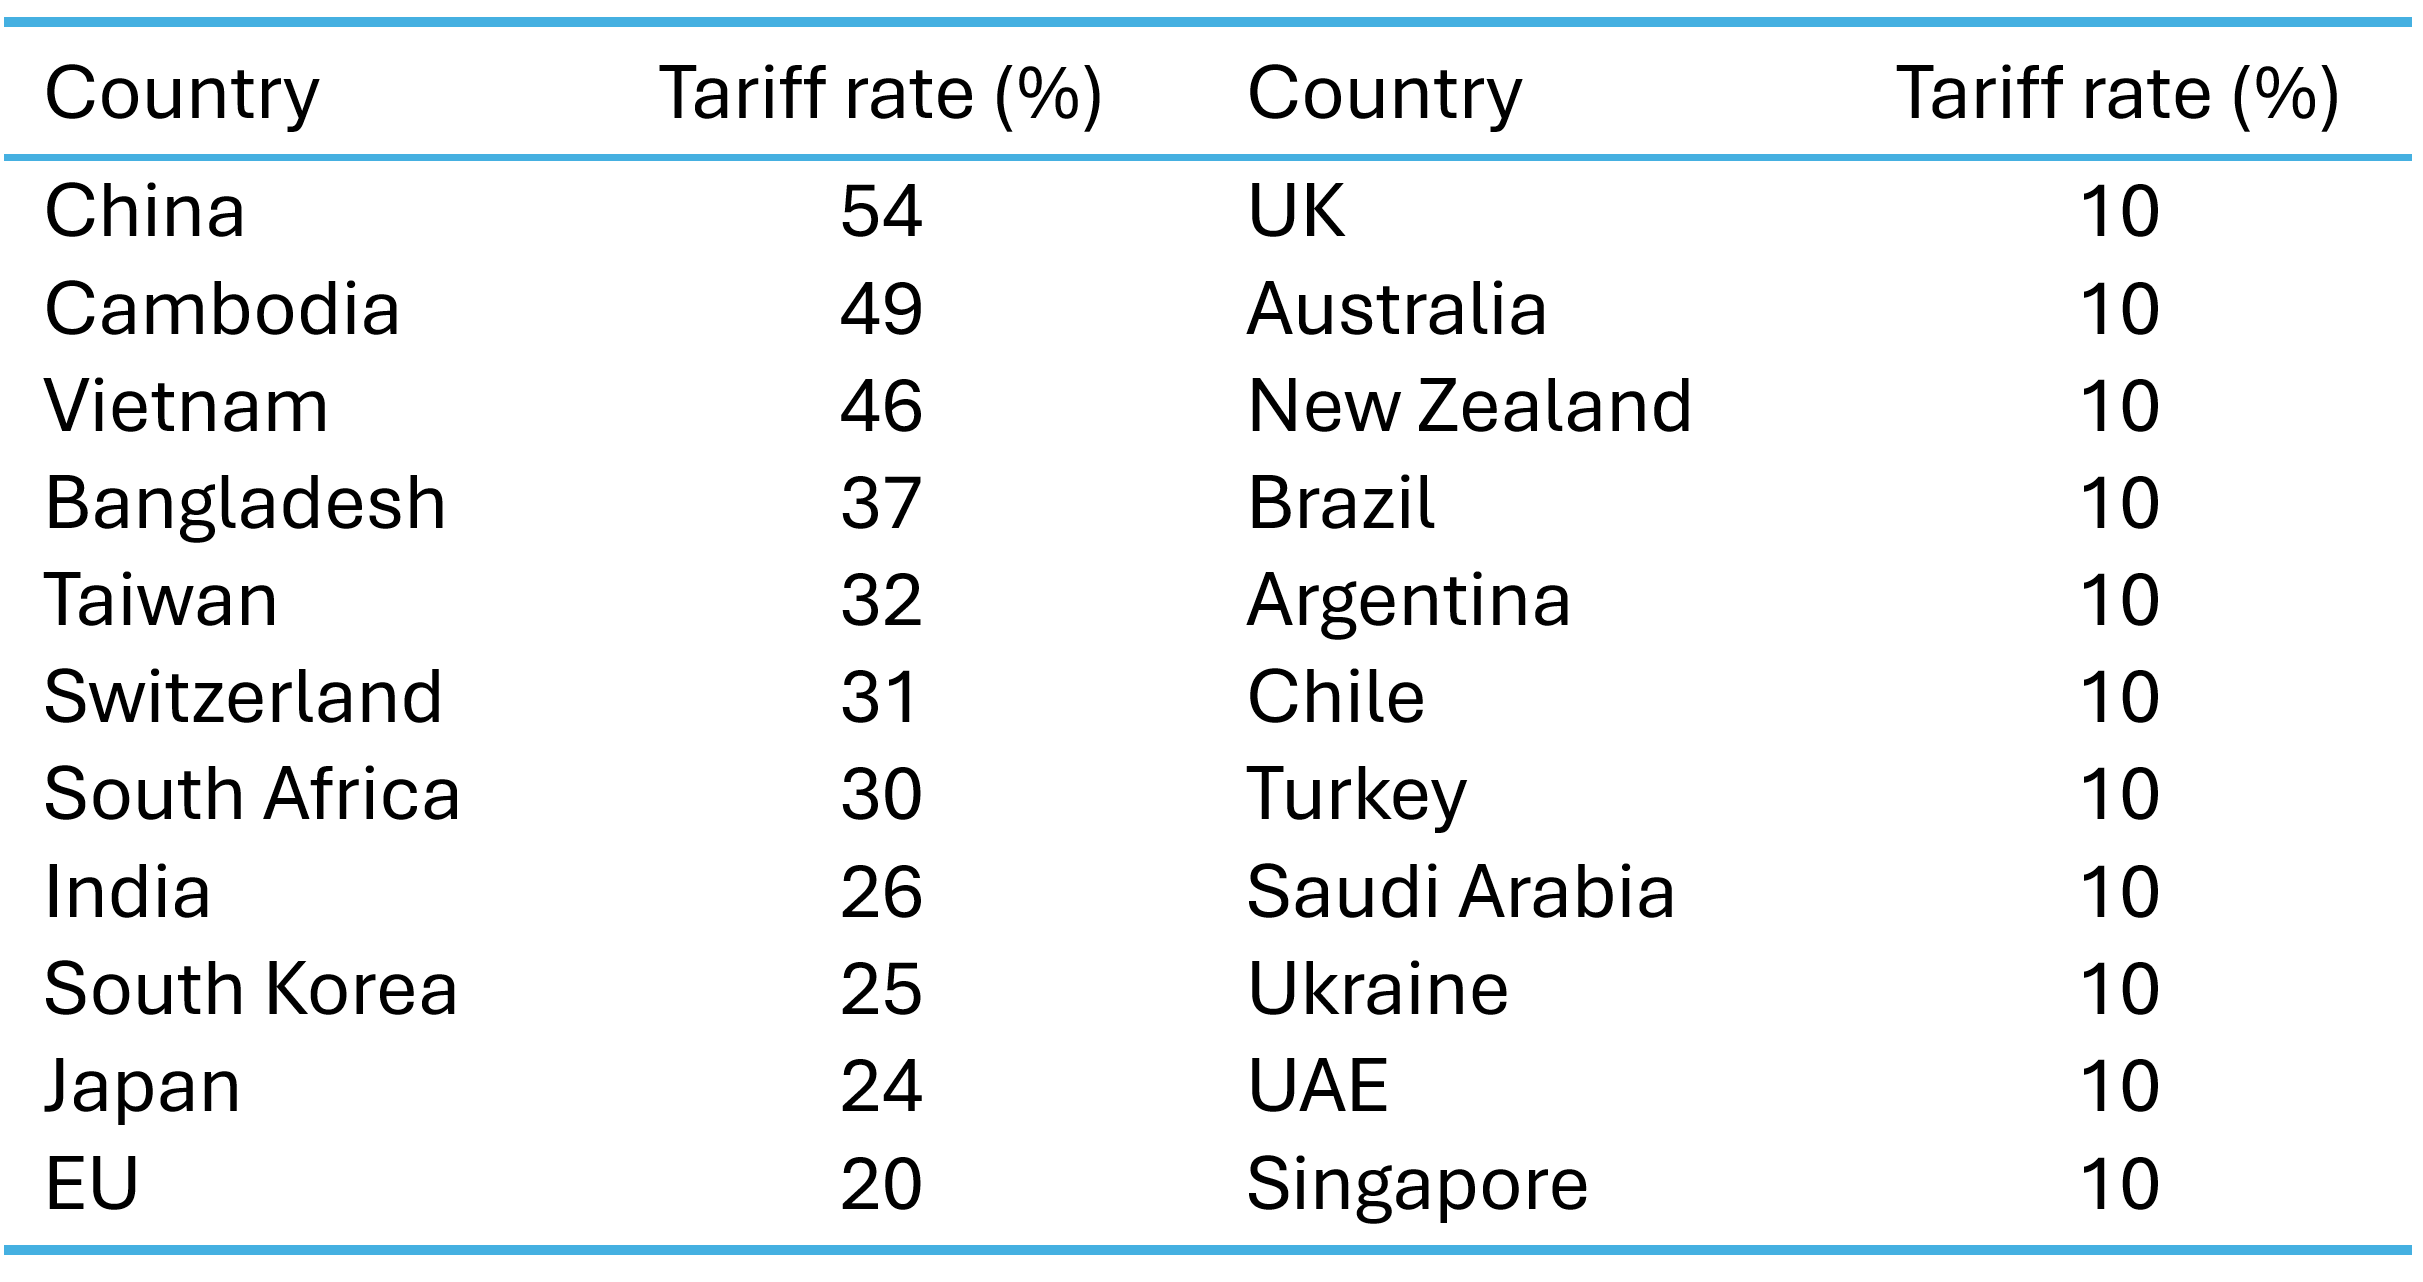 The table gives some examples of the new tariff rates. The largest rates would apply to China and south-east Asian countries, which supply low-priced products, such as clothing, footwear and electronics to the US market. In China’s case, it would a reciprocal tariff rate of 34% plus the previously imposed tariff rate of 20%, giving a massive 54%.
What is more, the ‘de minimis’ exemption will be scrapped for packages sent by private couriers. This had exempted goods of $800 or less sent direct to consumers from China and other countries from companies such as Temu and Alibaba. It is also intended to cut back on packages of synthetic opioids sent from these countries.
Since ‘liberation day’, President Trump has made several changes to these tariff rates. On 9 April he ‘paused’ the implementation of the tariffs above the 10% rate pending trade discussions with individual countries. However, in the case of China, there have been tit-for-tat tariff increases, so that by the end of April, the US tariff rate on Chinese imports was a massive 145% and the Chinese rate on US imports was 125%. The two countries seemed locked in a high-stakes game of chicken.
The US formula for reciprocal tariffs
As we have seen, the proposed (and then paused) reciprocal tariffs do not reflect countries’ tariff rates on the USA. Instead, rates for countries running a trade in goods surplus with the USA (a US trade deficit with these countries) are designed to reflect the size of that surplus as a percentage of their total imports from the USA. The White House has published the following formula.
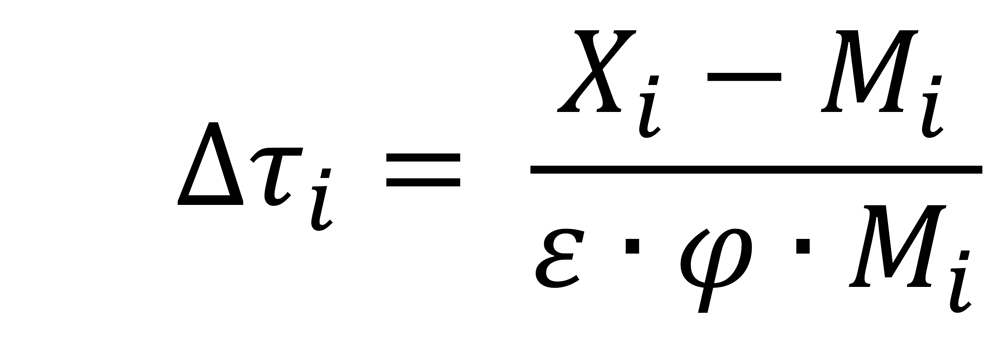
where:

When the two elasticities are multiplied together this gives 1 and so can be ignored. As there was no previous ‘reciprocal’ tariff, the rise in the reciprocal tariff rate is the actual reciprocal tariff rate. The formula for the reciprocal tariff rate thus becomes the percentage trade surplus of that country with the USA: (exports – imports) / imports, expressed as a percentage. This is then rounded up to the nearest whole number.
President Trump also stated that countries would be given a discount to show US goodwill. This involves halving the rate from the above formula and then rounding up to the nearest whole number.
Take the case of China. China’s exports of goods to the USA in 2024 were $439bn, while its imports of goods from the USA were $144bn, giving China a trade surplus with the USA of $295bn. Expressing this as a percentage of exports gives ($295/$439 × 100)/2 = 33.6%, rounded up to 34%. For the EU, the formula gives ($227bn/$584bn × 100)/2 = 19.4%, rounded up to 20%.
Questioning the value of φ. Even if you accept the formula itself as the basis for imposing tariffs, the value of the second term in the denominator, φ, is likely to be seriously undervalued. The term represents the elasticity of import prices with respect to tariff changes. It shows the proportion of a tariff rise that is passed on to consumers, which is assumed to be just one quarter, with producers bearing the remaining three quarters. In reality, it is highly likely that most of the tariff will get passed on, as it was with the tariffs applied in Donald Trump’s first presidency.
If the value for φ were 1 (i.e. all the tariff passed on to the consumer), the formula would give a ‘reciprocal tariff’ of just one quarter of that with a value of φ of 0.25. The figures in the table above would look very different. If the rates were then still halved, all countries with a tariff below 40% (such as the EU, Japan or India) would instead face just the baseline tariff of 10%. What is more, China’s rate would be reduced from 54% to 30% (the original 20% plus the baseline of 10%). Cambodia’s would be reduced to 13%. Even if the halving discount were no longer applied, the rates would still be only half of those shown in the table (and 37% for China).
Are the tariffs justified?
 Even if a correct value of φ were used, a percentage trade surplus is a poor way of measuring the protection used by a country. Many countries running a trade surplus with the USA are low-income countries with low labour costs. They have a comparative advantage in labour-intensive goods. That allows such goods to be purchased at low cost by Americans. Their trade surplus may not be a reflection of protection at all.
Also, if protection is to be used to reflect the trade imbalance with each country, then why impose a 10% baseline on countries, like the UK, with which the USA has a trade surplus? By the Trump administration’s logic, it ought to be subsidising UK imports or accepting of UK tariffs on imports of US goods.
But President Trump also wants to address the USA’s overall trade deficit. The US balance of trade in goods deficit was $1063bn in 2023 (the latest year for a full set of figures). But the overall balance of payments must balance. There were thus surpluses elsewhere on the balance of payments account (and some other deficits). There was a surplus on the services account of $278bn and on the financial account of $924bn. In other words, inward investment to the USA (both direct and portfolio) and the acquisition of dollars by other countries as a reserve asset were very large and helped to drive up the exchange rate. This made US goods less competitive and imports relatively cheaper.
The USA has a large national debt of some $36 trillion of which some $9 trillion is owed to foreign investors (people, institutions or countries). Servicing the debt pushes up US interest rates. This helps to maintain a high exchange rate, thereby making imports cheaper and worsening the trade deficit. The fiscal burden of servicing the debt also crowds out US government expenditure on items such as defence, education, law and order and infrastructure. President Trump hopes that tariffs will bring in additional revenue to help finance the deficit.
Effects on the USA
If the tariffs reduce spending on imports and if other countries do not retaliate, then the US balance of trade should improve. However, a tariff is effectively a tax on imported goods. It is charged to the importing company not to the manufacturer abroad. As we saw in the context of the false value for φ, most of the tariff will be passed on to American consumers. Theoretically the incidence of the tariff is shared between the supplier and the purchaser, but in practice, most of the higher cost to the importer will be passed on to the consumer. As with other taxes, the effect is to transfer money from the consumer to the government, making people poorer but giving the government extra revenue. This revenue will be dollars, not foreign currency.
As some of the biggest price rises will be for cheap manufactured products, such as imports from China, and various staple foodstuffs, the effects could be felt disproportionately by the poor. Higher import prices will allow domestic producers competing with these imports to raise their prices too. The tariffs are thus likely to be inflationary. But because the inflation would be the result of higher costs, not higher demand, this could lead to recession as real incomes fell.
American resources will be diverted by the tariffs from sectors in which the USA has a comparative advantage, such as advanced manufactured goods and services, to more basic products. Tariffs on cheap imports will make domestic versions of these products more profitable: even though they are more costly to produce, they will be sold at a higher price.
The tariffs will also directly affect goods produced by US companies. The reason is that many use complex supply chains involving parts produced abroad. Take the case of Apple. Even though it is an American company which designs its products in California, the company sources parts from several Asian countries and has factories in Vietnam, China, India, and Thailand. These components will face tariffs and thus directly affect the price of iPhones, iPads, MacBooks, etc. Similarly affected are other US tech hardware manufacturers, US car manufactures, clothing and footwear producers, such as The Gap and Nike, and home goods producers.
 Monetary policy response. How the Fed would respond is not clear. Higher inflation and lower growth, or even a recession, produces what is known as ‘stagflation’: inflation combined with stagnation. Many countries experienced stagflation following the Russian invasion of Ukraine, when higher commodity prices led to soaring inflation and economic slowdown. There was a cost-of-living crisis.
If a central bank has a simple mandate of keeping inflation to a target, higher inflation would be likely to lead to higher interest rates, making recession even more likely. It is the inflation of the two elements of stagflation (inflation and stagnation) that is addressed. The recession is thus likely to be deepened by monetary policy. But as the Fed has a dual mandate of controlling inflation but also of maximising employment, it may choose not to raise interest rates, or even to lower them, to get the optimum balance between these two targets.
If other countries retaliate by themselves raising tariffs on US exports and/or if consumers boycott American goods and services, this will further reduce incomes in the USA. Just two days after ‘liberation day’, China retaliated against America’s 34% additional tariff on Chinese imports by imposing its own 34% tariff on US imports to China.
A trade war will make the world poorer, especially the USA. Investors know this. In the two days following ‘liberation day’, stock markets around the world fell sharply and especially in the USA. The Dow Jones was down 9.3% and the tech-heavy Nasdaq Composite was down 11.4%.
Effects on the rest of the world
The effects of the tariffs on other countries will obviously depend on the tariff rate. The countries facing the largest tariffs are some of the poorest countries which supply the USA with simple labour-intensive products, such as garments, footwear, food and minerals. This could have a severe effect on their economies and cause rapidly increasing poverty and hardship.
If countries retaliate, then this will raise prices of their imports from the USA and hurt their own domestic consumers. This will fuel inflation and push the more seriously affected countries into recession.
If the USA retaliates to this retaliation, thereby further escalating the trade war, the effects could be very serious. The world could be pushed into a deep recession. The benefits of trade, where all countries can gain by specialising in producing goods with low opportunity costs and importing those with high domestic opportunity costs, would be seriously eroded.
What President Trump hopes is that the tariffs will put him in a strong negotiating position. He could offer to reduce or scrap the tariffs on a particular country in exchange for something he wants. An example would be the offer to scrap or reduce the baseline 10% tariff on UK exports and/or the 25% tariff on UK exports of cars, steel and aluminium. This could be in exchange for the UK allowing the importation of US chlorinated chicken or abolishing the digital services tax. This was introduced in 2020 and is a 2% levy on tech firms, including big US firms such as Amazon, Alphabet (Google), Meta and X.
It will be fascinating but worrying to see how the politics of the trade war play out.
Videos
- Trump’s tariffs on China, EU and more, at a glance
BBC News, Michelle Fleury and Kayla Epstein (2/4/25)
- Why Trump’s tariffs aren’t really reciprocal
BBC News, Ben Chu (3/4/25)
- Trump Tariff calculations are “unreliable”
New Statesman on YouTube, Andrew Marr & Duncan Weldon (3/4/25)
- Here’s a look at Trump’s math for ‘reciprocal’ tariffs
Reuters on YouTube, Daniel Burns (3/4/25)
- The U.S. is the loser in Trump’s tariff war
MSNBC on YouTube, Steve Rattner (4/4/25)
- “American Empire Is in Decline”: Trump’s Trade War & Tariffs
Democracy Now on YouTube, Richard Wolff (3/4/25)
- ‘Our unity is our strength’ – EU responds to Trump’s tariffs
BBC News, Ursula von der Leyen, President of the European Commission (3/4/25)
Articles
- How were Donald Trump’s tariffs calculated?
BBC News, Ben Chu and Tom Edgington (3/4/25)
- How to read the White House’s tariff formula
Axios, Felix Salmon and Neil Irwin (3/4/25)
- Trump’s ‘idiotic’ and flawed tariff calculations stun economists
The Guardian, Richard Partington (3/4/25)
- Perilous and chaotic, Trump’s ‘liberation day’ endangers the world’s broken economy – and him
The Guardian, Martin Kettle (2/4/25)
- ‘In economic terms, Trump’s tariffs make no sense at all’
The Guardian, Heather Stewart and Richard Partington (4/3/25)
- Trump’s chaos-inducing global tariffs, explained in charts
The Guardian, Lauren Aratani, Lucy Swan, Ana Lucía González Paz and Aliya Uteuova (3/4/25)
- Trump’s trade war will hurt everyone – from Cambodian factories to US online shoppers
The Conversation, Lisa Toohey (3/4/25)
- Consumers are boycotting US goods around the world. Should Trump be worried?
The Conversation, Alan Bradshaw and Dannie Kjeldgaard (4/4/25)
- How the UK and Europe could respond to Trump’s ‘liberation day’ tariffs
The Conversation, Renaud Foucart (3/4/25)
- Trump just massively escalated his trade war. Here’s what he announced
CNN, Elisabeth Buchwald (2/4/25)
- EU plans countermeasures to new US tariffs, says EU chief
Reuters, Philip Blenkinsop and Benoit Van Overstraeten (3/4/25)
- Wall Street analysts anguish over ‘Liberation Day’
FT Alphaville, Robin Wigglesworth (3/4/25)
- Reciprocal tariffs: you won’t believe how they came up with the numbers
Financial Times, Alexandra Scaggs (3/4/25)
- Donald Trump baffles economists with tariff formula
Financial Times, Peter Foster and Sam Fleming (3/4/25)
- Five key takeaways from Trump’s ‘Liberation Day’ reciprocal tariffs
Aljazeera (3/4/25)
- These American companies are in big trouble from Trump tariffs
Axios, Nathan Bomey (3/4/25)
White House publications
Questions
- What is the law of comparative advantage? Does this imply that free trade is always the best alternative for countries?
- From a US perspective, what are the arguments for and against the tariffs announced by President Trump on 2 April 2025?
- What response to the tariffs is in the UK’s best interests and why?
- Should the UK align with the EU in responding to the tariffs?
- What is meant by a negative sum game? Explain whether a trade war is a negative sum game. Can a specific ‘player’ gain in a negative sum game?
- What happened to stock markets directly following President Trump’s announcement and what has happened since? Explain you findings.
A common practice of international investors is to take part in the so-called ‘carry trade’. This involves taking advantage of nominal interest rate differences between countries. For example, assume that interest rates are low in Japan and high in the USA. It is thus profitable to borrow yen in Japan at the low interest rate, exchange it into US dollars and deposit the money at the higher interest rate available in the USA. If there is no change in the exchange rate between the dollar and the yen, the investor makes a profit equal to the difference in the interest rates.
Rather than depositing the money in a US bank account, an alternative is to purchase US bonds or other assets in the USA, where the return is again higher than that in Japan.
If, however, interest-rate differentials narrow, there is the possibility of the carry trade ‘unwinding’. Not only may the carry trade prove unprofitable (or less so), but investors may withdraw their deposits and pay back the loans. This, as we shall, can have adverse consequences on exchange rates.
The problem of an unwinding of the carry trade is not new. It worsened the underlying problems of the financial crisis in 2008. The question today is whether history is about to repeat itself with a new round of unwinding of the carry trade threatening economic growth and recovery around the world.
We start by looking at what happened in 2008.
The carry trade and the 2008 financial crisis
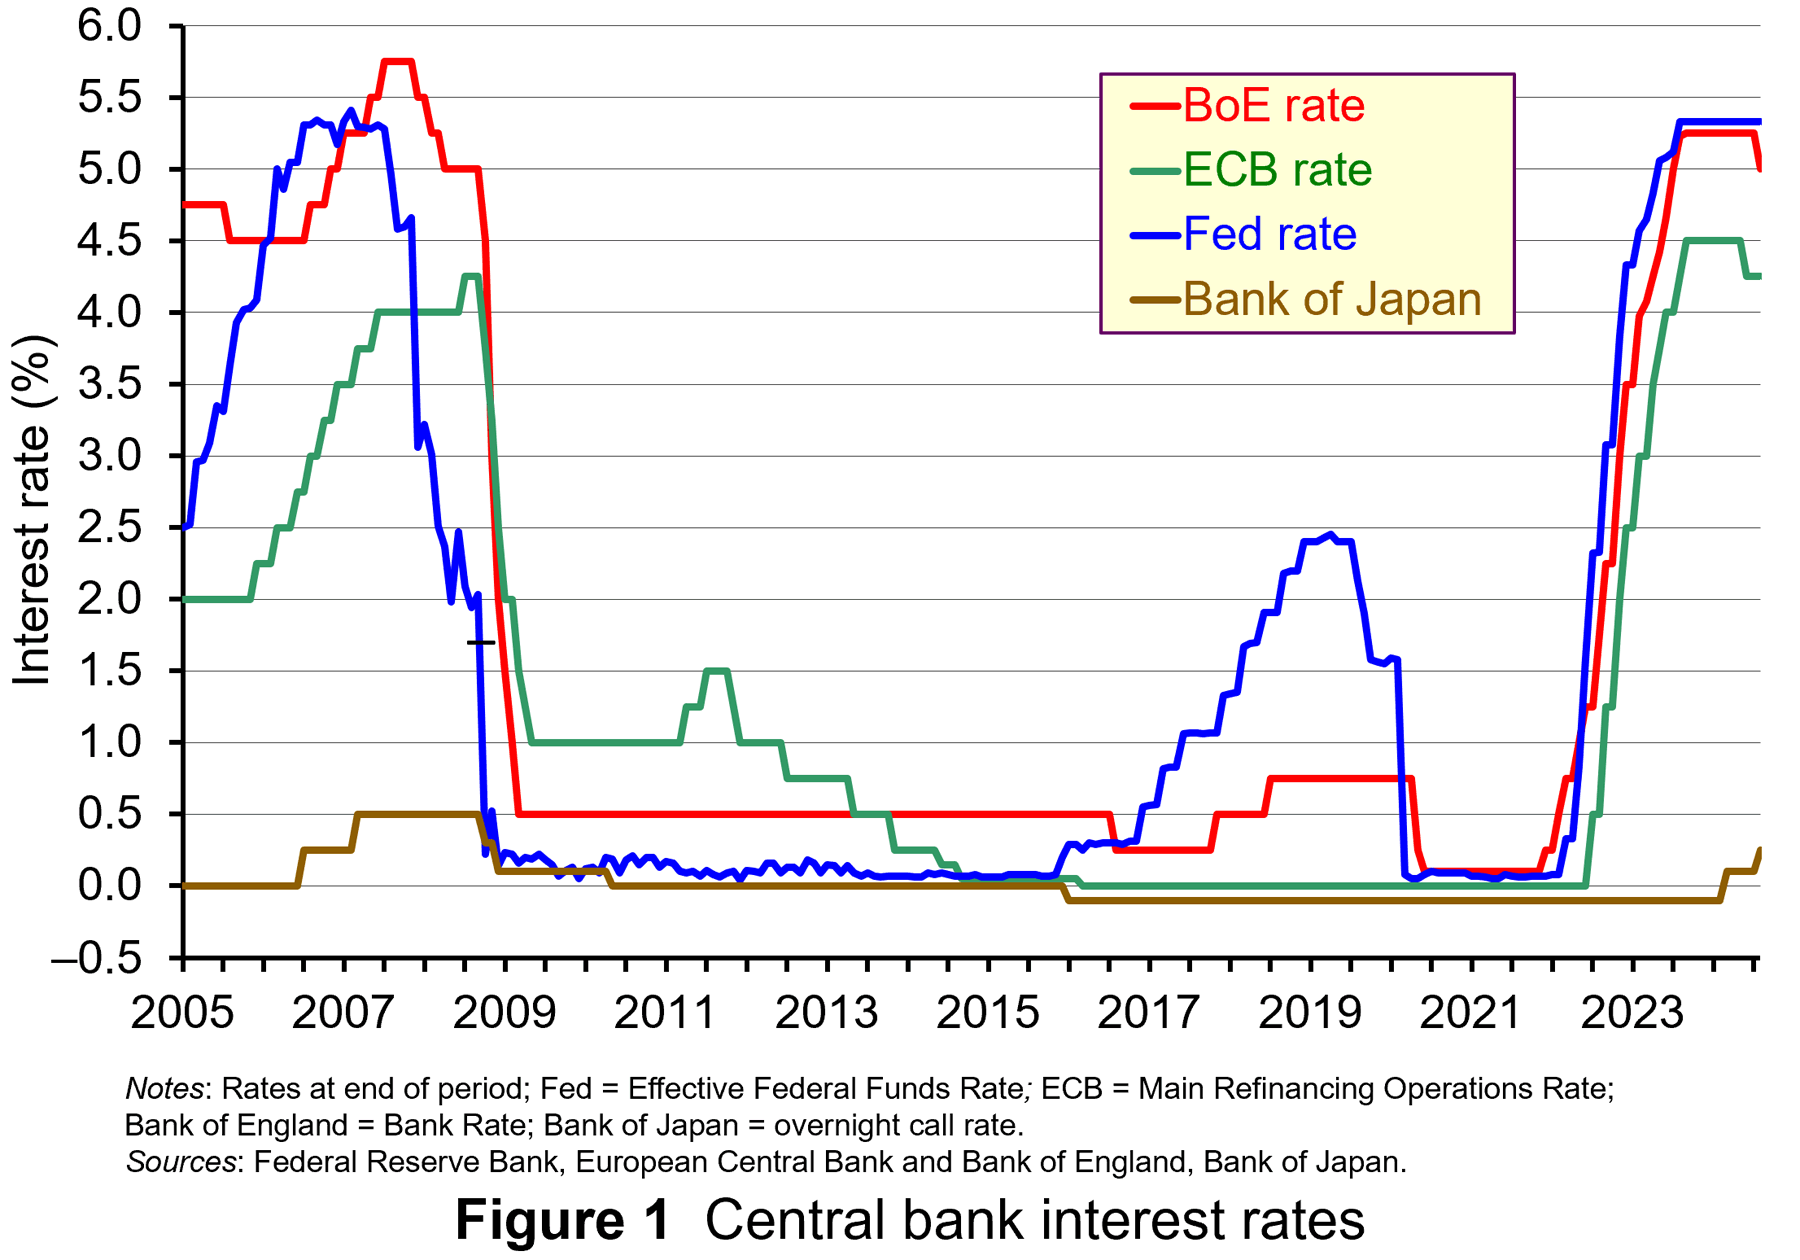 Prior to the financial crisis of 2008, current account deficit countries, such as the UK, USA and Australia, typically had relatively high interest rates, while current account surplus countries such as Japan and Switzerland had relatively low ones. Figure 1 shows central bank interest rates from 2005 to the current day (click here for a PowerPoint).
The carry trade saw investors borrowing money in Japan and Switzerland, exchanging it on the foreign exchange market, with the currency then deposited in the UK, USA and Australia. Hundreds of billions worth of dollars were involved in this carry trade.
If, however, the higher interest rates in the UK and other deficit countries were simply to compensate investors for the risk of currency depreciation, then there would be no excessive inflow of finance. The benefit of the higher interest rate would be offset by a depreciating currency. But the carry trade had the effect of making deficit currencies appreciate, thereby further boosting the carry trade by speculation of further exchange rate rises.
Thus the currencies of deficit countries appreciated, making their goods less competitive and worsening their current account deficit. Between 1996 and 2006, the average current account deficits as a percentage of GDP for Australia, the USA and the UK were close to 4½, 4 and 2, respectively. Between January 1996 and December 2006, the broad-based real exchange rate index of the Australian dollar appreciated by 17%, of the US dollar by 4% and of sterling by some 23%.
 Currencies of surplus countries depreciated, making their goods more competitive and further boosting their current account surpluses. For example, between 2004 and 2006 the average current account surpluses as a percentage of GDP for Japan and Switzerland were 3½ and 13, respectively. Their short-term interest rates averaged a mere 0.1% and 1.0% respectively (compared with 3.4%, 4.7% and 5.7% for the USA, the UK and Australia). Yet between January 2004 and December 2006, the real exchange rate index of the yen depreciated by 21%, while that of the Swiss franc depreciated by 6%.
With the credit crunch of 2007/8, the carry trade unwound. Much of the money deposited in the USA had been in highly risky assets, such as sub-prime mortgages. Investors scrambled to sell their assets in the USA, UK and the EU. Loans from Japan and Switzerland were repaid and these countries, seen as ‘safe havens’, attracted deposits. The currencies of deficit countries, such as the UK and USA, began to depreciate and those of surplus countries, such as Japan and Switzerland, began to appreciate. Between September 2007 and September 2008, the real exchange rate indices of the US dollar and sterling depreciated by 2% and 13% respectively; the yen and the Swiss franc appreciated by 3% and 2¾%.
This represented a ‘double whammy’ for Japanese exporters. Not only did its currency appreciate, making its exports more expensive in dollars, euros, pounds, etc., but the global recession saw consumers around the world buying less. As a result, the Japanese economy suffered the worst recession of the G7 economies.
The carry trade in recent months
Since 2016, there has been a re-emergence of the carry trade as the Fed began raising interest rates while the Bank of Japan kept rates at the ultra low level of –0.1% (see Figure 1). The process slowed down when the USA lowered interest rates in 2020 in response to the pandemic and fears of recession. But when the USA, the EU and the UK began raising rates at the beginning of 2022 in response to global inflationary pressures, while Japan kept its main rate at –0.1%, so the carry trade resumed in earnest. Cross-border loans originating in Japan (not all of it from the carry trade) had risen to ¥157tn ($1tn) by March 2024 – a rise of 21% from 2021.
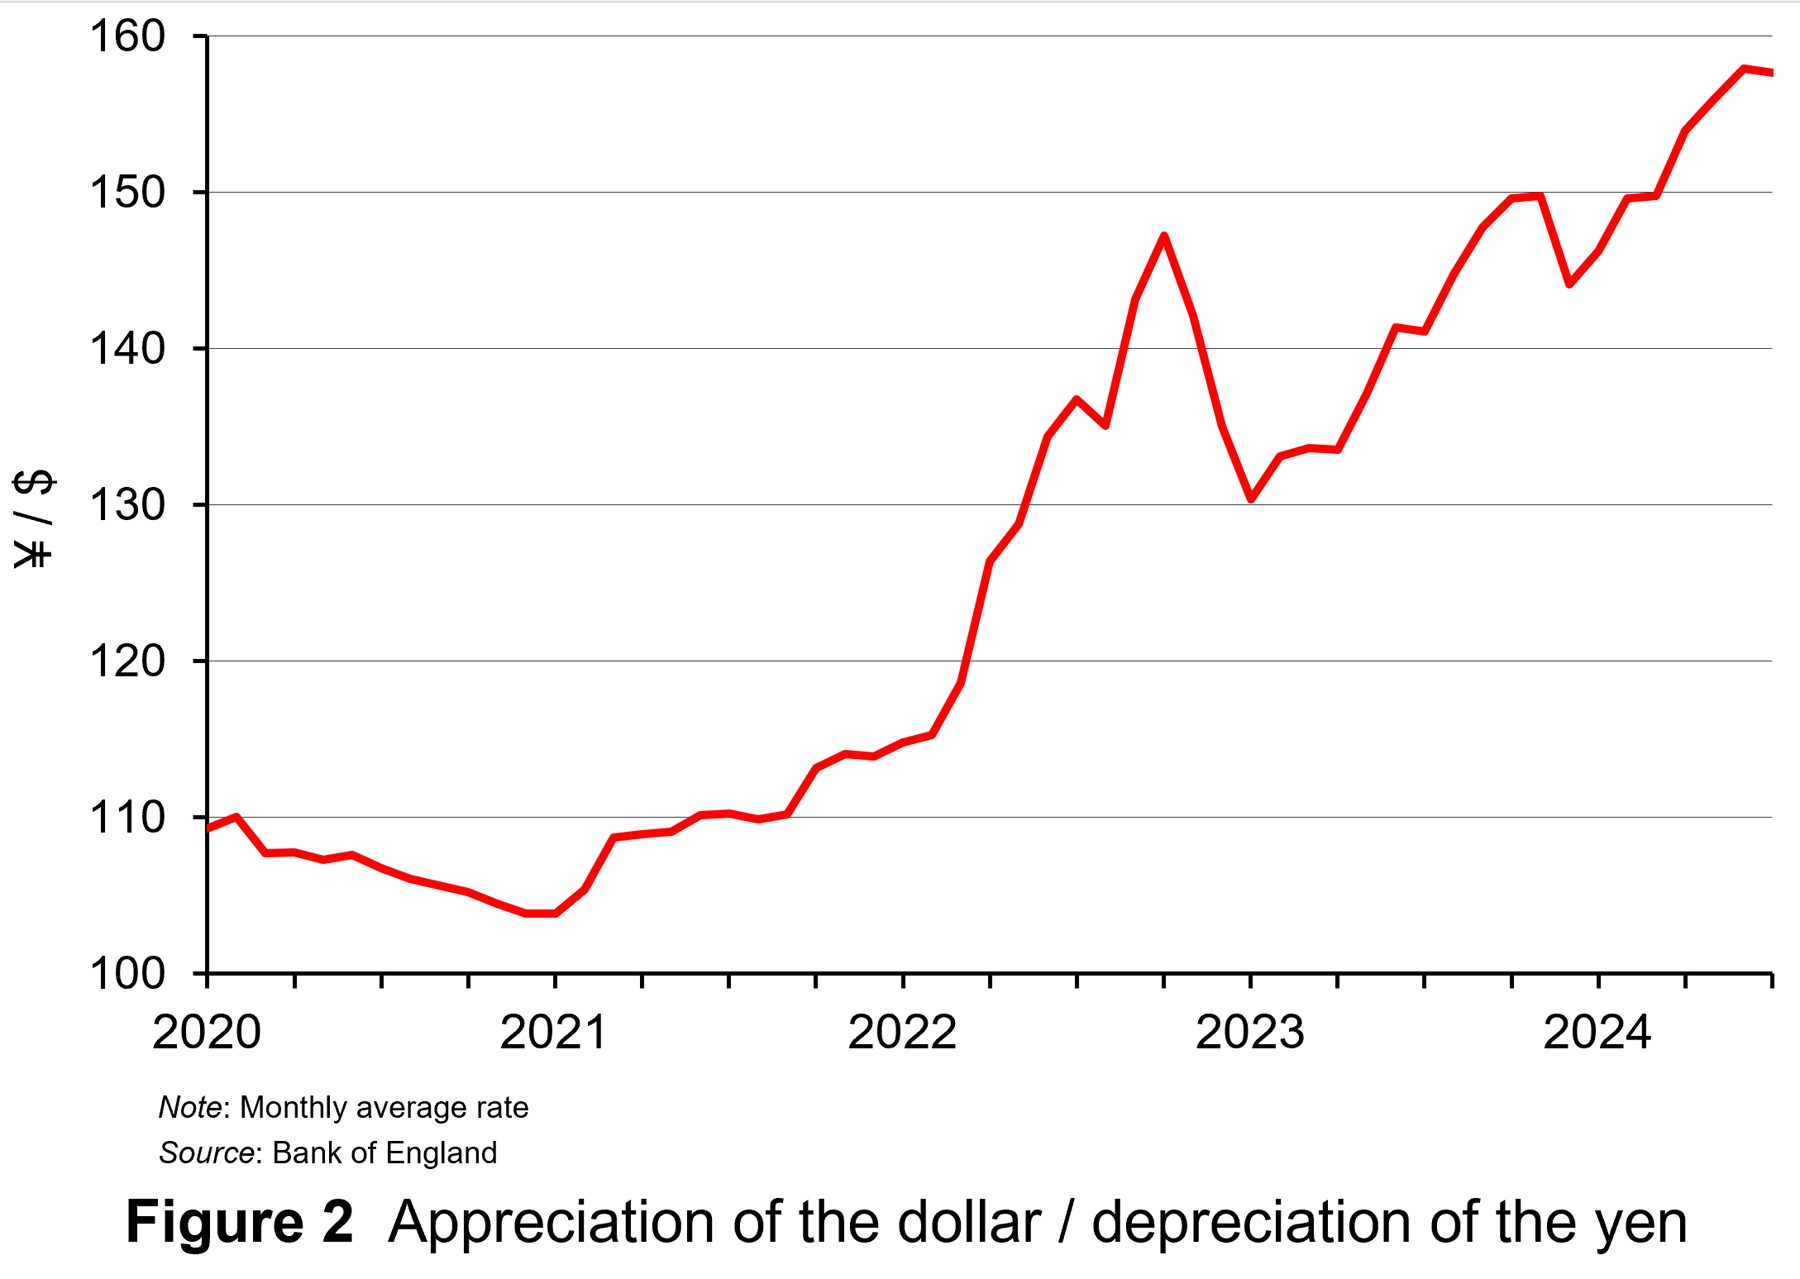 The process boosted US stock markets and contributed to the dollar appreciating against the yen (see Figure 2: click here for a PowerPoint).
Although this depreciation of the yen helped Japanese exports, it also led to rising prices. Japanese inflation rose steadily throughout 2022. In the 12 months to January 2022 the inflation rate was 0.5% (having been negative from October 2020 to August 2021). By January 2023, the annual rate had risen to 4.3% – a rate not seen since 1981. The Bank of Japan was cautious about raising interest rates to suppress this inflation, however, for fear of damaging growth and causing the exchange rate to appreciate and thereby damaging exports. Indeed, quarterly economic growth fell from 1.3% in 2023 Q1 to –1.0% in 2023 Q3.
But then, with growth rebounding and the yen depreciating further, in March 2024 the Bank of Japan decided to raise its key rate from –0.1% to 0.1%. This initially had the effect of stabilising the exchange rate. But then with the yen depreciating further and inflation rising from 2.5% to 2.8% in May and staying at this level in June, the Bank of Japan increased the key rate again at the end of July – this time to 0.25% – and there were expectations that there would be another rise before the end of the year.
At the same time, there were expectations that the Fed would soon lower its main rate (the Federal Funds Rate) from its level of 5.33%. The ECB and the Bank of England had already begun lowering their main rates in response to lower inflation. The carry trade rapidly unwound. Investors sold US, EU and UK assets and began repaying yen loans.
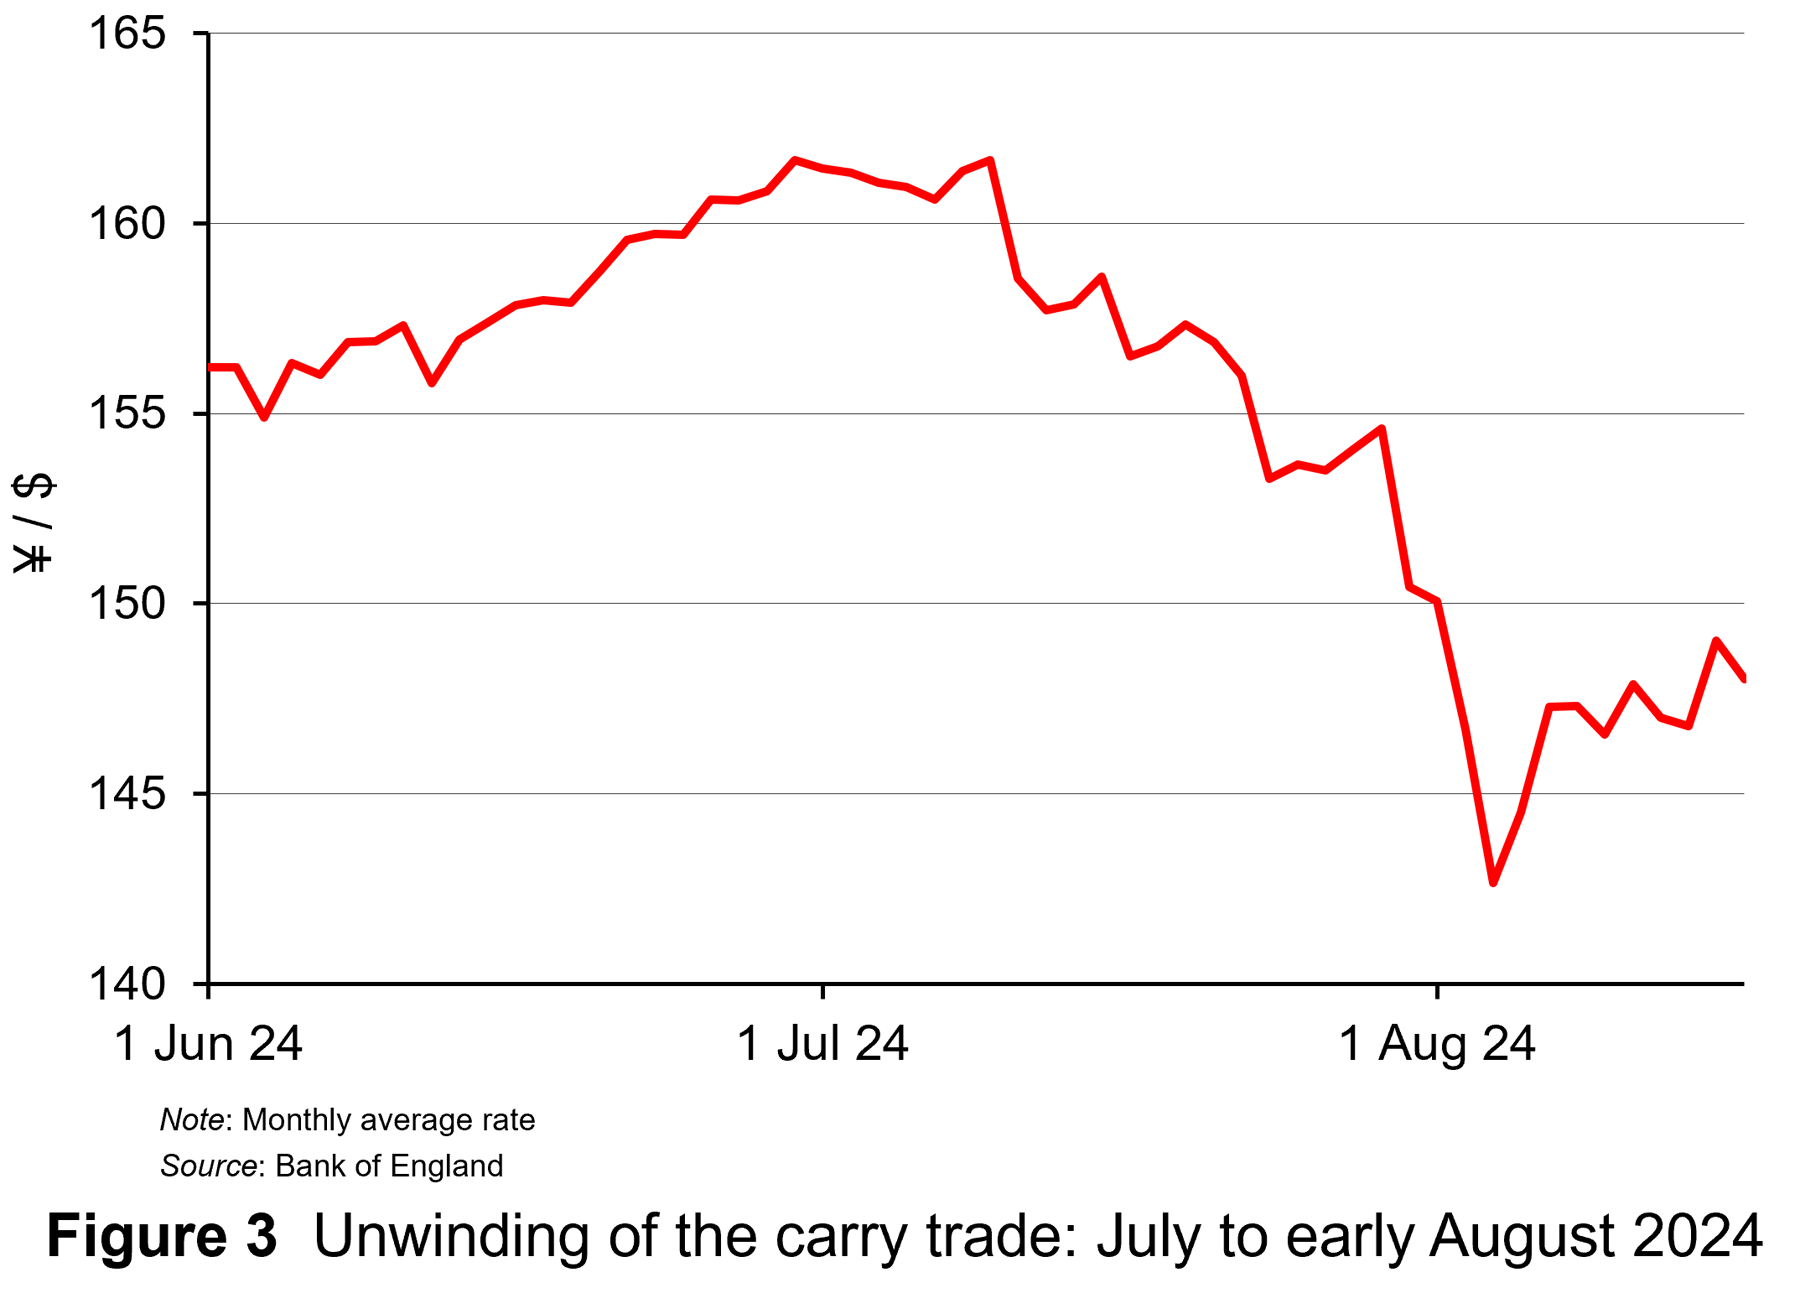 The result was a rapid appreciation of the yen as Figure 3 shows (click here for a PowerPoint). Between 31 July (the date the Bank of Japan raised interest rates the second time) and 5 August, the dollar depreciated against the yen from ¥150.4 to ¥142.7. In other words, the value of 100 yen appreciated from $0.66 to $0.70 – an appreciation of the yen of 6.1%.
Fears about the unwinding of the carry trade led to falls in stock markets around the world. Not only were investors selling shares to pay back the loans, but fears of the continuing process put further downward pressure on shares. From 31 July to 5 August, the US S&P 500 fell by 6.1% and the tech-heavy Nasdaq by 8.0%.
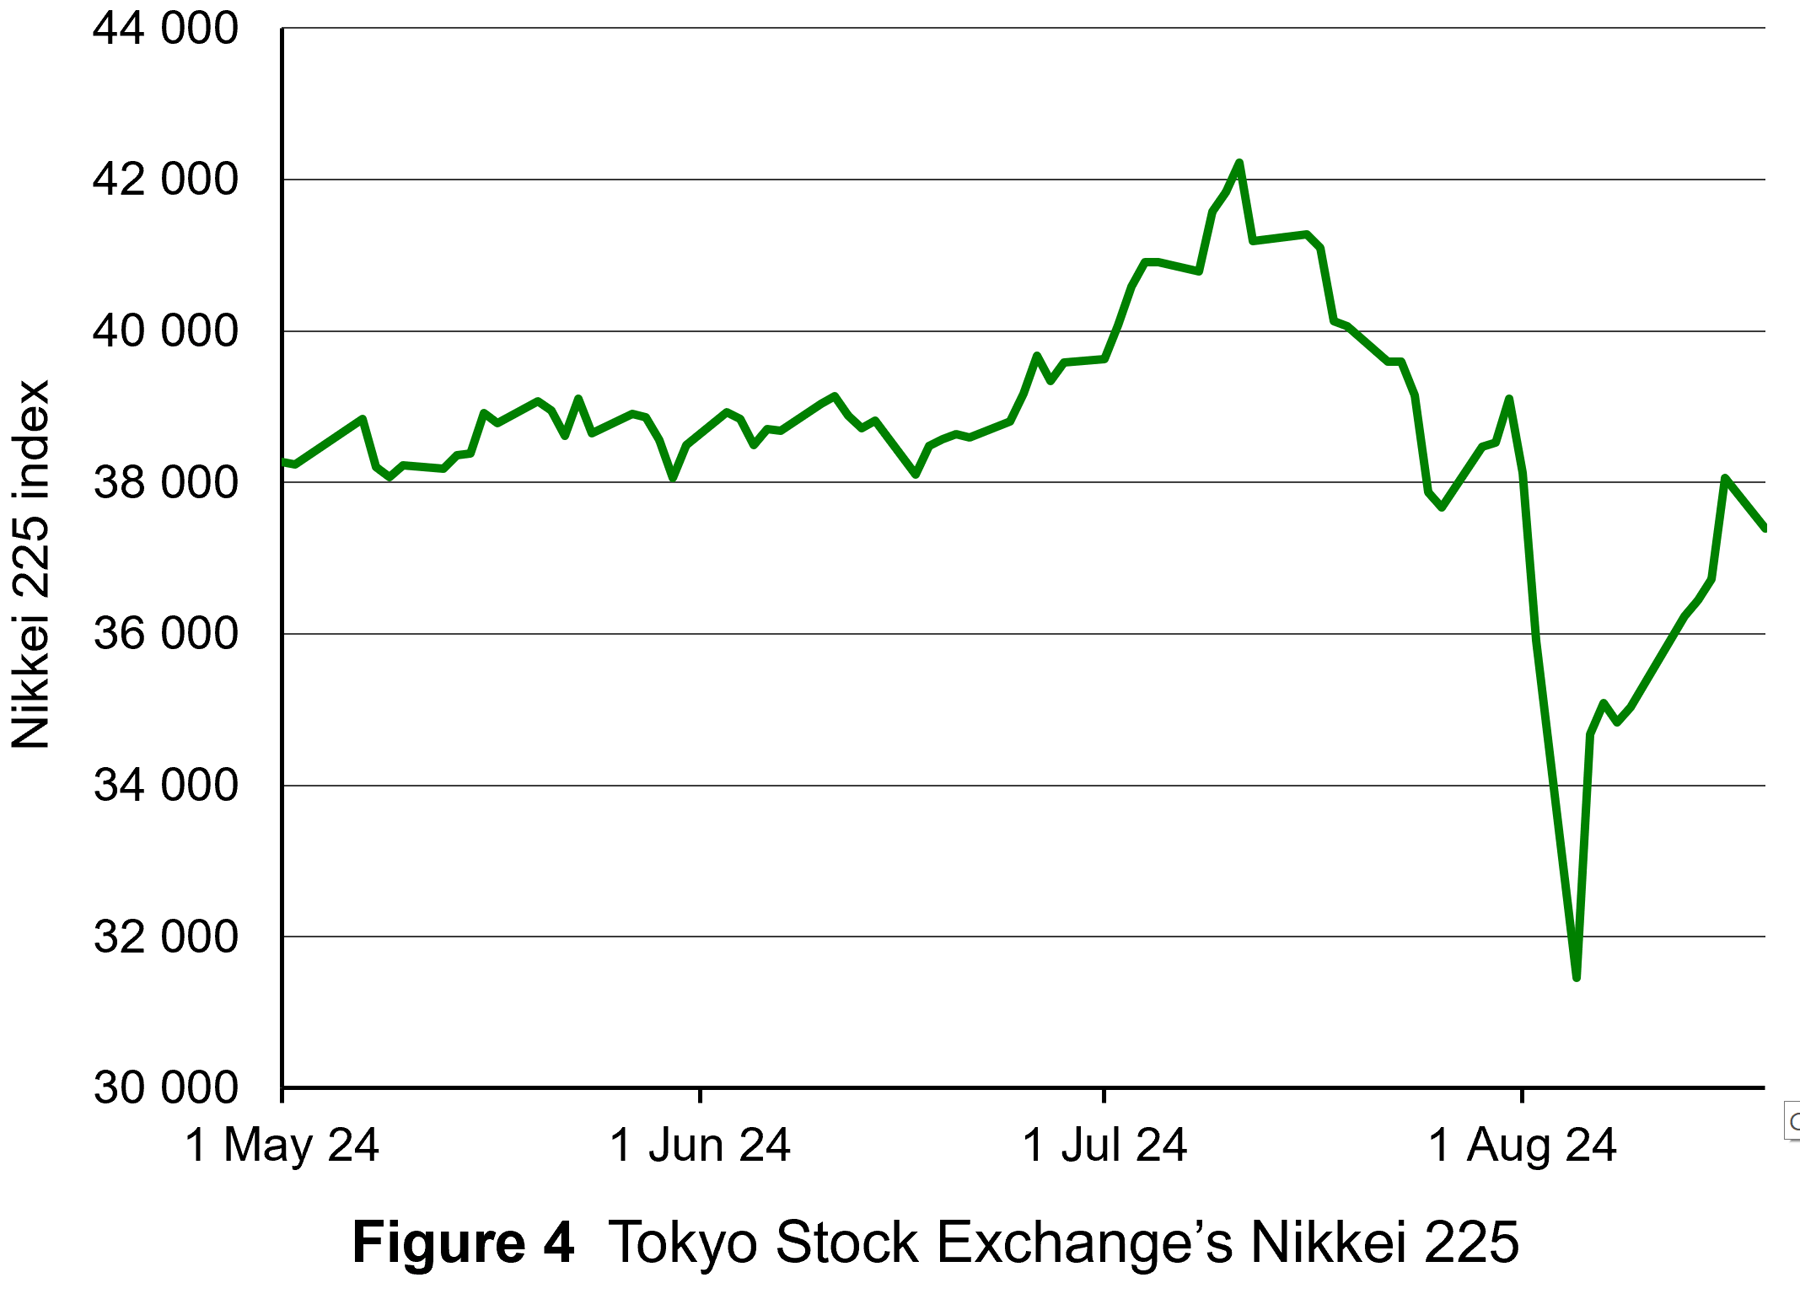 As far as the Tokyo stock market was concerned, the appreciation of the yen sparked fears that the large Japanese export sector would be damaged. Investors rushed to sell shares. Between 31 July and 5 August, the Nikkei 225 (the main Japanese stock market index) fell by 19.5% – its biggest short-term fall ever (see Figure 4: click here for a PowerPoint).
Although the yen has since depreciated slightly (a rise in the yen/dollar rate) and stock markets have recovered somewhat, expectations of many investors are that the unwinding of the yen carry trade has some way to go. This could result in a further appreciation of the yen from current levels of around ¥100 = $0.67 to around $0.86 in a couple of years’ time.
There are also fears about the carry trade in the Chinese currency, the yuan. Some $500 billion of foreign currency holdings have been acquired with yuan since 2022. As with the Japanese carry trade, this has been encouraged by low Chinese interest rates and a depreciating yuan. Not only are Chinese companies investing abroad, but foreign companies operating in China have been using their yuan earnings from their Chinese operations to invest abroad rather than in China. The Chinese carry trade, however, has been restricted by the limited convertibility of the yuan. If the Chinese carry trade begins to unwind when the Chinese economy begins to recover and interest rates begin to rise, the effect will probably be more limited than with the yen.
Articles
- A popular trading strategy just blew up in investors’ faces
CNN, Allison Morrow (7/8/24)
- The big ‘carry trade’ unwind is far from over, strategists warn
CNBC, Sam Meredith (13/8/24)
- Unwinding of yen ‘carry trade’ still threatens markets, say analysts
Financial Times, Leo Lewis and David Keohane (7/8/24)
- The yen carry trade sell-off marks a step change in the business cycle
Financial Times, John Plender (10/8/24)
- Forbes Money Markets Global Markets React To The Japanese Yen Carry Trade Unwind
Forbes, Frank Holmes (12/8/24)
- 7 unwinding carry trades that crashed the markets
Alt21 (26/1/23)
- A carry crash also kicked off the global financial crisis 17 years ago — here’s why it’s unlikely to get as bad this time
The Conversation, Charles Read (9/8/24)
- What is the Chinese yuan carry trade and how is it different from the yen’s?
Reuters, Winni Zhou and Summer Zhen (13/8/24)
- Carry Trade That Blew Up Markets Is Attracting Hedge Funds Again
Yahoo Finance/Bloomberg, David Finnerty and Ruth Carson (16/8/24)
- Currency Carry Trades 101
Investopedia, Kathy Lien (9/8/24)
- Carry Trades Torpedoed The Market. They’re Still Everywhere.
Finimize, Stéphane Renevier (13/8/24)
Questions
- What factors drive the currency carry trade?
- Is the carry trade a form of arbitrage?
- Find out and explain what has happened to the Japanese yen since this blog was written.
- Find out and explain some other examples of carry trades.
- Why are expectations so important in determining the extent and timing of the unwinding of carry trades?
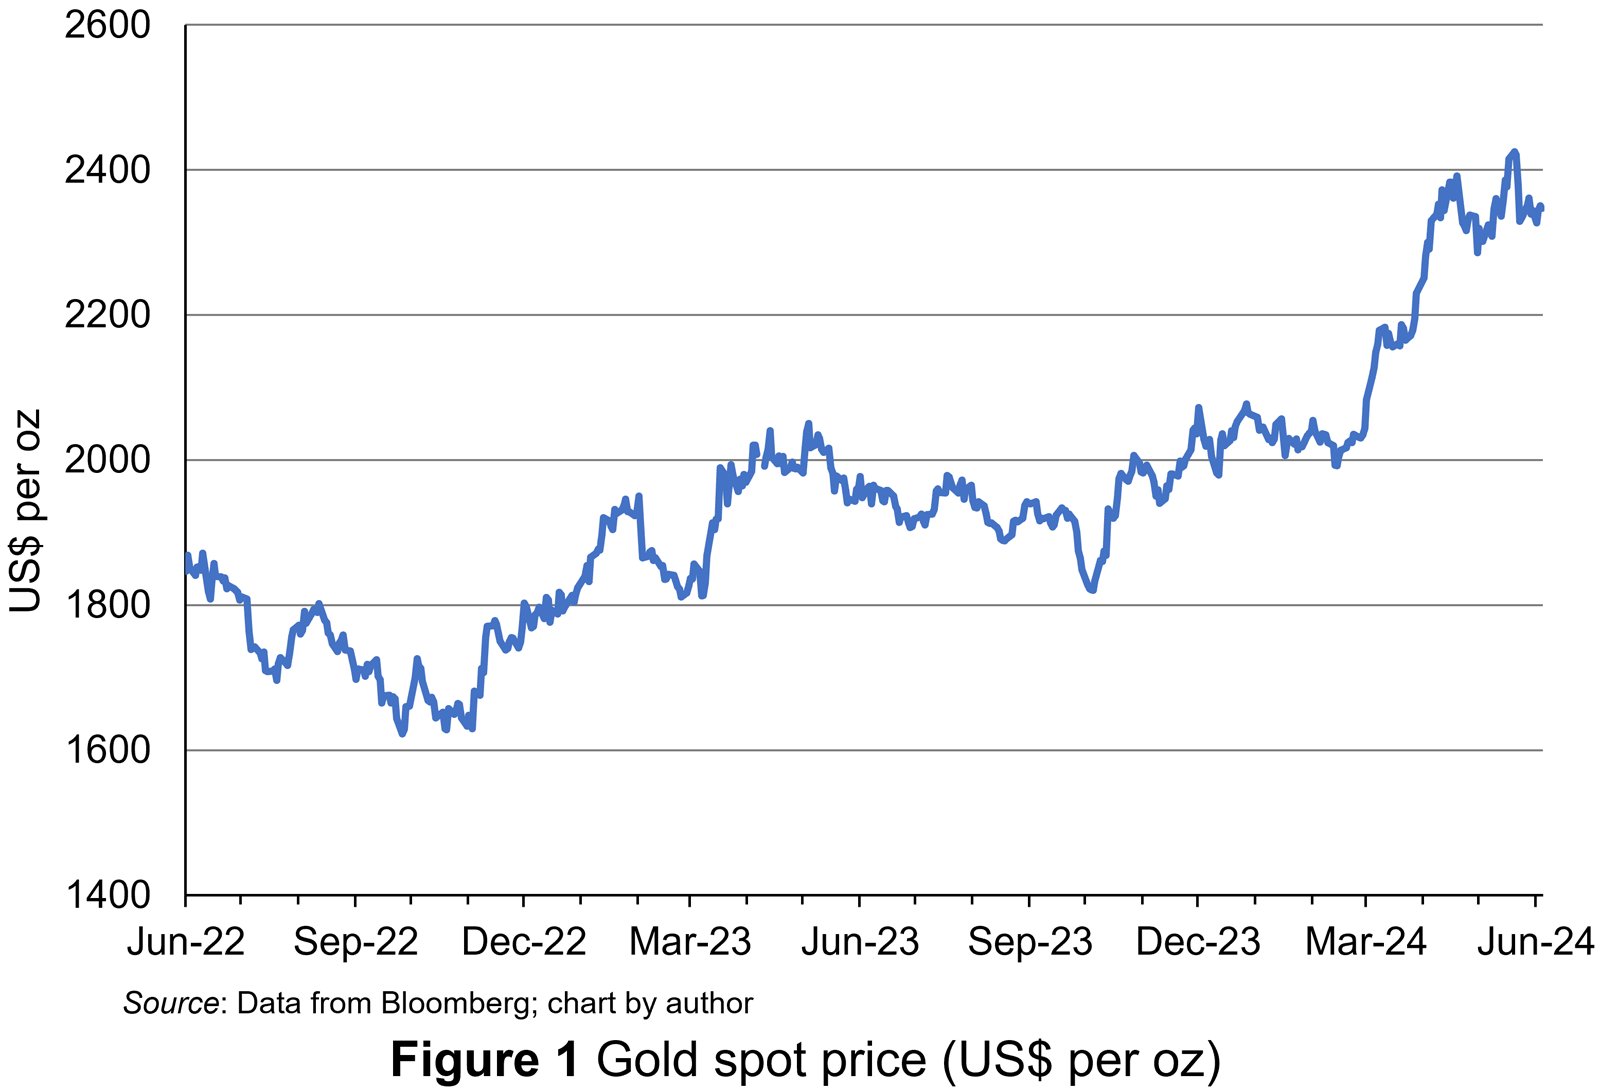 Gold has always held an allure and with the price of gold on international markets trending upwards since October 2022 (see Figure 1: click here for a PowerPoint), people seem to be attracted to it once again. The price reached successively higher peaks throughout 2023 before surging to above $2300 per oz in 2024 and peaking at $2425.31 per oz on 20 May 2024.
While gold tends to become attractive during wartime, economic uncertainty and bouts of inflation, all of which have characterised the last few years, the sustained price rise has perplexed market analysts and economists. The rally had been expected to peter out over the past 20 months. But, as the price of gold rose to sustained higher levels, with no significant reversals, some analysts have speculated that it is not the typical short-term factors which are driving the increased demand for and price of gold but more fundamental changes in the global economic system.
This blog will first discuss the typical short-term factors which influence gold prices before discussing the potential longer-term forces that may be at work.
Short-term factors
So, what are the typical short-term economic forces which drive the demand for gold?
The most significant are the real rates of interest on financial assets. These rates represent the opportunity cost of holding an asset such as gold which offers no income stream. When the real return from financial assets like debt and equity instruments is low, the demand for and price of gold tends to be high. In contrast, when the real return from such assets is high, the price of gold tends to be lower. An explanation for this is that real rates of return are strongly related to inflation rates and investors perceive gold as a hedge against inflation since its price is positively correlated with a general rise in prices. Higher unexpected inflation reduces the real rate of return of securities like debt and equity whose value is derived from cash flows anticipated in the future. In such circumstances, gold become an attractive alternative investment. As inflationary expectations decline, real returns from financial assets should rise, and the demand for gold should fall.
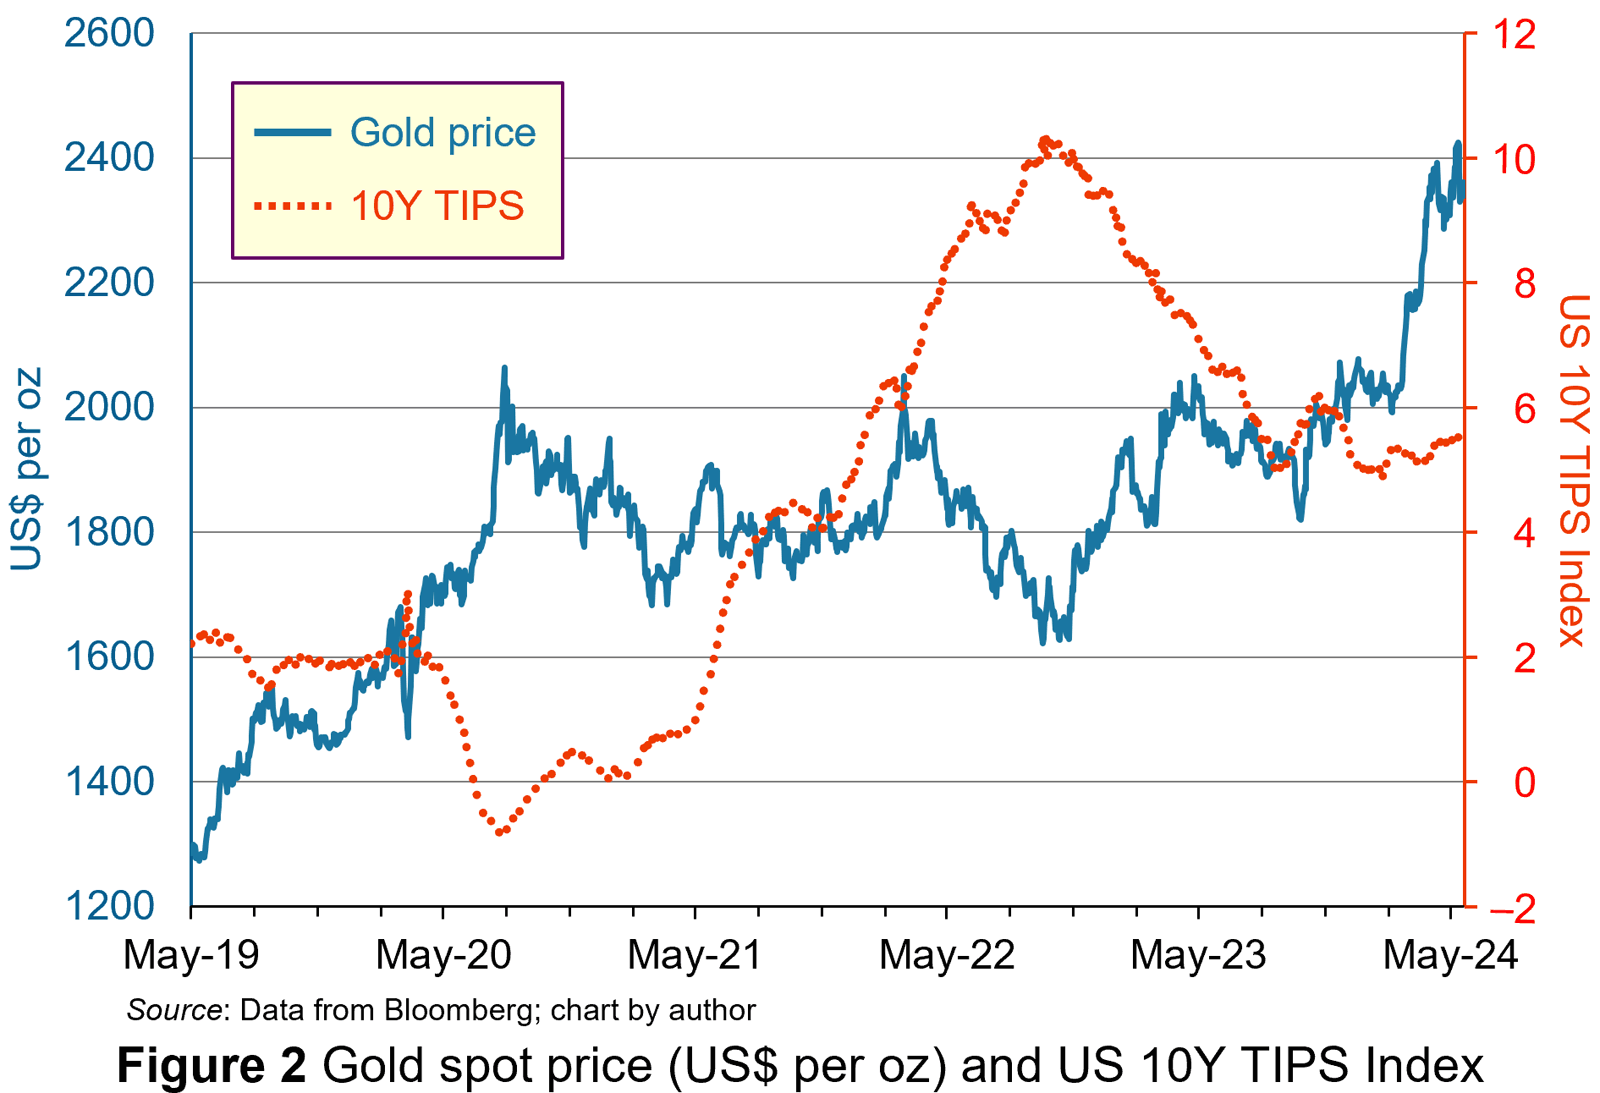 The relationship between real returns, proxied by the yield on US 10-year TIPS (Treasury inflation-protected securities), and gold prices can be used to examine this explanation. Real returns rose steadily in the aftermath of the COVID-19 pandemic. Yet the price of gold, which rose during the early stages of the pandemic in 2020, has not fallen. Instead, it has remained at elevated levels for much of that time (see Figure 2: click here for a PowerPoint).
There have been short periods when changes in real returns seemed to have a high correlation with changes in gold prices. In late 2022, for example, falling real rates coincided with rising gold prices. The same pattern was repeated between October and December 2023. However, when real returns rose again in the New Year of 2024, in response to stubbornly higher expected inflation and the expectation of ‘higher-for-longer’ interest rates, particularly in the USA, gold prices continued to rise. Indeed, across the 5-year period the correlation coefficient between the two series is actually positive at 0.268, showing little evidence supporting this explanation for the pattern for the gold price.
Real returns in the USA, however, may not be the correct ones to consider when seeking explanations for the pattern of gold’s price. Much of the recent demand is from China. Analysts suggest that Chinese investors are looking for a safe asset to hold as their economy stagnates and real returns from alternatives, like domestic property and equity, have decreased. Further, there are some concerns that the Chinese currency, the renminbi, may be undervalued in response to the sluggish growth. Holding gold is a good hedge against inflation (currency depreciation produces inflationary pressure). Consequently, the Chinese market may be exerting pricing power in relation to real returns in a way not seen before (see the Dempsey and Leng FT article linked below).
However, some analysts suggest that the rise in price is disproportionate to these short-term factors and point to potential long-term structural changes in the global financial order which may produce significant changes in the market for gold.
Long-term factors
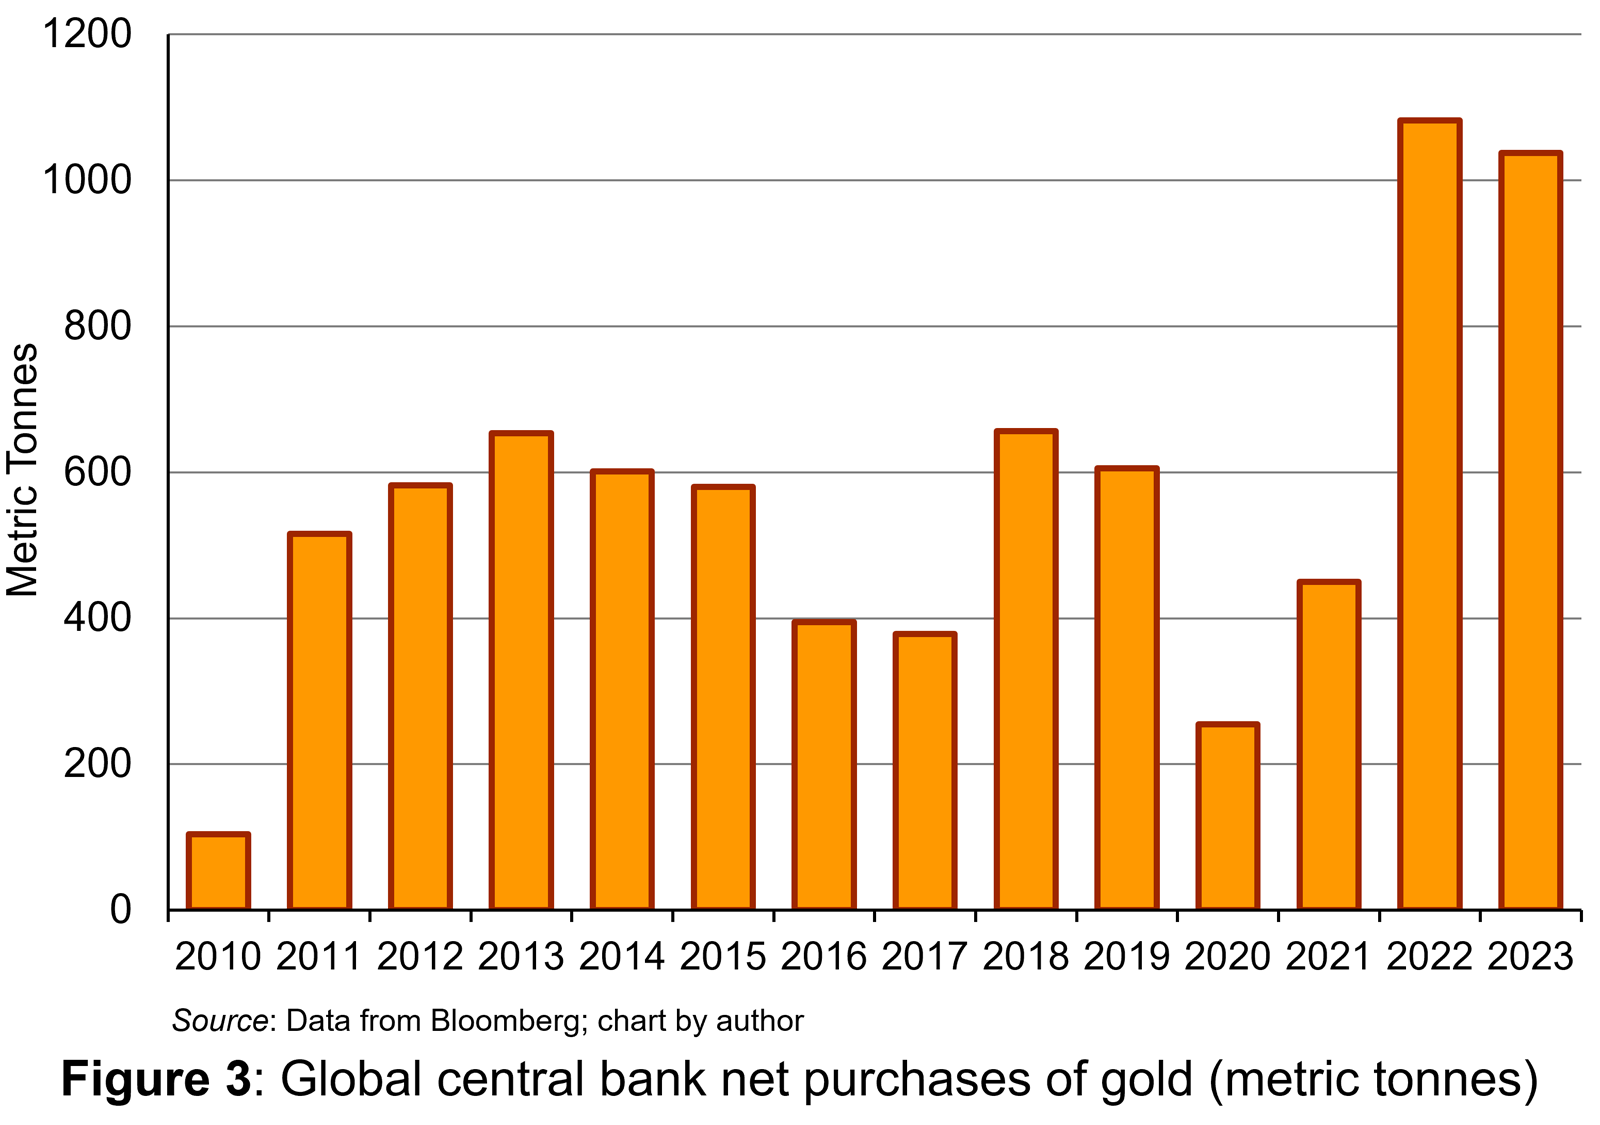 Since 2018, there have been bouts of gold purchasing by central banks around the world. In contrast to the 1990s and 2000s, central banks have been net purchasers since 2010. The purchasing fell back during the coronavirus pandemic but has surged again, with over 1000 metric tonnes purchased in both 2022 and 2023 (see Figure 3: click here for a PowerPoint).
Analysts have pointed to similarities between the recent pattern and central bank purchases of gold during the late 1960s and early 1970s (see The Conversation article linked below). Then, central banks sought to diversify themselves from dollar-denominated assets due to concerns about higher inflation in the USA and its impact on the value of the US dollar. Under the Bretton Woods fixed exchange rate system, central banks could redeem dollars for gold from the US Federal Reserve at a fixed rate. The pressure on the USA to redeem the gold led to the collapse of the Bretton Woods fixed exchange rate system.
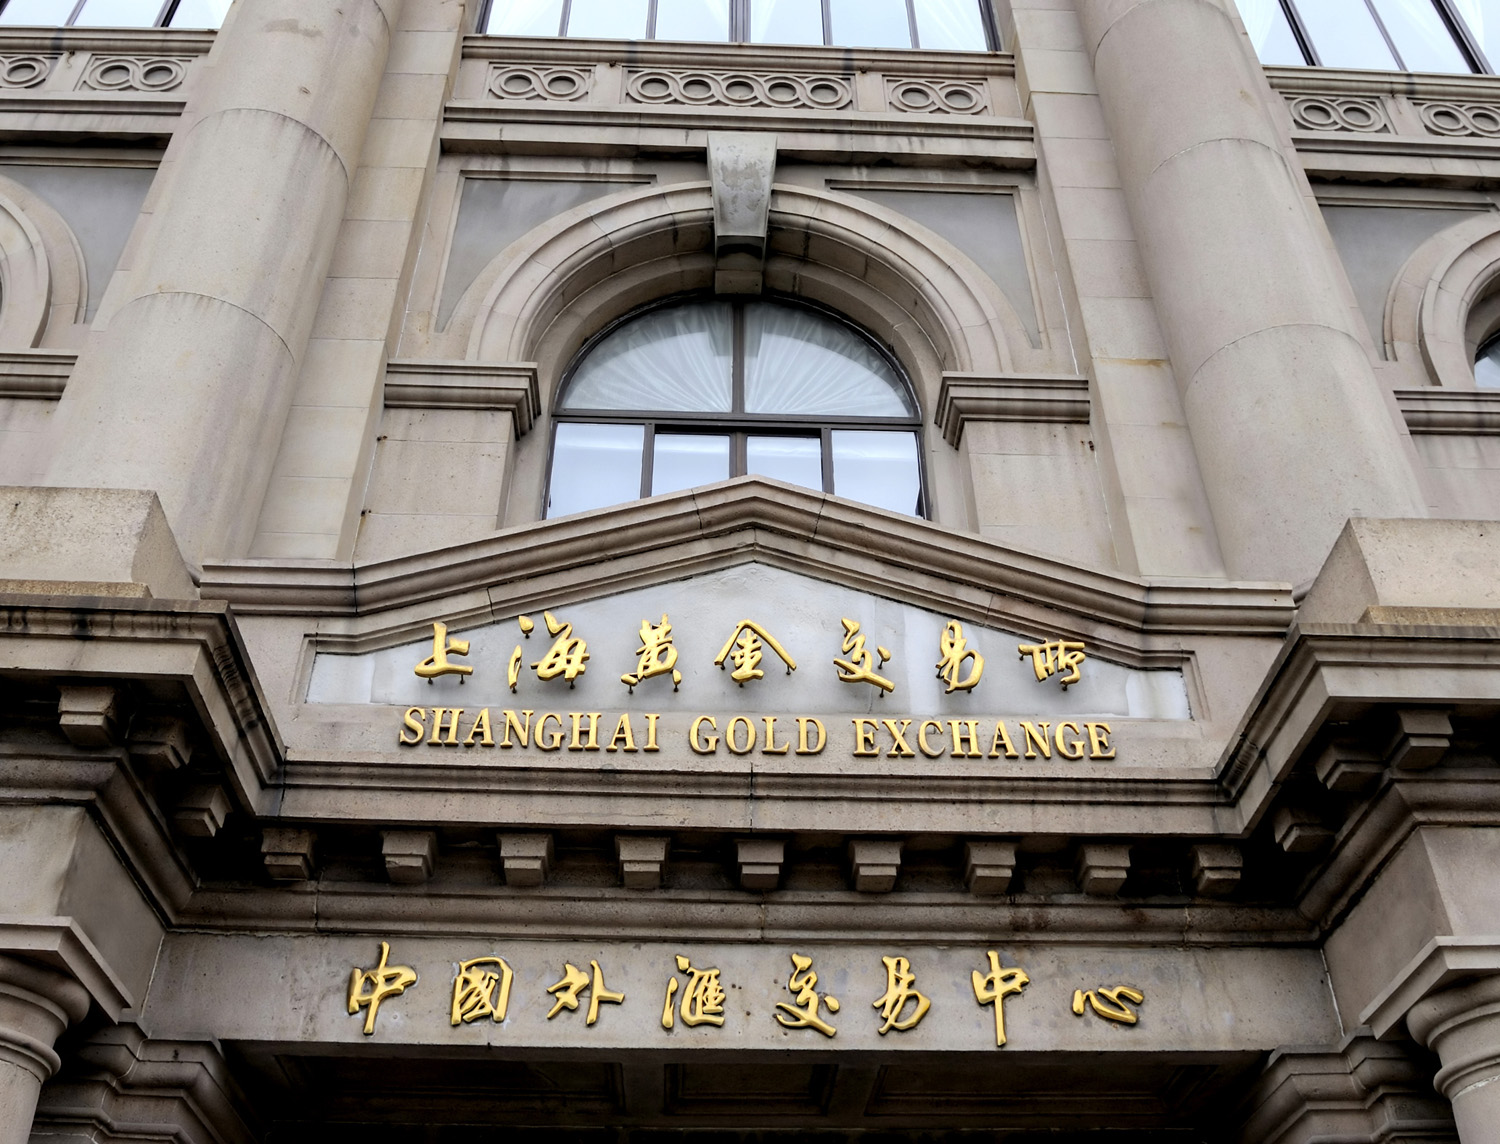 While the current period of central bank purchases does not appear to be related to expected inflation, some commentators suggest it could signal a regime change in the global financial system as significant as the collapse of Bretton Woods. The rise of Chinese political power and the resurgence of US isolationist tendencies portend an increasingly multipolar geopolitical scene. Such concerns may cause central bankers to diversify away from dollar denominated assets to avoid being caught out by geopolitical tensions. Gold may be perceived as an asset through which investors can hedge that risk better.
Indeed, the rise in demand among Chinese investors may indicate a reluctance to hold US assets due to their risk of seizure during heightened geopolitical tensions between China and the USA. Chinese holdings of US financial assets as a percentage of GDP are back to the level they were when the country joined the World Trade Organisation (WTO) in 2001 (see the Rana Foroohar FT article linked below). Allied to this is an increasing tendency to repatriate gold bullion from centres such as London and New York.
Added to these worries about geopolitical risk are concerns about traditional safe-haven assets – government debt securities. US government budget deficits and debt levels continue to rise. Similar patterns are observed across many developed market economies (DMEs). Analysts are concerned such debts are reaching unsustainable levels (economist.com). The view is that at some point, perhaps soon, a tipping point will be reached where investors recognise this. They will demand higher rates of return on these government debt securities, pushing yields up and prices down (bond yields and prices have a negative relationship).
In expectation of this, investors may be wary of holding such government debt securities and move to hold gold as an alternative safe-haven asset to avoid potential capital losses. However, there has been no sign of this behaviour in bond prices and yields yet.
 Finally, there are economists who argue that the increased demand for gold is caused by a different regime-change in the global economy. This is not one driven by geopolitics, but by changing inflationary expectations – from a low-inflation, low-interest-rate environment to a higher-inflation, higher-interest-rate environment.
Some of the anticipation relating to inflation is derived from the persistent fiscal stimulus, evidenced by the higher government debt levels described above, coupled with the long period of monetary stimulus (quantitative easing) in developed market economies during the 2010s.
Further, some economists highlight the substantial capital investment needed for the green transition and reindustrialisation. While the financing for this capital investment may absorb some of the excess money flowing around financial markets, the scale involved will create a great demand for resources, fuelling inflation and raising the cost of capital as borrowers compete for resources.
Finally, the demographic forces from an aging population will also cause inflationary pressures. Rising dependency ratios across many developed market economics will create shortages, particularly of labour. This persistent scarcity of labour will continually drive up wages and prices, fuelling inflation and the demand for gold.
Conclusion
The recent surge in the price of gold has led to great interest by investors, financial market analysts and economists. At first, there was a perception that the price increase was similar to recent history and driven by short-term decreases in the real rate of return from financial assets, which reduced the opportunity cost of holding gold.
However, as the upward trend in the price of gold has persisted and does not seem to be explained by changes in real interest rates, economists have considered other reasons that might signal longer-term significant changes in the global financial system. These relate to changing geopolitical risk derived from an increasingly multipolar environment, concerns about the sustainability of government debt levels and expectations of persistently higher inflation in the world economy.
Only time will tell whether these explanations prove correct. If inflationary pressures subside, particularly in the USA, and if real returns from financial assets rebound, a decrease in the demand for and price of gold will suggest that the previous rise was driven by short-term forces.
If prices don’t fall back, it will only fuel the debate that it is a sign of significant changes in the global financial order.
Articles
- Gold’s weird rally
Financial Times, Robert Armstrong & Ethan Wu (11/12/23)
- A debt crisis at the economy’s edge
Financial Times, Robert Armstrong (15/5/24)
- Good, not great, news on inflation
Financial Times, Robert Armstrong (16/5/24)
- Gold prices are ‘dramatically outperforming’: Macquarie
Investing.com, Senad Karaahmetovic (30/5/24)
- Gold is back — and it has a message for us
Financial Times, Rana Foroohar (15/4/24)
- Countries went on a gold-buying spree before coronavirus took hold – here’s why
The Conversation, Drew Woodhouse (21/5/20)
- Why Gold Keeps Hitting Record Highs
Investopedia, Colin Laidley (9/4/24)
- Why Is the Price of Gold Rising?
Forbes, Wayne Duggan (23/4/24)
- Why gold prices are hitting record highs
TRT World, Kazim Alam (3/4/24)
- Chinese speculators super-charge gold rally
Financial Times, Harry Dempsey and Cheng Leng (23/4/24)
- This gold rally is made in China
Financial Times, Opinion Lex (21/5/24)
Speech
Data
Questions
- Explain the relationship between real returns and inflation for financial securities like debt and equity.
- Why is gold perceived to be an effective hedge against inflation?
- Contrast the factors which influenced the demand for gold in the period which preceded the end of Bretton Woods with those influencing demand now?
- What has happened to the price of gold since this blog was published? Is there any evidence for the profound changes in the global economic order suggested or was it the short-term forces driving demand after all?