
Inflation has been rising around the world. The main reason has been the supply shock of rising oil, fertiliser and commodity prices caused by the Iran war and the disruption to global supply chains from conflicts in the Middle East and Russia (see the blog, Why have diesel prices risen more than petrol prices?). Central banks, including the US Federal Reserve Bank, the European Central Bank and the Bank of Japan, have responded to this cost-push inflationary shock by raising interest rates. The Bank of England is likely to raise Bank rate at its next meeting on 5 November 2026.
Similar supply shocks have been experienced in recent years (see the May 2026 blog, Supply shocks – long-term gain from the short-term pain?).
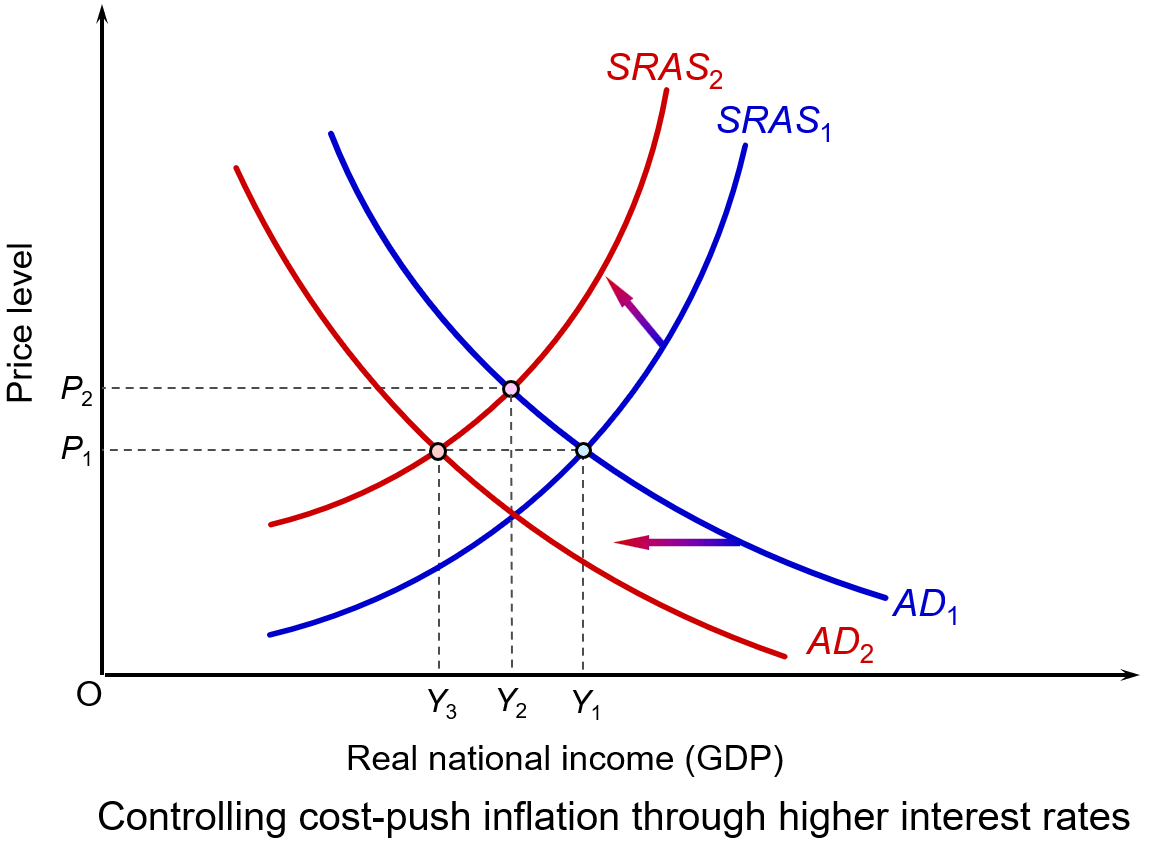 Raising interest rates reduces aggregate demand, or at least its rate of growth. This puts downward pressure on prices, or at least on the rate of inflation. This can be illustrated in the diagram. (Click here for a PowerPoint.)
It shows a country’s initial short-run aggregate supply curve (SRAS1) and initial aggregate demand curve (AD1). The price index is P1 and real GDP is Y1.
The higher costs shift the SRAS curve upwards to the left, say to SRAS2. The price index rises to P2 and real GDP falls to Y2. If, in response to the higher prices, the central bank raises the interest rate, this shifts the aggregate demand curve to the left, say to AD2. As a result, the price index falls back to P1, but the fall in demand causes real GDP to fall further, to Y3.
Policy alternatives
 So, is a rise in interest rates the appropriate response to higher costs that push inflation above, or further above, its target, which for most countries is 2%?
If the cause of inflation was excessive increases in aggregate demand from, say, large government budget deficits or a large increase in consumer demand, then a rise in interest rates would have helped reduce this unsustainable rise in demand. But if the cause of the inflation is a supply shock, is curbing aggregate demand the correct solution?
Ideally, the solution would be to tackle the cost increases directly. A rise in productivity, for example, would help to increase aggregate supply and counter the effect of rising commodity prices. But productivity increases take place over the longer term and are not a solution to a short-term supply shock. Better still, if the increase in commodity prices could be reversed, by finding a political solution that reopened the Strait of Hormuz and other choke points, then higher interest rates would not be needed.
Alternatively, some countries might be able to resort to price controls. These could be targeted at specific sectors such as energy, rent or construction. For example, the UK government has used energy price caps to limit household energy bills.
But even though this may control inflation in the short term, price controls create shortages because demand exceeds the reduced supply. This could lead to higher prices in unofficial markets as people sought to avoid the price controls. It could also create considerable problems for firms planning their logistics when supplies may simply not be available.
Alternatively, subsidies could be used to support output or prices in similar areas. Or they could be targeted at low-income households. These, however, could be costly for governments and may distort markets.
If price controls and subsidies are rejected, and in the absence of short-term increases in aggregate supply, the only solution to inflation is curbing aggregate demand to match the reduced aggregate supply. This could be achieved through fiscal policy by raising taxes or reducing government expenditure, but would prove unpopular and would probably be rejected by governments. Generally, they would prefer to pass the burden to central banks through the use of monetary policy.
The blunt instrument of monetary policy
But, raising interest rates is, indeed, a blunt instrument. Tighter monetary policy cannot increase the global supply of fuel, fix broken supply chains or lower insurance and construction costs. In other words, it cannot directly fix supply shocks, only limit their effect on prices.
 Also, by making borrowing more expensive, higher interest rates may suppress business investment and house building. This adverse supply-side effect may worsen inflation over the longer term.
The hope is that such effects will be avoided by suppressing inflation and helping thereby to maintain business confidence. It is a delicate balancing act for central bankers, who want to constrain inflation but do not want to plunge their economies into recession and damage longer-term increases in potential real GDP.
Most of all, the hope is that by suppressing nominal demand, second-round effects will be avoided. These are where higher prices encourage workers to demand higher wages to compensate for higher prices and businesses to raise prices to cover those wage increases, knowing that they can pass these price increases on to consumers as their competitors are doing the same. This risks creating a damaging wage-price spiral and embedding inflation. By raising interest rates and signalling that they will bring inflation back down to the target rate, central banks hope to anchor long-term inflation expectations. They hope that this will ensure that temporary price shocks do not become permanently embedded in the economy.
Distributional consequences
 However, the burden of higher interest rates will not be shouldered equally. They predominantly penalise a minority of the population, especially younger households with consumer debt and/or large variable-rate mortgages relative to their income or fixed rate mortgages coming the end of their term and requiring renewing. They also penalise businesses which rely on short-term debt.
Meanwhile, people who own their homes outright or wealthy savers may be largely unaffected or even benefit from higher yields on their savings deposits. Similarly, firms with low debt may hardly be affected.
Consequences for servicing public debt
Higher interest rates increase governments’ debt-servicing costs. More has to be paid on new borrowing, either to finance budget deficits or to replace government bonds and bills that are maturing. This consumes a larger share of public spending and limits the fiscal room to support vulnerable households suffering from the price and interest increases.
We examined such costs in the US context in the blog US national debt reaches $40 trillion: but does it matter?.
Fingers crossed!
By being cautious about raising interest rates, central banks hope that geopolitical developments will be favourable and that the supply constraints will diminish. For example, the hope is that there will be a settlement between the USA and Iran that allows oil to flow once more through the Strait of Hormuz. That is why, despite inflation being well above target, central banks have been raising interest rates by just a quarter of a percentage point.
Articles
- US interest rates raised for first time in three years
BBC News, Michael Race (17/9/26)
- What the Fed interest rate hike likely means for borrowers and savers
NBC4 New York, Paul Wiseman (16/9/26)
- How increasing interest rates could reduce inflation, but potentially cause a recession
CNBC, Trina Paul (21/9/26)
- Interest rates held but Bank signals rise if energy prices stay high
BBC News, Dearbail Jordan and Kevin Peachey (17/9/26)
- Bank of England defies Fed’s rate-hike lead, leaving rates unchanged
CNBC, Chloe Taylor (17/9/26)
- ECB hikes rates to 2.5% as energy shock pushes eurozone inflation higher
Euronews, Quirino Mealha (10/9/26)
- Japan raises interest rates to 31-year high to curb impact of rising prices
The Guardian, Mark Sweney (18/9/26)
- What exactly is inflation, and are interest rates the only option for dealing with it?
The Conversation, Luke Hartigan (10/2/26)
- US consumers and businesses are now facing a future of more expensive borrowing
The Conversation, John W Diamond (16/9/26)
- Inflation: raising interest rates was never the right medicine – here’s why central bankers did it anyway
The Conversation, Robert Gausden (20/10/23)
- There are three main reasons inflation is rising. Higher rates won’t fix them
ABC (Australia), Michael Janda (15/9/26)
- Higher interest rates are meant to lower inflation. US economist John Cochrane says there’s only ‘shaky’ evidence it works
ABC (Australia), Michael Janda and Alicia Barry(15/3/24)
- How Governments Fight Inflation with Monetary Policies
Investopedia, Leslie Kramer (11/3/26)
- Interest rates are not the tool to solve the inflation caused by the US’s war with Iran
The Guardian, Josh Ryan-Collins (18/3/26)
- Are higher interest rates the only tool for managing inflation?
Rethinking Economics, Tim Thornton (3/8/23)
Videos
Information
Questions
- What policies have central banks pursued during the Iran war?
- Paint an optimistic scenario for the global economy five years hence.
- Paint a pessimistic scenario for the global economy five years hence.
- Compare the reasons given by the Federal Reserve and ECB for raising interest rates with those given by the Bank of England for not raising them.
- Donald Trump argues for cutting interest rates as a stimulus to the US economy. Provide a critique of this policy.

Andy Burnham is set to become UK Prime Minister on 20 July if no-one else stands to replace Keir Starmer. In a speech on 29 June, he outlined his economic vision. Central to this is devolution, where a greater number of economic decisions would be taken locally rather than by central government. This approach has been dubbed ‘Manchesterism’, in reference to his time as Mayor of Greater Manchester from 2017 to earlier this year. Under his mayoralty, Greater Manchester (GM) achieved faster economic growth than other regions or cities in the UK. From 2017 to 2023, GM’s gross value added grew by an average of 6.6% per annum and the city of Manchester’s by 8.4% – the highest of any city in the UK. The UK average was 4.9% and London’s was 4.6%.
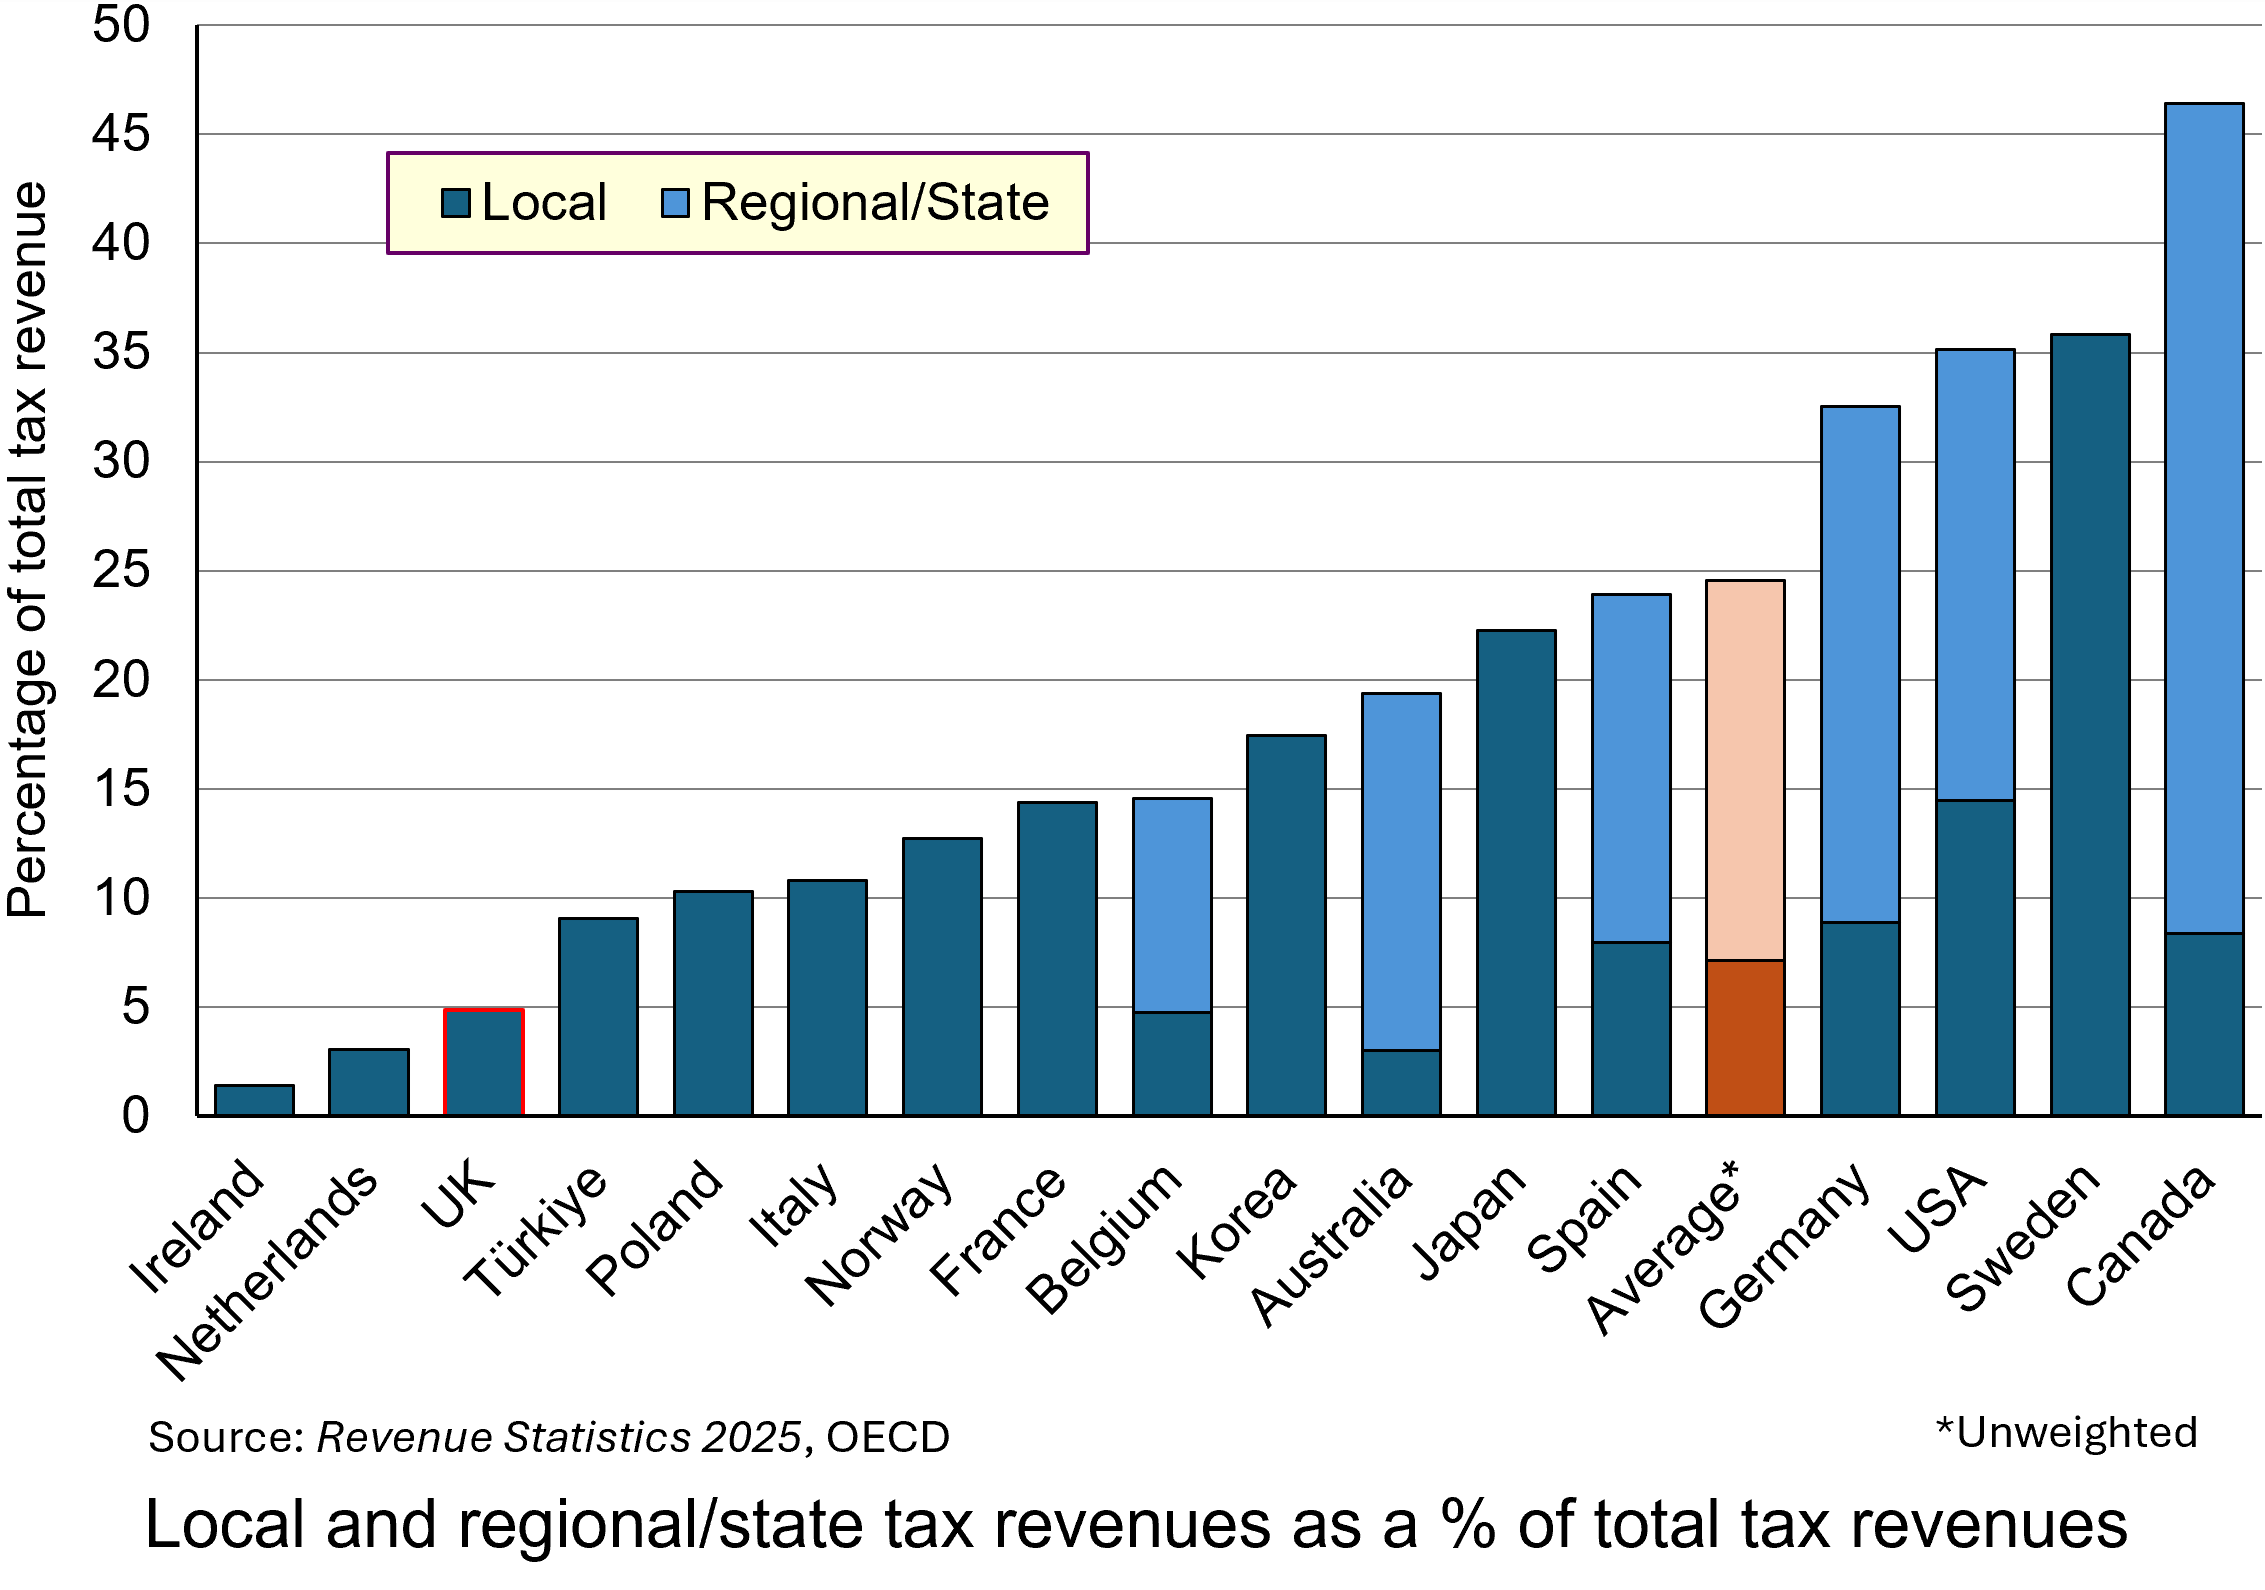 The UK, especially England, is one of the least devolved of the OECD countries. One aspect of this is taxation. The chart shows local taxes and, in the case of federal countries, state/regional/provincial taxes too. (Click here for a PowerPoint.)
Only 4.9% of UK tax revenue is in the form of local taxes (council tax and 50% of business rates) and the amount that can be raised in council tax is capped by the central government. The remainder of UK tax revenue goes to central government in the form of income taxes, social security taxes (national insurance), VAT, excise duties, etc. This compares with an average of 7.1% local taxes and 24.5% local plus regional taxes across the 17 OECD countries shown in the chart.
Andy Burnham plans to shift some of the spending and tax-raising powers from Whitehall to metro mayors and local councils. The aim is to stimulate productivity and economic growth at a regional and local level by tailoring support and incentives to local needs and strengths. Local leaders will be best positioned to understand these needs and strengths and will be able to customise spending and support appropriately.
 Examples of the types of greater autonomy over decision making would include:
- Control over adult education budgets to allow them to be tailored to provide training and apprenticeships to meet the skills requirements of existing and emerging industries in the area;
- Forming partnerships with local universities to support research and development that complements regional economic growth;
- Providing greater funding for and control over local transport infrastructure, including roads, buses, trams, trains, etc., with local consultation to make them fit for the local population and businesses;
- Tailoring business incentives to local needs and to the needs of the businesses themselves so as to attract an increase in investment;
- Greatly expanding council house building, which has virtually dried up in recent years, with mayors and/or local authorities empowered to develop local housing strategies, including affordable housing programmes, and to direct housing investment funding to particular housing developments in areas of greatest need.
Andy Burnham has pledged to stick to the government’s two existing fiscal rules:
a) The Stability Rule (Fiscal Mandate): the current (day-to-day) budget must be in balance or surplus. In other words the provision of salaries, public services, state pensions, welfare, etc. must be covered by government revenues (largely taxation). The government should borrow only to fund long-term investment.
b) The Debt Rule (Stock Mandate): each year, public-sector net financial liabilities (PSNFL) must be forecast by the OBR to be falling as a share of GDP compared to the previous year in three years’ time. This acts as a break on the amount of borrowing for long-term investment.
It is likely, therefore, that there will be little extra government money for investment. Rather, the policy involves a redistribution of public-sector investment from central government to mayoral/local authorities.
 In theory, such a policy of devolution need not see a redistribution from richer to poorer regions, but that might be part of the policy when the details are published. The UK has a bigger gap in productivity (GDP per worker) between its capital city and other large cities than in do other countries. Birmingham, Sheffield, Leeds, Newcastle, etc., as well as Cardiff, Glasgow, Edinburgh and Belfast, lag further behind London in output per head and economic growth than do other European countries lag behind their capital city. Thus the gap between Paris and Lyon, Toulouse and Marseille is narrower; as is that between Belin and Munich, Hamburg and Frankfurt. It is a similar picture in Spain and Italy. In the USA, some cities, such as San Francisco, outperform Washington DC and New York. A redistribution of government funding from London to the regions could see their incomes rise faster without having too much impact on London, which would still continue to attract large amounts of private investment.
Overall, there would be little increase in government funding. ‘Manchesterism’ is not, therefore, a demand-side policy. It is a supply-side policy – directing funds to areas where, combined with local incentives and local knowledge, the funding could yield greater returns and thereby increase potential GDP.
But this is not to say that there is no effect on aggregate demand. The hope is that devolution along the lines outlined by Andy Burnham will attract increased private investment, thereby increasing actual GDP as well as further increasing potential GDP.
We wait to see the details over the coming weeks.
Articles
- Will Andy Burnham’s devolution plan raise economic growth?
BBC Verify, Ben Chu (29/6/26)
- Burnham’s ‘Manchesterism’ could change the UK, but is not yet a full economic plan
BBC News, Faisal Islam (29/6/26)
- Burnham’s ‘Manchesterism’ got him to No 10 – but will it work for the UK?
BBC News, Faisal Islam (17/7/26)
- Burnham says there is some room for movement on tax
BBC News, Kate Wannel and Joshua Nevett (3/7/26)
- England’s mayors should be given sweeping new powers, says devolution expert
The Guardian, Kiran Stacey (2/7/26)
- What is Andy Burnham’s economic and political blueprint for Britain?
The Guardian, Richard Partington and Jessica Elgot (29/6/26)
- Why Andy Burnham’s radical plan relies on the Treasury being a friend of devolution
The Conversation, Dave Richards and Sam Warner (26/6/26)
- How Andy Burnham may try to give the UK economy a boost in his ‘10‑year plan’
The Conversation, Steve Schifferes (29/6/26)
- Could Andy Burnham let mayors raise more taxes?
House of Commons Research Briefing, Mark Sandford (2/7/26)
- Andy Burnham sets out policy plans in first major speech in PM leadership bid: Legal comments
Browne Jacobson, Dan Robinson (29/6/26)
- What does Andy Burnham think ‘Good Growth’ is?
Centre for Cities, Jess Tulasiewicz (30/6/26)
- Manchester’s digital transformation could be a blueprint for other parts of the UK
The Conversation, Richard Whittle (21/7/26)
Videos
Data
Questions
- Use an aggregate demand and supply diagram (simple or dynamic) to illustrate the effects on real GDP of a successful devolution strategy.
- Find out the details of the last Conservative government’s ‘levelling up’ policy. Was it similar in aims to that of ‘Manchesterism’?
- How could a policy of devolution as outlined by Andy Burnham affect income distribution within regions?
- Find out about the approach to regional policy in the EU. Is it similar to that being advocated by Andy Burnham?
- What is meant by ‘regional multipliers’? Why might they differ from the national multiplier?
 The world has suffered from a number of adverse supply shocks in recent years. First there was the credit supply shock of 2007–9 that led to a default on mortgages, a collapse in confidence in the banking system, the drying up of the inter-bank market, the freezing of lending and a global economic contraction. Then there was the COVID-19 pandemic. This shock to the the global economy led to a a fall in output and breaks in supply chains. As recovery took place, supply-side difficulties led to a surge in inflation.
Then there was the Russian invasion of Ukraine. This shock to energy and grain supplies led to rises in fuel and food prices: a cost-push inflationary shock. More recently, the closing of the Strait of Hormuz has cut off an important supply route and again sent fuel and other other prices rising.
These supply-side shocks create a dilemma for central banks. They push up inflation, but push output and employment down – a situation of ‘stagflation’.
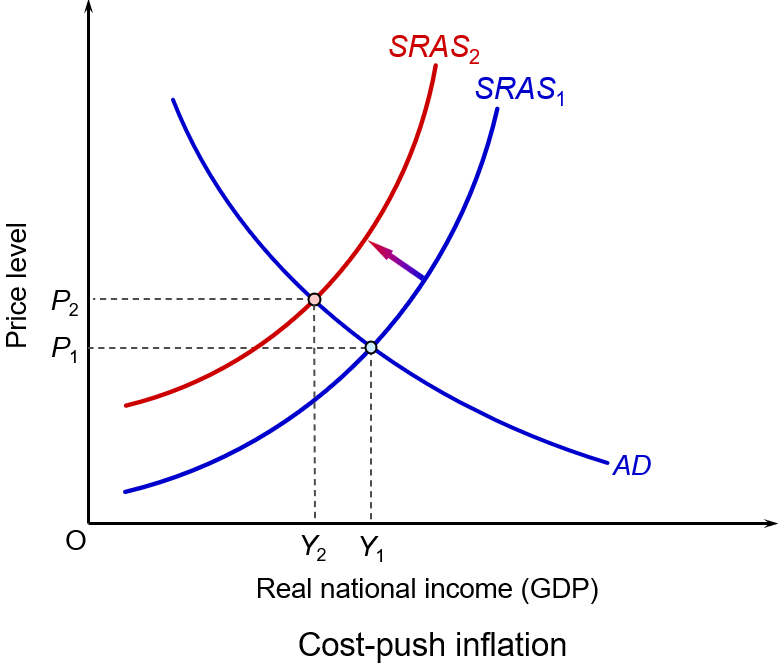 This can be illustrated with a simple aggregate demand and supply diagram. The shock shifts the aggregate supply curve upwards to the left, illustrated by the move from SRAS1 to SRAS2. The price level rises to P2 and GDP falls to Y2.
But central bank policy is designed to affect aggregate demand, not aggregate supply. If it raises interest rates, aggregate demand will shift to the left. The price level will fall (or at least the rate of inflation will fall), but output will fall further. If it cuts interest rates, aggregate demand will shift to the right. This will help to curtail, or even reverse, the fall in GDP, but will lead to even higher prices.
For countries where their central bank has a simple inflation mandate (e.g. keeping inflation close to 2%), sticking to this target in the short term would result in higher interest rates, lower economic growth and higher unemployment – and possibly even a recession. In such cases, central banks tend to project forward beyond the short-term shock and set interest rates to target inflation in a few months’ time. Indeed, many central banks do explicitly target inflation in the medium term (1 or 2 years) rather than the short term.
 Central banks, such as the US Federal Reserve Bank, which have a dual mandate of targeting inflation but also maximising employment, the trade-off between these two objectives can be stark. Getting the inflation down requires a higher rate of interest; maximising employment in the face of an adverse supply shock requires a lower rate of interest.
The short-term economic costs, let alone the human costs if the shock involves a war, can be great. People may suffer extreme hardship. The cost to the US Treasury of the first six weeks of the Iran war were estimated by the Pentagon to be some $29bn1 – which translates into higher taxes for US residents, lower government spending on non-war related items, higher government borrowing or some combination of the three. Other estimates put the cost to the US taxpayer as much higher – up to $1 trillion over the longer term.2 Then there are the costs to consumers of higher fuel and other prices, estimated at around $410 per month.3
The costs to Iranian citizens will be much higher in terms of war damage and loss of livelihood, let alone the suffering and loss of life. Then there are the costs to the rest of the world from higher prices of fuel, fertilisers and various industrial materials that are normally shipped through the Strait of Hormuz.
Long-term economic gain?
 Supply shocks often expose economic vulnerabilities that can later be addressed, making supply chains more diverse and more resilient. They can give a boost to alternative technologies, such as a switch from fossil-fuels to green energy.
After the 2007–9 financial crisis, banking systems were made more robust under the Basel III system. Capital and liquidity requirements were increased and bank leverage was decreased. Many countries, such as the UK, introduced ‘ringfencing’ to separate retail banking from the riskier investment banking. This increased confidence in the banking system.
The COVID-19 pandemic gave a boost to working remotely and the establishment of more flexible work patterns. What was a necessity during lockdowns, was seen as an effective model by many companies. Fully remote or hybrid working became commonplace for many jobs that were previously done in the office. Time has allowed employers to find the best balance of in-office and remote working, with the optimum balance often varying by type of job being performed.
The rising price of oil and gas following the Russian invasion of Ukraine in February 2022, saw many countries that had been reliant on imports from Russia, accelerating their efforts to switch to renewable energy. Supply chains were re-examined and there was a move towards ‘re-shoring’, ‘near-shoring’, or ‘friend-shoring’: that is, obtaining supplies from countries that are nearer and/or more reliable as trading partners.
 This approach was further boosted by the extensive tariffs imposed by the Trump second administration. One of the responses to the higher tariffs was to seek markets, both for exports and imports, away from the USA. To the extent that there is ‘re-shoring’ (substituting exports and imports for production and consumption within the country), then this amounts to deglobalisation. If this represents a move from low-cost to high-cost production and is contrary to the law of comparative advantage, then there will be a net economic loss. If, however, the reduction in risk of disruption and the boost to domestic industries allows a reduction in costs, there could be a net gain.
The most recent example of the Iran war has led many countries to reconsider sources of supply and to make their supply chains more robust and less risky. Gulf countries are considering expanding their pipeline network to avoid the Strait of Hormuz. For other countries, it is providing a further boost to green energy. Increased investment in the renewable sector will help to bring down costs and make countries less vulnerable to future conflicts involving oil-producing countries or sea passages.
To summarise: if initially adverse supply-side shocks cause a diversification and strengthening of supply chains, a diversification of energy sources, accelerated technological innovation and the adoption of new more efficient techniques, the long-term supply-side effects could be positive. Pain today for gain tomorrow?
But the short run comes before the long run and today’s costs are real and mounting. A shock may stimulate a positive response, but the current shock is persisting, and forecasts are getting more dire by the day. And even when the Iran war is over, there may be more shocks around the corner – ‘unknown unknowns’. As Keynes said: ‘In the long run we’re all dead’.
References
- Pentagon’s estimate for Iran war grows to $29B
Politico, Mark Sweney (12/5/26)
- World Politics The Iran war could cost the American taxpayer $1 trillion, says Harvard academic
CNBC, Joseph Wilkins (14/4/26)
- The Economic Costs of the Iran War
American Enterprise Institute, Roger Pielke Jr. (2/4/26)
Articles
Questions
- What policies have central banks pursued during the Iran war?
- Paint an optimistic scenario for the global economy five years hence.
- Paint a pessimistic scenario for the global economy five years hence.
- Compare the sources of supply of oil and gas for Europe directly prior to the Iran war with those directly prior to the Russian invasion of Ukraine.
- Compare the relative merits of globalisation and deglobalisation. Does this depend on the nature of globalisation and deglobalisation?
 Global long-term economic growth has slowed dramatically since the financial crisis of 2007–8. This can be illustrated by comparing the two 20-year periods 1988 to 2007 and 2009 to 2028 (where IMF forecasts are used for 2024 to 2028: see WEO Database under the Data link below). Over the two periods, average annual world growth fell from 3.8% to 3.1%. In advanced countries it fell from 2.9% to 1.6% and in developing countries from 4.8% to 4.3%. In the UK it fell from 2.4% to 1.2%, in the USA from 3.1% to 1.8% and in Japan from 1.9% to 0.5%.
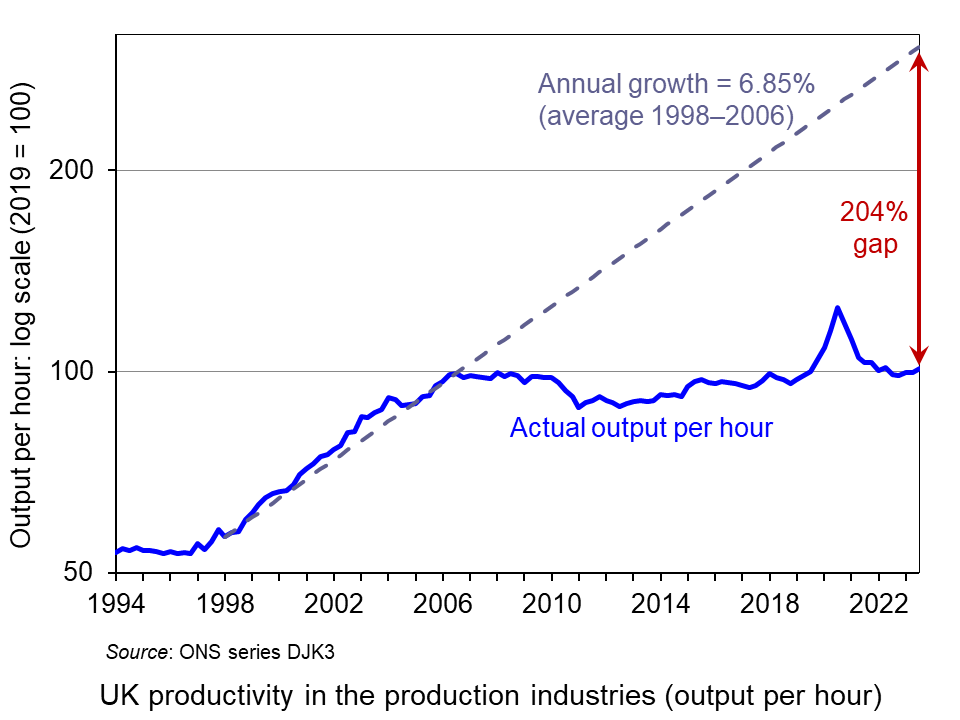 In the UK, labour productivity growth in the production industries was 6.85% per annum from 1998 to 2006. If this growth rate had been maintained, productivity would have been 204% higher by the end of 2023 than it actually was. This is shown in the chart (click here for a PowerPoint).
The key driver of long-term economic growth is labour productivity, which can best be measured by real GDP per hour worked. This depends on three things: the amount of capital per worker, the productivity of this capital and the efficiency of workers themselves – the latter two giving total factor productivity (TFP). Productivity growth has slowed, and with it the long-term rate of economic growth.
If we are measuring growth in output per head of the population, as opposed to simple growth in output, then another important factor is the proportion of the population that works. With ageing populations, many countries are facing an increase in the proportion of people not working. In most countries, these demographic pressures are likely to increase.
 A major determinant of long-term economic growth and productivity is investment. Investment has been badly affected by crises, such as the financial crisis and COVID, and by geopolitical tensions, such as the war in Ukraine and tensions between the USA and China and potential trade wars. It has also been adversely affected by government attempts to deal with rising debt caused by interventions following the financial crisis and COVID. The fiscal squeeze and, more recently higher interest rates, have dampened short-term growth and discouraged investment, thereby dampening long-term growth.
Another factor adversely affecting productivity has been a lower growth of allocative efficiency. Competition in many industries has declined as the rate of new firms entering and exiting markets has slowed. The result has been an increase in concentration and a growth in supernormal profits.
In the UK’s case, growth prospects have also been damaged by Brexit. According to Bank of England and OBR estimates, Brexit has reduced productivity by around 4% (see the blog: The costs of Brexit: a clearer picture). For many companies in the UK, Brexit has hugely increased the administrative burdens of trading with the EU. It has also reduced investment and led to a slower growth in the capital stock.
The UK’s poor productivity growth over many yeas is examined in the blog The UK’s poor productivity record.
Boosting productivity
So, how could productivity be increased and what policies could help the process?
 Artificial intelligence. One important driver of productivity growth is technological advance. The rapid advance in AI and its adoption across much of industry is likely to have a dramatic effect on working practices and output. Estimates by the IMF suggest that some 40% of jobs globally and 60% in advanced countries could be affected – some replaced and others complemented and enhanced by AI. The opportunities for raising incomes are huge, but so too are the dangers of displacing workers and deepening inequality, as some higher-paid jobs are enhanced by AI, while many lower paid jobs are little affected and other jobs disappear.
AI is also likely to increase returns to capital. This may help to drive investment and further boost economic growth. However, the increased returns to capital are also likely to exacerbate inequality.
To guard against the growth of market power and its abuse, competition policies may need strengthening to ensure that the benefits of AI are widely spread and that new entrants are encouraged. Also training and retraining opportunities to allow workers to embrace AI and increase their mobility will need to be provided.
 Training. And it is not just training in the use of AI that is important. Training generally is a key ingredient in encouraging productivity growth. In the UK, there has been a decline in investment in adult education and training, with a 70% reduction since the early 2000s in the number of adults undertaking publicly-funded training, and with average spending on training by employers decreasing by 27% per trainee since 2011. The Institute for Fiscal Studies identifies five main policy levers to address this: “public funding of qualifications and skills programmes, loans to learners, training subsidies, taxation of training and the regulation of training” (see link in articles below).
Competition. Another factor likely to enhance productivity is competition, both internationally and within countries. Removing trade restrictions could boost productivity growth; erecting barriers to protect inefficient domestic industry would reduce it.
Investment. Policies to encourage investment are also key to productivity growth. Private-sector investment can be encouraged by tax incentives. For example, in the UK the Annual Investment Allowance allows businesses to claim 100% of the cost of plant and machinery up to £1m in the year it is incurred. However, for tax relief to produce significant effects on investment, companies need to believe that the policy will stay and not be changed as economic circumstances or governments change.
 Public-sector investment is also key. Good road and rail infrastructure and public transport are vital in encouraging private investment and labour mobility. And investment in health, education and training are a key part in encouraging the development of human capital. Many countries, the UK included, cut back on public-sector capital investment after the financial crisis and this has had a dampening effect on economic growth.
Regional policy. External economies of scale could be encouraged by setting up development areas in various regions. Particular industries could be attracted to specific areas, where local skilled workers, managerial expertise and shared infrastructure can benefit all the firms in the industry. These ‘agglomeration economies’ have been very limited in the UK compared with many other countries with much stronger regional economies.
Changing the aims and governance of firms. A change in corporate structure and governance could also help to drive investment and productivity. According to research by the think tank, Demos (see the B Lab UK article and the second report below), if legislation required companies to consider the social, economic and environmental impact of their business alongside profitability, this could have a dramatic effect on productivity. If businesses were required to be ‘purpose-led’, considering the interests of all their stakeholders, this supply-side reform could dramatically increase growth and well-being.
Such stakeholder-governed businesses currently outperform their peers with higher levels of investment, innovation, product development and output. They also have higher levels of staff engagement and satisfaction.
Articles
- World Must Prioritize Productivity Reforms to Revive Medium-Term Growth
IMF Blog, Nan Li and Diaa Noureldin (10/4/24)
- Why has productivity slowed down?
Oxford Martin School News, Ian Goldin, Pantelis Koutroumpis, François Lafond and Julian Winkler (18/3/24)
- How can the UK revive its ailing productivity?
Economics Observatory, Michelle Kilfoyle (14/3/24)
- With the UK creeping out of recession, here’s an economist’s brief guide to improving productivity
The Conversation, Nigel Driffield (13/3/24)
- UK economy nearly a third smaller thanks to ‘catastrophically bad’ productivity slowdown
City A.M., Chris Dorrell (12/3/24)
- Can AI help solve the UK’s public sector productivity puzzle?
City A.M., Chris Dorrell (11/3/24)
- AI Will Transform the Global Economy. Let’s Make Sure it Benefits Humanity
IMF Blog, Kristalina Georgieva (14/1/24)
- Productivity and Investment: Time to Manage the Project of Renewal
NIESR, Paul Fisher (12/3/24)
- Productivity trends using key national accounts indicators
Eurostat (15/3/24)
- New report says change to company law could add £149bn to the UK economy
B Lab UK (28/11/23)
- Investment in training and skills: Green Budget Chapter 9
Institute for Fiscal Studies, Imran Tahir (12/10/23)
Reports
Data
Questions
- Why has global productivity growth been lower since 2008 than before 2008?
- Why has the UK’s productivity growth been lower than many other advanced economies?
- How does the short-run macroeconomic environment affect long-term growth?
- Find out why Japan’s productivity growth has been so poor compared with other countries.
- What are likely to be the most effective means of increasing productivity growth?
- How may demand management policies affect the supply side of the economy?
- How may the adoption of an ESG framework by companies for setting objectives affect productivity growth?
 We have examined inflation in several blogs in recent months. With inflation at levels not seen for 40 years, this is hardly surprising. One question we’ve examined is whether the policy response has been correct. For example, in July, we asked whether the Bank of England had raised interest rates too much, too late. In judging policy, one useful distinction is between demand-pull inflation and cost-push inflation. Do they require the same policy response? Is raising interest rates to get inflation down to the target rate equally applicable to inflation caused by excessive demand and inflation caused by rising costs, where those rising costs are not caused by rising demand?
In terms of aggregate demand and supply, demand-pull inflation is shown by continuing rightward shifts in aggregate demand (AD); cost-push inflation is shown by continuing leftward/upward shifts in short-run aggregate supply (SRAS). This is illustrated in the following diagram, which shows a single shift in aggregate demand or short-run aggregate supply. For inflation to continue, rather than being a single rise in prices, the curves must continue to shift.
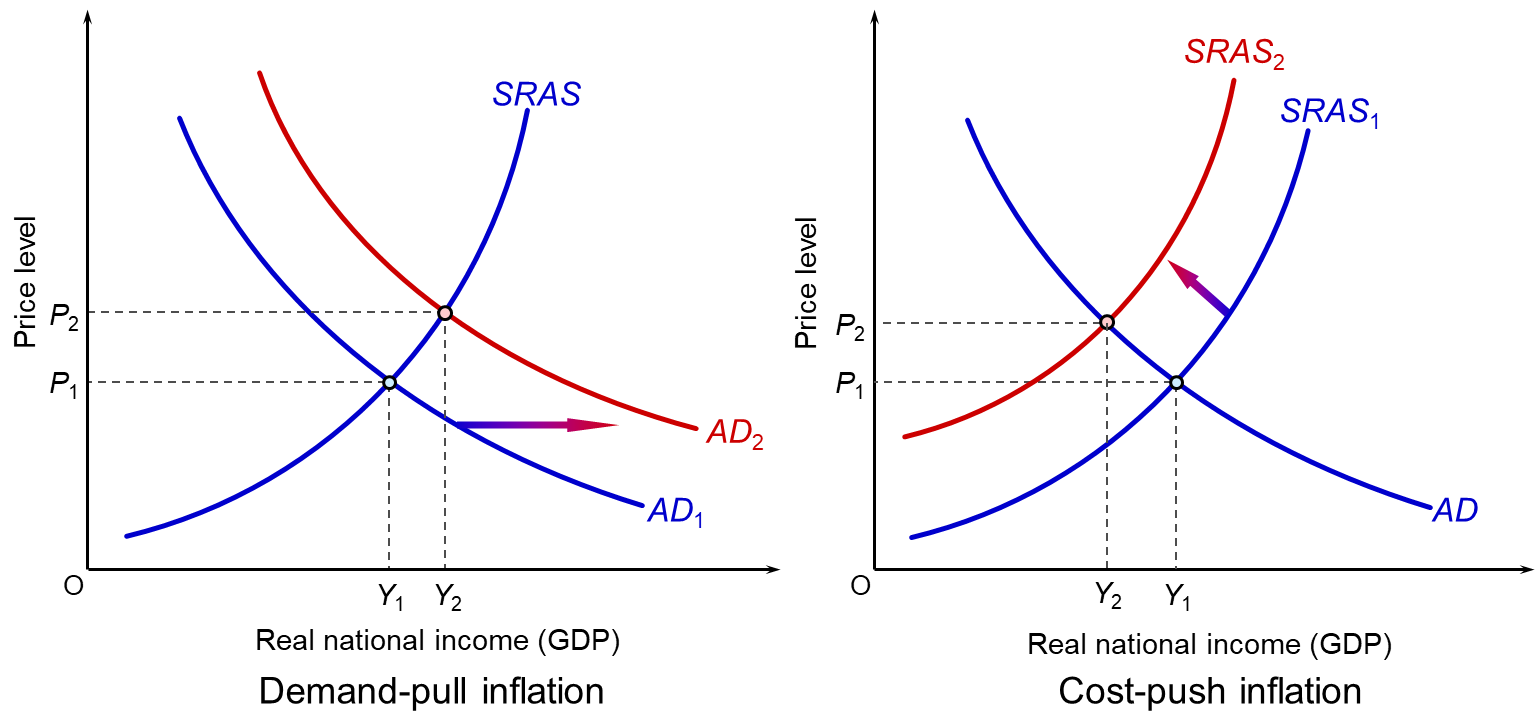
As you can see, the effects on real GDP (Y) are quite different. A rise in aggregate demand will tend to increase GDP (as long as capacity constraints allow). A rise in costs, and hence an upward shift in short-run aggregate supply, will lead to a fall in GDP as firms cut output in the face of rising costs and as consumers consume less as the cost of living rises.
The inflation experienced by the UK and other countries in recent months has been largely of the cost-push variety. Causes include: supply-chain bottlenecks as economies opened up after COVID-19; the war in Ukraine and its effects on oil and gas supplies and various grains; and avian flu and poor harvests from droughts and floods associated with global warming resulting in a fall in food supplies. These all led to a rise in prices. In the UK’s case, this was compounded by Brexit, which added to firms’ administrative costs and, according to the Bank of England, was estimated to cause a long-term fall in productivity of around 3 to 4 per cent.
The rise in costs had the effect of shifting short-run aggregate supply upwards to the left. As well as leading to a rise in prices and a cost-of-living squeeze, the rising costs dampened expenditure.
This was compounded by a tightening of fiscal policy as governments attempted to tackle public-sector deficits and debt, which had soared with the support measures during the pandemic. It was also compounded by rising interest rates as central banks attempted to bring inflation back to target.
Monetary policy response
 Central banks are generally charged with keeping inflation in the medium term at a target rate set by the government or the central bank itself. For most developed countries, this is 2% (see table in the blog, Should central bank targets be changed?). So is raising interest rates the correct policy response to cost-push inflation?
One argument is that monetary policy is inappropriate in the face of supply shocks. The supply shocks themselves have the effect of dampening demand. Raising interest rates will compound this effect, resulting in lower growth or even a recession. If the supply shocks are temporary, such as supply-chain disruptions caused by lockdowns during the pandemic, then it might be better to ride out the problem and not raise interest rates or raise them by only a small amount. Already cost pressures are easing in some areas as supplies have risen.
If, however, the fall in aggregate supply is more persistent, such as from climate-related declines in harvests or the Ukraine war dragging on, or new disruptions to supply associated with the Israel–Gaza war, or, in the UK’s case, with Brexit, then real aggregate demand may need to be reduced in order to match the lower aggregate supply. Or, at the very least, the growth in aggregate demand may need to be slowed to match the slower growth in aggregate supply.
Huw Pill, the Chief Economist at the Bank of England, in a podcast from the Columbia Law School (see links below), argued that people should recognise that the rise in costs has made them poorer. If they respond to the rising costs by seeking higher wages, or in the case of businesses, by putting up prices, this will simply stoke inflation. In these circumstances, raising interest rates to cool aggregate demand may reduce people’s ability to gain higher wages or put up prices.
Another argument for raising interest rates in the face of cost-push inflation is when those cost increases are felt more than in other countries. The USA has suffered less from cost pressures than the UK. On the other hand, its growth rate is higher, suggesting that its inflation, albeit lower than in the UK, is more of the demand-pull variety. Despite its inflation rate being lower than in the UK, the problem of excess demand has led the Fed to adopt an aggressive interest rate policy. Its target rate is 5.25% to 5.50%, while the Bank of England’s is 5.25%. In order to prevent short-term capital outflows and a resulting depreciation in the pound, further stoking inflation, the Bank of England has been under pressure to mirror interest rate rises in the USA, the eurozone and elsewhere.
Articles
Blogs on this site
Information and data
Questions
- How may monetary policy affect inflationary expectations?
- If cost-push inflation makes people generally poorer, what role does the government have in making the distribution of a cut in real income a fair one?
- In the context of cost-push inflation, how might the authorities prevent a wage–price spiral?
- With reference to the second article above, explain the ‘monetary policy conundrum’ faced by the Bank of Japan.
- If central banks have a single policy instrument, namely changes in interest rates, how may conflicts arise when there is more than one macroeconomic objective?
- Is Russia’s rise in inflation the result of cost or demand pressures, or a mixture of the two (see articles above)?
 US hikes interest rates as fears grow of global oil shock over Iran War