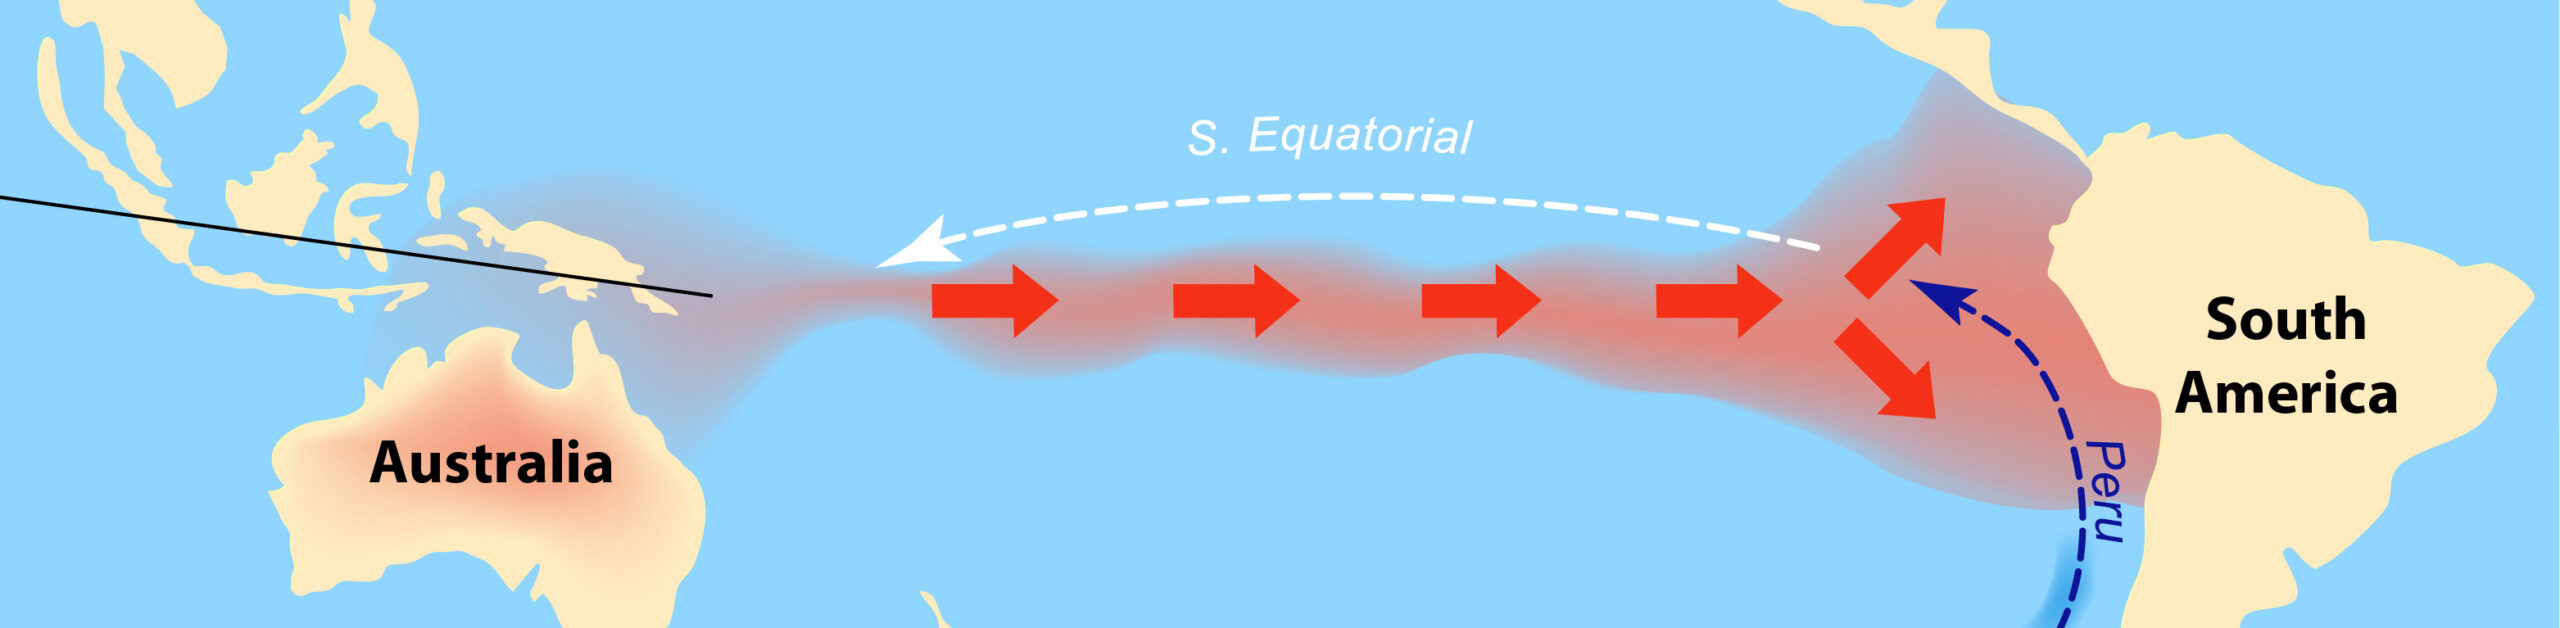
The World Meteorological Organization predicts that a ‘super El Niño’ is building. This has been nicknamed ‘Godzilla’. If forecasts are correct, this will be the most extreme El Niño in 1000 years.
El Niño is a natural phenomenon. It occurs when the surface temperatures in the central and eastern tropical Pacific Ocean warm and cause the trade winds that typically blow from east to west across the Pacific Ocean to weaken or even reverse direction. As well as increasing global temperatures and causing intense heatwaves, it can result in droughts in some parts of the world, such as eastern Australia, south-east Asia and southern Africa, and intense rain and flooding in parts of South America, eastern Africa and south-western North America.

Typically, in an El-Niño event, the surface temperature of the central-eastern equatorial Pacific Ocean rises by 1°C to 1.5°C above the average. In the current El Niño, it is forecast to rise by up to 4°C by the end of 2026 and into 2027. It is already between 2.2°C and 2.6°C above the average. The effects could be catastrophic and hence the term ‘Godzilla’.
Although El Niño is a natural phenomenon, its severity is a direct result of climate change. This in turn is a direct result of economic decisions, and the effects will have severe economic consequences.
The economic causes
Climate change is an external cost of private economic decisions. When people or organisations burn fossil fuels, the climate costs of the CO2 emissions are not borne by the emitter. They are an external cost. This is illustrated in the diagram below, which shows the costs and benefits of electricity production from fossil fuels. (Click here for a PowerPoint.)
In this example, to make things simple, we assume that the external climate costs begin with the first unit of electricity generated and increase at a constant rate. The marginal social cost (MSC) of electricity generation equals the marginal private costs (MPC) to the generating company plus the marginal external cost in production MECP.
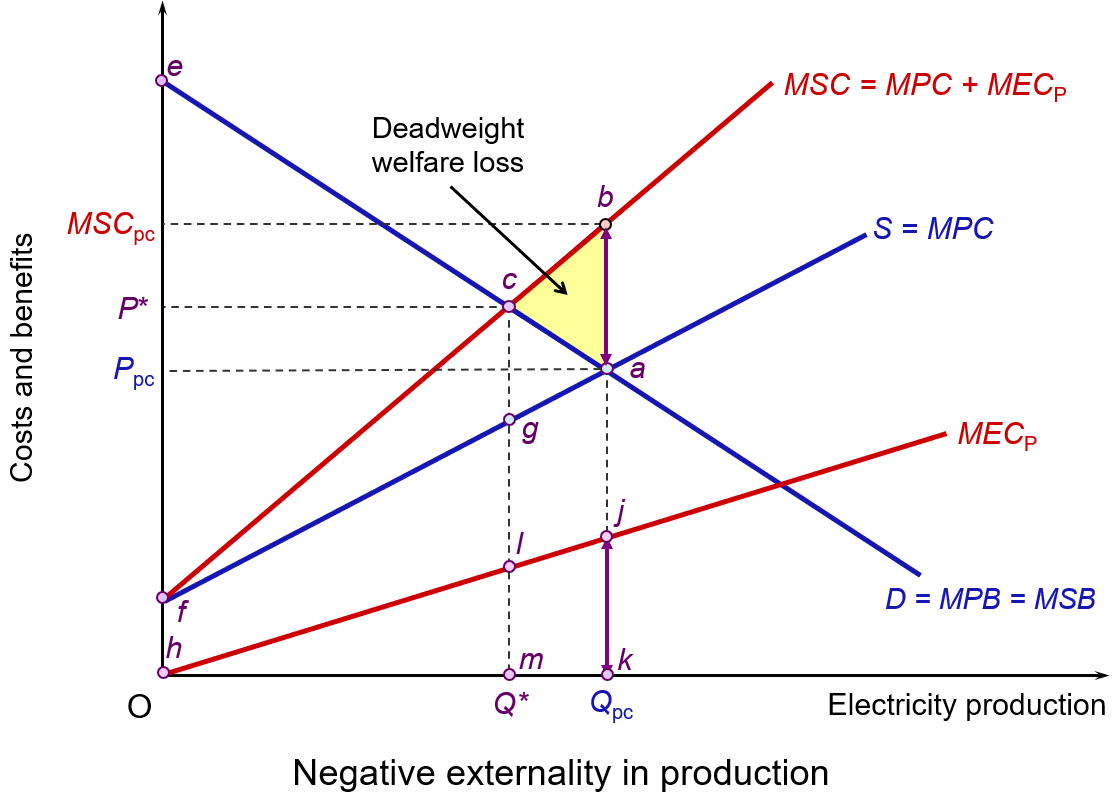 As you can see, the MSC curve is above the MPC curve. The vertical distance between them is equal to the MECP. It is also assumed that there are no externalities in consumption, which means that the marginal social benefit (MSB) curve is the same as the marginal private benefit (MPB) curve.
Competitive market forces, with producers and consumers responding only to private costs and benefits, will result in a market equilibrium at point a: i.e. where demand equals supply. The market equilibrium price is Ppc, while the market equilibrium quantity is Qpc. At Ppc, with no externalities on the consumption side, MPB is equal to MSB. The market price reflects both the private and social benefits from the last unit consumed. However, the presence of external costs in production means that MSC > MPC.
The socially optimal output would be Q*, where P = MSB = MSC, achieved at the socially optimal price of P*. This is illustrated at point c and clearly shows how external costs of production in a perfectly competitive market result in overproduction: i.e. Qpc > Q*. From society’s point of view, too much electricity is being produced from fossil fuels.
Total social surplus equals consumer surplus plus producer surplus minus the external costs. At the market equilibrium (Qpc) this is areas eaPpc+ Ppcaf – fba (or hjk, as it is the same size). At the socially optimal level of output (Q*) total social surplus is areas ecP* + P*cgf – fcg (or hlm).
Although consumer-plus-producer surplus is higher at the market equilibrium (Qpc) than at the socially optimum output (Q*) by the area cag, the external costs are higher still by the area cbag (or ljkm). Therefore, total social surplus at the market equilibrium is smaller than at the socially optimal point by area abc. This is a deadweight welfare loss and represents the excess of social costs over social benefits at all outputs above Q*. Put another way, moving from Qpc to Q* would represent a gain in social surplus of the area abc, as the fall in external costs outweighs the fall in consumer-plus-producer surplus.
One of the reasons why external environmental costs cause problems in a free-market economy is that no one has legal ownership of the atmosphere. Therefore, nobody has the ability either to prevent or to charge for their use as a ‘dumping ground’ for CO2. Such a ‘market’ is missing. Control must, therefore, be left to the government, international organisations, local authorities or regulators.
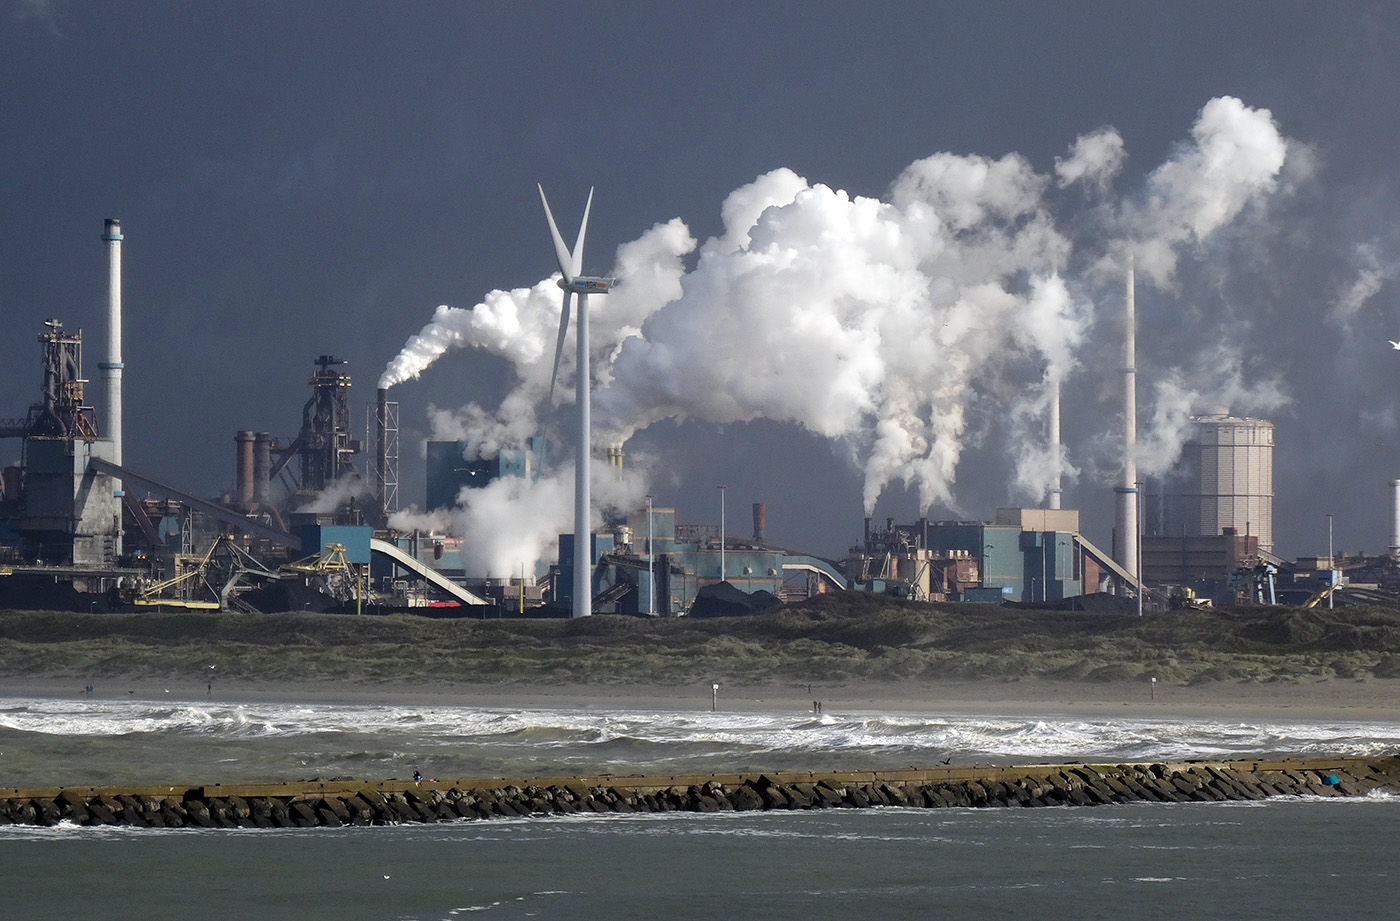 But such control is often too little. For example, when President Trump came to office in January 2025, he announced that the USA would withdraw from the UN’s Paris Agreement on climate change and that his policy towards oil production would be to ‘drill, baby, drill’. Indeed, governments globally spend hundreds of billions of dollars a year in subsidising oil, gas and coal production and its use, partly from pressure from the fossil fuel industry and partly to reduce the cost of living for consumers. This embeds fossil fuel dependence.
Game theory can help to explain the slow process of carbon reduction. For an individual country, such as the USA, it might argue that its optimum solution would be for other countries to cut their emissions, while maintaining its own levels. This approach would yield most of the benefits to the USA and none of the costs. However, when all countries argue like this, no progress is made. It’s a prisoners’ dilemma. Only if countries believe that the other countries will (a) ratify an agreement to cut emissions and (b) stick to the approved terms, is the agreement likely to succeed. This requires trust on all sides as well as the ability to monitor the outcomes.
Another major problem area concerns equity. Most countries will feel that they are being asked to do too much and that others are being asked to do too little. High-income countries will want to adopt a grandfathering approach. The starting point with this approach would be current levels of pollution. Every country would then be required to make the same percentage cut. Low-income countries, on the other hand, will want the bulk of the cuts, if not all of them, to be made by the rich countries. After all, the rich countries produce much higher levels of pollutants per capita than do the poor countries, and curbing growth in low-income countries would have a far more serious impact on levels of absolute poverty.
But will a supersized El Niño persuade countries to make deeper cuts in carbon emissions? In recent months commitments to achieving net zero emissions have waned. But the following economic consequences may encourage some countries to make deeper emissions cuts.
Economic consequences of a Godzilla El Niño

Extreme droughts, heat, wildfires and harvest failures in some areas and extreme rainfall and flooding in others will have severe economic consequences, often for the poorest people. There will be reductions in crop yields and loss of livelihood. Food prices will rise globally. This will add to the inflationary pressures from higher oil prices caused by the Iran war.
Droughts and wildfires in south-east Asia and Australia could have disastrous effects on harvests of palm oil, coffee, cocoa, rice, maize, wheat and various tropical fruits. Droughts and heat reduce output from hydropower and possibly wind energy, and industrial production may slow as a result of extreme heat in workplaces.
In Europe, warmer winters and unusually wet springs promote rapid plant growth. When this is followed by summer heatwaves, the undergrowth dries out and provides fuel for the wildfires. A super El Niño will amplify this. France and Spain have experienced massive wildfires these past few months. In the UK, the 2026 summer has been the hottest on record. The costs in Europe of the heat and wildfires in terms of lost crops and animals have been immense.
 Floods and storms damage roads, power grids, railways and buildings. This forces governments to spend money on repairs instead of long-term investments. People are displaced and many are likely to lose their lives.
Fortunately, El Niños fade after a few months to be replaced by the cooler La Niña. The problem is that, with global warming, the next El Niño in a few years could be even more extreme with even more serious economic consequences.
The hope is that governments wake up to the pressing need to reduce carbon emissions.
Videos and podcast
Information
Articles
- Building climate-resilient agriculture in Europe: an economic perspective
European Environment Agency (17/3/26)
- What Super El Niño Means For Business Supply Chains And The Economy
Forbes, Chloe Demrovsky (25/8/26)
- A summer of extremes: Weathering a hotter world
CBS News, Jonathan Vigliotti (16/8/26)
- Area in Europe affected by wildfires could triple due to climate change
The National (UAE), Tariq Tahir (20/8/26)
- El Niño could drag down the global economy by almost $1 trillion or at least $7 trillion—and the choice is ours
Peterson Institute for International Economics, Cullen S Hendrix (26/7/26)
- UN warns of ‘supersized’ El Niño as countries prepare for impact
BBC News, Esme Stallard, Mark Poynting, Becky Dale, Yvette Tan, Tiffanie Turnbull and Nikita Yadav (3/9/26)
- Toxic haze from wildfires spreads across South East Asia as ‘super’ El Niño intensifies
BBC News (2/9/26)
- A Super El Niño is coming: 5 hard‑won lessons the world can learn from Africa
The Conversation, Tafadzwanashe Mabhaudhi and Mendy Ndlovu (5/7/26)
- ‘Supersizing before our eyes’: UN warns of record El Niño approaching
The Guardian, Damian Carrington (3/9/26)
- ‘Super’ El Niño could cause global food price shock lasting into 2028, analysts say
The Guardian, Richard Partington (12/7/26)
- Without action wildfires in Europe will increase 39% even in best-case climate scenario, study finds
The Guardian, Ajit Niranjan (20/8/26)
- From classrooms to climate action: ICSE 2026 charts new path for sustainability
Economic Times (Times of India) (2/9/26)
Questions
- What is the current state of progress towards meeting the goals of the UN Paris Climate Agreement?
- Are there any externalities in consumption that affect global warming?
- How might technological progress make it privately profitable to reduce carbon emissions?
- How might global supply chains and shipping be affected by a super El Niño?
- What role can education play in tackling climate change and its effects?

Andy Burnham is set to become UK Prime Minister on 20 July if no-one else stands to replace Keir Starmer. In a speech on 29 June, he outlined his economic vision. Central to this is devolution, where a greater number of economic decisions would be taken locally rather than by central government. This approach has been dubbed ‘Manchesterism’, in reference to his time as Mayor of Greater Manchester from 2017 to earlier this year. Under his mayoralty, Greater Manchester (GM) achieved faster economic growth than other regions or cities in the UK. From 2017 to 2023, GM’s gross value added grew by an average of 6.6% per annum and the city of Manchester’s by 8.4% – the highest of any city in the UK. The UK average was 4.9% and London’s was 4.6%.
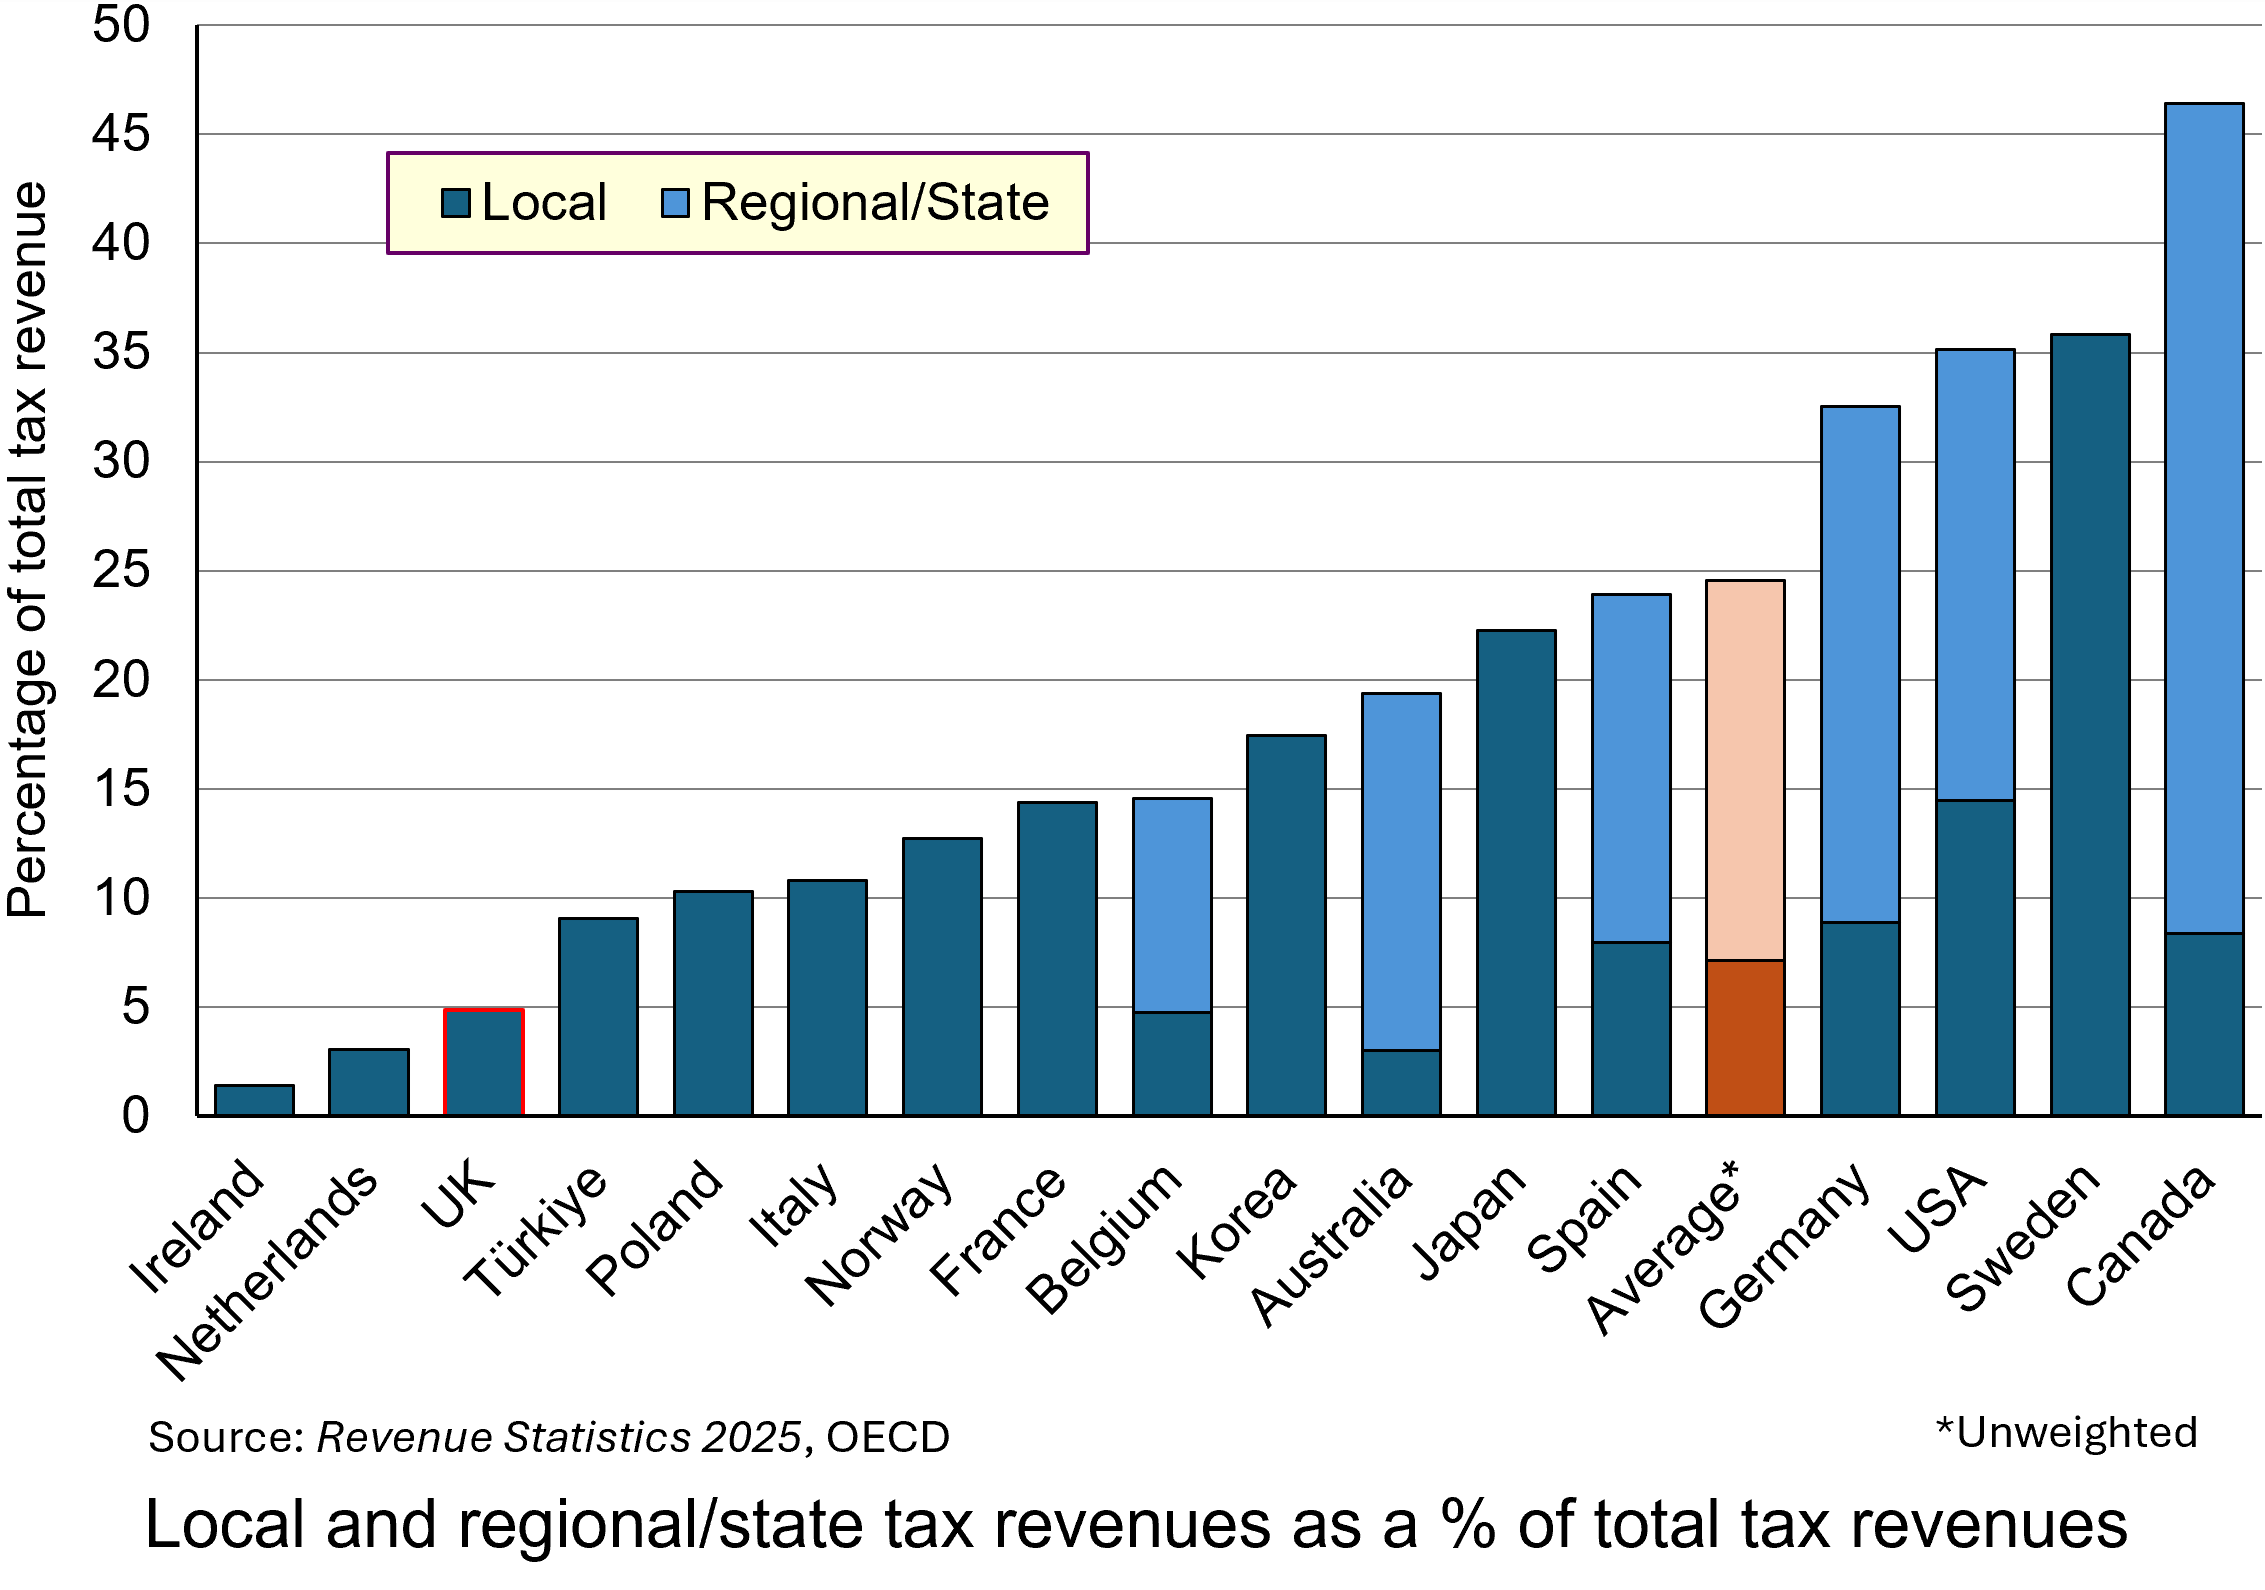 The UK, especially England, is one of the least devolved of the OECD countries. One aspect of this is taxation. The chart shows local taxes and, in the case of federal countries, state/regional/provincial taxes too. (Click here for a PowerPoint.)
Only 4.9% of UK tax revenue is in the form of local taxes (council tax and 50% of business rates) and the amount that can be raised in council tax is capped by the central government. The remainder of UK tax revenue goes to central government in the form of income taxes, social security taxes (national insurance), VAT, excise duties, etc. This compares with an average of 7.1% local taxes and 24.5% local plus regional taxes across the 17 OECD countries shown in the chart.
Andy Burnham plans to shift some of the spending and tax-raising powers from Whitehall to metro mayors and local councils. The aim is to stimulate productivity and economic growth at a regional and local level by tailoring support and incentives to local needs and strengths. Local leaders will be best positioned to understand these needs and strengths and will be able to customise spending and support appropriately.
 Examples of the types of greater autonomy over decision making would include:
- Control over adult education budgets to allow them to be tailored to provide training and apprenticeships to meet the skills requirements of existing and emerging industries in the area;
- Forming partnerships with local universities to support research and development that complements regional economic growth;
- Providing greater funding for and control over local transport infrastructure, including roads, buses, trams, trains, etc., with local consultation to make them fit for the local population and businesses;
- Tailoring business incentives to local needs and to the needs of the businesses themselves so as to attract an increase in investment;
- Greatly expanding council house building, which has virtually dried up in recent years, with mayors and/or local authorities empowered to develop local housing strategies, including affordable housing programmes, and to direct housing investment funding to particular housing developments in areas of greatest need.
Andy Burnham has pledged to stick to the government’s two existing fiscal rules:
a) The Stability Rule (Fiscal Mandate): the current (day-to-day) budget must be in balance or surplus. In other words the provision of salaries, public services, state pensions, welfare, etc. must be covered by government revenues (largely taxation). The government should borrow only to fund long-term investment.
b) The Debt Rule (Stock Mandate): each year, public-sector net financial liabilities (PSNFL) must be forecast by the OBR to be falling as a share of GDP compared to the previous year in three years’ time. This acts as a break on the amount of borrowing for long-term investment.
It is likely, therefore, that there will be little extra government money for investment. Rather, the policy involves a redistribution of public-sector investment from central government to mayoral/local authorities.
 In theory, such a policy of devolution need not see a redistribution from richer to poorer regions, but that might be part of the policy when the details are published. The UK has a bigger gap in productivity (GDP per worker) between its capital city and other large cities than in do other countries. Birmingham, Sheffield, Leeds, Newcastle, etc., as well as Cardiff, Glasgow, Edinburgh and Belfast, lag further behind London in output per head and economic growth than do other European countries lag behind their capital city. Thus the gap between Paris and Lyon, Toulouse and Marseille is narrower; as is that between Belin and Munich, Hamburg and Frankfurt. It is a similar picture in Spain and Italy. In the USA, some cities, such as San Francisco, outperform Washington DC and New York. A redistribution of government funding from London to the regions could see their incomes rise faster without having too much impact on London, which would still continue to attract large amounts of private investment.
Overall, there would be little increase in government funding. ‘Manchesterism’ is not, therefore, a demand-side policy. It is a supply-side policy – directing funds to areas where, combined with local incentives and local knowledge, the funding could yield greater returns and thereby increase potential GDP.
But this is not to say that there is no effect on aggregate demand. The hope is that devolution along the lines outlined by Andy Burnham will attract increased private investment, thereby increasing actual GDP as well as further increasing potential GDP.
We wait to see the details over the coming weeks.
Articles
- Will Andy Burnham’s devolution plan raise economic growth?
BBC Verify, Ben Chu (29/6/26)
- Burnham’s ‘Manchesterism’ could change the UK, but is not yet a full economic plan
BBC News, Faisal Islam (29/6/26)
- Burnham’s ‘Manchesterism’ got him to No 10 – but will it work for the UK?
BBC News, Faisal Islam (17/7/26)
- Burnham says there is some room for movement on tax
BBC News, Kate Wannel and Joshua Nevett (3/7/26)
- England’s mayors should be given sweeping new powers, says devolution expert
The Guardian, Kiran Stacey (2/7/26)
- What is Andy Burnham’s economic and political blueprint for Britain?
The Guardian, Richard Partington and Jessica Elgot (29/6/26)
- Why Andy Burnham’s radical plan relies on the Treasury being a friend of devolution
The Conversation, Dave Richards and Sam Warner (26/6/26)
- How Andy Burnham may try to give the UK economy a boost in his ‘10‑year plan’
The Conversation, Steve Schifferes (29/6/26)
- Could Andy Burnham let mayors raise more taxes?
House of Commons Research Briefing, Mark Sandford (2/7/26)
- Andy Burnham sets out policy plans in first major speech in PM leadership bid: Legal comments
Browne Jacobson, Dan Robinson (29/6/26)
- What does Andy Burnham think ‘Good Growth’ is?
Centre for Cities, Jess Tulasiewicz (30/6/26)
- Manchester’s digital transformation could be a blueprint for other parts of the UK
The Conversation, Richard Whittle (21/7/26)
Videos
Data
Questions
- Use an aggregate demand and supply diagram (simple or dynamic) to illustrate the effects on real GDP of a successful devolution strategy.
- Find out the details of the last Conservative government’s ‘levelling up’ policy. Was it similar in aims to that of ‘Manchesterism’?
- How could a policy of devolution as outlined by Andy Burnham affect income distribution within regions?
- Find out about the approach to regional policy in the EU. Is it similar to that being advocated by Andy Burnham?
- What is meant by ‘regional multipliers’? Why might they differ from the national multiplier?
 Wes Streeting and Andy Burnham are seeking to become UK Prime Minister in a challenge to Keir Starmer. They have both responded to an essay by Tony Blair, former Labour Prime Minister, where he argued that current Labour policies were holding back business. But the essay never mentioned inequality. According to Burnham and Streeting, inequality and the related issue of poverty are fundamental to the crises facing society in western democracies. Countries’ economic success is typically measured in terms of growth in GDP. But when the benefits of growth go largely to those at the top of the income scale, while people on lower incomes struggle to make ends meet, this feeds resentment. Populist politicians stoke such resentment and offer simplistic solutions, such as protectionism, blaming outsiders and promising a return to better times.
But just what has happened to inequality over recent years and has poverty deepened? How are inequality and poverty affecting people’s lives and what is the impact on the economy? And what policies should governments follow to tackle the problem?
Income inequality
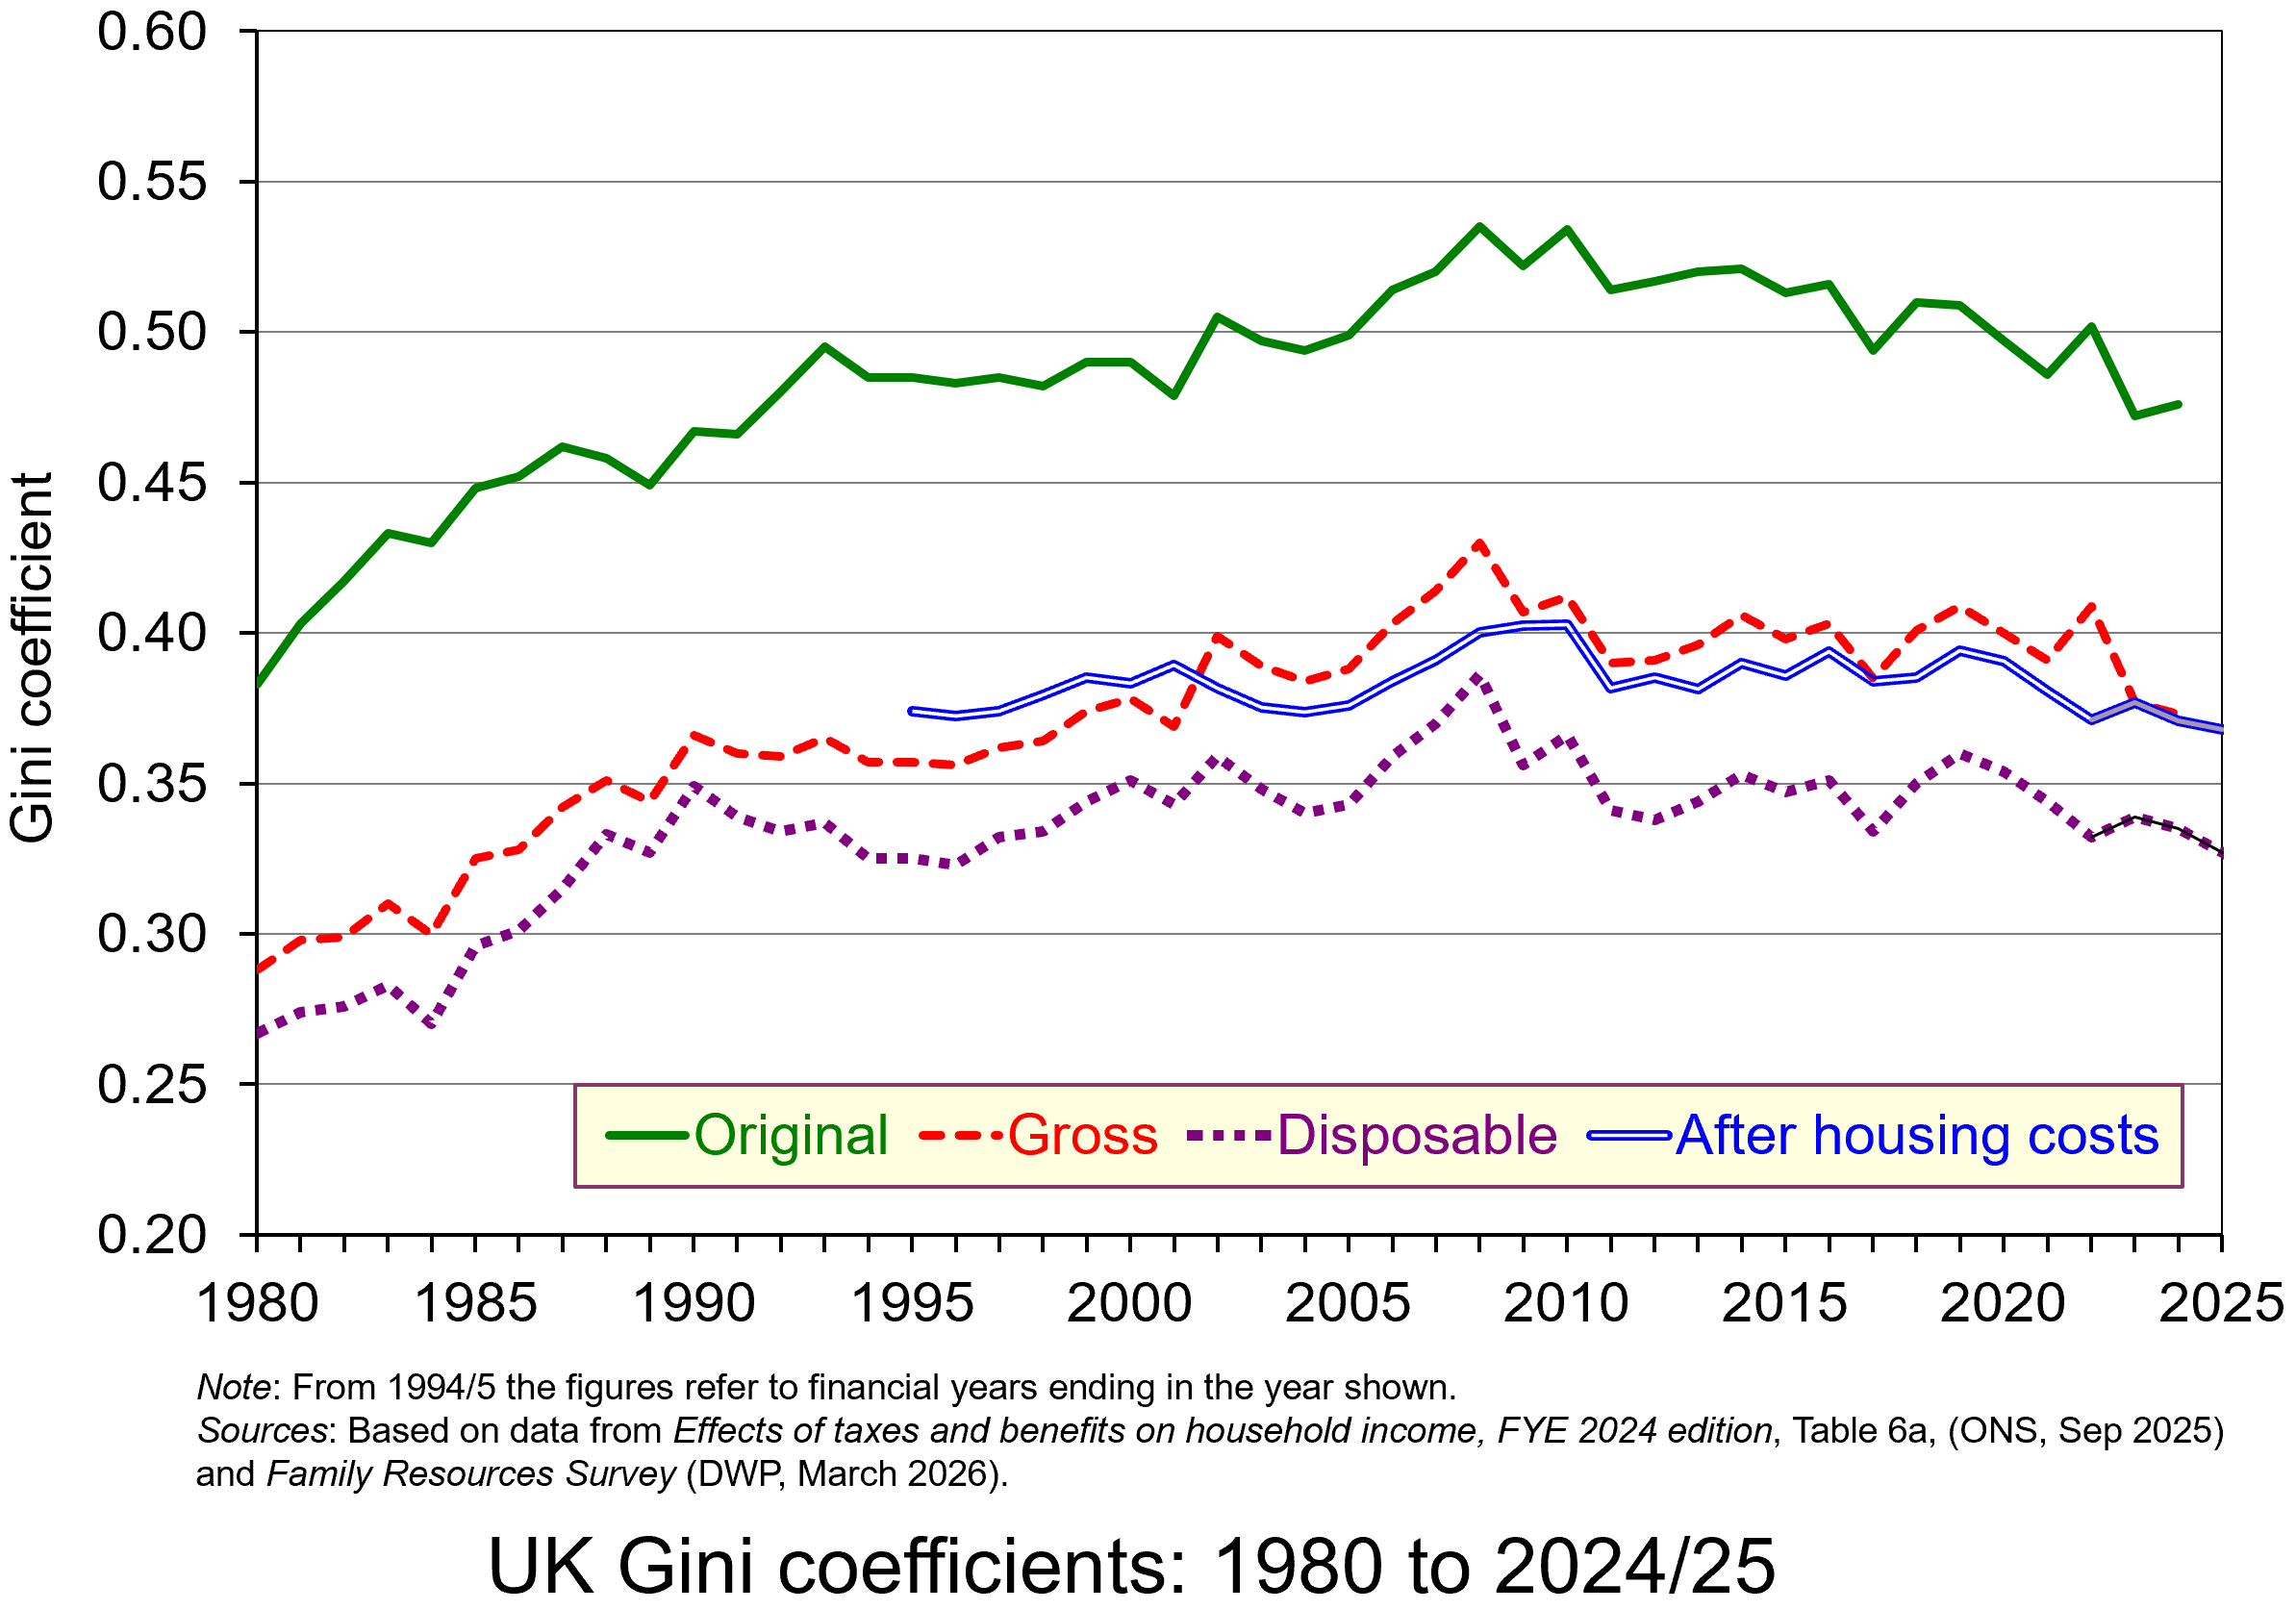 The chart shows UK inequality as given by the Gini coefficient, where 1 represents complete inequality, with one person earning the whole of national income and 0 represents perfect equality, with everyone earning the same. The higher the figure, therefore, the greater the inequality. As you can see, inequality is greatest when looking at original income – that is, income before taxes and benefits. Gross income includes benefits, and disposable income is income after both benefits and taxes. You can see that both benefits and taxes reduce inequality. When we take housing costs into account with the disposable income measure, however, inequality increases.
The chart shows that income inequality rose until the early 2000s, since when there have been only slight changes, although there has been a small decline recently.
The UK has higher income inequality than most high-income countries, although it is not as high as in the USA. It is sixth most unequal of the 38 OECD countries and the most unequal OECD member in Europe.
Globally, in 2025, the top 10% of the world’s population earned 53% of global income, while the bottom half earned just 8%. The reports listed below provide data and analysis on UK and global inequality.
Wealth inequality
 When we turn to wealth, inequality in the UK is even greater. The richest 10% of households hold around 41% of wealth, while the poorest 50% hold just under 10%. The Gini coefficient is around 0.6. This has been drive by a rise in property and share prices and the system of inheritance whereby family wealth can accumulate over the generations.
Globally, the top 10% of the world’s population held 75% of global wealth in 2025, whereas the bottom 50% held just 2%. And a tiny group of people – the top 0.001% of the adult population (about 56,000 individuals) – held about 6% of global wealth, up from 4% in 1995. Such extreme wealth inequality has thus increased.
Inequality and poverty
 There is no single measure of poverty. It could be measured in terms of basic needs. Here poverty would be where a person is unable to afford basic food, shelter, heating and lighting, clothing, footwear and basic toiletries. Normally, however, it is measured in relative terms. A typical measure, and one used by the Joseph Rowntree Foundation, is based on a proportion of median income. Poverty is defined as income below 60% of the median income, with deep poverty below 50% and very deep poverty below 40%.
In 2023/24, 14.2 million people were in poverty (20% of the population), of whom around 4.5 million were children. Of the 14.2 million, 6.8 million people (nearly half) were in very deep poverty,
 Causes of poverty include one or more of the following: low skills or education, low pay, unemployment, inadequate benefits or a benefit system that is confusing or difficult to access, chronic sickness, disability, unavailability or cost of suitable housing, discrimination, a breakdown of personal relationships, substance abuse, abuse from others, a criminal record. Once in poverty, it becomes difficult to escape as people become deskilled, demotivated and judged by society.
But even if people are not earning less than 60% of median income, they can still struggle to escape inequality. Many people have low skills; many routine jobs are being replaced by automation or AI; many graduates face high debts; people struggle to get on the housing ladder; the rising cost of basic items dampens real incomes, especially of the low paid; people may face discrimination of various sorts; people do not have an option of joining a union in their workplace; people may have a large number of dependants.
The policy agenda
If inequality rises up the political agenda in the UK, especially with a potential leadership race in the Labour party, what might politicians focus on? The government has already done the following:
- It has raised the minimum wage (the ‘National Living Wage’) substantially from £10.42 in 2023/24 to £11.44 in 2024/25, to £12.21 in 2025/26 and lowered the age limit from 23 to 21. There have been larger percentage rises for 18–20 year-olds and those under 18.
- The two-child limit to the child benefit element in Universal Credit has been scrapped and so now parents are eligible for benefits for all children.
- The Employment Rights Act has ended exploitative zero-hour contracts by providing rights to guaranteed hours.
- It has expanded free school meal entitlements.
- It has capped Universal Credit debt deductions at 15% of increased incomes (down from 25%) to help the poorest households retain more of their monthly income.
- It has expanded free school meals and made more money available for free nursery place.
- Landlords can no longer evict tenants for no reason; they must have a valid reason such as wanting to sell the property or severe rent arrears.
- Landlords cannot increase rents more than once per year and tenants can appeal excessive or above-market rent increases to an independent tribunal.
But despite these policy measures, many claim that they will do too little to tackle inequality and poverty. Some on the left argue that taxes on property and other forms of wealth will be required to tackle wealth inequality. Others argue that more emphasis on education and training is necessary to provide workers with the skills to earn more in the labour market. Others argue for greater expenditure on public services.
Generally, however, measures to tackle inequality and poverty require government expenditure, which must be funded. This is why many on the centre left argue that economic growth is a necessary condition for any significant redistribution. It is, they argue, the best way of providing the tax revenue to fund redistribution.
Incentives and disincentives
 Many on the right argue that redistributing incomes through higher taxes and benefits will act as a disincentive to work and to invest. As we argue in Essentials of Economics, higher income taxes could discourage people from working and investing; higher wealth taxes could discourage people from saving and investing.
The key to analysing these arguments is to distinguish between the income effect and the substitution effect of raising taxes. Raising income tax does two things.
- It reduces disposable incomes. People therefore are encouraged to work more in an attempt to maintain their consumption of goods and services. This is the income effect. ‘I have to work more to make up for the higher taxes’, a person might say.
- It reduces the opportunity cost of leisure. Since higher income taxes reduce take-home pay, an extra hour taken in leisure now involves a smaller sacrifice in consumption. Thus people may substitute leisure for consumption, and work less. This is called the substitution effect. ‘What is the point of doing overtime’, another person might say, ‘if so much of the overtime pay is going in taxes?’
The relative size of the income and substitution effects is likely to differ for different types of people. For example, the income effect is likely to dominate for those people with a substantial proportion of long-term commitments, such as those with families, with mortgages and other debts. They may feel forced to work more to maintain their disposable income. Clearly for such people, higher taxes are not a disincentive to work. The income effect is also likely to be relatively large for people on higher incomes, for whom an increase in tax rates represents a substantial cut in income.
The substitution effect is likely to dominate for those with few commitments: those whose families have left home, the single, and second income earners in families where that second income is not relied on for ‘essential’ consumption. A rise in tax rates for these people is likely to encourage them to work less.
Although high income earners may work more when there is a tax rise, they may still be discouraged by a steeply progressive tax structure. If they have to pay very high marginal rates of tax, it may simply not be worth their while seeking promotion or working harder.
What those on the centre and left argue is that tackling inequality and poverty requires more than just changing the tax and benefits system. What is required is policies that encourage greater upward social mobility, greater social cohesion and greater expenditure on infrastructure that will support the poor, such as greater expenditure on education and training, on support for very young children, on preventative healthcare, on social housing and on local public transport.
Articles
- Burnham and Streeting accuse Blair of ignoring inequality as they hit back at ex-PM
BBC News, Brian Wheeler and Richard Wheeler (27/5/26)
- Streeting and Burnham accuse Blair of failing to confront inequality in Labour criticism
The Guardian, Jessica Elgot (27/5/26)
- Alan Milburn is right, a young generation has been betrayed. Forget Tony Blair: we must attend to this
The Guardian, Polly Toynbee (28/5/26)
- Blair wants to leave our future to the markets. I believe democracy can still shape our lives for the better
The Guardian, Wes Streeting (27/5/26)
- New evidence on international inequality of opportunity – how does the UK rank?
The Sutton Trust, Opinion, Esme Lillywhite (25/9/25)
- Sorry, comrade Burnham. Inequality is a good thing
Telegraph on archive.today, Luke Johnson (29/5/26)
- Why America’s rich keep getting richer
CNN, David Goldman (29/5/26)
- Concern about inequality is not mere envy
LSE blogs, David Lay Williams (13/1/26)
- Are new technologies fuelling wage inequality? Evidence from Spain
LSE blogs, Raquel Sebastián, Pedro Salas-Rojo, Juan César Palomino and Juan Gabriel Rodríguez (24/3/26)
- 56,000 people own three times more wealth than half of humanity
LSE blogs, Ricardo Gómez-Carrera (12/5/26)
- The broad economic impact of inequality
Harvard Institute for Business in Global Society, Drew Keller and Susan Milligan (8/7/25)
- The New Inequality
Substack, Paul Krugman (31/5/26)
- Global Justice Report: the World Inequality Lab maps a path to €5,000-a-month average incomes for all countries within +1.8°C of warming
World Inequality Lab (4/6/26)
- ‘An equal and habitable world is possible’: academics set out sweeping vision for planetary survival
The Guardian, Jonathan Watts (4/6/26)
Reports
- Living standards, poverty and inequality in the UK
Institute for Fiscal Studies (26/3/26)
- Are fewer people living in poverty than previously thought?
Institute for Fiscal Studies, Jed Michael, Sam Ray-Chaudhuri and Tom Wernham (26/3/26)
- Income inequality in the UK
House of Commons Library, Brigid Francis-Devine (14/5/26)
- The Scale of Economic Inequality in the UK
Equality Trust
- Causes of inequality
Equality Trust
- UK Poverty 2026
Joseph Rowntree Foundation (27/1/26)
- Households Below Average Income: An analysis of the UK income distribution: FYE 1995 to FYE 2025
Department for Work & Pensions (26/3/26)
- Household income inequality, UK: financial year ending 2024
ONS (2/5/25)
- Unequal Chances: Children and economic inequality
UNICEF Innocenti (May 2026)
- To Have and Have Not – How to Bridge the Gap in Opportunities
OECD (22/9/25)
- World Inequality Report 2026
World Inequality Lab, Lucas Chance, Ricardo Gómez-Carrera (Lead Author), Rowaida Moshrif and Thomas Piketty
- The Global Justice Report
World Inequality Lab, L Chance, C Mohren, R Moshrif, M Odersky, T Piketty, A Somanchi, et al (4/6/26)
Data
Questions
- Is the UK becoming more or less equal? Does the answer depend on how inequality is measured?
- Is the world becoming more or less equal?
- Summarise the arguments against redistributing incomes from the rich to the poor.
- Summarise the arguments in favour of redistributing incomes from the rich to the poor.
- Explain the income and substitution effects of making income tax more progressive.
- How is the greater adoption of AI likely to affect income distribution?
- How does social mobility affect income distribution? What measures can be adopted to increase social mobility?
- Compare the relative merits and problems of raising income taxes, wealth taxes and expenditure taxes as means of redistributing incomes more equally.
 In my previous blog post on this site, I examined how AI-powered pricing tools can act as a ‘double-edged sword’: offering efficiency gains, while also creating opportunities for collusion. I referred to one of the early examples of this, which was the case involving Trod Ltd and GB Eye, where two online poster and frame sellers on Amazon used pricing algorithms to monitor and adjust their prices. However, in this instance there was also an explicit agreement between the firms. As some commentators put it, it was ‘old wine in new bottles‘, meaning a fairly conventional cartel that was simply facilitated through digital tools.
Since then, algorithms have increasingly become part of everyday life and are now embedded in routine business practice.
Some of the effects may have a positive effect on competition. For example, algorithms can help to lower barriers to entry. In some markets, incumbents benefit from long-standing experience, while new firms face significant learning costs and are at a disadvantage. By reducing these learning costs and supporting entry, algorithms could contribute to making collusion harder to sustain.
On the other hand, algorithms could increase the likelihood of collusion. For example, individual algorithms used by competing firms may respond to market conditions in predictable ways, making it easier for firms to collude tacitly over time.
Algorithms can also improve the ability of firms to monitor each other’s prices. This is particularly relevant for multi-product firms. Traditionally, we might expect these markets to be less prone to collusion because co-ordinating across many products is complex. AI can overcome this complexity. In the Sainsbury’s/Asda merger case, for example, the Competition and Markets Authority suggested that the main barrier to reaching and monitoring a pricing agreement was the complexity of pricing across such a wide range of products. However, the CMA also suggested that technological advances could increase its ability to do so in the future.
The ‘hub-and-spoke’ model
 One of the other growing concerns is the ability of AI pricing algorithms to facilitate collusion by acting as a ‘hub’ in a ‘hub-and-spoke’ arrangement. In this type of collusion, competing firms (the ‘spokes’) need not communicate directly with one another. Instead, the ‘hub’ helps them to co-ordinate their actions.
While there have been only limited examples of an AI pricing algorithm acting as a hub in practice, what once seemed to be a largely theoretical concern has now become a live enforcement issue.
A very recent example is the RealPage case in the United States. The Department of Justice (DOJ) filed an antitrust lawsuit against RealPage Inc. in August 2024, alleging that RealPage, acting as the ‘hub’, facilitated collusion between landlords (the ‘spokes’).
RealPage provided pricing software to numerous landlords, including the largest landlord in the USA, which manages around 950 000 rental units across the country. These landlords would normally compete independently in setting rental prices, discounts and lease terms to win consumers. However, by feeding competitively sensitive information that would not usually be shared between rivals into RealPage’s system, the software generated pricing recommendations that, according to the DOJ, led to co-ordinated rent increases across competing apartment complexes.
I n the RealPage case, the authorities reported that they had access to internal documents and statements from the parties involved, which helped support their allegations. These included references within RealPage to helping landlords ‘avoid the race to the bottom’ and comments from a landlord describing the software as ‘classic price fixing’.
Evidence in these cases really matters because the standard of proof required to establish a hub-and-spoke arrangement is much higher than for traditional cases of explicit collusion. This is because it can be difficult to distinguish between legitimate and anti-competitive communication between retailers and suppliers. Also, proving ‘anti-competitive intent’ is inherently challenging.
Other competition authorities around the world are also turning their attention to these issues. For example, the European Commission recently announced that a number of investigations into algorithmic pricing are underway, signalling a clear shift toward more active scrutiny. As technology continues to advance, it is clear that algorithmic pricing will remain an area where both firms and authorities must move and adapt quickly.
Articles
Questions
- In what ways does the RealPage case differ from the earlier Trod Ltd and GB Eye Ltd case? Consider the roles played by the firms, the nature of the alleged co-ordination, and the extent to which pricing algorithms were used to facilitate the conduct.
- How might the use of pricing algorithms affect the likelihood of firms colluding, either explicitly or tacitly? Consider ways that algorithms may make collusion easier to sustain but also ways in which they may reduce its likelihood.
- Should firms be held liable for anti-competitive outcomes produced by algorithms that ‘self-learn’, even if they did not intend those outcomes? Explain why or why not.
 The productivity gap between the UK and its main competitors is significant. In 2024, compared to the UK, output per hour worked was 10.0% higher in France, 19.8% higher in Germany and 41.1% higher in the USA. These percentages are in purchasing-power parity terms: in other words, they reflect the purchasing power of the respective currencies – the pound, the euro and the US dollar.
GDP per hour worked (in PPP terms) is normally regarded as the best measure of labour productivity. An alternative measure is GDP per worker, but this does not take into account the length of the working year. Using this measure, the gap with the USA is even higher as workers in the USA work longer hours and have fewer days holiday per year than in the UK.
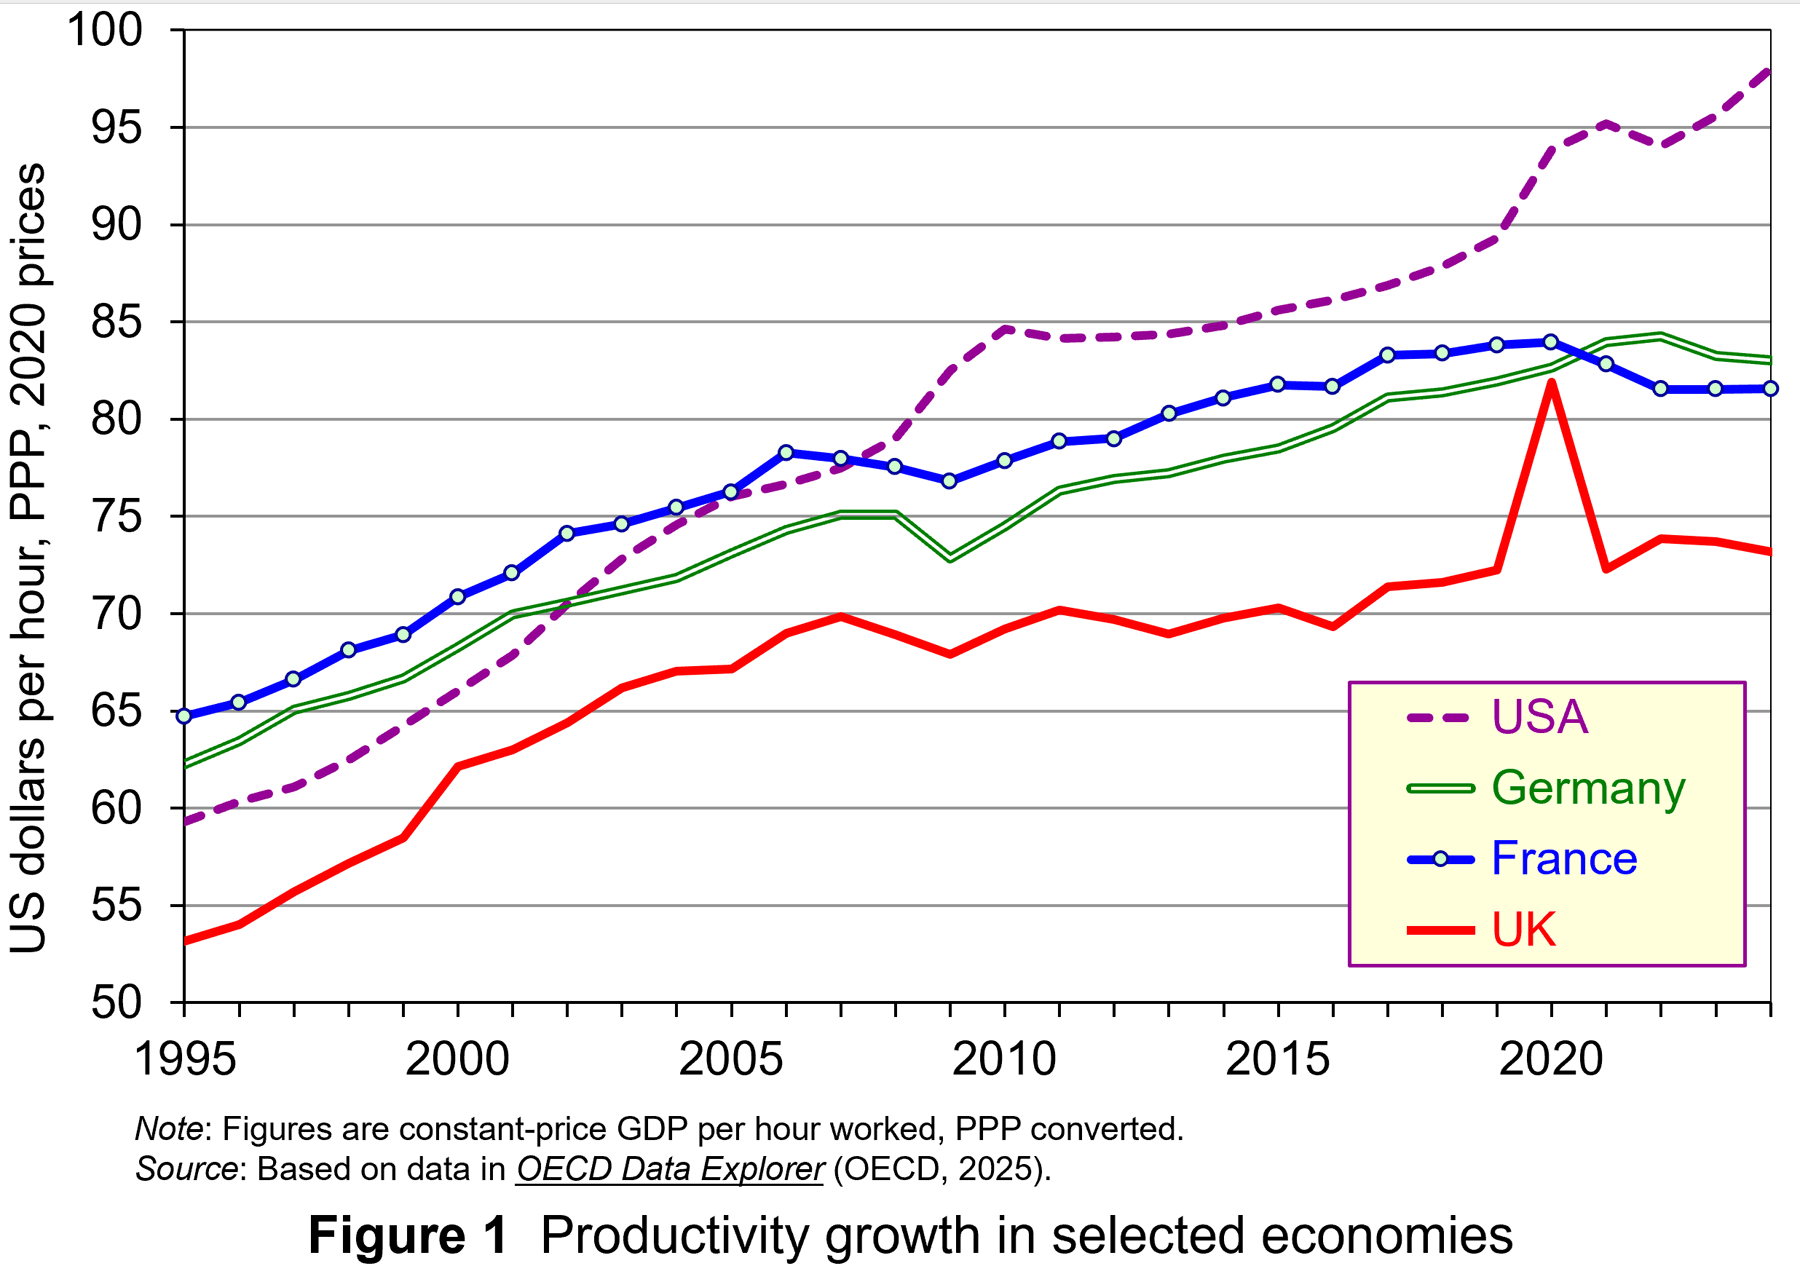 The productivity gap is not a new phenomenon. It has been substantial and growing over the past 20 years. (The exception was in 2020 during lockdowns when many of the least productive sectors, such as hospitality, were forced to close temporarily.)
The productivity gap is shown in the two figures. Both figures show labour productivity for the UK, France, Germany and the USA from 1995 to 2024.
Figure 1 shows output (GDP) per hour, measured in US dollars in PPP terms.
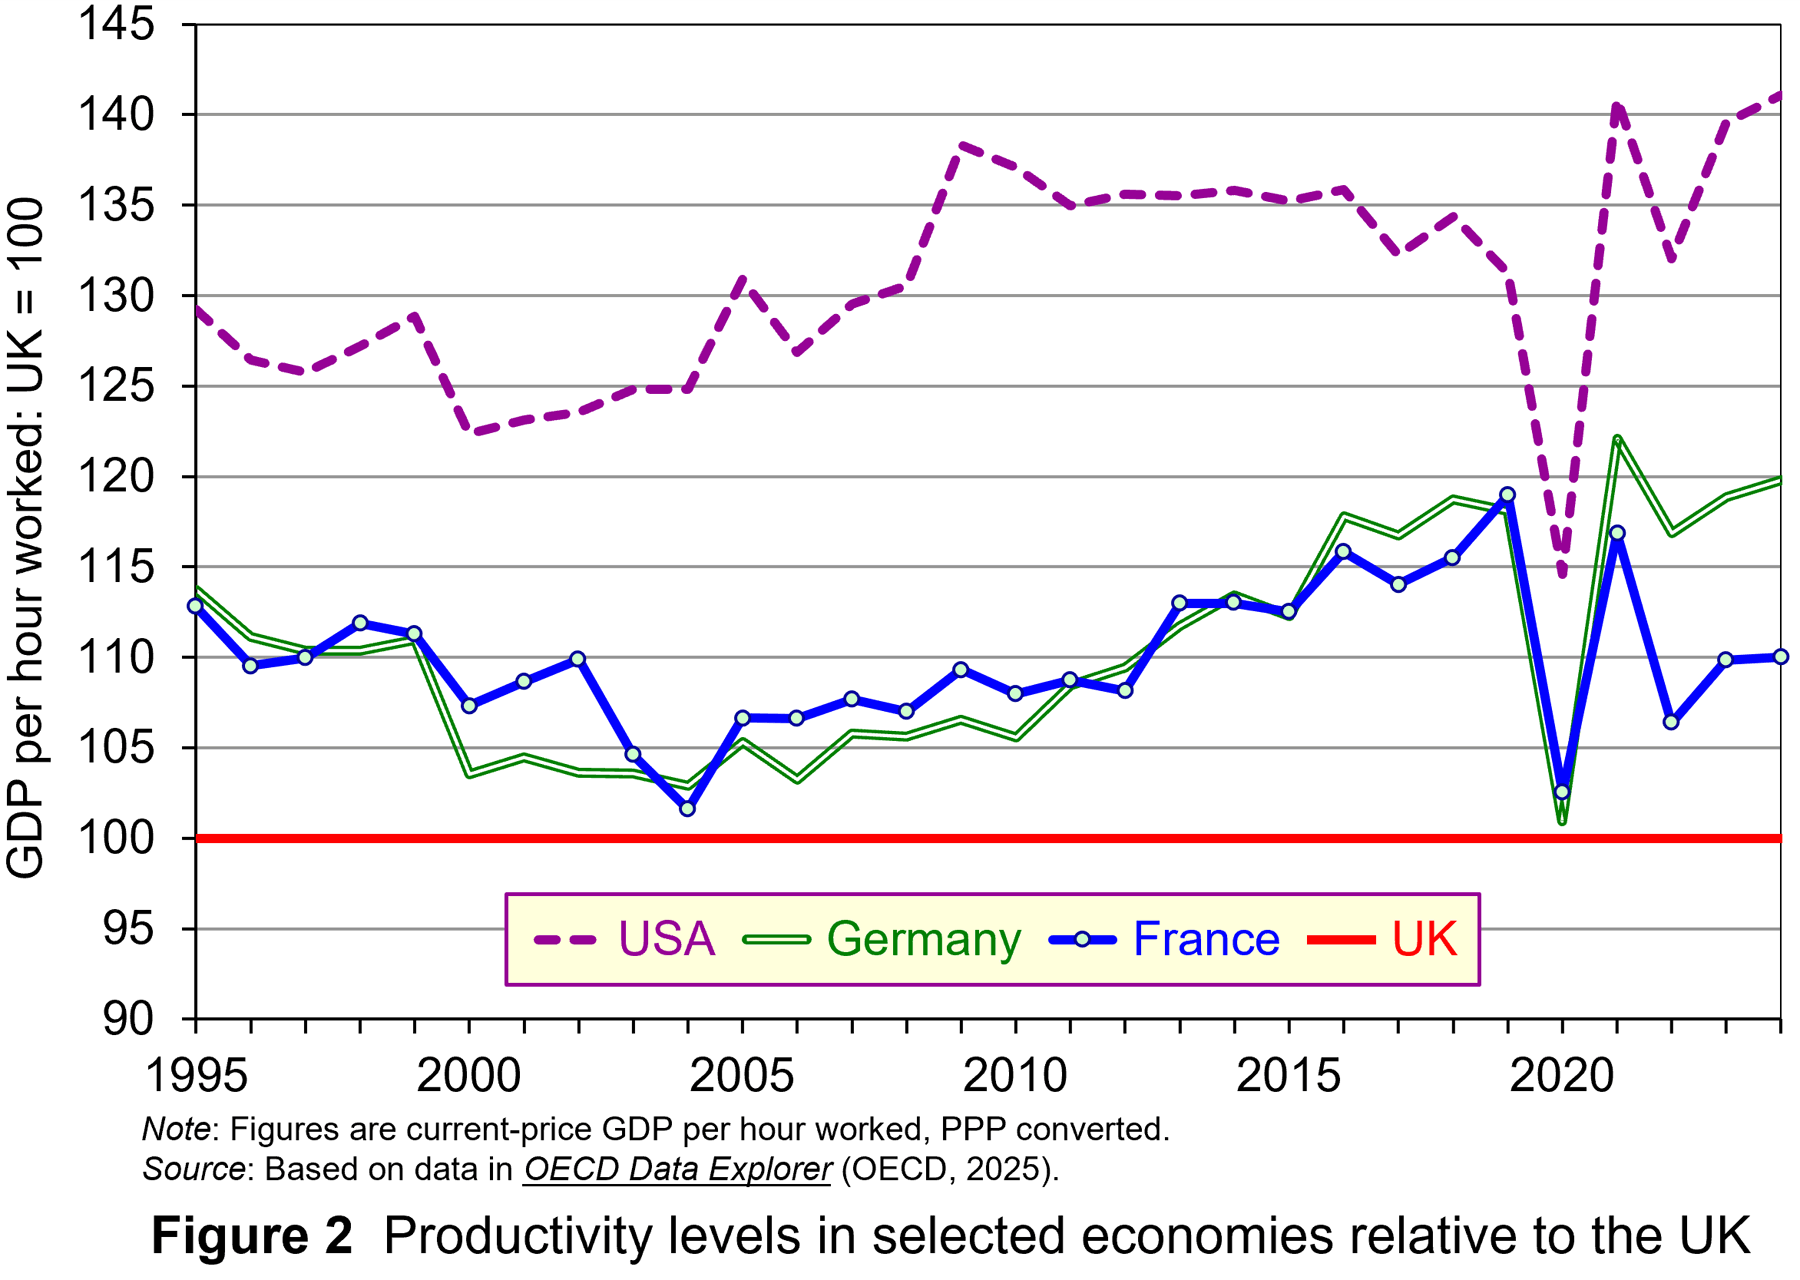 Figure 2 shows output (GDP) per hour relative to the UK, with the UK set at 100. The gap narrowed somewhat up to the early 2000s, but since then has widened.
Low UK productivity has been a source of concern for UK governments and business for many years. Not only does it constrain the growth in living standards, it also make the UK less attractive as a source of inward investment and less competitive internationally.
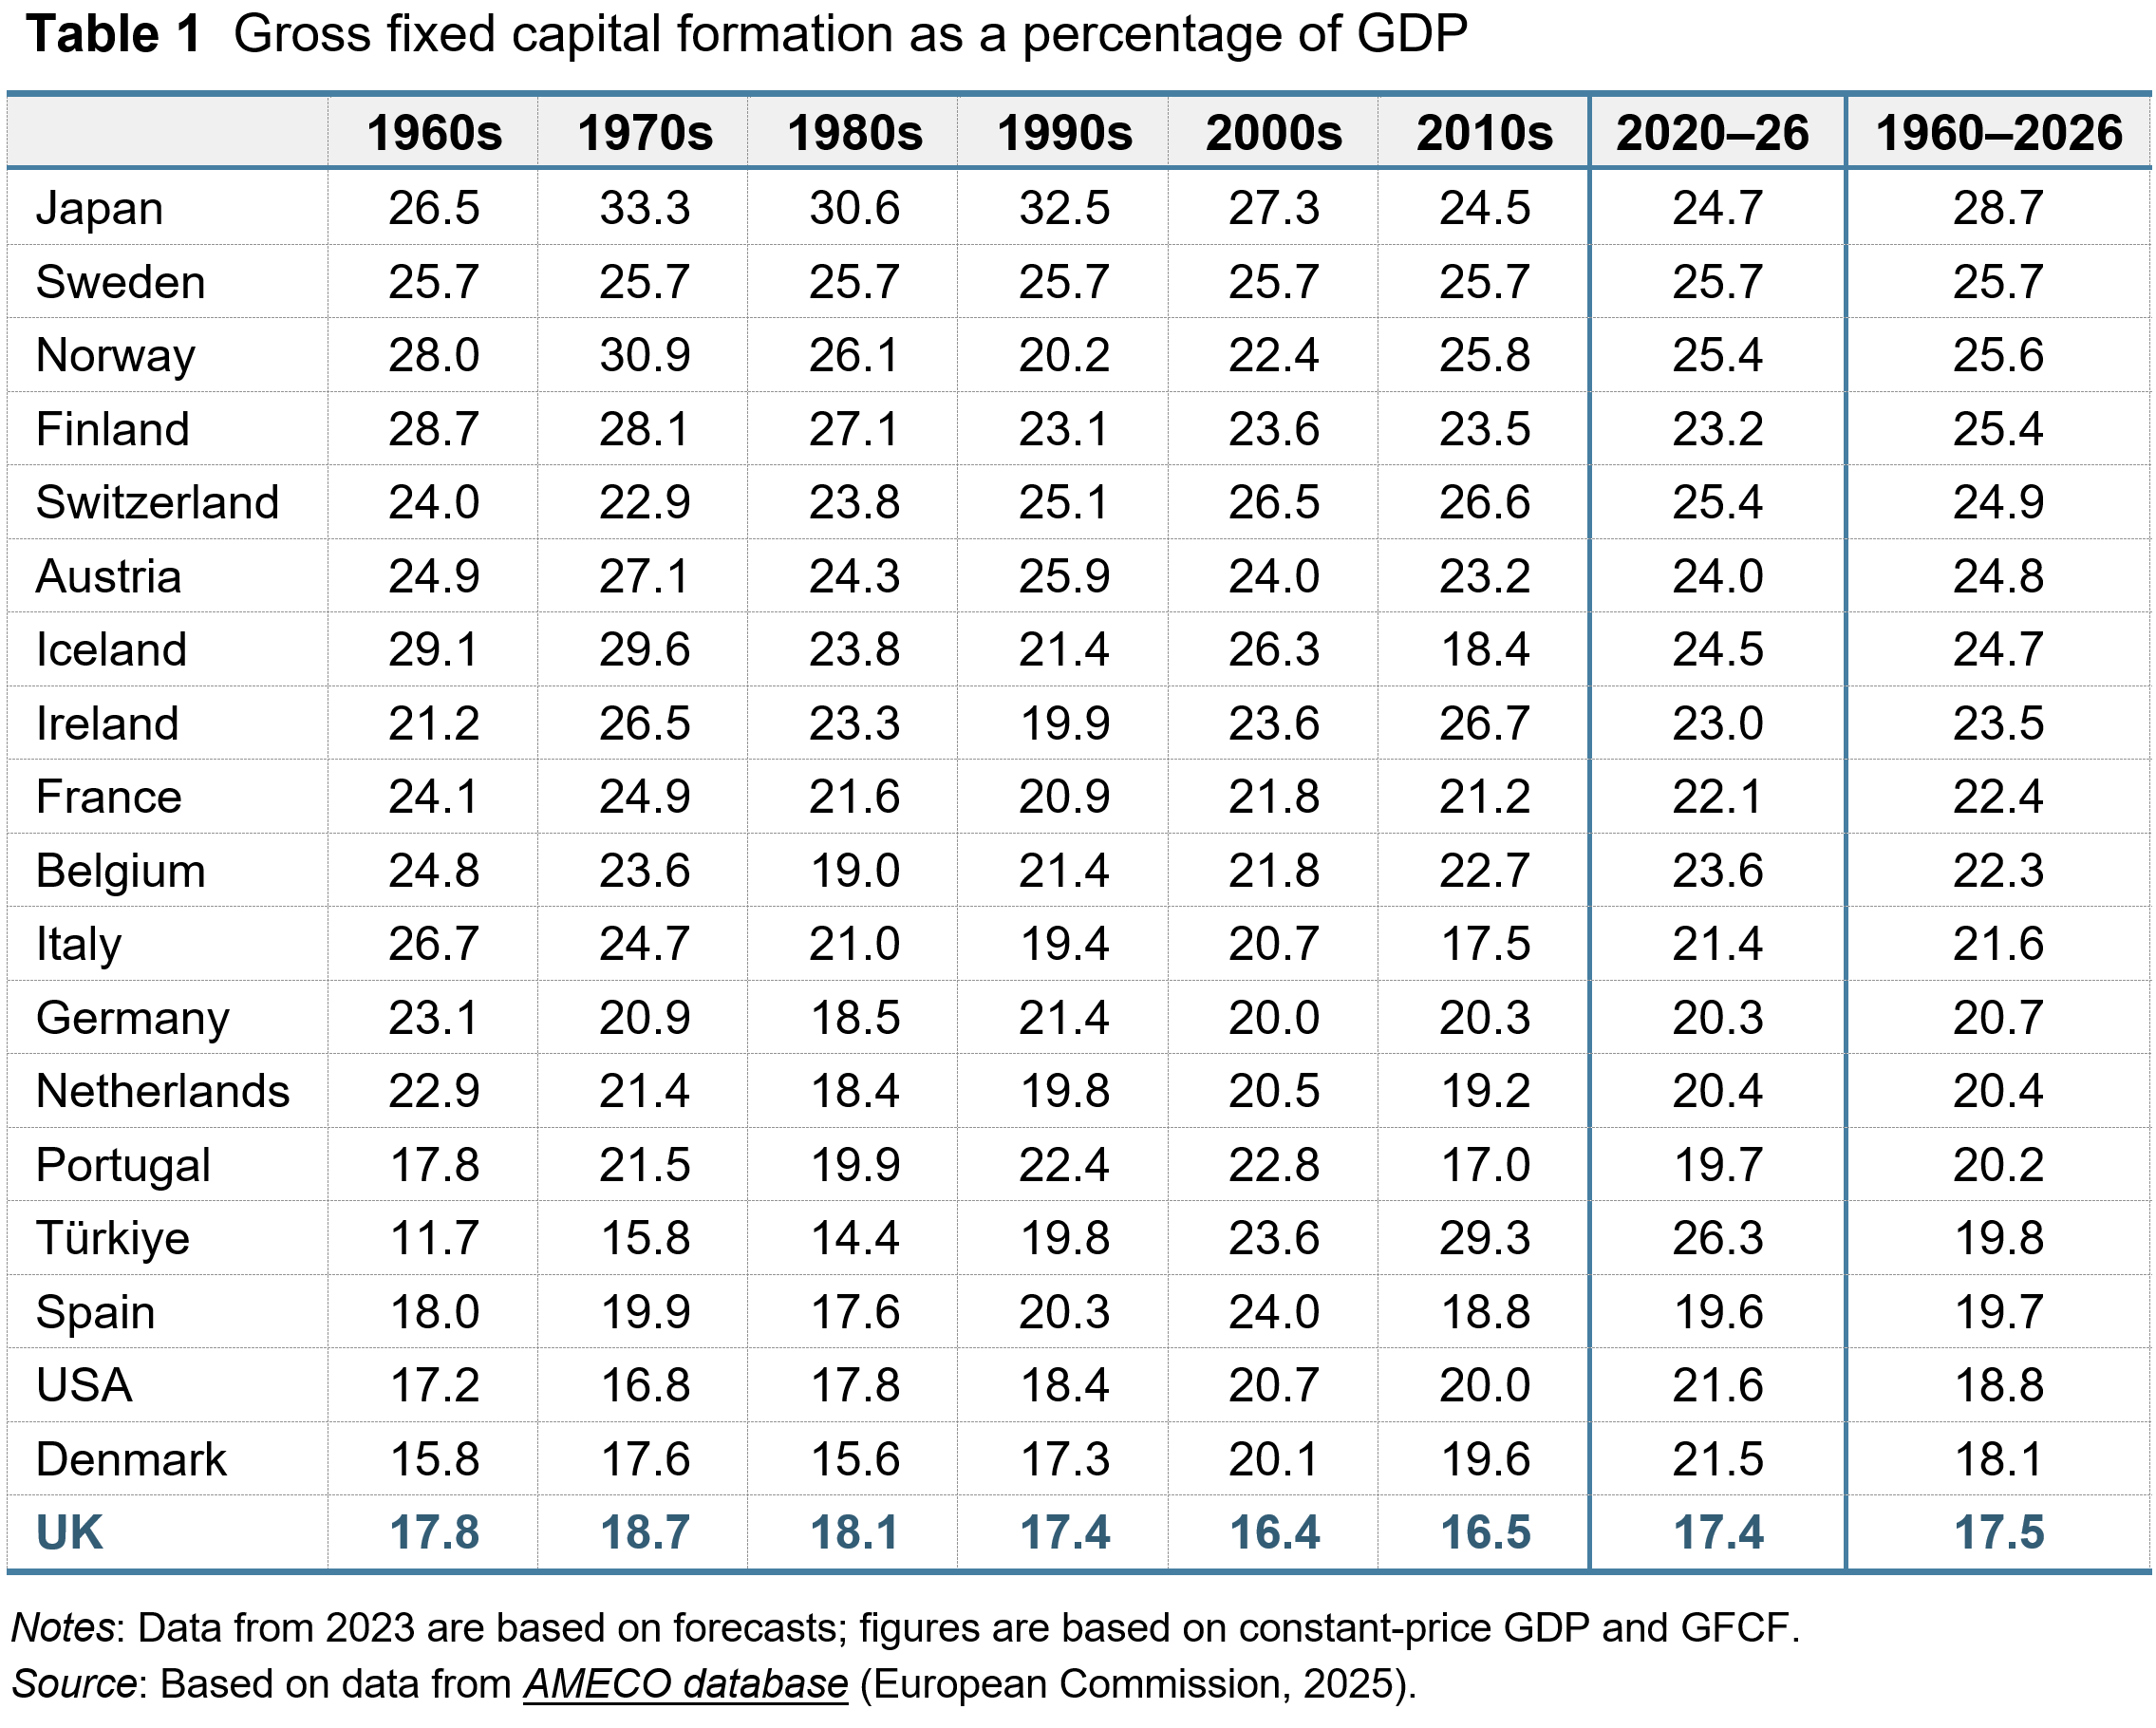
Part of the reason for low UK productivity compared to that in other countries is a low level of investment. As a proportion of GDP, the UK has persistently had the lowest, or almost the lowest, level of investment of its major competitors. This is illustrated in Table 1.
It is generally recognised by government, business and economists that if the economy is to be successful, the productivity gap must be closed. But there is no ‘quick fix’. The policies necessary to achieve increased productivity are long term. There is also a recognition that the productivity problem is a multi-faceted one and that to deal with it requires policy initiatives on a broad front: initiatives that encompass institutional changes as well as adjustments in policy.
So what can be done to improve productivity and how can this be achieved at the micro as well as the macro level?
Improving productivity: things that government can do
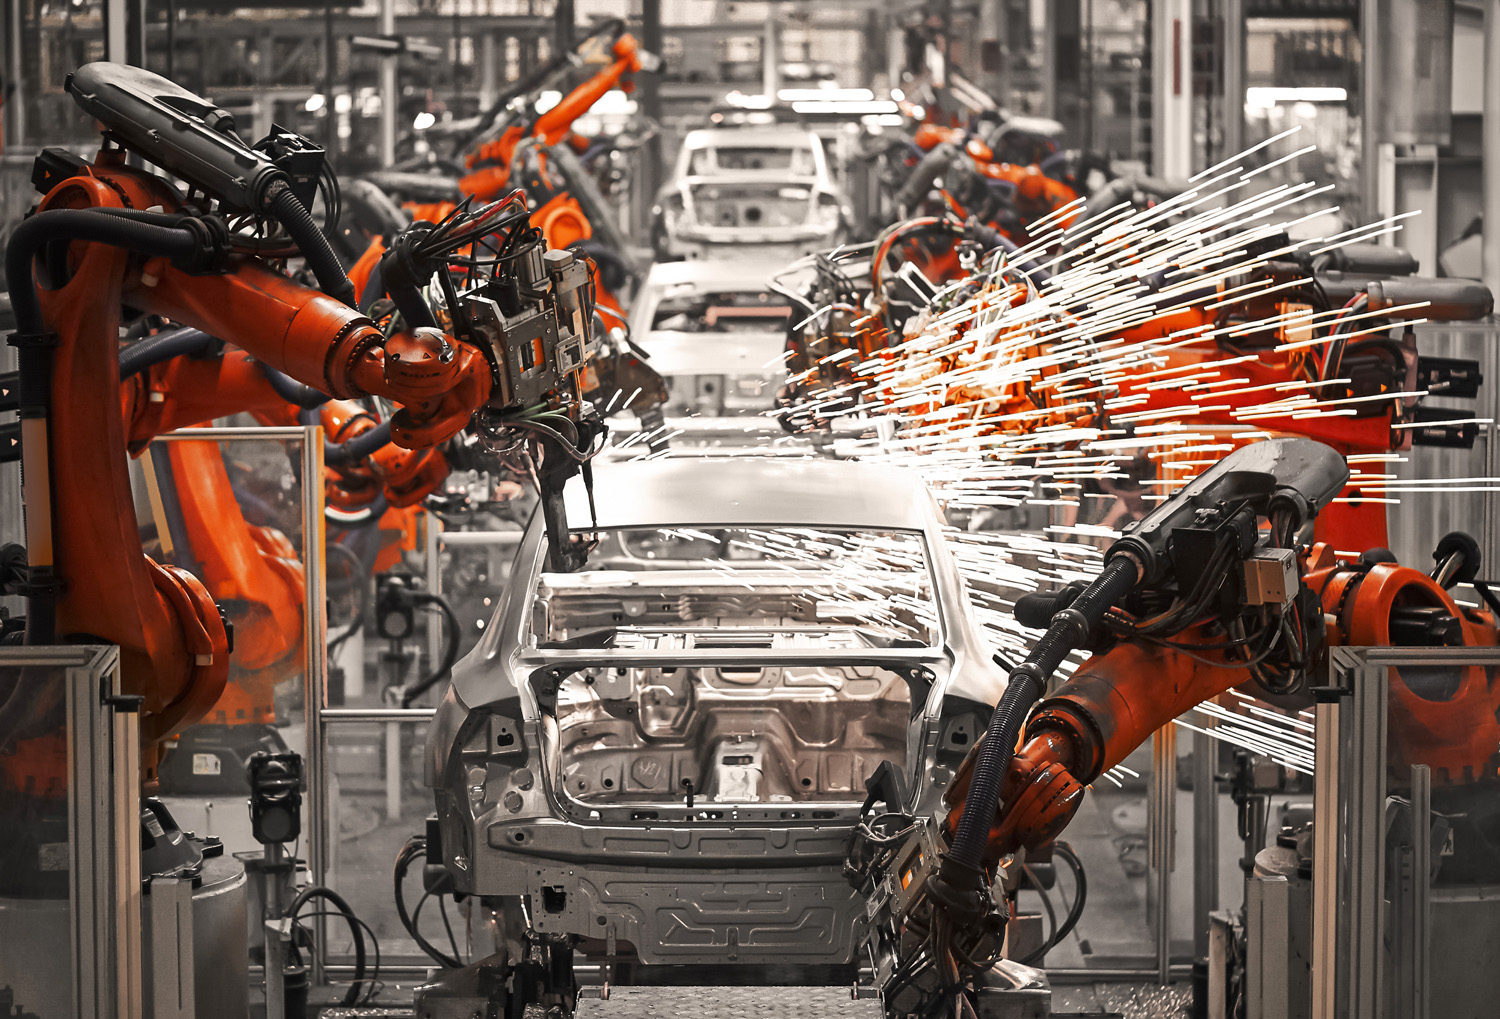 Encouraging investment. Over the years, UK governments have increased investment allowances, enabling firms to offset the cost of investment against pre-tax profit, thereby reducing their tax liability. For example, in the UK, companies can offset a multiple of research and development costs against corporation tax. The rate of relief for small and medium-sized enterprises (SMEs) allows companies that work in science and technology to deduct an extra 86% of their qualifying expenditure from their trading profit in addition to the normal 100% deduction: i.e. a total of 186% deduction. Meanwhile, since April 2016, larger companies have been able to claim a R&D expenditure credit, initially worth 11 per cent of R&D expenditures, then 12 per cent from 2018 and 13 per cent from 2020. This was then raised to 20 per cent from 2023.
Strengthening competition. A number of studies have revealed that, with increasing market share, business productivity growth slows. As a result, government policy sought to strengthen competition policy. The Competition Act 1998, which came into force in March 2000, and the Enterprise Act of 2002, enhanced the powers of the Office of Fair Trading (OFT) (a predecessor to the Competition and Markets Authority) in respect to dealing with anti-competitive practices. It was given the ability to impose large fines on firms which had been found guilty of exploiting a dominant market position. Today, one of the strategic goals of the Competition and Markets Authority (CMA) is the aim of ‘extending competition frontiers’ in order to improve the way competition works.
Encouraging an enterprise culture. The creation of an enterprise culture is seen as a crucial factor not only to encourage innovation but also to stimulate technological progress. Innovation and technological progress are crucial to sustaining growth and raising living standards. The UK government launched the Small Business Service in April 2000, later renamed Business and Industry. Its role is to co-ordinate small-business policy within government and liaise with business, providing advice and information. However, according to the OECD, there remains considerable scope for increasing the level of government support for entrepreneurship in the UK.
Improving productivity: things that organisations can do
In the podcast from the BBC’s The Bottom Line series, titled ‘Productivity: How Can British Business Work Smarter’ (see link below), Evan Davis and guests discuss what productivity really looks like in practice – from offices and factories, to call centres and operating theatres.’ The episode identifies a number of ways in which labour productivity can be improved. These include:
- People could work harder;
- Workers could be better trained and more skilled and thus able to produce more per hour;
- Capital could be increased so that workers have more equipment or tools to enable them to produce more, or there could be greater automation, releasing labour to work on other tasks;
- Workplaces could be arranged more efficiently so that less time is spent moving from task to task;
- Systems could put in place to ensure that tasks are done correctly the first time and that time is not wasted having to repeat them or put them right;
- Workers could be better incentivised to work efficiently, whether through direct pay or promotion prospects, or by increasing job satisfaction or by management being better attuned to what motivates workers and makes them feel valued;
- Firms could move to higher-value products, so that workers produce a greater value of output per hour.
The three contributors to the programme discuss various initiatives in their organisations (an electronics manufacturer, NHS foundation trusts and a provider of office services to other organisations).
 They also discuss the role that AI plays, or could play, in doing otherwise time-consuming tasks, such as recording and paying invoices and record keeping in offices; writing grants or producing policy documents; analysing X-ray results in hospitals and performing preliminary diagnoses when patients present with various symptoms; recording conversations/consultations and then sorting, summarising and transcribing them; building AI capabilities into machines or robots to enable them to respond to different specifications or circumstances; software development where AI writes the code. Often, there is a shortage of time for workers to do more creative things. AI can help release more time by doing a lot of the mundane tasks or allowing people to do them much quicker.
There are huge possibilities for increasing labour productivity at an organisational level. The successful organisations will be those that can grasp these possibilities – and in many cases they will be incentivised to so so as it will improve their profitability or other outcomes.
Podcast
Articles
- Steeper UK productivity cut of more than £20bn makes tax rises more likely
The Guardian, Kalyeena Makortoff, Phillip Inman and Richard Partington (28/10/25)
- Reeves could face £20bn Budget hole as UK productivity downgraded
BBC News, Faisal Islam (27/10/25)
- To boost UK productivity, ordinary workers must bear more of the tax burden
Financial Times, Anatole Kaletsky (1/11/25)
- Neither China nor Japan – now it is the United States that adopts the brutal 9-9-6 model that redefines productivity and attrition
UnionRayo, Laura M. (1/11/25)
- ‘The money machine is misfiring’: City blames Brexit for UK’s £20bn productivity headache
The Guardian, Richard Partington (31/10/25)
- Organisations can achieve greater productivity and employee engagement with improved performance management, new research finds
WTW Press Release (29/10/25)
- Why does lower productivity mean tax rises are more likely?
BBC Verify, Ben Chu (4/11/25)
- Why is technology not making us more productive?
BBC News, Jonty Bloom (24/7/23)
Data
Questions
- In what different ways can productivity be measured? What is the most appropriate measure for assessing the effect of productivity on (a) GDP and (b) human welfare generally?
- Why has the UK had a lower level of labour productivity than France, Germany and the USA for many years? What can UK governments do to help close this gap?
- Find out how Japanese labour productivity has compared with that in the UK over the past 30 years and explain your findings.
- Research an organisation of your choice to find out ways in which labour productivity could be increased.
- Identify various ways in which AI can improve productivity. Will organisations be incentivised to adopt them?
- Has Brexit affected UK labour productivity and, if so, how and why?
 A ‘Super’ El Nino Is Coming For Southeast Asia. What Happens Next?