
Inflation has been rising around the world. The main reason has been the supply shock of rising oil, fertiliser and commodity prices caused by the Iran war and the disruption to global supply chains from conflicts in the Middle East and Russia (see the blog, Why have diesel prices risen more than petrol prices?). Central banks, including the US Federal Reserve Bank, the European Central Bank and the Bank of Japan, have responded to this cost-push inflationary shock by raising interest rates. The Bank of England is likely to raise Bank rate at its next meeting on 5 November 2026.
Similar supply shocks have been experienced in recent years (see the May 2026 blog, Supply shocks – long-term gain from the short-term pain?).
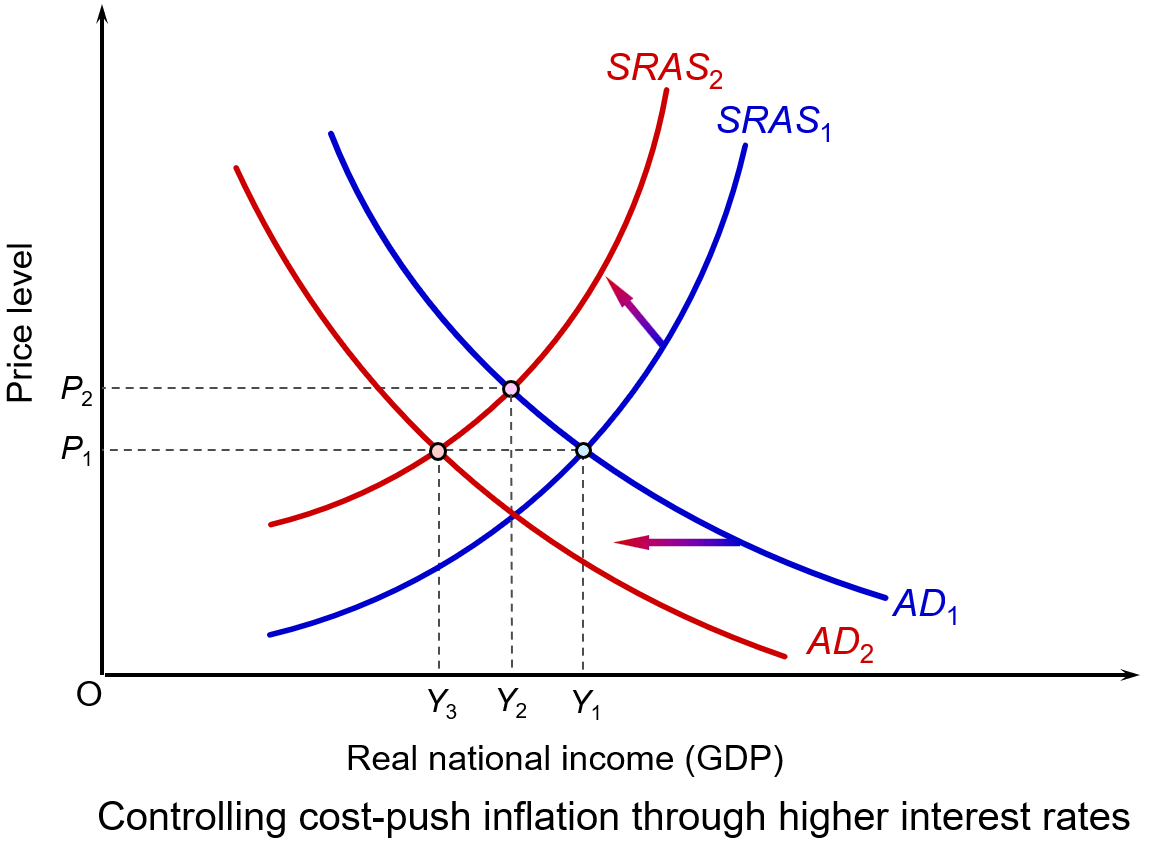 Raising interest rates reduces aggregate demand, or at least its rate of growth. This puts downward pressure on prices, or at least on the rate of inflation. This can be illustrated in the diagram. (Click here for a PowerPoint.)
It shows a country’s initial short-run aggregate supply curve (SRAS1) and initial aggregate demand curve (AD1). The price index is P1 and real GDP is Y1.
The higher costs shift the SRAS curve upwards to the left, say to SRAS2. The price index rises to P2 and real GDP falls to Y2. If, in response to the higher prices, the central bank raises the interest rate, this shifts the aggregate demand curve to the left, say to AD2. As a result, the price index falls back to P1, but the fall in demand causes real GDP to fall further, to Y3.
Policy alternatives
 So, is a rise in interest rates the appropriate response to higher costs that push inflation above, or further above, its target, which for most countries is 2%?
If the cause of inflation was excessive increases in aggregate demand from, say, large government budget deficits or a large increase in consumer demand, then a rise in interest rates would have helped reduce this unsustainable rise in demand. But if the cause of the inflation is a supply shock, is curbing aggregate demand the correct solution?
Ideally, the solution would be to tackle the cost increases directly. A rise in productivity, for example, would help to increase aggregate supply and counter the effect of rising commodity prices. But productivity increases take place over the longer term and are not a solution to a short-term supply shock. Better still, if the increase in commodity prices could be reversed, by finding a political solution that reopened the Strait of Hormuz and other choke points, then higher interest rates would not be needed.
Alternatively, some countries might be able to resort to price controls. These could be targeted at specific sectors such as energy, rent or construction. For example, the UK government has used energy price caps to limit household energy bills.
But even though this may control inflation in the short term, price controls create shortages because demand exceeds the reduced supply. This could lead to higher prices in unofficial markets as people sought to avoid the price controls. It could also create considerable problems for firms planning their logistics when supplies may simply not be available.
Alternatively, subsidies could be used to support output or prices in similar areas. Or they could be targeted at low-income households. These, however, could be costly for governments and may distort markets.
If price controls and subsidies are rejected, and in the absence of short-term increases in aggregate supply, the only solution to inflation is curbing aggregate demand to match the reduced aggregate supply. This could be achieved through fiscal policy by raising taxes or reducing government expenditure, but would prove unpopular and would probably be rejected by governments. Generally, they would prefer to pass the burden to central banks through the use of monetary policy.
The blunt instrument of monetary policy
But, raising interest rates is, indeed, a blunt instrument. Tighter monetary policy cannot increase the global supply of fuel, fix broken supply chains or lower insurance and construction costs. In other words, it cannot directly fix supply shocks, only limit their effect on prices.
 Also, by making borrowing more expensive, higher interest rates may suppress business investment and house building. This adverse supply-side effect may worsen inflation over the longer term.
The hope is that such effects will be avoided by suppressing inflation and helping thereby to maintain business confidence. It is a delicate balancing act for central bankers, who want to constrain inflation but do not want to plunge their economies into recession and damage longer-term increases in potential real GDP.
Most of all, the hope is that by suppressing nominal demand, second-round effects will be avoided. These are where higher prices encourage workers to demand higher wages to compensate for higher prices and businesses to raise prices to cover those wage increases, knowing that they can pass these price increases on to consumers as their competitors are doing the same. This risks creating a damaging wage-price spiral and embedding inflation. By raising interest rates and signalling that they will bring inflation back down to the target rate, central banks hope to anchor long-term inflation expectations. They hope that this will ensure that temporary price shocks do not become permanently embedded in the economy.
Distributional consequences
 However, the burden of higher interest rates will not be shouldered equally. They predominantly penalise a minority of the population, especially younger households with consumer debt and/or large variable-rate mortgages relative to their income or fixed rate mortgages coming the end of their term and requiring renewing. They also penalise businesses which rely on short-term debt.
Meanwhile, people who own their homes outright or wealthy savers may be largely unaffected or even benefit from higher yields on their savings deposits. Similarly, firms with low debt may hardly be affected.
Consequences for servicing public debt
Higher interest rates increase governments’ debt-servicing costs. More has to be paid on new borrowing, either to finance budget deficits or to replace government bonds and bills that are maturing. This consumes a larger share of public spending and limits the fiscal room to support vulnerable households suffering from the price and interest increases.
We examined such costs in the US context in the blog US national debt reaches $40 trillion: but does it matter?.
Fingers crossed!
By being cautious about raising interest rates, central banks hope that geopolitical developments will be favourable and that the supply constraints will diminish. For example, the hope is that there will be a settlement between the USA and Iran that allows oil to flow once more through the Strait of Hormuz. That is why, despite inflation being well above target, central banks have been raising interest rates by just a quarter of a percentage point.
Articles
- US interest rates raised for first time in three years
BBC News, Michael Race (17/9/26)
- What the Fed interest rate hike likely means for borrowers and savers
NBC4 New York, Paul Wiseman (16/9/26)
- How increasing interest rates could reduce inflation, but potentially cause a recession
CNBC, Trina Paul (21/9/26)
- Interest rates held but Bank signals rise if energy prices stay high
BBC News, Dearbail Jordan and Kevin Peachey (17/9/26)
- Bank of England defies Fed’s rate-hike lead, leaving rates unchanged
CNBC, Chloe Taylor (17/9/26)
- ECB hikes rates to 2.5% as energy shock pushes eurozone inflation higher
Euronews, Quirino Mealha (10/9/26)
- Japan raises interest rates to 31-year high to curb impact of rising prices
The Guardian, Mark Sweney (18/9/26)
- What exactly is inflation, and are interest rates the only option for dealing with it?
The Conversation, Luke Hartigan (10/2/26)
- US consumers and businesses are now facing a future of more expensive borrowing
The Conversation, John W Diamond (16/9/26)
- Inflation: raising interest rates was never the right medicine – here’s why central bankers did it anyway
The Conversation, Robert Gausden (20/10/23)
- There are three main reasons inflation is rising. Higher rates won’t fix them
ABC (Australia), Michael Janda (15/9/26)
- Higher interest rates are meant to lower inflation. US economist John Cochrane says there’s only ‘shaky’ evidence it works
ABC (Australia), Michael Janda and Alicia Barry(15/3/24)
- How Governments Fight Inflation with Monetary Policies
Investopedia, Leslie Kramer (11/3/26)
- Interest rates are not the tool to solve the inflation caused by the US’s war with Iran
The Guardian, Josh Ryan-Collins (18/3/26)
- Are higher interest rates the only tool for managing inflation?
Rethinking Economics, Tim Thornton (3/8/23)
Videos
Information
Questions
- What policies have central banks pursued during the Iran war?
- Paint an optimistic scenario for the global economy five years hence.
- Paint a pessimistic scenario for the global economy five years hence.
- Compare the reasons given by the Federal Reserve and ECB for raising interest rates with those given by the Bank of England for not raising them.
- Donald Trump argues for cutting interest rates as a stimulus to the US economy. Provide a critique of this policy.
 Unemployment in the UK reached its highest level in nearly five years at the close of 2025, according to new data from the Office for National Statistics. Figures show the unemployment rate rising to 5.2% in the three months to December, up slightly from 5.1% in the preceding quarter.
This marks the highest unemployment level since the pandemic, coinciding with a slowdown in wage growth and increasing speculation that interest rates may soon be lowered.
Youth unemployment
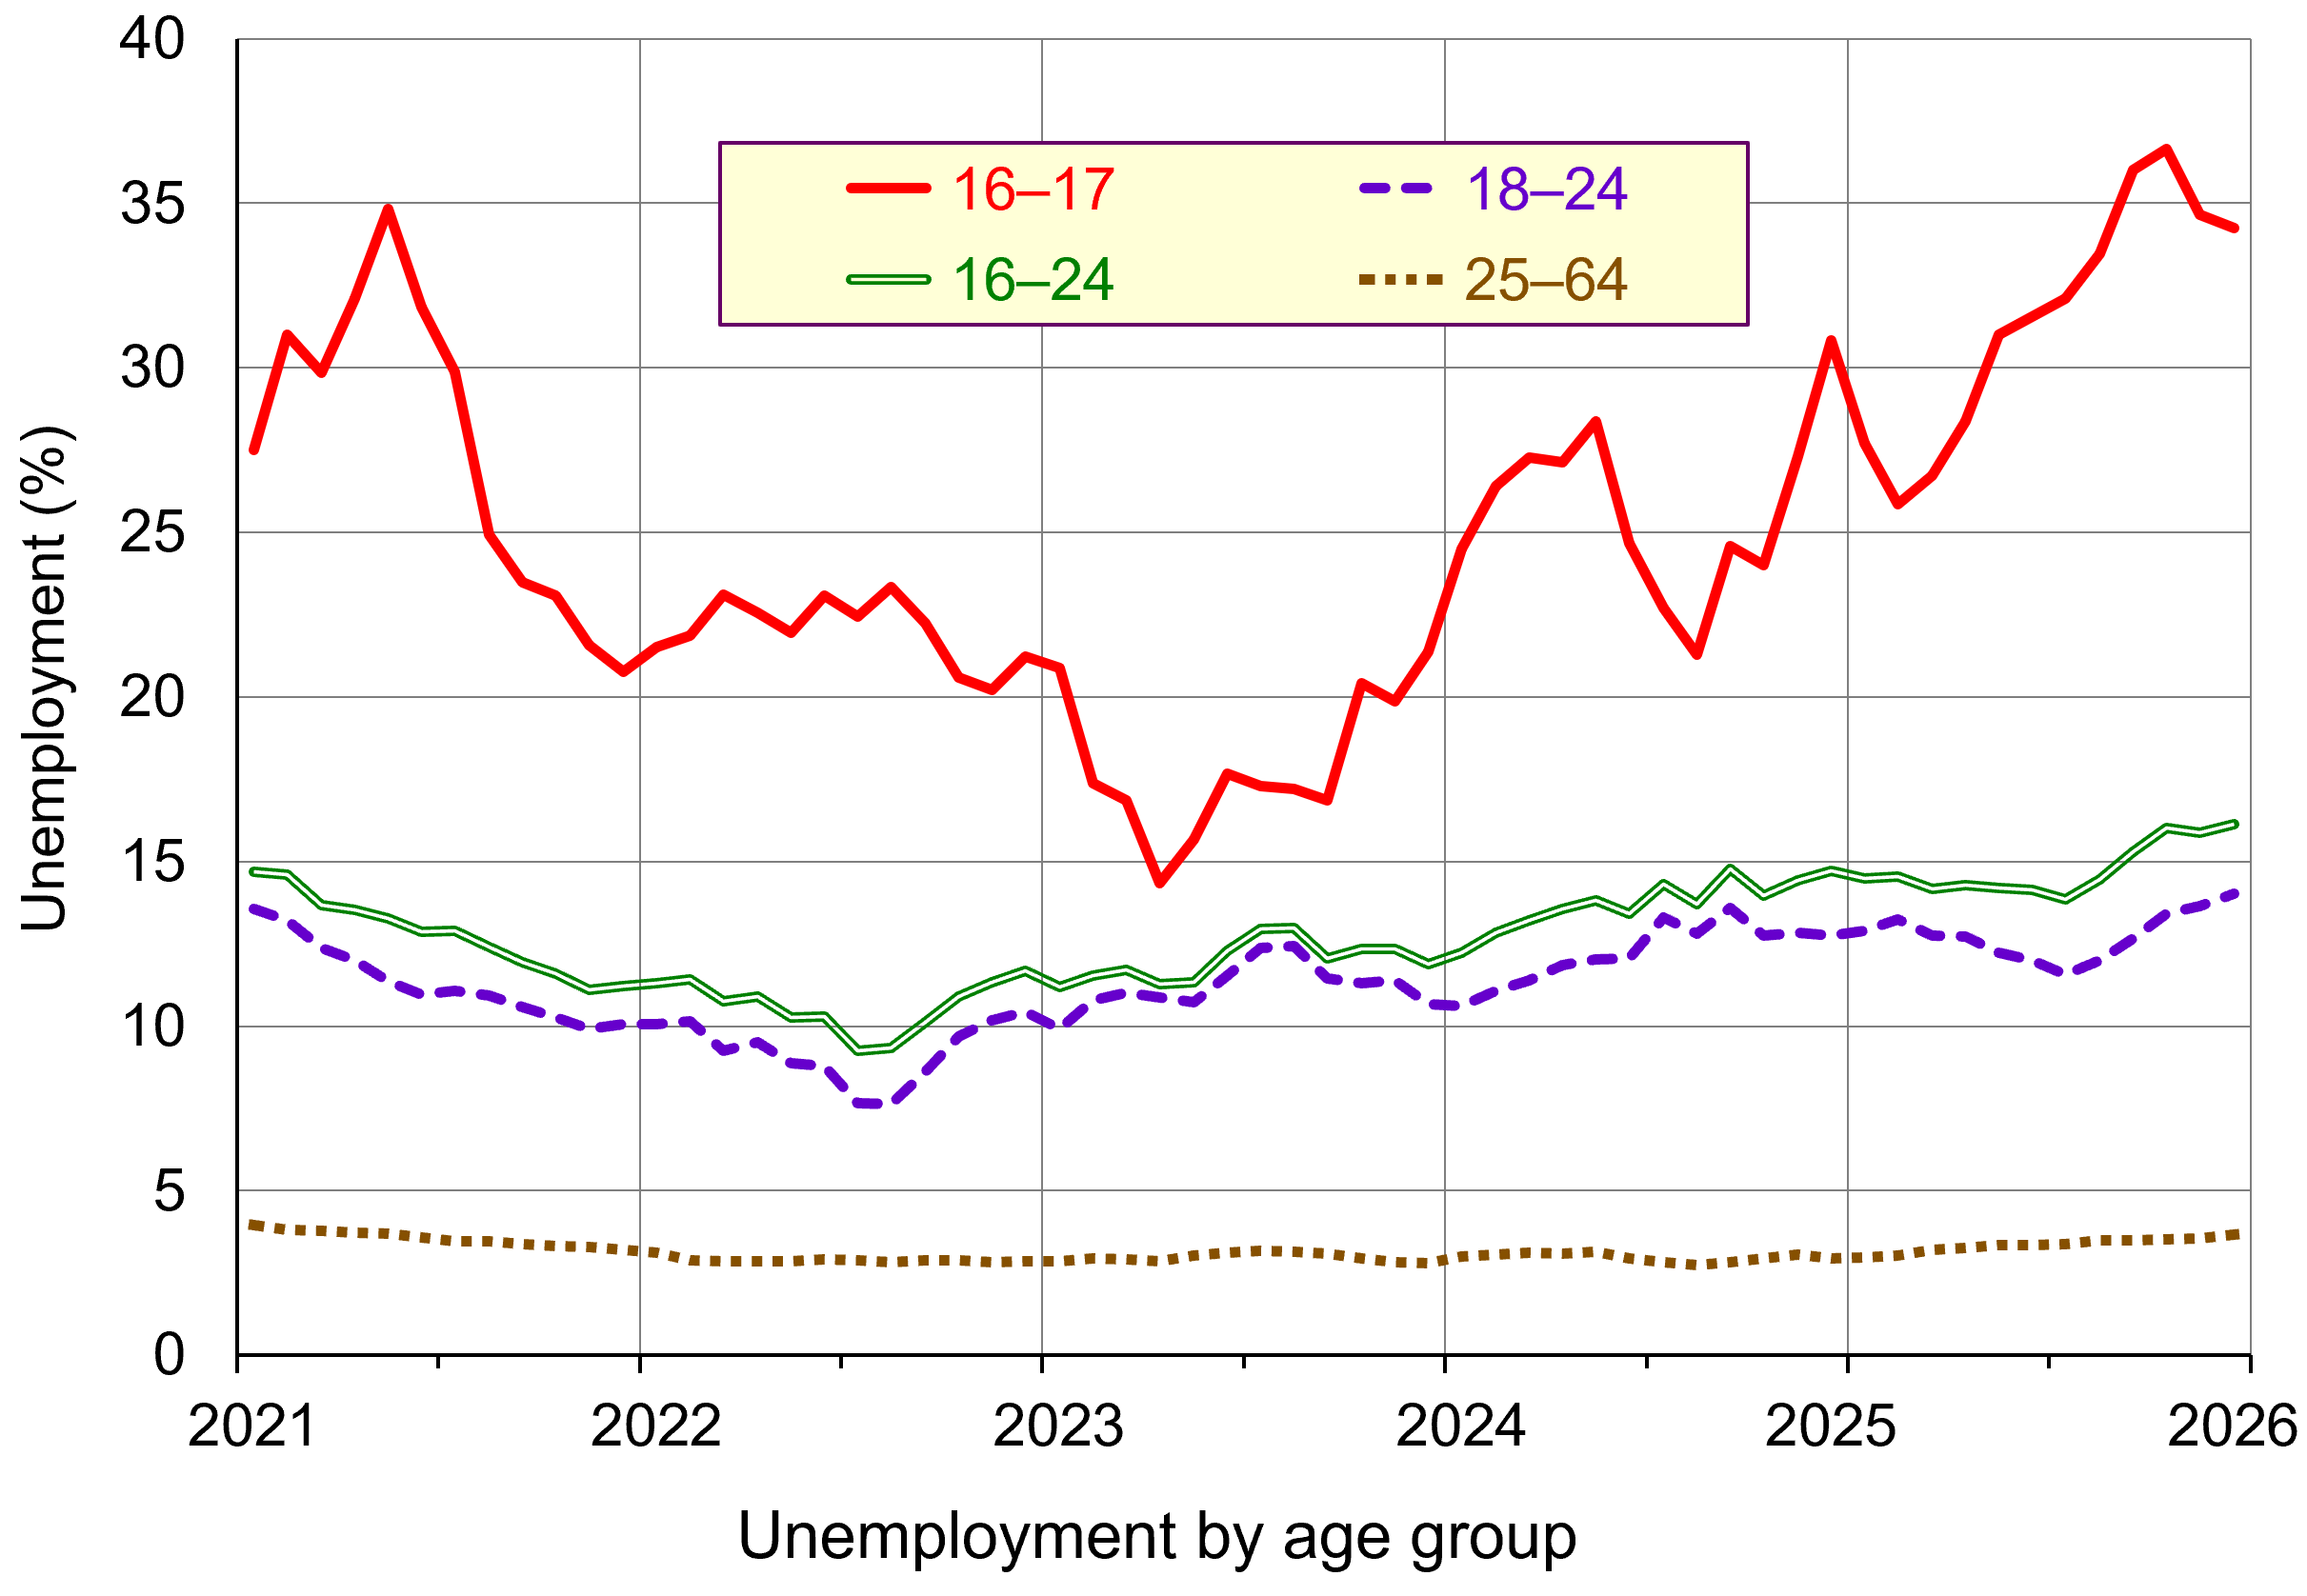 However, young people are taking the heaviest hit, with unemployment climbing to 16.1% among those aged 16 to 24. (Click here for a PowerPoint of the chart.) This is the highest level in more than a decade, including the spike seen during the pandemic. Economists largely attribute this trend to rising payroll costs, which they say are discouraging employers from offering entry level roles. Long-term youth unemployment is also worsening, with recent data showing that a growing share of unemployed young people have been out of work for over 12 months, highlighting deeper and more persistent barriers to re entry.
At the same time, although wages for those in work continue to grow faster than prices, the pace of wage growth is steadily slowing, adding further pressure on young people already facing the most challenging labour market conditions in years. According to ONS data, the annual growth in average weekly wages, excluding bonuses, slowed to 4.2% in the last three months of 2025. Private-sector wage growth eased to 3.4%, bringing it closer to the 3.25% rate that the Bank of England believes is consistent with its 2% inflation target.
The impact on interest rates
 The Bank of England is watching the slowdown in the UK jobs market closely as it gauges when next to lower its interest rates. In February 2026, the Monetary Policy Committee voted to hold the base rate (Bank Rate) at 3.75%. However, the committee voted with a majority of 5-4, with four members voting to reduce the rate to 3.5%.
The Bank of England uses interest rates as a policy tool to control inflation, the rate at which general prices rise in the economy. The current rate of inflation of 3.4% is above the Bank of England’s target of 2%.
In addition to the split vote, some economists believe that the easing in pay growth makes it likely that Bank Rate will be cut at the next meeting on 19th March. Paul Dales, chief UK economist at Capital Economics, said the fall in wage growth ‘supports the idea that the Bank of England has at least a couple more interest rate cuts in its locker’. A decrease in interest rates will be welcomed by investors.
What is behind the increase in youth unemployment?
Young people always tend to be the most impacted by a downturn in hiring. But economists warned that the rise in youth unemployment was a sign that employers are being more cautious about hiring younger workers. Openings for low-skilled entry-level roles and for new graduates have dropped steeply. Many businesses have slowed hiring due to an increase in costs because of measures in Chancellor Rachel Reeves’s last two Budgets. Businesses claim that the combination of increases in employer National Insurance contributions and a rise in the minimum wage mean they are facing higher payroll costs.
Peter Dixon at the National Institute for Economic and Social Research said, ‘there are indications that younger workers in particular are being priced out of the market’, supporting the explanation that raising the minimum wage might also be disincentivising the hiring of young people.
The ONS reported that the retail and wholesale sector saw the biggest fall in the number of workers on company payrolls, with 65,000 jobs lost in the sector since January last year. Meanwhile, health and social work saw the biggest rise in payrolled workers of any sector, adding 39,000 jobs in the year to January. Financial analyst at AJ Bell, Danni Hewson, suggested that those leaving the retail sector were now entering healthcare, with both sectors employing large numbers of women. However, she also warned that a recent surge in investment in artificial intelligence could hit young people the hardest as it could result ‘in a scarcity of entry level posts’ (see the blog Will AI make the world less equal?.
Job vacancies
 Job vacancy data across the UK indicates a significant cooling in labour demand. According to the latest ONS figures, vacancies fell from 736,000 in the three months to December to 726,000 in January, signalling continued weakening in hiring activity. According to the job search site, Adzuna, the number of vacant positions has dropped to its lowest level in five years, with job listings sliding 3% in January to 695,000, marking the first time vacancies have dipped below 700,000 since early 2021. Notably, graduate opportunities have fallen below 10,000 for the first time since Adzuna started tracking in 2016, underscoring the deepening challenges for new entrants to the workforce.
This downward trend in job openings extends patterns seen throughout late 2025, with vacancies down 16% from the previous January and nearly 20% lower than six months earlier. This coincides with a rise in unemployment to 5.2%, slower wage growth, and a growing concern that young people are disproportionately affected as hiring slows. As opportunities shrink, competition has intensified: there are now 2.4 jobseekers per vacancy, up from 2.27 in December, with the most sought-after roles including warehouse staff, healthcare support workers, lorry drivers, labourers and kitchen assistants.
How can the situation be improved?
Pat McFadden, Secretary for Work and Pensions, has commissioned the former Health Secretary Alan Milburn to lead a review into the causes of rising youth inactivity. There will be a particular focus on mental health issues that are pushing young people out of education and employment. This initiative responds to the growing number of young people not in education, employment, or training (NEETs), many of whom are now classified as inactive rather than unemployed. Some receive health-related benefits and are therefore not required to look for work, while others fall outside the benefits system entirely, making them harder to identify and support.
However, Pat McFadden said there was ‘more to do to get people into jobs’, and that tackling youth unemployment is a key government priority. He added that Labour was working to make it easier for young people to find and secure an apprenticeship, supported by a wider package of reforms. The reforms announced by McFadden include creating 50,000 additional apprenticeships. The government will also expand support for 350,000 people to move into work or training in sectors such as care and construction, with the risk of losing benefits if they refuse. They also include the provision of 55,000 state-funded, six-month work placements for the long-term unemployed.
While these measures are widely seen as necessary, campaign groups argue the government should go further by extending its ‘Youth Guarantee’ to cover all young people up to age 24, rather than ending at 22.
 However, as Alice Martin, head of research at Lancaster University’s Work Foundation, notes, initiatives designed to help people return to the labour market have limited impact ‘if the jobs aren’t out there.’ Even graduates are finding that opportunities are scarce, and for those leaving education with few qualifications, the situation is even more challenging. Sectors such as retail, once a reliable source of first jobs, have been in long-term structural decline, a trend that is now accelerating and further narrowing the pathways available to young people entering the workforce.
The situation has prompted government discussions about postponing the planned rise in the minimum wage for 18- to 20-year-olds to address employers’ concerns and encourage more youth employment. However, on Wednesday, Keir Starmer stressed that Labour remains committed to its manifesto pledge to align the pay of younger workers with that of older employees. The Prime Minister confirmed that the promise to ‘remove the discriminatory age bands’ in the minimum wage system still stands, and that the increase scheduled for April will proceed as planned.
Starmer said ‘We’ve made commitments to young people in our manifesto, and we will keep to those commitments, including the commitment that we would make sure that the living wage and minimum wage will go up this April, which we can absolutely confirm to you will happen.’
Unemployment outlook
Multiple economic forecasts predict that unemployment will to continue to rise in 2026. The most frequently cited projection places the 2026 unemployment rate around 5.2%–5.5%. However, some economists expect businesses to regain confidence and begin hiring again later in the year, supporting a gradual stabilisation in job markets.
Yet risks remain significant: if that recovery fails to materialise, unemployment could edge toward 6% by the end of the year, with forecasts from JP Morgan suggesting unemployment may reach 2 million in the first half as firms delay recruitment following the recent rise in the employers’ National Insurance rate. This environment is proving especially challenging for young people, with early career opportunities among the first to disappear and delayed entry into work potentially limiting long-term earnings and progression.
As hiring becomes more cautious and entry-level roles tighten, the path into the labour market risks becoming narrower, underscoring the need for policies and conditions that support both employer confidence and opportunities for new entrants.
Articles
FT Articles (subscribers only)
Data
Questions
- Explain why youth unemployment has risen more sharply than overall unemployment at the end of 2025.
- What are the costs to the individual of being unemployed?
- What are the wider non-monetary costs to society?
- Explain the main financial costs to the wider economy of a rising unemployment rate.
- Assess the likely impact of slowing wage growth on the Bank of England’s decision about whether or not to cut interest rates in early 2026.
- Discuss how falling job vacancies, particularly graduate and entry‑level opportunities, might affect long‑term labour market outcomes for young people.
- Evaluate the effectiveness of government policies such as expanding apprenticeships, increasing work placements, and reviewing youth inactivity in reducing youth unemployment.
 Have you noticed that many products in the supermarket seem to be getting smaller or are poorer quality, or that special offers are not as special as they used to be? When you ring customer services, does it seem that you have to wait longer than you used to? Do you now have to pay for extras that used to be free? These are all ways that producers try to pass on cost increases to consumers without rising prices. There are three broad ways in which producers try to hide inflation.
The first is called ‘shrinkflation’. It is defined as having less product in the same package or a smaller package for the same price. For example, reducing the number of chocolates in a tub, reducing the size of a can of beans, jar of coffee or block of butter, reducing the number of sheets in a toilet roll, or the length of a ride in a fairground or portion sizes in a restaurant or takeaway. A 2023 YouGov poll revealed that 75% of UK adults are either ‘very’ or ‘fairly’ concerned about shrinkflation. A similar poll in 2025 showed that this figure had increased to 80%. The product category with the greatest concerns was snack foods (e.g. crisps, confectionery items, nuts, etc.).1
The second form of hidden inflation is called ‘skimpflation’. This is defined as decreasing the quality of a product or service without lowering the price. Examples include cheaper ingredients in food or confectionery, such as using palm oil instead of butter, or reducing the cocoa content in chocolate or the meat content in sausages and pies, or package holidays reducing the quality of meals, or customer service centres or shops reducing the number of staff so that people have to wait longer on the phone or to be served.
The third is called ‘sneakflation’. This is similar to skimpflation but normally refers to reducing what you get when you pay for a service, such as a flight, by now charging for extras, such as luggage or food. Sometimes shrinkflation or skimpflation are seen as subsets of sneakflation.
 These practices have had a lot of publicity in recent months, with consumers complaining that they are getting less for their money. Many people see them as a sneaky way of passing on cost increases without raising the price. But the changes are often subtle and difficult for shoppers to spot when they are buying an item. Skimpflation especially is difficult to observe at the time of purchase. It’s only when people consume the product that they think that it doesn’t seem as good as it used to be. Even shrinkflation can be hard to spot if the package size remains the same but there is less in it, such as fewer biscuits in a tin or fewer crisps in a packet. People would have to check the weight or volume, while also knowing what it used to be.
If firms are legitimately passing on costs and are up-front about what they are doing, then most consumers would probably understand it even if they did not like it. It’s when firms do it sneakily that many consumers get upset. Also, firms may do it to increase profit margins – in other words, by reducing the size or quality beyond what is necessary to cover the cost increase.
Does the official rate of inflation take such practices into account?
 The answer is that some of the practices are taken into account – especially shrinkflation. The Office for National Statistics (ONS) accounts for shrinkflation by monitoring price changes per unit of weight or volume, rather than just the price. Data collectors track the weight, volume or count of item. When a product’s size is reduced, the ONS records this as a price increase in CPI or CPIH inflation statistics. This is known as a ‘quality adjustment’ process and allows the ONS to isolate price changes from product size changes. As CPI data from the ONS is used by the Bank of England in monitoring its 2% inflation target, it too is incorporating shrinkflation.
ONS quality adjustments are also applied to non-market public services, such as healthcare, education and policing to measure changes in service quality rather than just volume. This allows a more accurate measurement of productivity as it focuses on outcomes and user experience per pound spent rather than just focusing on costs.
Skimpflation is more difficult to monitor. The quality adjustment process may miss some quality changes and hence some skimpflation goes unrecorded. This means that the headline inflation rate might understate the true decline in purchasing power felt by consumers.
How extensive is hidden inflation?
Despite public perception, shrinkflation has a relatively small impact on the headline CPI and CPIH inflation rate in the UK because it is largely confined to certain sectors, such as bread and cereals, personal care products, meat products, and sugar, jams, syrups, chocolate & confectionery. Nevertheless, in these sectors it is particularly prevalent, especially in the packaged foodstuffs and confectionery sector. The latest research by the ONS in 2019 covered the period June 2015 to June 2017 and is shown in the following figure.2
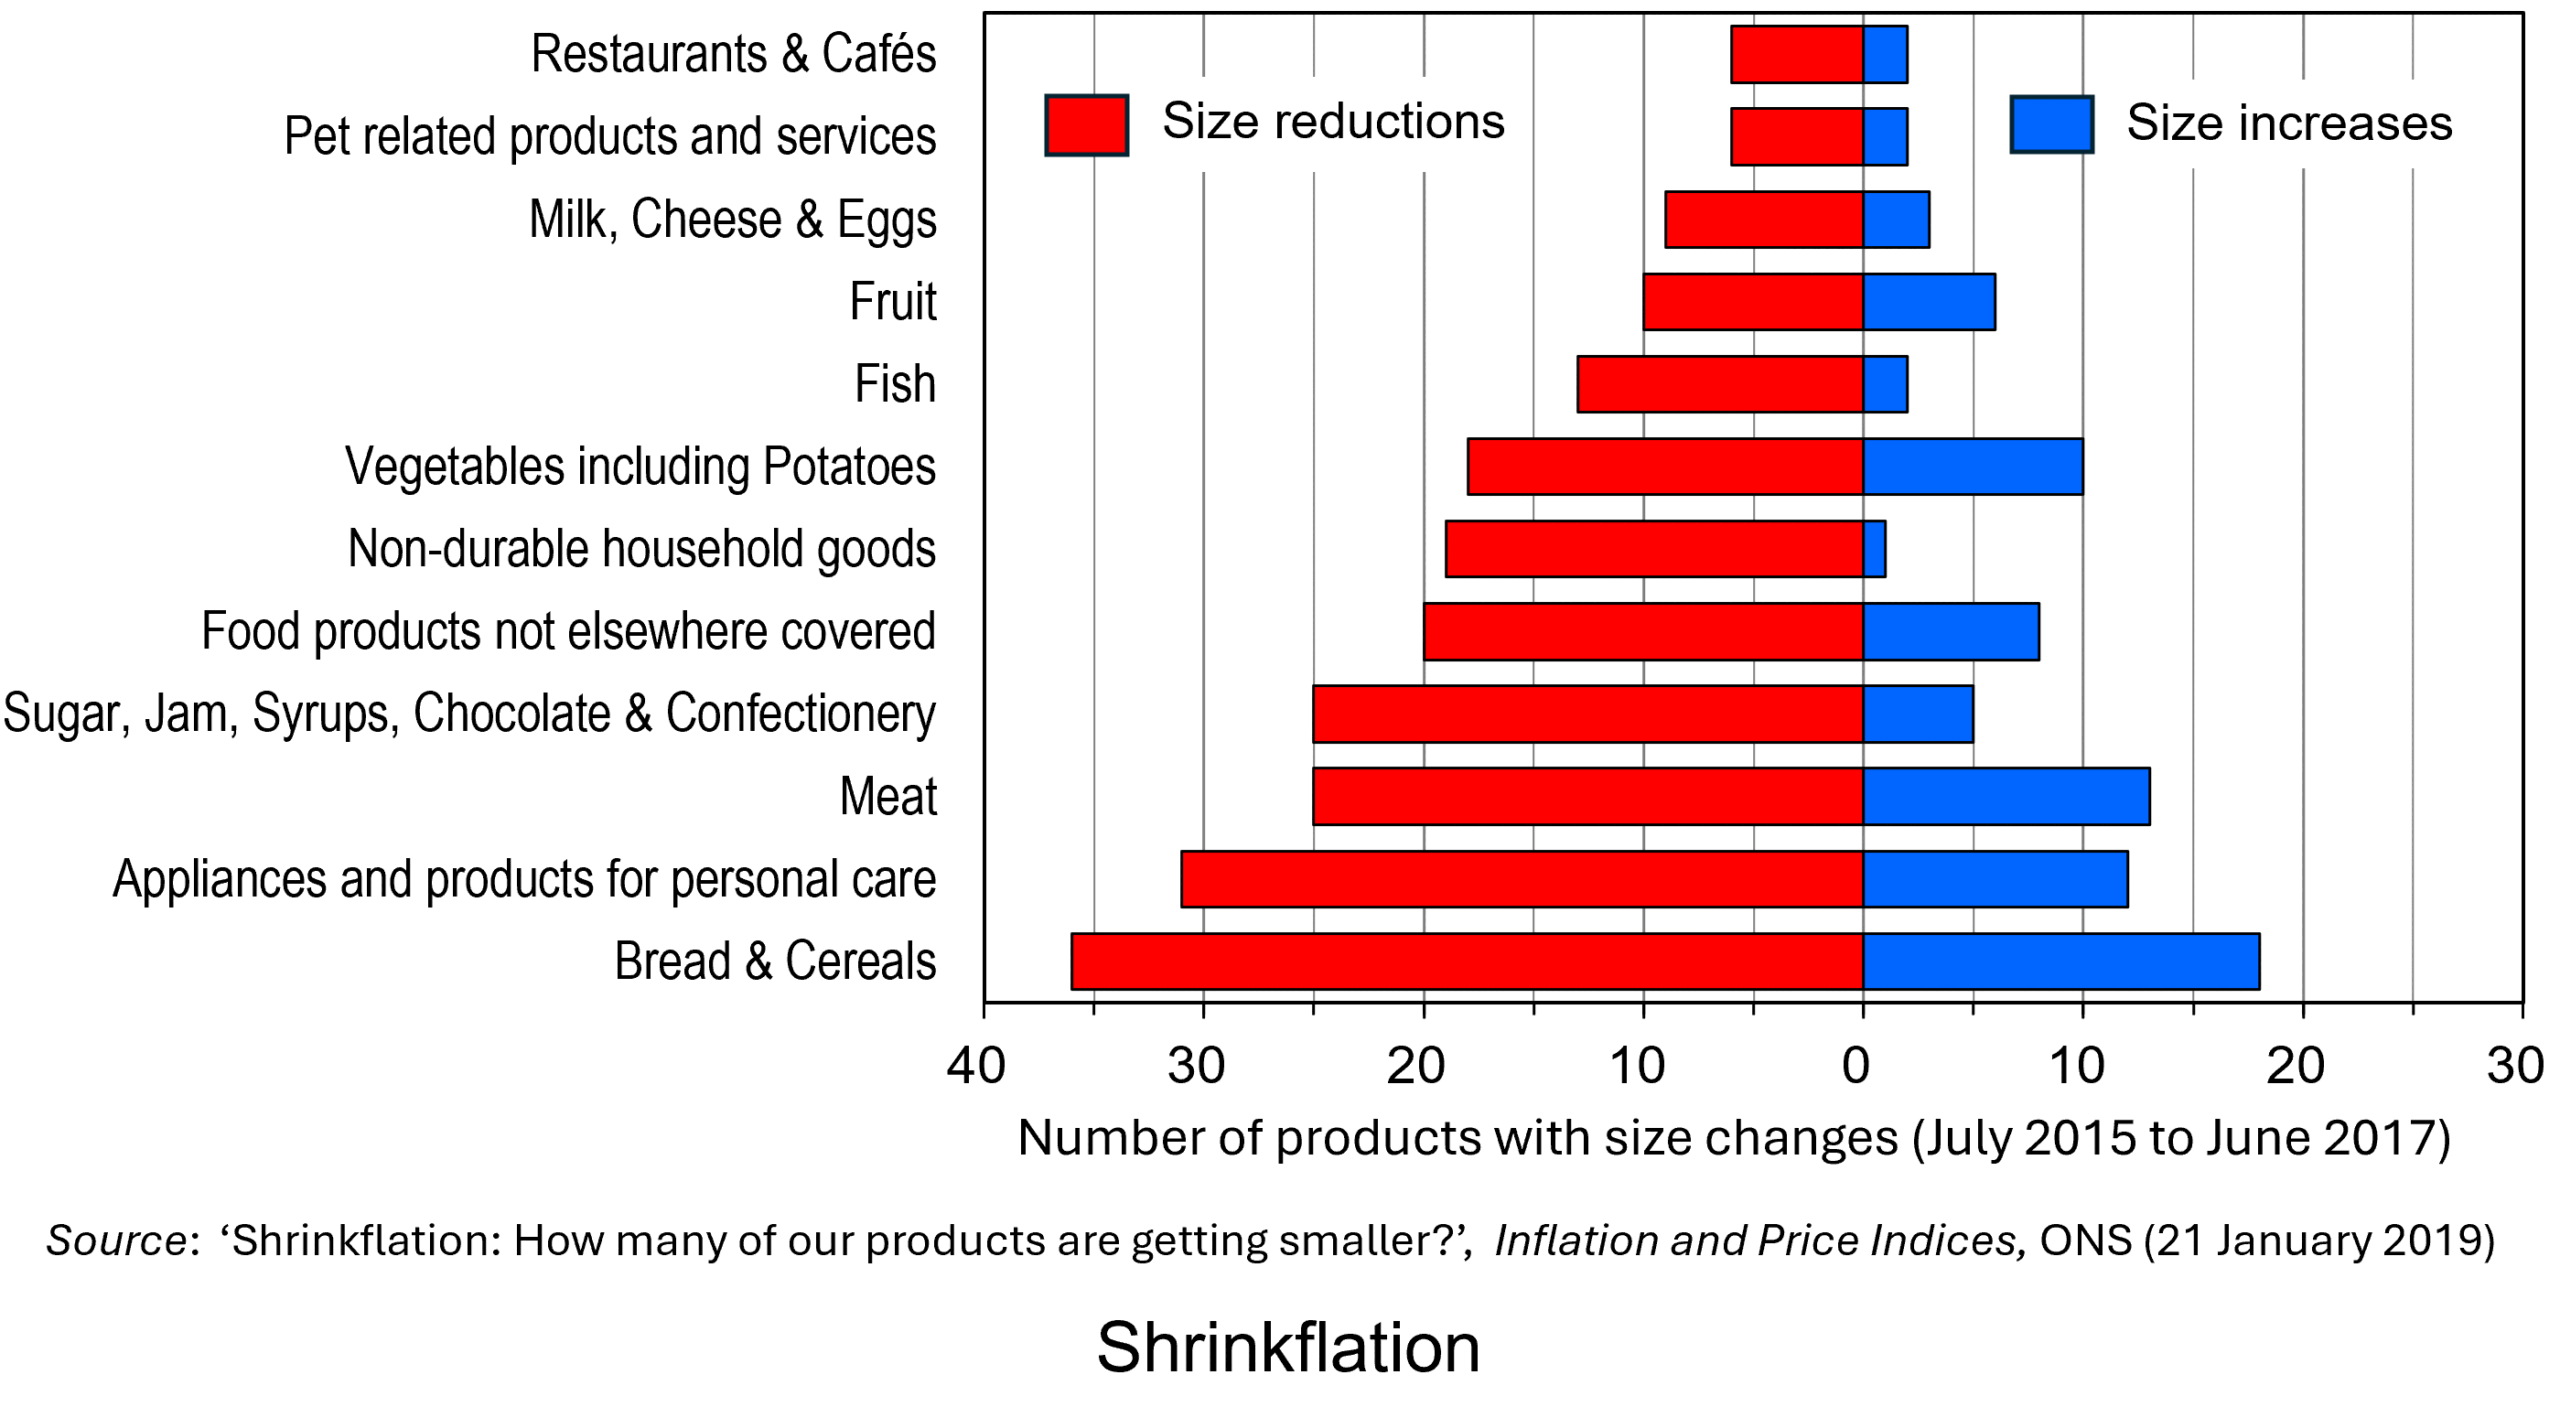
According to research in the USA by Capital One Shopping, some major brands reduced product sizes by over 30% in 2025 without reducing prices, with shrinkflation averaging 14.8% among selected national grocery brands.3 Shrinkflation had been observed by 74% of Americans at their grocery store. Of these, 81% took some kind of action as a result, with 48% abandoning a brand. Nevertheless, across all products, shrinkflation accounts for quite a small percentage of any overall price rises.
A US Government Accountability Office (GAO) report found that shrinkflation accounted for less than 1/10 of a percentage point of the 34.5% increase in overall consumer prices from 2019 to 2024.4 The reason is that the items that were downsized comprised a small percentage of goods and services. Indeed, many goods and services, such as housing, cannot be downsized in the same way that household products can.
Nevertheless, with consumer budgets being squeezed by the inflation that followed the pandemic and the Russian invasion of Ukraine, hidden inflation has become more prevalent in many countries and an increasing concern of consumers.
References
- Shrinkflation concern rises in 2025, but fewer Britons are changing shopping habits
YouGov (15/8/25)
- Shrinkflation: How many of our products are getting smaller?
Office for National Statistics (21/1/19)
- Shrinkflation Statistics
Capital One Shopping (30/12/25)
- What is “Shrinkflation,” And How Has It Affected Grocery Store Items Recently?
U.S. Government Accountability Office (12/8/25)
Videos
Articles
- Shrinkflation: How many of our products are getting smaller?
Office for National Statistics (21/1/19)
- Shrinkflation: Inflation hiding in plain sight
Britannica Money, Doug Ashburn (21/7/25)
- Shrinkflation: the brands charging you more for less
Which?, Ellie Simmonds (28/10/25)
- 7 Surprising Ways Inflation Is Still Rising Even as Prices Slow This Year
SavingAdvice.com, Teri Monroe (3/2/26)
- 22 Real-Life Examples Of Shrinkflation That People Have Spotted In The Last Few Weeks That Are Honestly Infuriating
BuzzFeed, Megan Liscomb (10/12/25)
- Shrinkflation: smaller products hurt some households more than others – and can be bad for business
The Conversation, Erhan Kilincarslan (14/1/26)
- Shoppers brand the UK “a disgrace” as Cadbury Mini Egg prices rise by 105% on pre-pandemic levels
Food Manufacture, Thomas West (6/1/26)
- This article is more than 3 months old Shrinkflation hits everyday staples, piling more pressure on households
The Guardian, Sarah Marsh and Sarah Butler (28/12/25)
- Shrinkflation isn’t slowing down — It’s just getting harder to spot
ConsumerAffairs, Kyle James (13/1/26)
- Shrinkflation – are brands and supermarkets required to inform consumers if a product has been reduced in size or quantity but the packaging looks the same?
CMS Law-Now, Loïc de Hults and Tom Heremans (25/9/25)
- Study reveals shrinking package sizes hide significant food inflation
Phys.org, Aaron Kupec (28/1/26)
Journal Article
Questions
- If shrinkflation, when included in CPI statistics, accounts for such a small percentage of inflation, why are people so concerned about it?
- From a company’s perspective, is it a good idea to engage in (a) shrinkflation; (b) skimpflation?
- Go round you local supermarket and identify examples of shrinkflation and skimpflation.
- How are various EU countries attempting to inform consumers of shrinkflation?
- Why is skimpflation often harder to detect than shrinkflation?
- Give some other examples of sneakflation in the provision of services.
- How could behavioural economists help firms decide whether or how to engage in shrinkflation or skimpflation?
On the 29 November, the Bank of England published the results of its latest stress test of the UK financial system. Annual stress testing was introduced in the wake of the 2008 financial crisis. It models the ability of the financial system to withstand severe macroeconomic and financial market conditions. Typically, the focus has been on testing the resilience of the banking system.
This year’s was the first system-wide exploratory scenario (SWES). This recognises the growing significance of ‘shadow banking’. Shadow banking involves borrowing and lending involving non-bank financial institutions (NBFIs). Such institutions sit outside the regulatory cordons around banking but have become significant actors in the financial system.
However, this obscure part of the financial system poses systemic risks which are not clearly understood and from time to time require costly interventions. Examples include: problems in liability-driven investments (LDIs) for pension funds in September 2022; the money market liquidity crisis involving hedge funds in March 2020; the collapse of Long-term Capital Management (LTCM) in 1998 following the Russian Federation’s default (LTCM had significant holdings of Russian government bonds – see linked article on LTCM below).
The growing significance of shadow banking means that regulators have become increasingly concerned about the vulnerabilities in the financial system which arise from outside the traditional banking system.
In this blog we will explain stress-testing of the financial system and trace the rise in shadow banking which motivated the recent system-wide exploratory scenario (SWES). We will discuss the findings of the stress test, highlighting the systemic risks of shadow banking. Finally, we will discuss the implications for the regulation and supervision of the financial system.
What is stress testing?
 Stress testing was introduced by the Bank of England after the financial crisis to assess the ability of the financial system to withstand severe economic and market scenarios.
In the run-up to the 2008 financial crisis, the liquidity and capital buffers of many banks had been extremely thin. These were only able to withstand moderate economic shocks and moderate conditions and buckled under the stresses of the crisis.
Regulators argued that the buffers needed to become much more robust and be able to withstand rare but severe economic and market conditions. The stress testing analogy was derived from engineering, where parts are expected to work not just in benign conditions but also in extreme, hostile environments.
Since 2014, the Bank of England has conducted annual stress testing. Stress testing models the impact of adverse economic conditions on banks’ liquidity, profitability and capital. The results are used to set policy for individual banks (microprudential) and for the system as a whole (macroprudential). Stress test results have allowed the Bank to adjust the loss-absorbing capital that banks must hold to reduce their likelihood of failure.
The scope of the testing has expanded over time to incorporate insurers, central counterparties (financial institutions that provide clearing and settlement services between financial traders) and cyber security. The most recent scenario recognised the increasing significance of non-deposit taking financial institutions in channelling credit. Fifty City of London institutions modelled how a period of intense stress would ripple through the shadow banking sector.
The arcane world of shadow banking
 Shadow banking refers to borrowing and lending which occurs outside the banking sector. Traditionally banking involves taking deposits and using these to finance lending.
Shadow banking involves non-deposit taking financial institutions (NBFIs) such as hedge funds, insurance companies, pension funds, private equity funds, as well as some activities of investment banks. These institutions channel funds in different ways from lenders to borrowers. Typically, they use funds from investors to buy securities through financial markets. The emergence and growth of shadow banking has been explained by changing regulation and innovation.
Its first significant period of expansion in the late 1980s was driven by financial innovation. Increased use of ‘disintermediation’ – the replacement of credit channels through banks with ones through markets – meant an increase in the assets invested through NBFIs.
Despite this process playing a major role in the expansion of housing credit in the run-up to the 2008 financial crisis, it was the significant bailouts that banks received that drew the attention of regulators, not the role of shadow banking. This led to more stringent liquidity and capital requirements for banks under the BASEL III international regulations.
This regulatory tightening limited banks’ ability to offer credit, which meant that much of this activity migrated to the shadow banking sector.
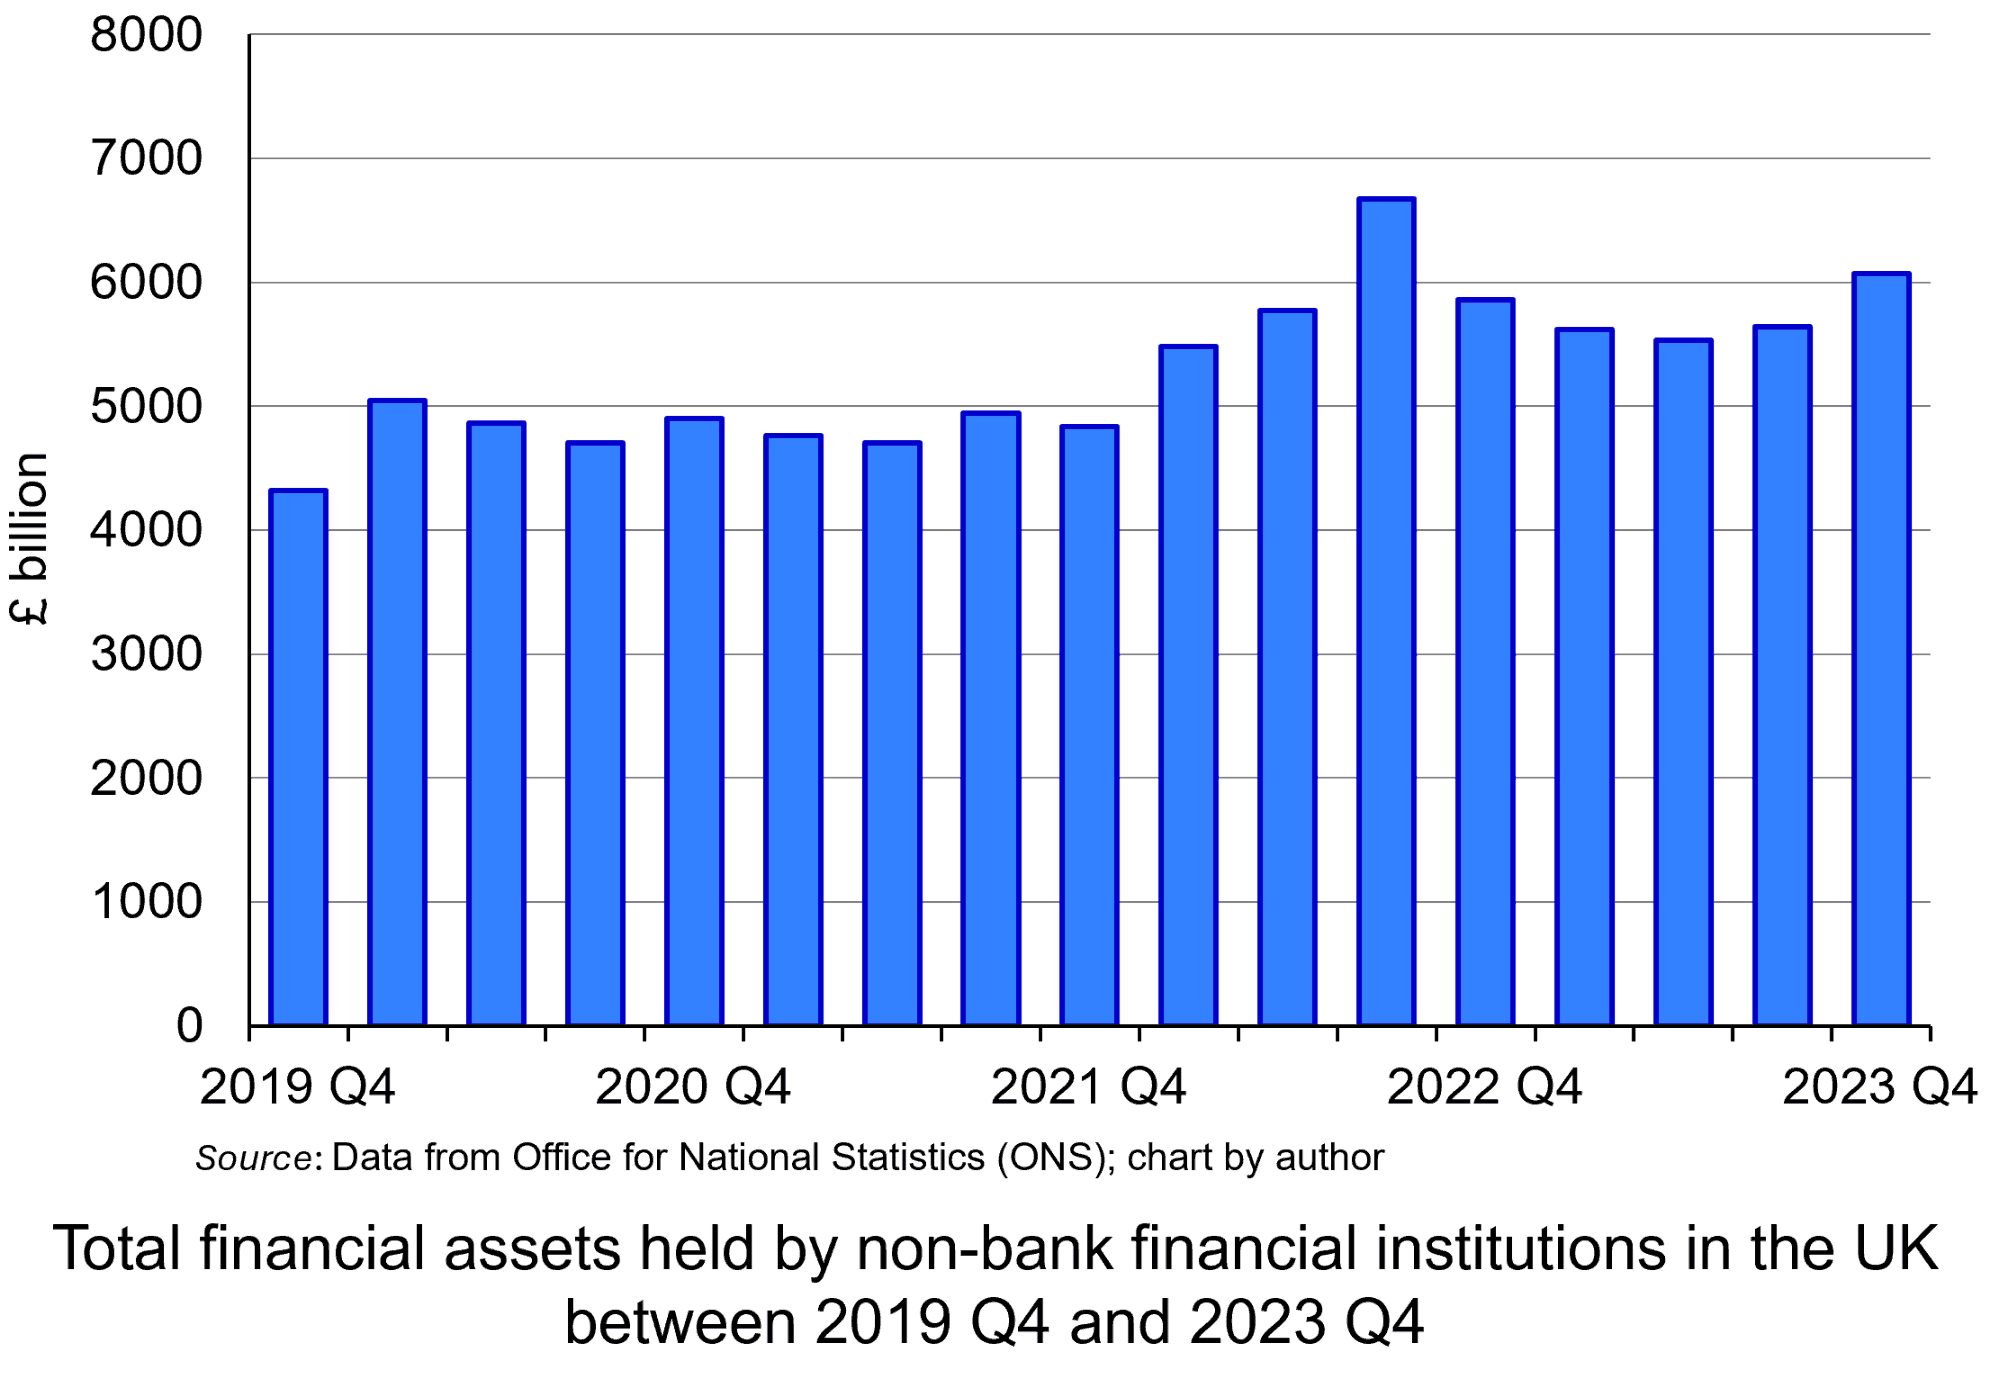 Data from the Bank of England show that the percentage of total assets held by NBFIs rose from 41% in 2007 to 49% in 2020. The chart illustrates the total financial assets held by non-bank financial institutions in the UK between 2019 Q4 and 2023 Q3 (click here for a PowerPoint). The amount held has growth by approximately a third in that time, from £4321bn to £6069bn, peaking at £6670bn in 2022 Q3.
The lack of regulatory oversight stems from the nature of the activities in the shadow banking sector. While NBFIs conduct maturity transformation, provide liquidity and help manage risk, unlike banks, they do not accept deposits and are not part of the payments system involving the general public.
Consequently, the consensus among regulators has been that their activities do not pose the same systemic risks as banking of the breakdown of the payments mechanism and associated collapse in business and consumer confidence. Therefore, NBFIs are not subject to conventional regulation and supervision involving liquidity and capital requirements.
However, as the scale of borrowing and lending running through the sector has grown, this argument has become less difficult to justify. There is a concern that ‘regulatory arbitrage’ is happening and that the systemic risks associated with shadow banking are being underestimated.
The familiar risks of shadow banking
 The systemic consequences of liquidity and solvency problems in the shadow banking sector may not seem obvious. Much of their activities are arcane and technical. However, there are plenty of examples of instances where the problems of hedge funds or pension funds have caused systemic issues.
While the consequences are not the same as those involving banks, in that the payments mechanism is not directly affected, the risks are. Just like banks, these institutions are exposed to liquidity risks, credit default risks and counterparty risks. The concern is that they do not have the same levels of liquidity or capital buffers as banks to insulate them from the consequences of such risks. Therefore, it might not take much economic stress for one or more of these institutions to fail and, given the increasing significance and interconnectedness of these activities, impose significant costs on the rest of the financial system.
It was for this reason that the Bank of England conducted its first system-wide exploratory scenario to analyse the impact of economic and market stress on these institutions and assess the nature and extent of systemic risks which resulted. Fifty City of London institutions modelled how a period of intense stress would ripple through the non-bank sector.
The scenario involved rising geopolitical tensions which caused a sharp rise in risk aversion and a demand for higher expected rates of return as compensation. This produced sharp rises in both sovereign and corporate bond yields and matching sharp declines in asset prices (remember bond yield and prices have a negative relationship).
The scenario found that the position and behaviour of NBFIs amplified the shock. These institutions invest significantly in marketable financial securities and their liquidity and solvency are susceptible to such falling prices.
The sharp decline in asset prices triggered margin calls – payments to cover open loss positions in financial securities. In response to these demands, while some NBFIs’ internal risk and leverage measures were breached, others illustrated greater risk-aversion and took precautionary action. These institutions acted to deleverage, derisk and recapitalise. Given the interconnectedness of financial markets, the individual actions of institutions rippled across financial markets, causing problems in other segments.
The significant decline in asset prices led insurance companies and pension funds to seek to improve their liquidity and solvency position by liquidating positions in money market funds and hedge funds. This, in turn, required these funds to seek liquidity. Such institutions tend to rely a lot on the repo market (involving short-term sale and repurchase credit agreements) to provide liquidity to investors. This avoids them having to sell assets. This practice has echoes of the banking sectors use of the short-term wholesale markets in the run-up to the 2008 financial crisis.
 However, the SWES found that while banks were willing to take on some of the risk, their own concerns about liquidity and counterparty credit risk meant they did not offer sufficient short-term liquidity through the repo markets. If such funding dried up because of a higher risk perception, it could compromise the hedge funds’ ability to raise funds, requiring asset sales. This would amplify the shock to financial markets, driving prices of financial securities even lower.
The scenario concluded that the resulting heavy selling could seize up financial markets, particularly the UK sovereign and corporate bond markets, reducing the ability of companies to finance investment. This is a different type of credit crunch from 2008, which was restricted to banks – but a credit crunch, nonetheless.
At the same time, funds may make capital losses as they sell securities in the downturn. This creates solvency problems and the potential for failure.
In the SWES the institutions were often not able to anticipate how their counterparties, investors, or markets they operate in would behave in the stressed scenario, which echoes the experience of banks in 2007 and 2008 – a significant reason for the ‘crunch’ in banking credit was uncertainty about the creditworthiness of counterparties, meaning that banks were not prepared to lend to anybody.
Conclusion
Since the 2008 financial crisis, there has been a tightening of the regulation and supervision of banks which has limited their ability to channel credit. This has produced an expansion in the shadow banking sector.
However, while the shadow banking sector has not been subject to the same regulation and supervision as banks, there are still potential systemic risks associated with its operations. There have been several examples of such risks in the shadow banking sector which have led regulators to pay more attention. These underpinned the 2024 system-wide exploratory scenario (SWES) conducted by the Bank of England.
The scenario showed the possible transmission mechanism through which problems for NBFIs can have broader consequences. The report nevertheless concluded that:
…the UK financial system was well-capitalised, maintained high levels of liquidity and that asset quality remained strong.
Therefore, the UK financial system was resilient enough to withstand problems in shadow banking.
Although the results of the exercise provide a ‘framework of future system-wide analysis which can be embedded in future market-wide surveillance,’ history indicates that risks tend to exist in obscure and arcane parts of the financial system and that these never tend to be fully appreciated until a crisis occurs. This then tends to involve significant costs for taxpayers.
Articles
- Bank of England warns of risks from non-banks in future markets crisis
Financial Times from MSN, Martin Arnold (29/11/24)
- BoE finds non-bank financial firms pose wider risks in crisis periods
Reuters, Lawrence White (2/12/24)
- Finance Firms Beyond Banks Not Ready For Crisis, BOE Warns
Bloomberg from Yahoo finance, Laura Noonan and Greg Ritchie (29/11/24)
- Shadow Banking System: Definition, Examples, and How It Works
Investopedia, Michael Bromberg (18/10/24)
- US Treasuries: the lessons from March’s market meltdown
Financial Times, Colby Smith and Robin Wigglesworth (29/7/20)
- LDI: the better mousetrap that almost broke the UK
FT Alphaville, Alexandra Scaggs and Louis Ashworth (29/9/22)
- Long-Term Capital Management
CFA Institute, Ron Rimkus (18/4/16)
- Neil Woodford: the continuing fallout of a scandal
Financial Times, Owen Walker (19/3/21)
Bank of England documents and reports
Data
Questions
- Explain stress testing.
- What is shadow banking? Explain the factors driving the growth of credit in this part of the financial system.
- Compare and contrast the liquidity problems of banks with those of non-bank financial institutions (NBFIs).
- Analyse how financial crises can heighten problems of asymmetric information in financial markets.
 Global long-term economic growth has slowed dramatically since the financial crisis of 2007–8. This can be illustrated by comparing the two 20-year periods 1988 to 2007 and 2009 to 2028 (where IMF forecasts are used for 2024 to 2028: see WEO Database under the Data link below). Over the two periods, average annual world growth fell from 3.8% to 3.1%. In advanced countries it fell from 2.9% to 1.6% and in developing countries from 4.8% to 4.3%. In the UK it fell from 2.4% to 1.2%, in the USA from 3.1% to 1.8% and in Japan from 1.9% to 0.5%.
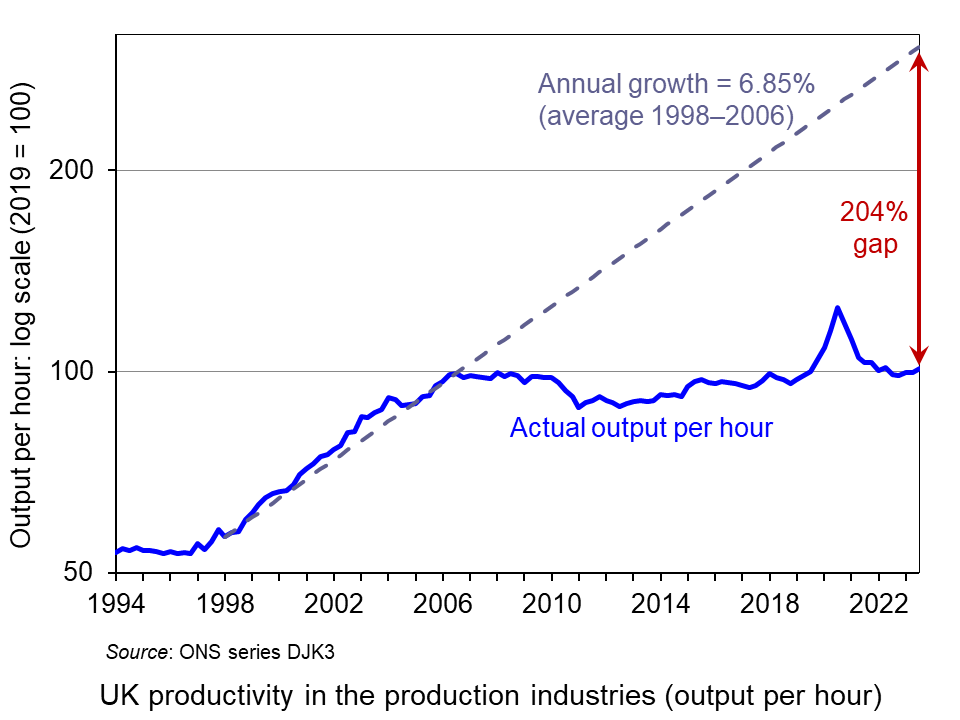 In the UK, labour productivity growth in the production industries was 6.85% per annum from 1998 to 2006. If this growth rate had been maintained, productivity would have been 204% higher by the end of 2023 than it actually was. This is shown in the chart (click here for a PowerPoint).
The key driver of long-term economic growth is labour productivity, which can best be measured by real GDP per hour worked. This depends on three things: the amount of capital per worker, the productivity of this capital and the efficiency of workers themselves – the latter two giving total factor productivity (TFP). Productivity growth has slowed, and with it the long-term rate of economic growth.
If we are measuring growth in output per head of the population, as opposed to simple growth in output, then another important factor is the proportion of the population that works. With ageing populations, many countries are facing an increase in the proportion of people not working. In most countries, these demographic pressures are likely to increase.
 A major determinant of long-term economic growth and productivity is investment. Investment has been badly affected by crises, such as the financial crisis and COVID, and by geopolitical tensions, such as the war in Ukraine and tensions between the USA and China and potential trade wars. It has also been adversely affected by government attempts to deal with rising debt caused by interventions following the financial crisis and COVID. The fiscal squeeze and, more recently higher interest rates, have dampened short-term growth and discouraged investment, thereby dampening long-term growth.
Another factor adversely affecting productivity has been a lower growth of allocative efficiency. Competition in many industries has declined as the rate of new firms entering and exiting markets has slowed. The result has been an increase in concentration and a growth in supernormal profits.
In the UK’s case, growth prospects have also been damaged by Brexit. According to Bank of England and OBR estimates, Brexit has reduced productivity by around 4% (see the blog: The costs of Brexit: a clearer picture). For many companies in the UK, Brexit has hugely increased the administrative burdens of trading with the EU. It has also reduced investment and led to a slower growth in the capital stock.
The UK’s poor productivity growth over many yeas is examined in the blog The UK’s poor productivity record.
Boosting productivity
So, how could productivity be increased and what policies could help the process?
 Artificial intelligence. One important driver of productivity growth is technological advance. The rapid advance in AI and its adoption across much of industry is likely to have a dramatic effect on working practices and output. Estimates by the IMF suggest that some 40% of jobs globally and 60% in advanced countries could be affected – some replaced and others complemented and enhanced by AI. The opportunities for raising incomes are huge, but so too are the dangers of displacing workers and deepening inequality, as some higher-paid jobs are enhanced by AI, while many lower paid jobs are little affected and other jobs disappear.
AI is also likely to increase returns to capital. This may help to drive investment and further boost economic growth. However, the increased returns to capital are also likely to exacerbate inequality.
To guard against the growth of market power and its abuse, competition policies may need strengthening to ensure that the benefits of AI are widely spread and that new entrants are encouraged. Also training and retraining opportunities to allow workers to embrace AI and increase their mobility will need to be provided.
 Training. And it is not just training in the use of AI that is important. Training generally is a key ingredient in encouraging productivity growth. In the UK, there has been a decline in investment in adult education and training, with a 70% reduction since the early 2000s in the number of adults undertaking publicly-funded training, and with average spending on training by employers decreasing by 27% per trainee since 2011. The Institute for Fiscal Studies identifies five main policy levers to address this: “public funding of qualifications and skills programmes, loans to learners, training subsidies, taxation of training and the regulation of training” (see link in articles below).
Competition. Another factor likely to enhance productivity is competition, both internationally and within countries. Removing trade restrictions could boost productivity growth; erecting barriers to protect inefficient domestic industry would reduce it.
Investment. Policies to encourage investment are also key to productivity growth. Private-sector investment can be encouraged by tax incentives. For example, in the UK the Annual Investment Allowance allows businesses to claim 100% of the cost of plant and machinery up to £1m in the year it is incurred. However, for tax relief to produce significant effects on investment, companies need to believe that the policy will stay and not be changed as economic circumstances or governments change.
 Public-sector investment is also key. Good road and rail infrastructure and public transport are vital in encouraging private investment and labour mobility. And investment in health, education and training are a key part in encouraging the development of human capital. Many countries, the UK included, cut back on public-sector capital investment after the financial crisis and this has had a dampening effect on economic growth.
Regional policy. External economies of scale could be encouraged by setting up development areas in various regions. Particular industries could be attracted to specific areas, where local skilled workers, managerial expertise and shared infrastructure can benefit all the firms in the industry. These ‘agglomeration economies’ have been very limited in the UK compared with many other countries with much stronger regional economies.
Changing the aims and governance of firms. A change in corporate structure and governance could also help to drive investment and productivity. According to research by the think tank, Demos (see the B Lab UK article and the second report below), if legislation required companies to consider the social, economic and environmental impact of their business alongside profitability, this could have a dramatic effect on productivity. If businesses were required to be ‘purpose-led’, considering the interests of all their stakeholders, this supply-side reform could dramatically increase growth and well-being.
Such stakeholder-governed businesses currently outperform their peers with higher levels of investment, innovation, product development and output. They also have higher levels of staff engagement and satisfaction.
Articles
- World Must Prioritize Productivity Reforms to Revive Medium-Term Growth
IMF Blog, Nan Li and Diaa Noureldin (10/4/24)
- Why has productivity slowed down?
Oxford Martin School News, Ian Goldin, Pantelis Koutroumpis, François Lafond and Julian Winkler (18/3/24)
- How can the UK revive its ailing productivity?
Economics Observatory, Michelle Kilfoyle (14/3/24)
- With the UK creeping out of recession, here’s an economist’s brief guide to improving productivity
The Conversation, Nigel Driffield (13/3/24)
- UK economy nearly a third smaller thanks to ‘catastrophically bad’ productivity slowdown
City A.M., Chris Dorrell (12/3/24)
- Can AI help solve the UK’s public sector productivity puzzle?
City A.M., Chris Dorrell (11/3/24)
- AI Will Transform the Global Economy. Let’s Make Sure it Benefits Humanity
IMF Blog, Kristalina Georgieva (14/1/24)
- Productivity and Investment: Time to Manage the Project of Renewal
NIESR, Paul Fisher (12/3/24)
- Productivity trends using key national accounts indicators
Eurostat (15/3/24)
- New report says change to company law could add £149bn to the UK economy
B Lab UK (28/11/23)
- Investment in training and skills: Green Budget Chapter 9
Institute for Fiscal Studies, Imran Tahir (12/10/23)
Reports
Data
Questions
- Why has global productivity growth been lower since 2008 than before 2008?
- Why has the UK’s productivity growth been lower than many other advanced economies?
- How does the short-run macroeconomic environment affect long-term growth?
- Find out why Japan’s productivity growth has been so poor compared with other countries.
- What are likely to be the most effective means of increasing productivity growth?
- How may demand management policies affect the supply side of the economy?
- How may the adoption of an ESG framework by companies for setting objectives affect productivity growth?
 US hikes interest rates as fears grow of global oil shock over Iran War