
Artificial intelligence (AI) has become a key technology in the 21st Century. Businesses use AI systems to analyse data, automate routine tasks, improve customer service, write software, create content and even assist with decision-making. As AI improves and becomes even more capable, governments, economists, businesses and society are debating its effects on productivity, employment and economic growth – and also its potentially extreme dangers.
Some commentators compare AI to earlier technological revolutions such as the steam engine, electricity and the Internet. They argue that AI will continue to increase productivity, create new industries and improve living standards. Others worry that AI may eliminate a large numbers of jobs, increase inequality, concentrate economic power in a few firms and, in the most extreme scenarios, pose a threat to humanity itself.
These debates raise important questions including how society should evaluate the potential risks of a technology whose benefits may be enormous but whose long-term consequences remain uncertain.
AI and the labour market
 Historically, technological change has had both positive and negative effects on employment. Automation reduced the demand for many agricultural workers, while creating jobs in manufacturing. Computers automated clerical tasks but generated entirely new industries in software, telecommunications and digital services.
AI appears likely to follow a similar pattern. According to the World Economic Forum, advances in AI, robotics and information-processing technologies are expected to transform labour markets significantly during the second half of the 2020s, creating demand for new skills while reducing demand for others. The fastest-growing skills are expected to include AI and big data, technological literacy and cybersecurity.
The potential benefits
AI may benefit labour markets in several ways:
- Higher productivity: Workers can complete tasks more quickly with AI assistance.
- New occupations: Demand has emerged for AI engineers, prompt specialists, data scientists and AI governance professionals.
- Better decision-making: Firms can use AI to improve forecasting, inventory management and customer service.
- Complementing human skills: AI may perform repetitive tasks, allowing employees to focus on creativity, problem-solving and interpersonal activities.
- Economic growth: Higher productivity can increase profits, wages and living standards over time.
Many economists argue that AI will not simply replace workers but will change the tasks they perform. Research from the OECD suggests that even highly AI-exposed occupations continue to require management, communication, collaboration and social skills that technologies struggle to replicate.
The potential costs
 At the same time, AI may create significant labour-market challenges. Many white-collar occupations previously considered relatively safe from automation are becoming vulnerable. Generative AI systems can draft reports, analyse legal documents, write computer code and create marketing content. This means that some professional and administrative roles may face considerable disruption.
The World Economic Forum reports that business leaders have differing expectations about the effects of AI. In a 2026 survey (see link below), around 54 per cent expected AI to displace existing jobs, while only 24 per cent expected it to create new jobs within their organisations. Economists have identified several potential problems:
- Structural unemployment: workers in industries that are in decline may struggle to find employment requiring their existing skills.
- Increased income inequality: there may be a growing income disparity between highly skilled and less-skilled workers.
- Growing market power: the largest technology firms that own the most advanced AI systems may see their market power grow further creating dominance in certain areas.
- Regional inequalities: AI-related investment may become concentrated in particular cities and countries, exacerbating regional inequalities within and between countries.
- Pressure on governments: to address issues of structural unemployment and increasing inequality, governments may be forced to expand retraining and social-support programmes.
AI and catastrophic risk
 Most economic discussion around AI focuses on employment and productivity. However, some researchers argue that the most significant risks from AI may be much broader.
Economists distinguish between ordinary risks and catastrophic risks. Catastrophic risks involve events with a very low probability of occurring but potentially enormous consequences. Examples include nuclear accidents, pandemics and certain climate-related disasters.
AI raises similar concerns. Advanced AI systems could potentially be used to conduct cyberattacks, spread misinformation, disrupt critical infrastructure or support the development of dangerous technologies. Some researchers have even suggested that highly advanced AI systems could pose an existential risk to humanity if they become sufficiently powerful and are not properly controlled.
This became a widely discussed topic in the media in September 2026 following the resignation of an employee, Jacob Coxon, from AI firm, Anthropic. He said that people working on AI were ‘genuinely frightened’ about how quickly AI was advancing and what it might mean for the future of humanity. He said:
I believe that if we don’t slow down at the current rate of progress, there is a strong chance that we could all die in the immediate future.
Other researchers have raised similar concerns and there have since been calls from some of the biggest AI companies for regulation of AI to prevent this.
The policy debate and CBA
 All of this creates a challenge for cost-benefit analysis. Suppose AI generates trillions of pounds of economic benefits. But, if there is also a very small probability of catastrophic harm, how should policymakers weigh up the two?
Traditional cost-benefit analysis values risk by multiplying the size of a potential outcome by its probability. However, this approach becomes problematic when both the probability and the consequences are highly uncertain. The risks may be extremely difficult to estimate, while the potential costs could be vast and affect future generations. For this reason, governments and firms increasingly use scenario analysis, stress testing and AI safety assessments to evaluate potential risks. These approaches attempt to prepare for extreme outcomes rather than relying solely on probability calculations.
Supporters of AI argue that technological progress has historically improved living standards and that restricting AI too heavily could reduce innovation and economic growth. Critics argue that uncertainty about potentially catastrophic outcomes justifies a more cautious approach.
The debate therefore extends beyond labour economics to the wider issue of managing catastrophic risk. As with nuclear power or climate change, policymakers must decide how much risk society is willing to accept in exchange for potentially large economic benefits.
Articles
- Why are there concerns AI could threaten humanity, and how real are they?
BBC News, Liv McMahon (17/9/26)
- Two dire warnings, one from Terence Tao, the other from someone who just quit Anthropic
Marcus on AI, Gary Marcus (9/9/26)
- AI insiders fear extinction. Security experts see a familiar fight
Scientific American, Peter Hall (11/9/26)
- US rejects pleas from OpenAI, Anthropic for global AI standards
BBC News, Kali Hays (24/9/26)
- How would AI actually kill all humans? Here are the top 5 scenarios
The Conversation, Toby Walsh (22/9/26)
- Who’s Who In The Fight Over Whether AI Will Kill Us
Forbes, Andréa Morris (24/9/26)
- Why this AI doomsday warning from former Anthropic researcher broke through
The Guardian, Blake Montgomery (15/9/26)
 As AI behavior raises concerns, ex-researcher Jacob Coxon warns what may lie ahead
PBS News
- ‘A setup’: Elon Musk fuels wild theory about Anthropic whistleblower Jacob Coxon
ABC News, Harrison Christian (11/9/26)
- Sam Altman, Dario Amodei urge UN Security Council to adopt international AI standards
CNN, Hadas Gold (24/9/26)
- Not everyone thinks AI will kill us all
CNN, Hadas Gold and Clare Duffy (24/9/26)
- The turbulent AI era is here. The choices we make now are critical.
Gates Notes, Bill Gates (26/8/26)
Reports
Questions
- How might AI increase productivity while also causing unemployment in some sectors? Which sectors are likely to be affected the most?
- Why is it difficult to estimate the costs and benefits of advanced AI?
- Assume that a disaster is estimated to cost society £1000 billion (£1 000 000 000 000). The chances of the disaster occurring are said to be minute, however. Estimates vary from a probability of one in a million to one in a billion. What estimate of this cost would you include in a cost–benefit analysis?
- Why are many low-income countries apparently prepared to accept riskier projects than are high-income ones?
- Discuss whether the greatest economic challenge posed by AI is (a) job displacement; (b) increased inequality; (c) market concentration and the power of large technology firms; or (d) catastrophic long-term risks.
- Read the article by Bill Gates, The turbulent AI era is here. The choices we make now are critical. According to him, what steps should the world take to ensure that ‘AI will be a force for good and leave everyone better off’?
 With relentless bombing of Iran by Israel and the USA, and with Iranian counterattacks on Gulf states, the costs of the war are mounting. The most obvious are in terms of human lives, injuries and suffering. But there are significant economic costs too. Some of these are immediate, such as the rising price of oil and hence the costs of fuel, or the fall in stock market prices. Some will be longer term, depending on how the war develops. For example, prices could rise more generally as supply chains are disrupted.
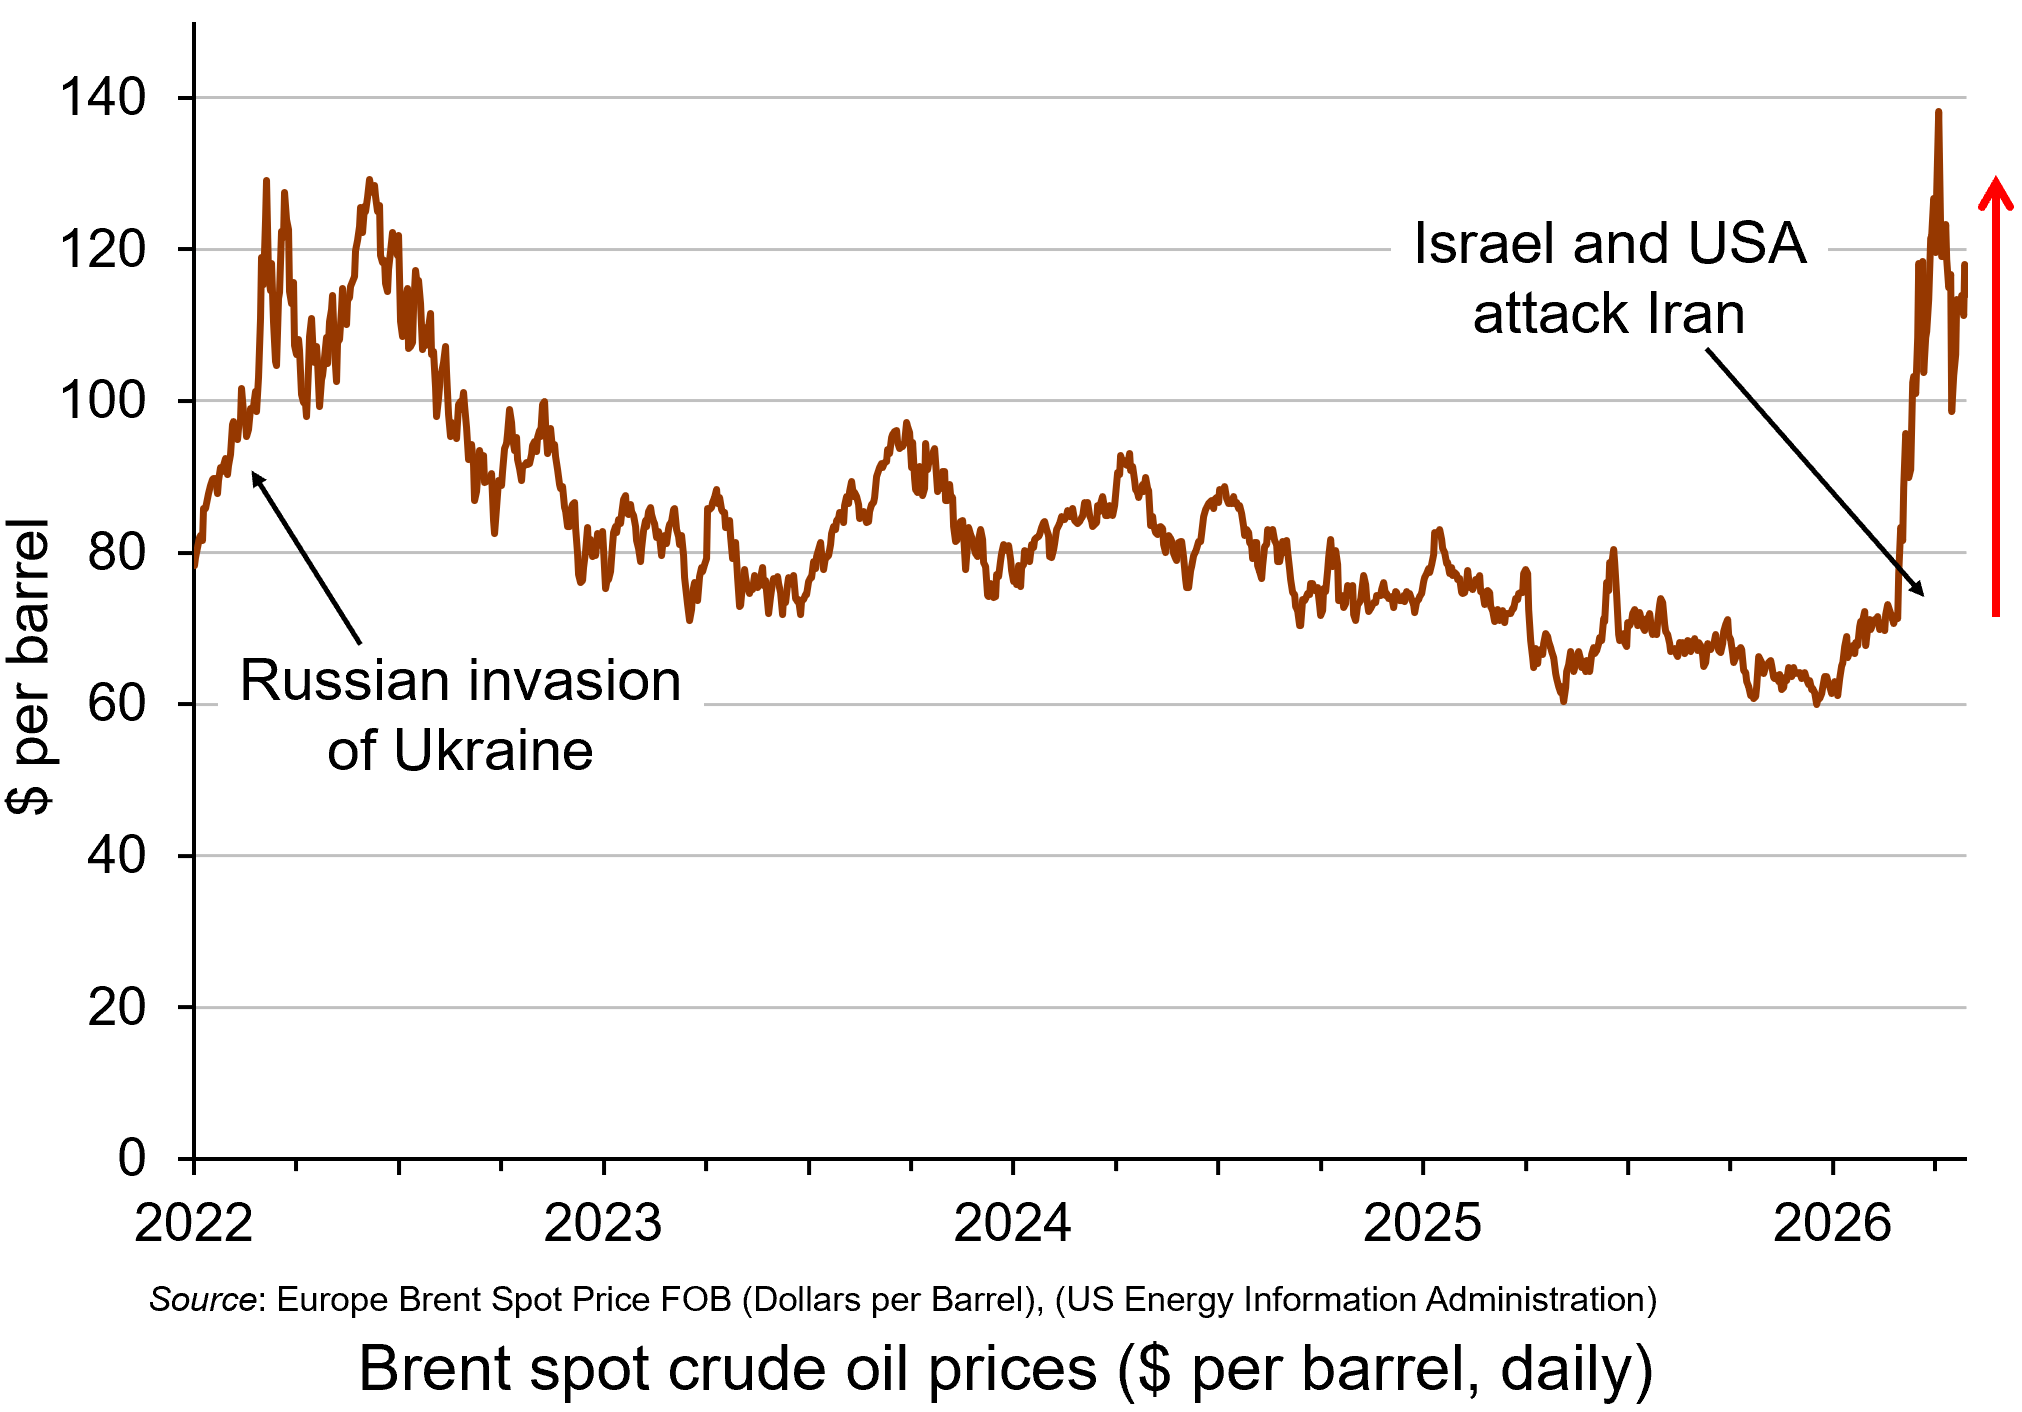 The impacts will vary across the world and across markets. The most obvious markets to be affected are those where significant supply comes from the Persian Gulf. Approximately 20% of total global oil consumption passes through the Strait of Hormuz, which connects the Persian Gulf with the Arabian Sea and the Indian Ocean.
Oil prices rose considerably in the days following the start of the war on 28 February, with Brent crude, a key measure of international oil prices, rising from $71.3 on 27 February to a peak of $119.4 per barrel by the morning of 9 March – a rise of 67%. It was possible that they would rise even further in the short term. However, prices fell back substantially later on 9 March after G7 finance ministers declared that the group ‘stands ready’ to release oil from strategic reserves if needed. By late in the day, the price had fallen to below $85. (Click here for a PowerPoint of the chart.)
However, despite the announcement on 11 March that 32 countries had agreed to release 400m barrels of oil reserves, oil prices began rising again and reached $100 on 12 March after three tankers had been struck in the Gulf, two of them close to the Strait of Hormuz. With Iran pledging to keep the Strait closed, there were worries that the release of oil reserves would provide only temporary relief. Just over 20m barrels of oil normally pass through the Strait of Hormuz. The 400m barrels released from storage is the equivalent, therefore, of only 20 days’ worth of lost oil from the Gulf.
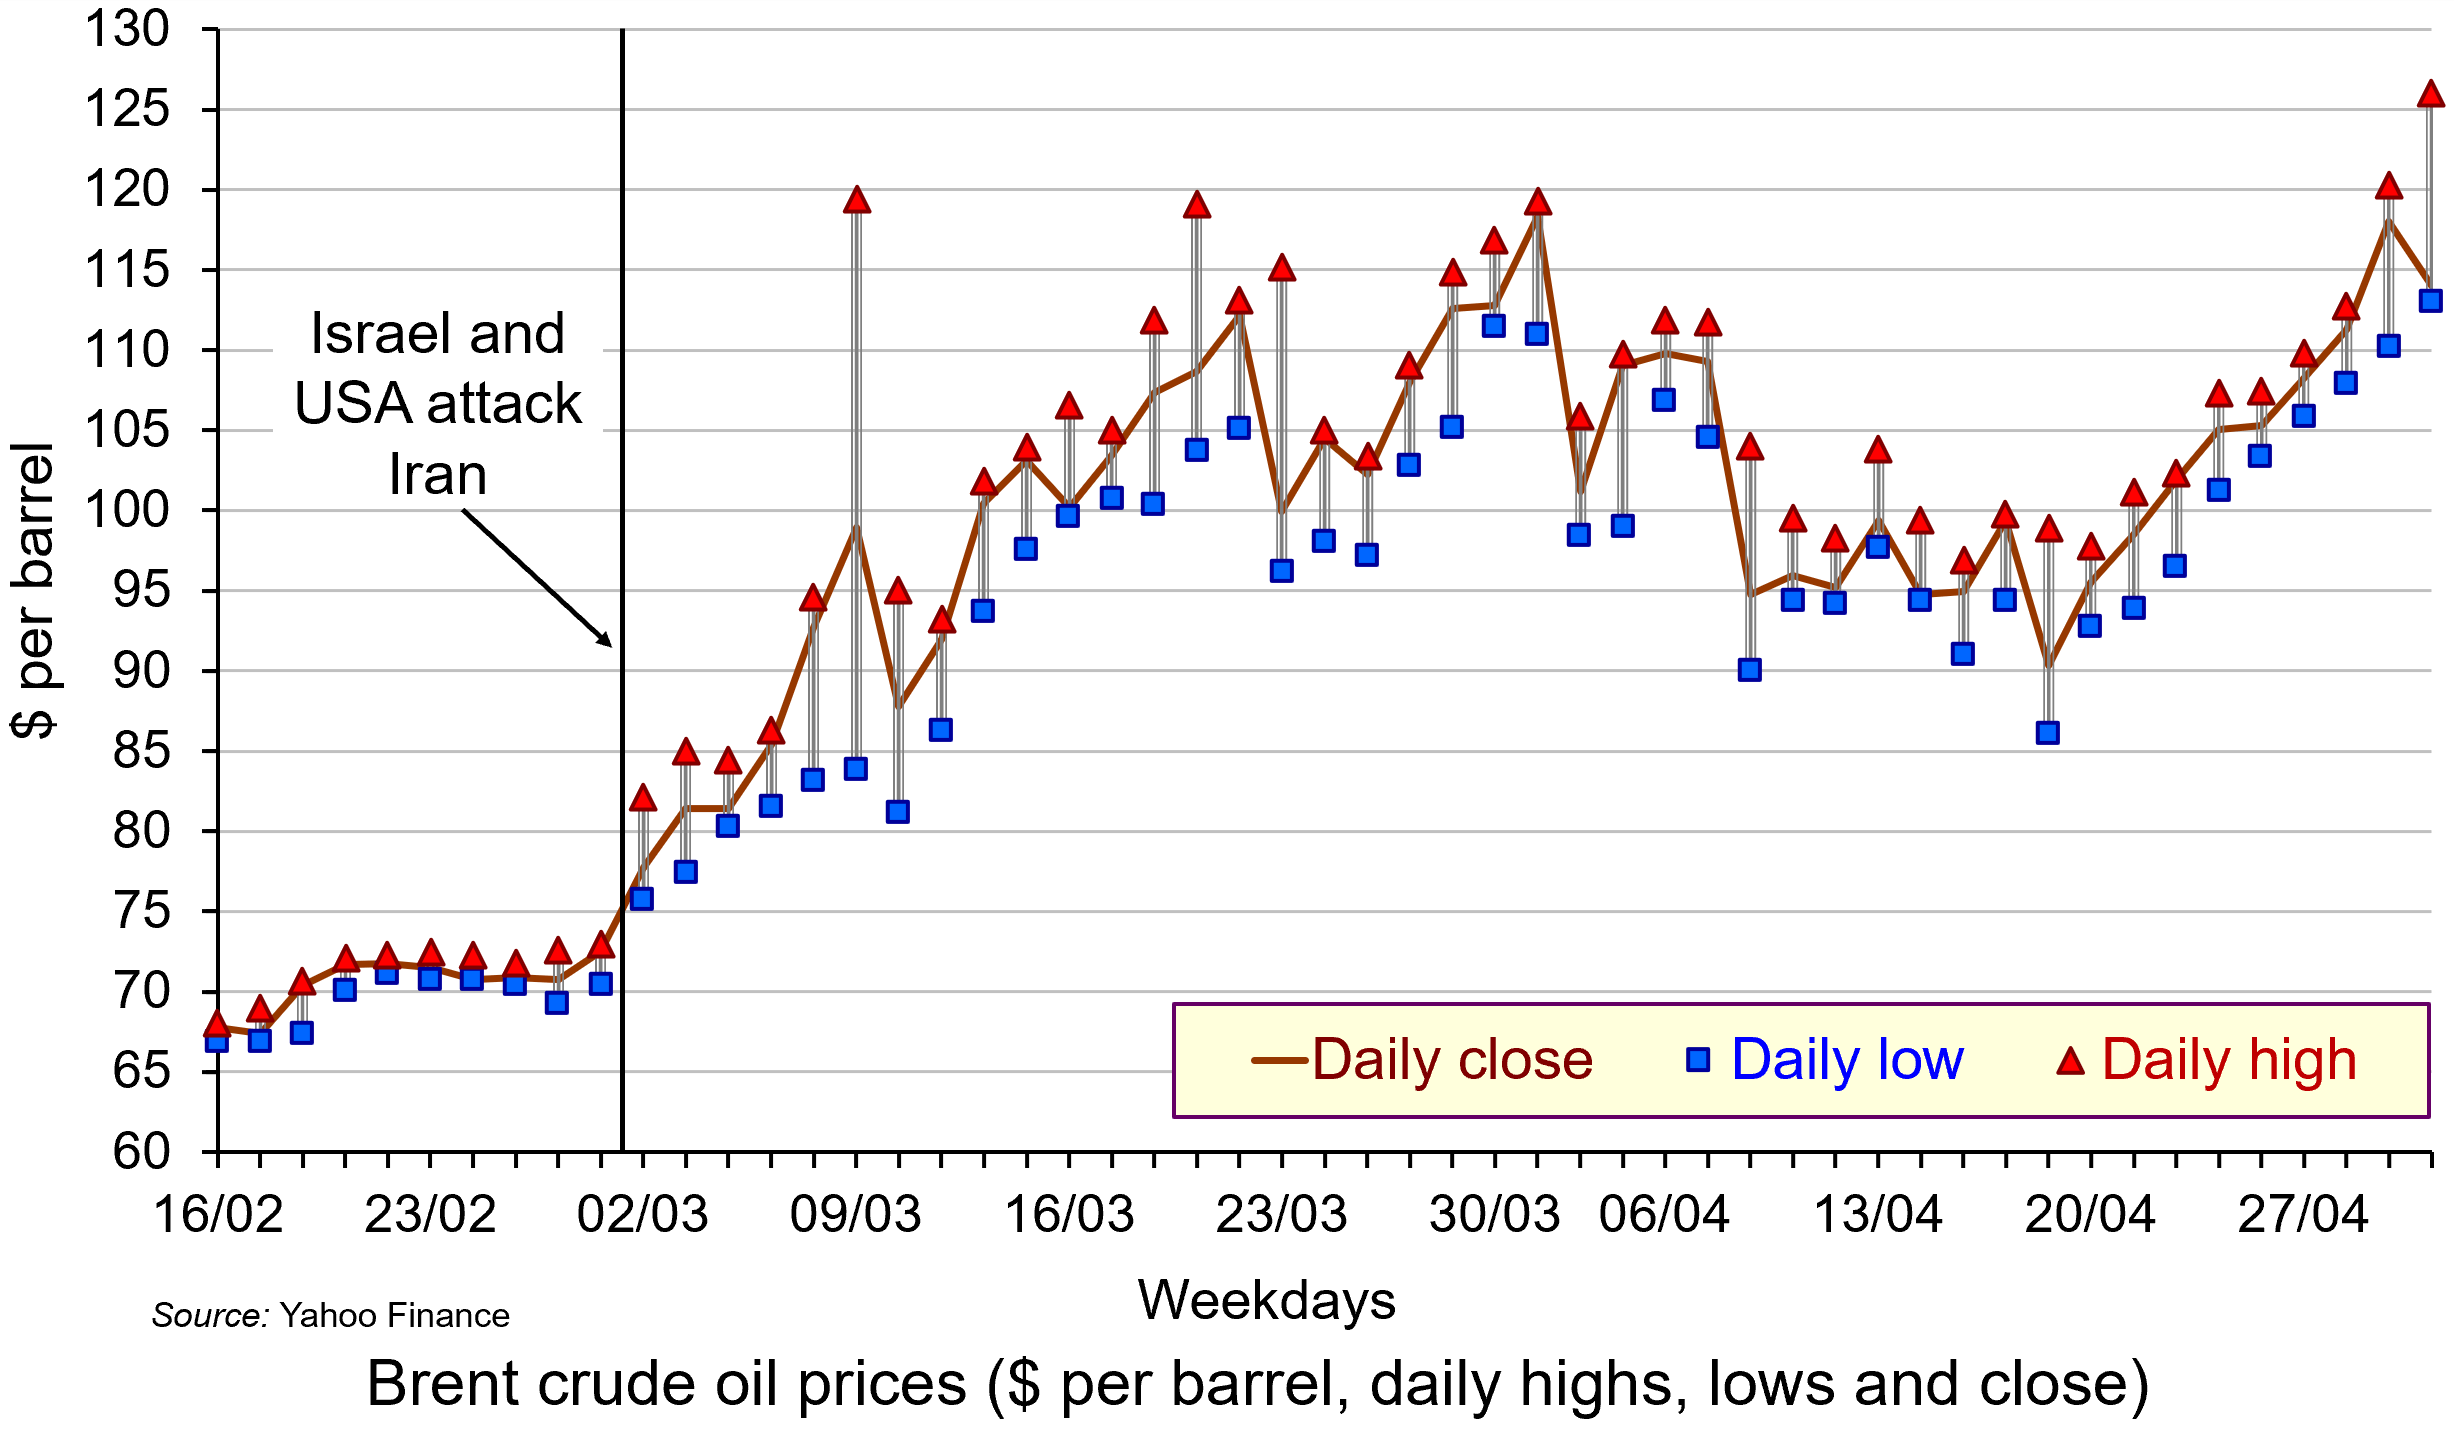
Not only did oil prices rise, but the price became much more volatile as markets reacted to the news on a continuous basis. Intra-day fluctuations in oil prices of several percentage points became typical, reflecting shifting expectations. The second chart shows daily fluctuations, with the highest and lowest prices for each day shown, along with the closing price. (Click here for a PowerPoint.)
The biggest fluctuation had been on 9 March when fears of the closing of the Strait of Hormuz saw the price of Brent crude rising to nearly $120 but falling to around $84 later in the day (a fall of around 30%) after the G7 announcement about releasing reserves.
There was another big fluctuation on 23 March. The previous day (Sunday), President Trump threatened to bomb Iran’s power plants if Iran did not allow free passage of ships through the Strait of Hormuz. Iran threatened to retaliate by striking Gulf countries’ energy and water systems. In early trading on Monday 23rd, Brent crude rose to over $115 per barrel. But later that day, Trump said that there had been constructive talks between the USA and Iran. The oil price immediately dropped to around $96 – a fall of 17% – before settling at around $100.
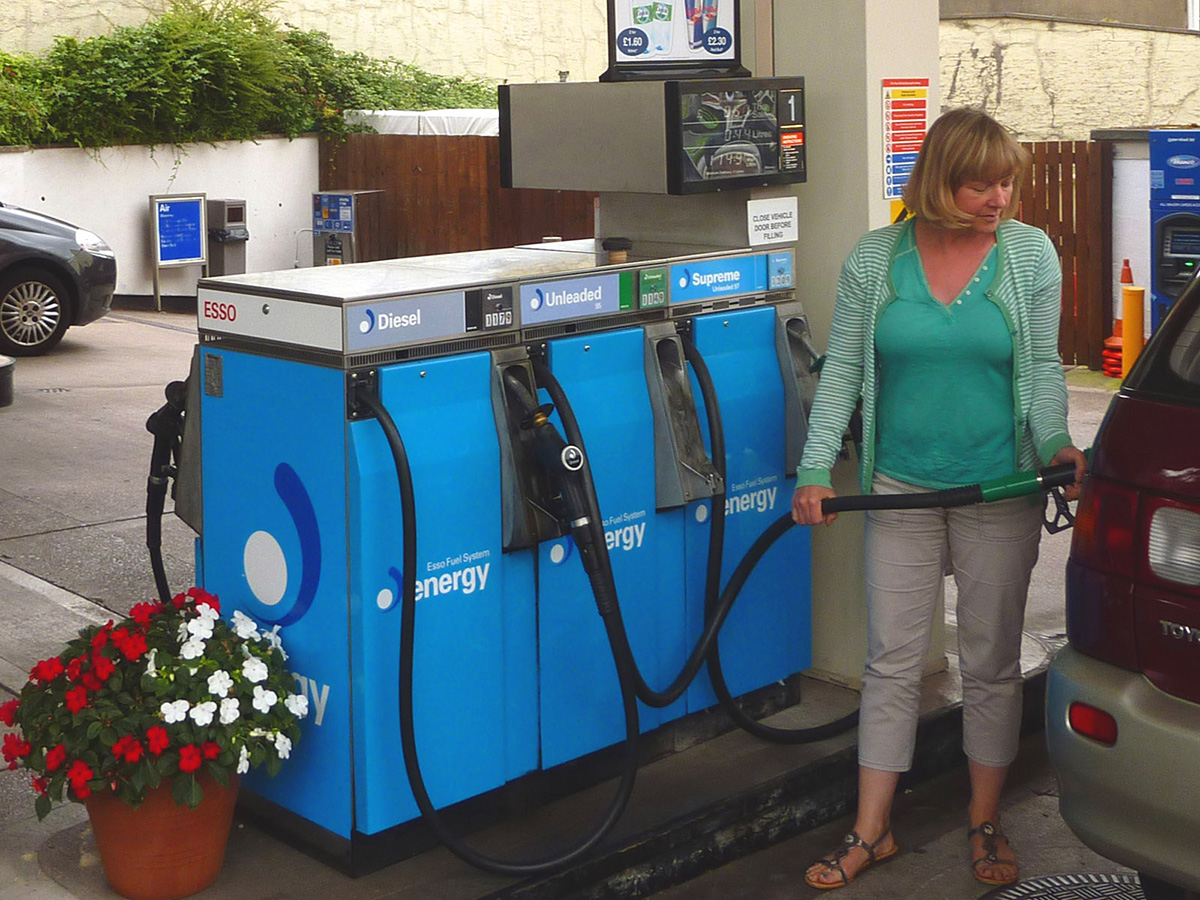 Rising oil prices will drive up inflation. For those countries with a heavy dependence on Gulf oil, particularly countries in Asia, there could be significant supply problems. For oil exporters in the Persian Gulf, with tankers unable to traverse the Strait of Hormuz, the economic impact is huge. Oil exporters outside the Gulf, such as Russia, Norway and Canada, however, will gain from the higher prices. Clearly the size of these effects will depend on how long the conflict continues and how long the Strait of Hormuz remains closed.
And it is not just oil that is affected. Other products, such as liquified natural gas (LNG), petrochemicals, industrial materials, fertilizers for food production, medicines, helium for microchip production, metals and minerals are transported through the Strait of Hormuz. Gulf countries import much of their food through the Strait. On 18 March, Israel struck Iran’s huge South Pars gas field off the Gulf coast. This is the largest gas field in the world and is a major source of export revenue for Iran. Iran responded by striking the Qatari gas hub in Ras Laffan. Donald Trump responded by threatening to ‘blow up’ the entire Iranian South Pars gas field if Iran made further strikes on Qatar. The effect of this escalation was to drive oil and gas prices up further. By the week ending 20 March, the oil price closed at just over $112 per barrel.
Cuts in supplies of oil and other products represent an adverse supply shock. Such shocks push up prices (cost-push inflation), while adversely affecting aggregate output. This can lead to stagflation – a combination of higher inflation and stagnation or even falling output. Central banks with a simple mandate to keep inflation to a target are likely to raise interest rates, or at least delay in reducing them. In the USA, with a dual mandate of controlling inflation but also maximising employment, the response may be less deflationary, depending on the judgement of the Federal Reserve.
Uncertainty
 There is great uncertainty about how long the conflict will last. There is also a lack of clarity and consistency from the US administration about its war aims. This uncertainty has affected financial markets, which have seen considerable volatility. Stock markets have seen widespread falls, with airline, travel and AI-heavy stocks being particularly vulnerable.
If the war is concluded relatively swiftly, the economic effects could be relatively small. If the war continues, and especially if the Gulf countries are drawn further into the conflict and if the conflict spreads to other countries, the economic effects could be much more substantial. A prolonged conflict could see oil prices remaining above $100 per barrel, potentially increasing global inflation by 1 percentage point or more. This would slow or halt the move by central banks to cut rates and thereby reduce global economic growth – potentially, as we have seen, leading to stagflation.
 The uncertainty was reflected in the decision of the Fed to keep interest rates unchanged at its meeting on 17/18 March. The Fed has the twin targets of keeping inflation close to 2% and maximising employment. Fed Chair, Jay Powell, acknowledged the current tension between the two goals: ‘upward risks for inflation and downward risks for employment, and that puts us in a difficult situation’. He also recognised that the future for inflation and the economy was highly uncertain as the war developed. This made interest rate setting difficult.
Then there is the issue of a potential new international refugee crisis. If the economic and political system in Iran deteriorates rapidly, this could trigger a wave of migration to neighbouring countries, such as Turkey, already hosting large numbers of refugees. Many could seek sanctuary further afield in Europe, with several countries already facing a backlash against immigration. The political and economic effects of this on host countries could be significant – but as yet, highly uncertain.
Articles
- Assessing the global economic impact of the Middle East war
ING, Carsten Brzeski, Warren Patterson, James Knightley and Deepali Bhargava (5/3/26)
- How the Hormuz closure could affect food, medicines and smartphones
BBC News Verify, Ben Chu (27/3/26)
- How will the Iran war affect the global economy?
Chatham House, Neil Shearing (6/3/26)
- ‘The stakes are enormous’: how a prolonged Iran war could shock the global economy
The Guardian, Richard Partington (22/3/26)
- Iran war is latest threat to a global economy rattled by Trump
Aljazeera, John Power (7/3/26)
- Why an Iran war inflation shock could wreck global economic recovery
The Guardian, Phillip Inman and Kalyeena Makortoff (8/3/26)
- Why has the Iran war sparked fears of stagflation for the global economy?
The Guardian, Luca Ittimani (9/2/26)
- Why the price of oil matters more than you might think
BBC News, Natalie Sherman and Mitchell Labiak (10/3/26)
- Strait of Hormuz: Factsheet
IEA (February 2026)
- Could this energy crisis be worse for the global economy than COVID?
The Conversation, Adi Imsirovic (26/3/26)
- Faisal Islam: Oil price spiral may be slowed but not stopped by G7 emergency move
BBC News, Faisal Islam (9/3/26)
- What on earth is going on with the oil price?
BBC News, Jemma Crew (12/3/26)
- Asia scrambles to confront energy crisis unleashed by Iran war – with no end in sight
The Guardian, Callum Jones (12/3/26)
- The grim choice facing the Trump administration: Economic or naval collapse?
CNN, Phil Mattingly and Zachary Cohen (9/3/26)
- Israel strikes Iran’s South Pars gasfield hours after forces kill intelligence minister
The Guardian, Lorenzo Tondo and William Christou (18/3/26)
- What Fed Chair Jerome Powell said — and didn’t say — about the oil crisis
Yahoo Finance, Jake Conley (19/3/26)
- What strikes on the world’s largest natural gas sites could do to the global economy
CNN, Hanna Ziady (19/3/26)
- How the Iran Conflict May Fuel a New International Refugee Crisis
Forbes, Andy J Semotiuk (5/3/26)
- Iran’s neighbours brace for fallout as war threatens new refugee crisis
Aljazeera, Abid Hussain (17/3/26)
- Two months into the Iran war, almost everybody is a loser
CNN, Ivana Kottasová (2/5/26)
Data
Report
Questions
- Who are the biggest gainers and losers from disruption to oil supplies from the Persian Gulf?
- Illustrate the effect of the current oil price shock on an aggregate demand and supply diagram (either static or dynamic).
- Why is the Iranian war likely to be less damaging to the European economy than the Ukrainian war has been?
- Why have AI-related stock prices been vulnerable to the uncertainty caused by the Iranian war?
- How have the Bank of England and the Federal Reserve Bank responded to higher oil prices and the broader economic effects of the war? Why might their responses be different in the coming months?
- What is the likely impact of the Iranian war on global economic recovery?
- How might the Iranian war affect global economic alliances?
- How is the current oil price shock likely to affect the eurozone? Will it be different from the oil price shock that followed the Russian invasion of Ukraine?
- What are the likely economic effects of large-scale migration caused by the war?
 Precious metals, such as gold, silver and platinum, are seen as safe havens by investors in uncertain times. With the on-off nature of Donald Trump’s tariffs, with ongoing wars, such as the war in Ukraine, and with threats of US action in Iran, with inflation slow to fall and pressure by the Trump administration on the Federal Reserve to make precipitant cuts in interest rates, investors have flocked to precious metals.
Precious metals peaked in late January 2026. Compared with just four months earlier, gold was up by 48%, platinum by 76% and silver by a massive 162%. Silver and platinum were also boosted by their industrial uses. Silver has excellent conductive properties and is used for electronics, AI, solar energy (photovoltaic cells), chemical catalysts and medical equipment. Over 50% of its consumption is for industrial purposes. Platinum is used as a catalyst in catalytic converters to reduce exhaust emissions, in medical devices, chemical processing, oil refining, electronics and glass manufacturing.
The rise was fuelled by speculation, which gathered momentum in December and January. But then the prices of all three metals fell dramatically on Friday 30 January and a bit more on 2 February. Despite a moderate bounce back on 3 February, the prices then fell again and by the end of 5 February, gold had fallen by 15%, platinum by 30% and silver by a massive 42% from the peak.
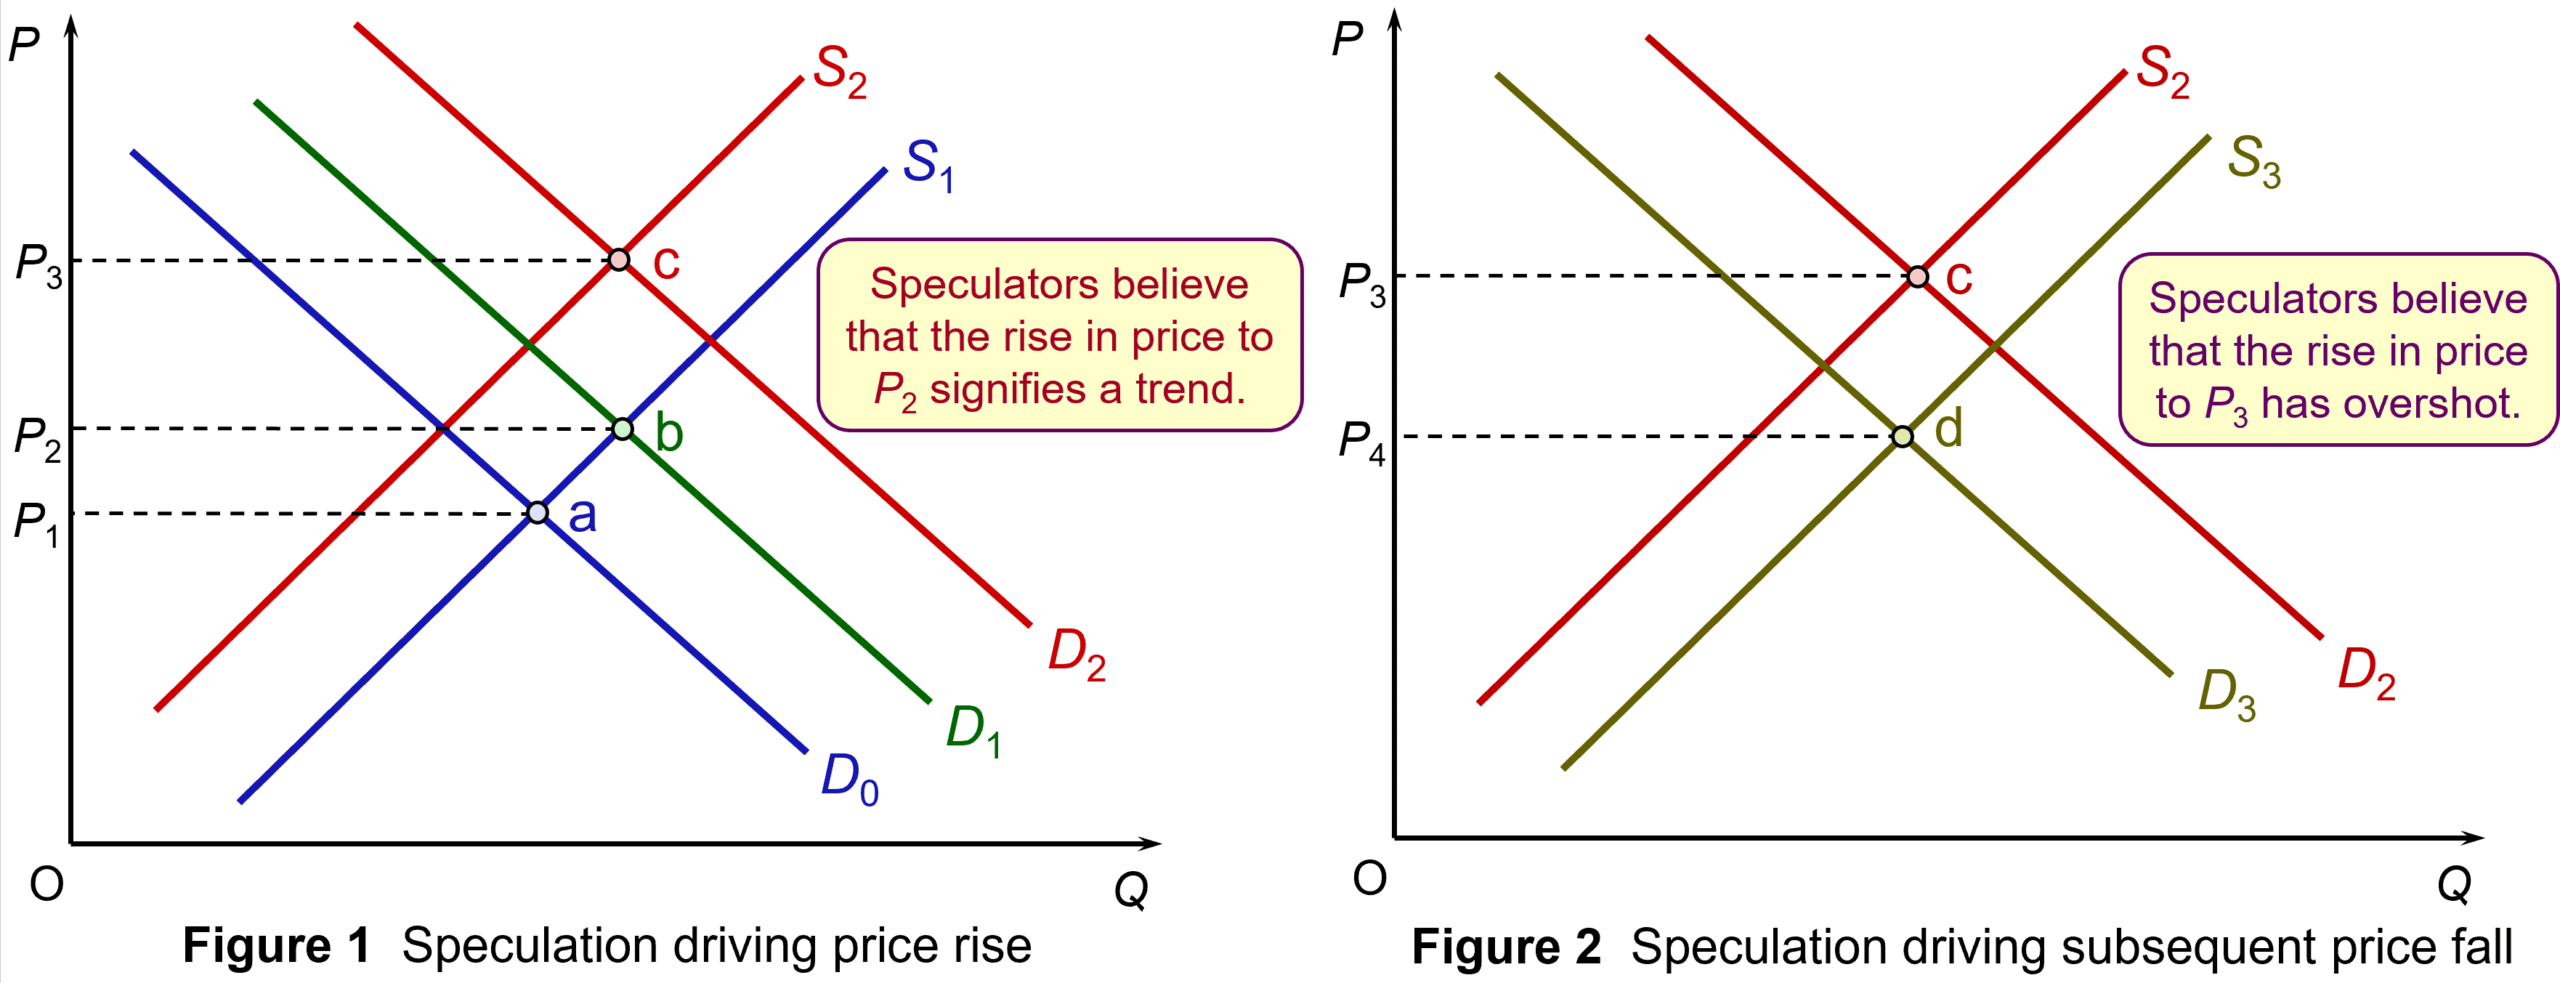
Figure 1 illustrates the effect of speculation on the rise in price of a precious metal, such as silver. Assume that demand rises from D0 to D1 for the reasons given above. Equilibrium moves from point a to point b and the price rises from P1 to P2. Seeing the price rising, holders of the metal wait until the price rises further before selling. Supply shifts from S1 to S2. Potential purchasers of the metal, anticipating a further rise in price, buy now before the price does rise. Demand shifts from D1 to D2. As a result, equilibrium moves from point b to point c and price rises to P3.
Figure 2 illustrates the effect of speculation on the subsequent fall in prices triggered by a belief that price will fall. Speculative selling shifts the supply curve from S2 to S3. Potential demanders hold back and the demand curve shifts from D2 to D3. Equilibrium moves to point d and price falls from P3 to P4. (Click here for a PowerPoint of the two figures.)
But why did prices fall so dramatically? The first reason was that analysts were beginning to argue that the exuberance of investors had led the price of all three metals to overshoot the fundamental balance of supply and demand. Once a tipping point arrived, people sold quickly to lock in the gains they had made over previous weeks. This profit taking caused prices to plummet as speculation of further falls drove prices lower.
 So what was the tipping point? This was the appointment by Donald Trump of Kevin Warsh as the new Chair of the Federal Reserve to take over from Jerome Powell when his tenure comes to an end in May this year.
It was expected that Trump would appoint someone much more willing to cut interest rates and this worried investors, who feared that inflation would rise again. This uncertainty drove demand for precious metals, which are seen as a safe haven. But Kevin Walsh is viewed as hawkish on monetary policy and less likely to slash interest rates than other possible choices for Chair. This triggered the fall in precious metal prices.
But the main factors that drove the demand for the metals still exist. There is still uncertainty, still an increased demand from central banks for gold, still a growing demand for silver and platinum for industrial uses. The next day, 3 February, it seemed that the prices of all three metals had over-corrected. Investors started buying again at the lower prices and consequently prices rose again – once more fuelled by speculation. Gold rose by 6.1%, platinum by 7.9% and silver by 11.6%.
Articles
Data
Questions
- What has happened to the price of silver since this blog was written? Use a demand and supply diagram to illustrate this.
- Identify the factors that affect the demand for and supply of (a) silver; (b) gold.
- What determines the elasticity of supply of silver (a) in total; (b) to the market?
- Choose another commodity other than the three metals considered in this blog. Find out what has happened to their prices over the past 12 months and explain why these price movements have occurred.
 Recently, a flurry of bankruptcies among non-bank financial intermediaries (NBFIs) in the USA has drawn attention to the risks associated with alternative credit channels in the shadow-banking sector – lending which is not financed with deposits. There is concern that this could be the start of a wave of bankruptcies among such NBFIs, especially given concerns about a potential downswing in the economic cycle – a time when defaults are more likely.
While providing alternative sources of funding, the opacity of lending in the shadow-banking sector means it is not clear what risks NBFIs face themselves and, more significantly, what risks they pose to the financial system as a whole. There is particular concern about the impact on regulated banks.
Already, JP Morgan Chase in its third quarter earnings report announced a $170m charge stemming from the bankruptcy of Tricolor, which specialised in sub-prime car financing. Mid-sized banks, Western Alliance and Zions Bancorp, have reported losses from loans to a group of distressed real estate funds. This has highlighted the interconnectedness between NBFIs and regulated banking, and the potential for problems in the shadow-banking sector to have a direct impact on mainstream banks.
In this blog, we will trace the secular trends in the financial systems of more advanced economies which have given rise to alternative credit channels and, in turn, to potential banking crises. We will explain the relationship between regulated banks and shadow banks, analysing the risks involved, the potential impact on the financial system and the policy implications.
What are the secular trends in banking?
The traditional model of commercial banking involved taking deposits and using them to finance loans to households and firms. However, cycles of banking crises, regulatory changes and financial innovation over the past 50 years produced new models.
First, banks diversified away from direct lending to providing other banking services – on-balance sheet activities, such as investing in financial securities, and off-balance sheet activities, such as acting as agents in the sale of financial securities.
Second, alternative credit channels based on financial markets have grown in significance.
 In the 1980s, international regulations around traditional banking activities – taking deposits and making loans – were being formalised by the Bank for International Settlements (BIS) under what became known as the Basel framework (see, for example, Economics section 18.2 or Economics for Business section 28.2). For the first time, this stipulated liquidity and capital requirements for international banks relating to their traditional lending activities. However, at the same time the deregulation of financial markets and financial innovation provided banks with opportunities to derive revenues from a range of other financial services.
After the financial crisis, liquidity and capital requirements for banks were tightened further through the Basel III regulations. Commercial banks had to have even higher levels of capital as a buffer for bad debts associated with direct lending. A higher level of capital to cover potential losses increases the marginal cost of lending, since each pound of additional loan requires additional capital. This reduced the marginal return, and consequently, the incentive to lend directly.
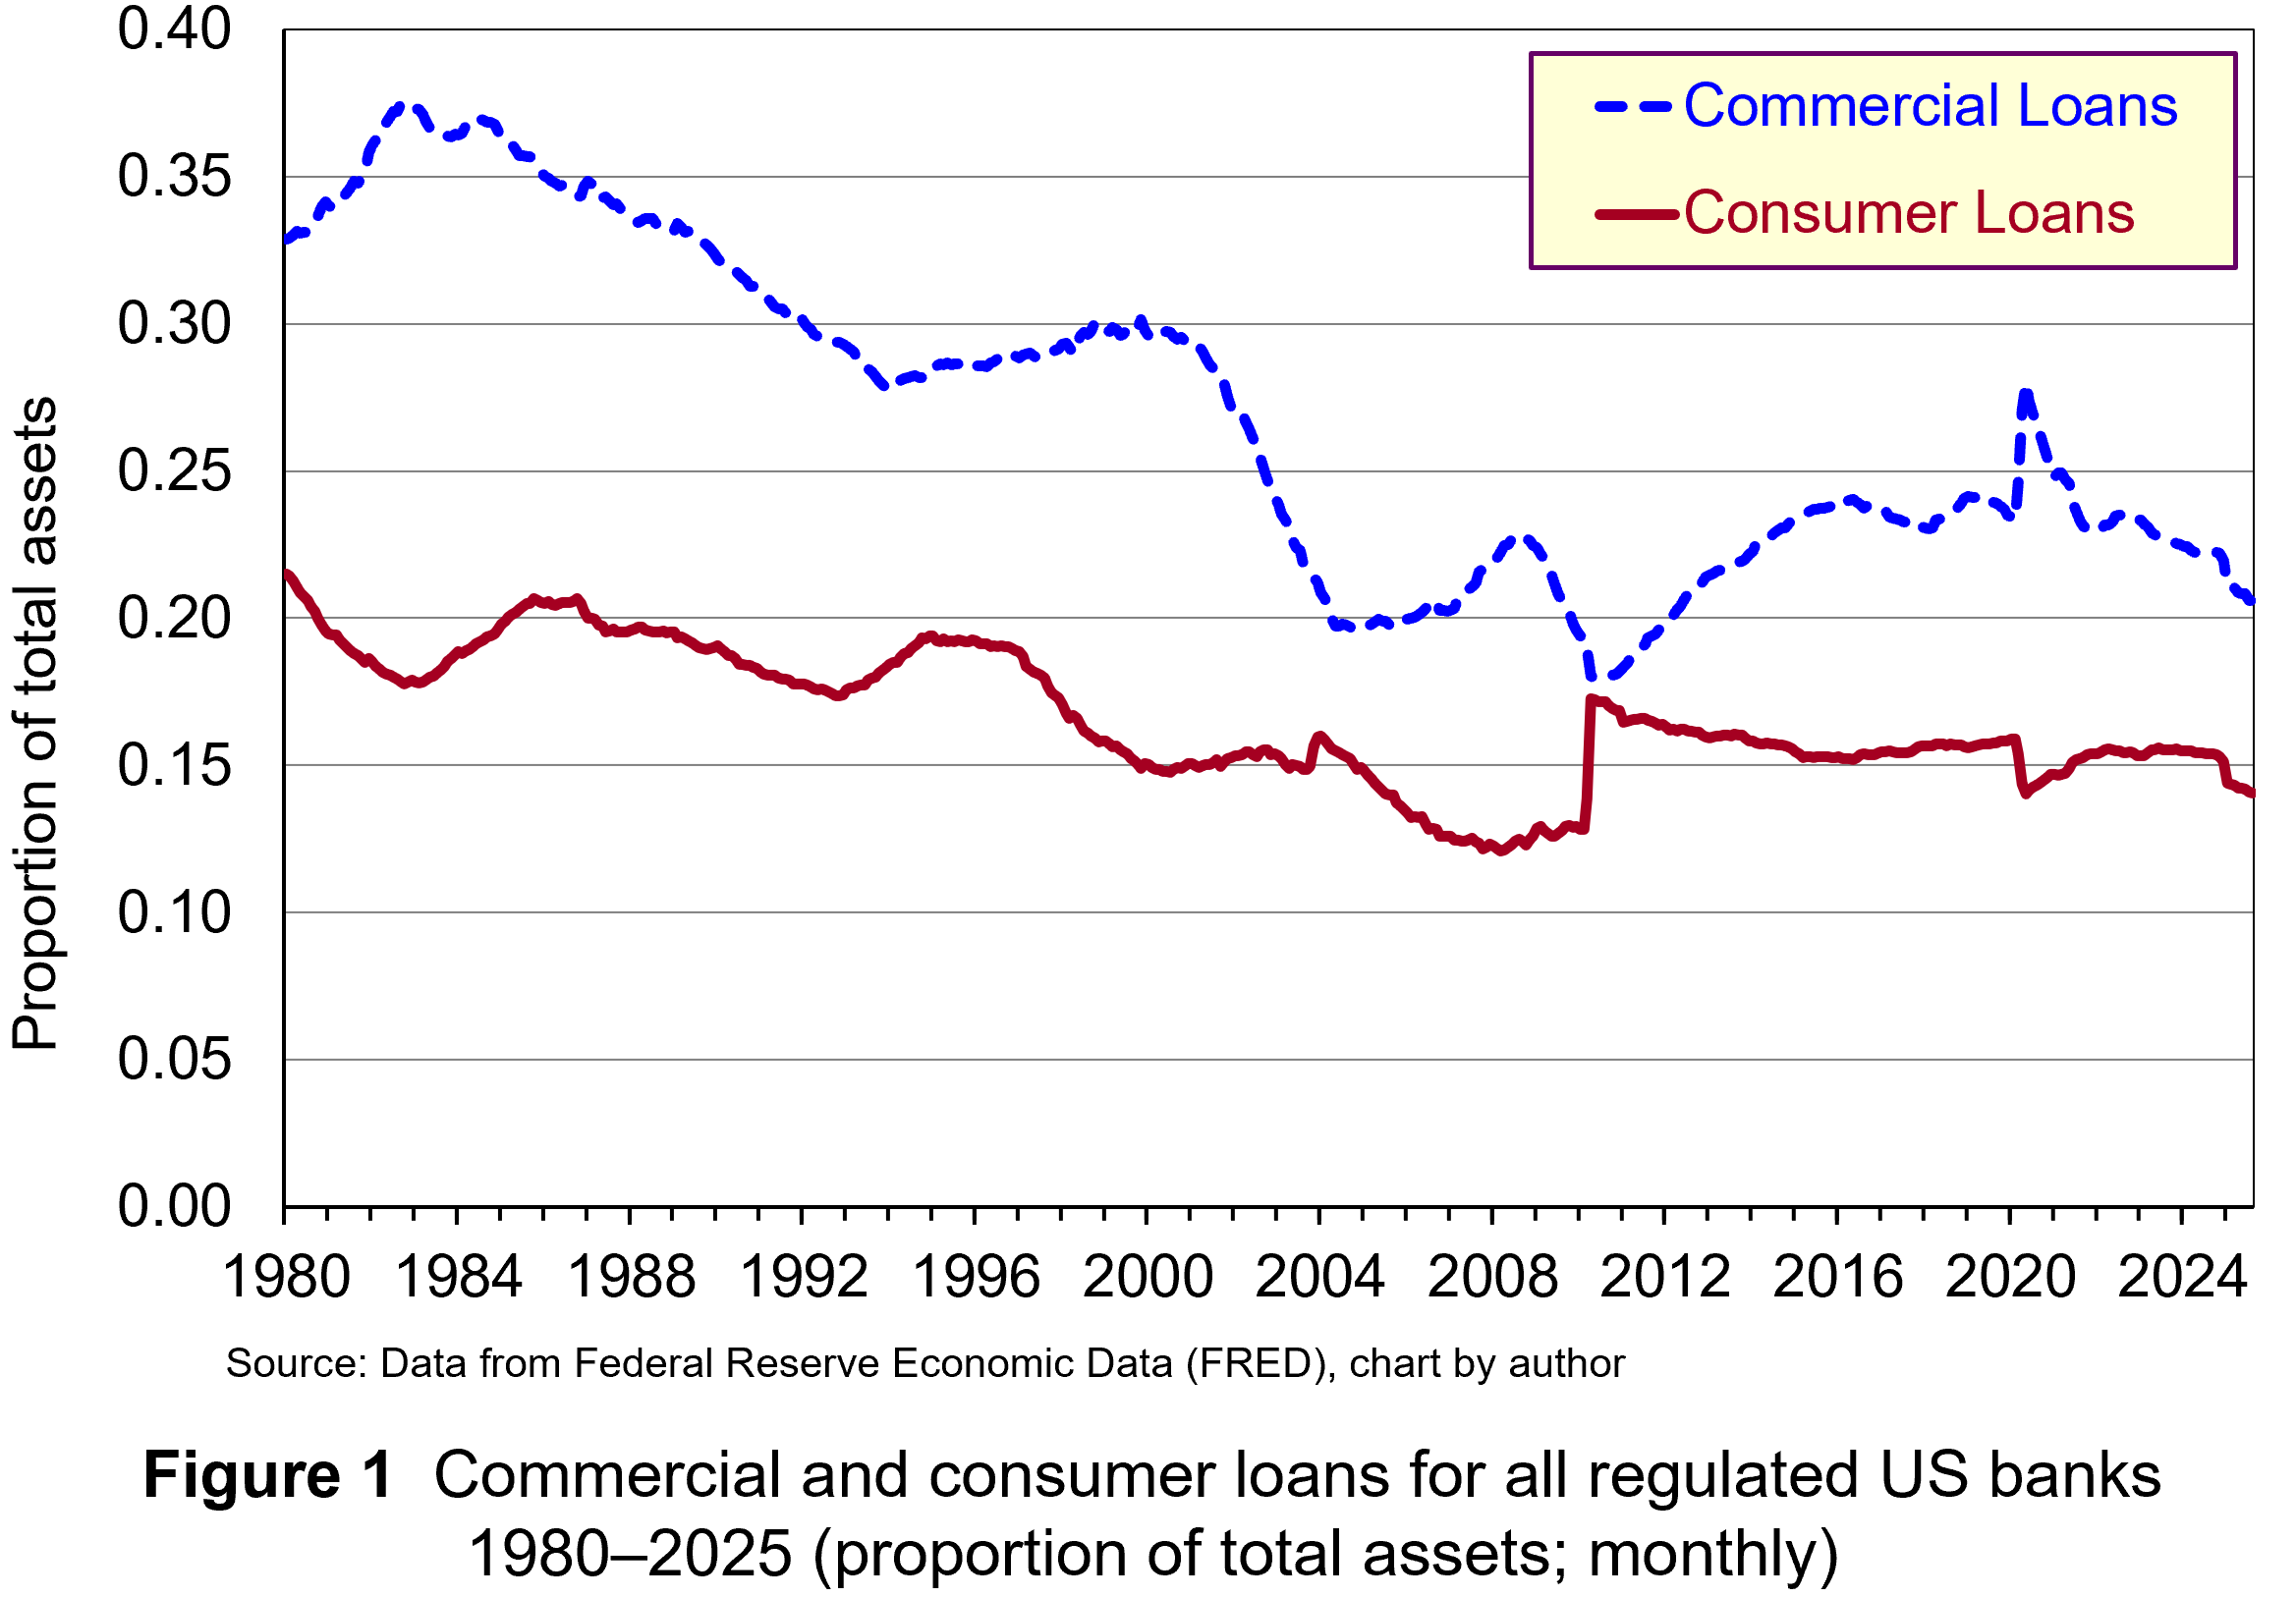 These regulatory developments created an incentive to pursue activities which do not require as much capital, since their marginal cost is lower and potential return is higher. Consequently, banks have placed less emphasis on lending and more on purchasing short-term and long-term financial securities and generating non-interest income from off-balance sheet activities. For instance, research by the Bank of England found that during the 1980s, interest income accounted for more than two-thirds of total income for large international banks. In contemporary times, non-interest income tends to be greater than interest income. Figure 1 illustrates the declining proportion of total assets represented by commercial and consumer loans for all regulated US banks. (Click here for a PowerPoint.)
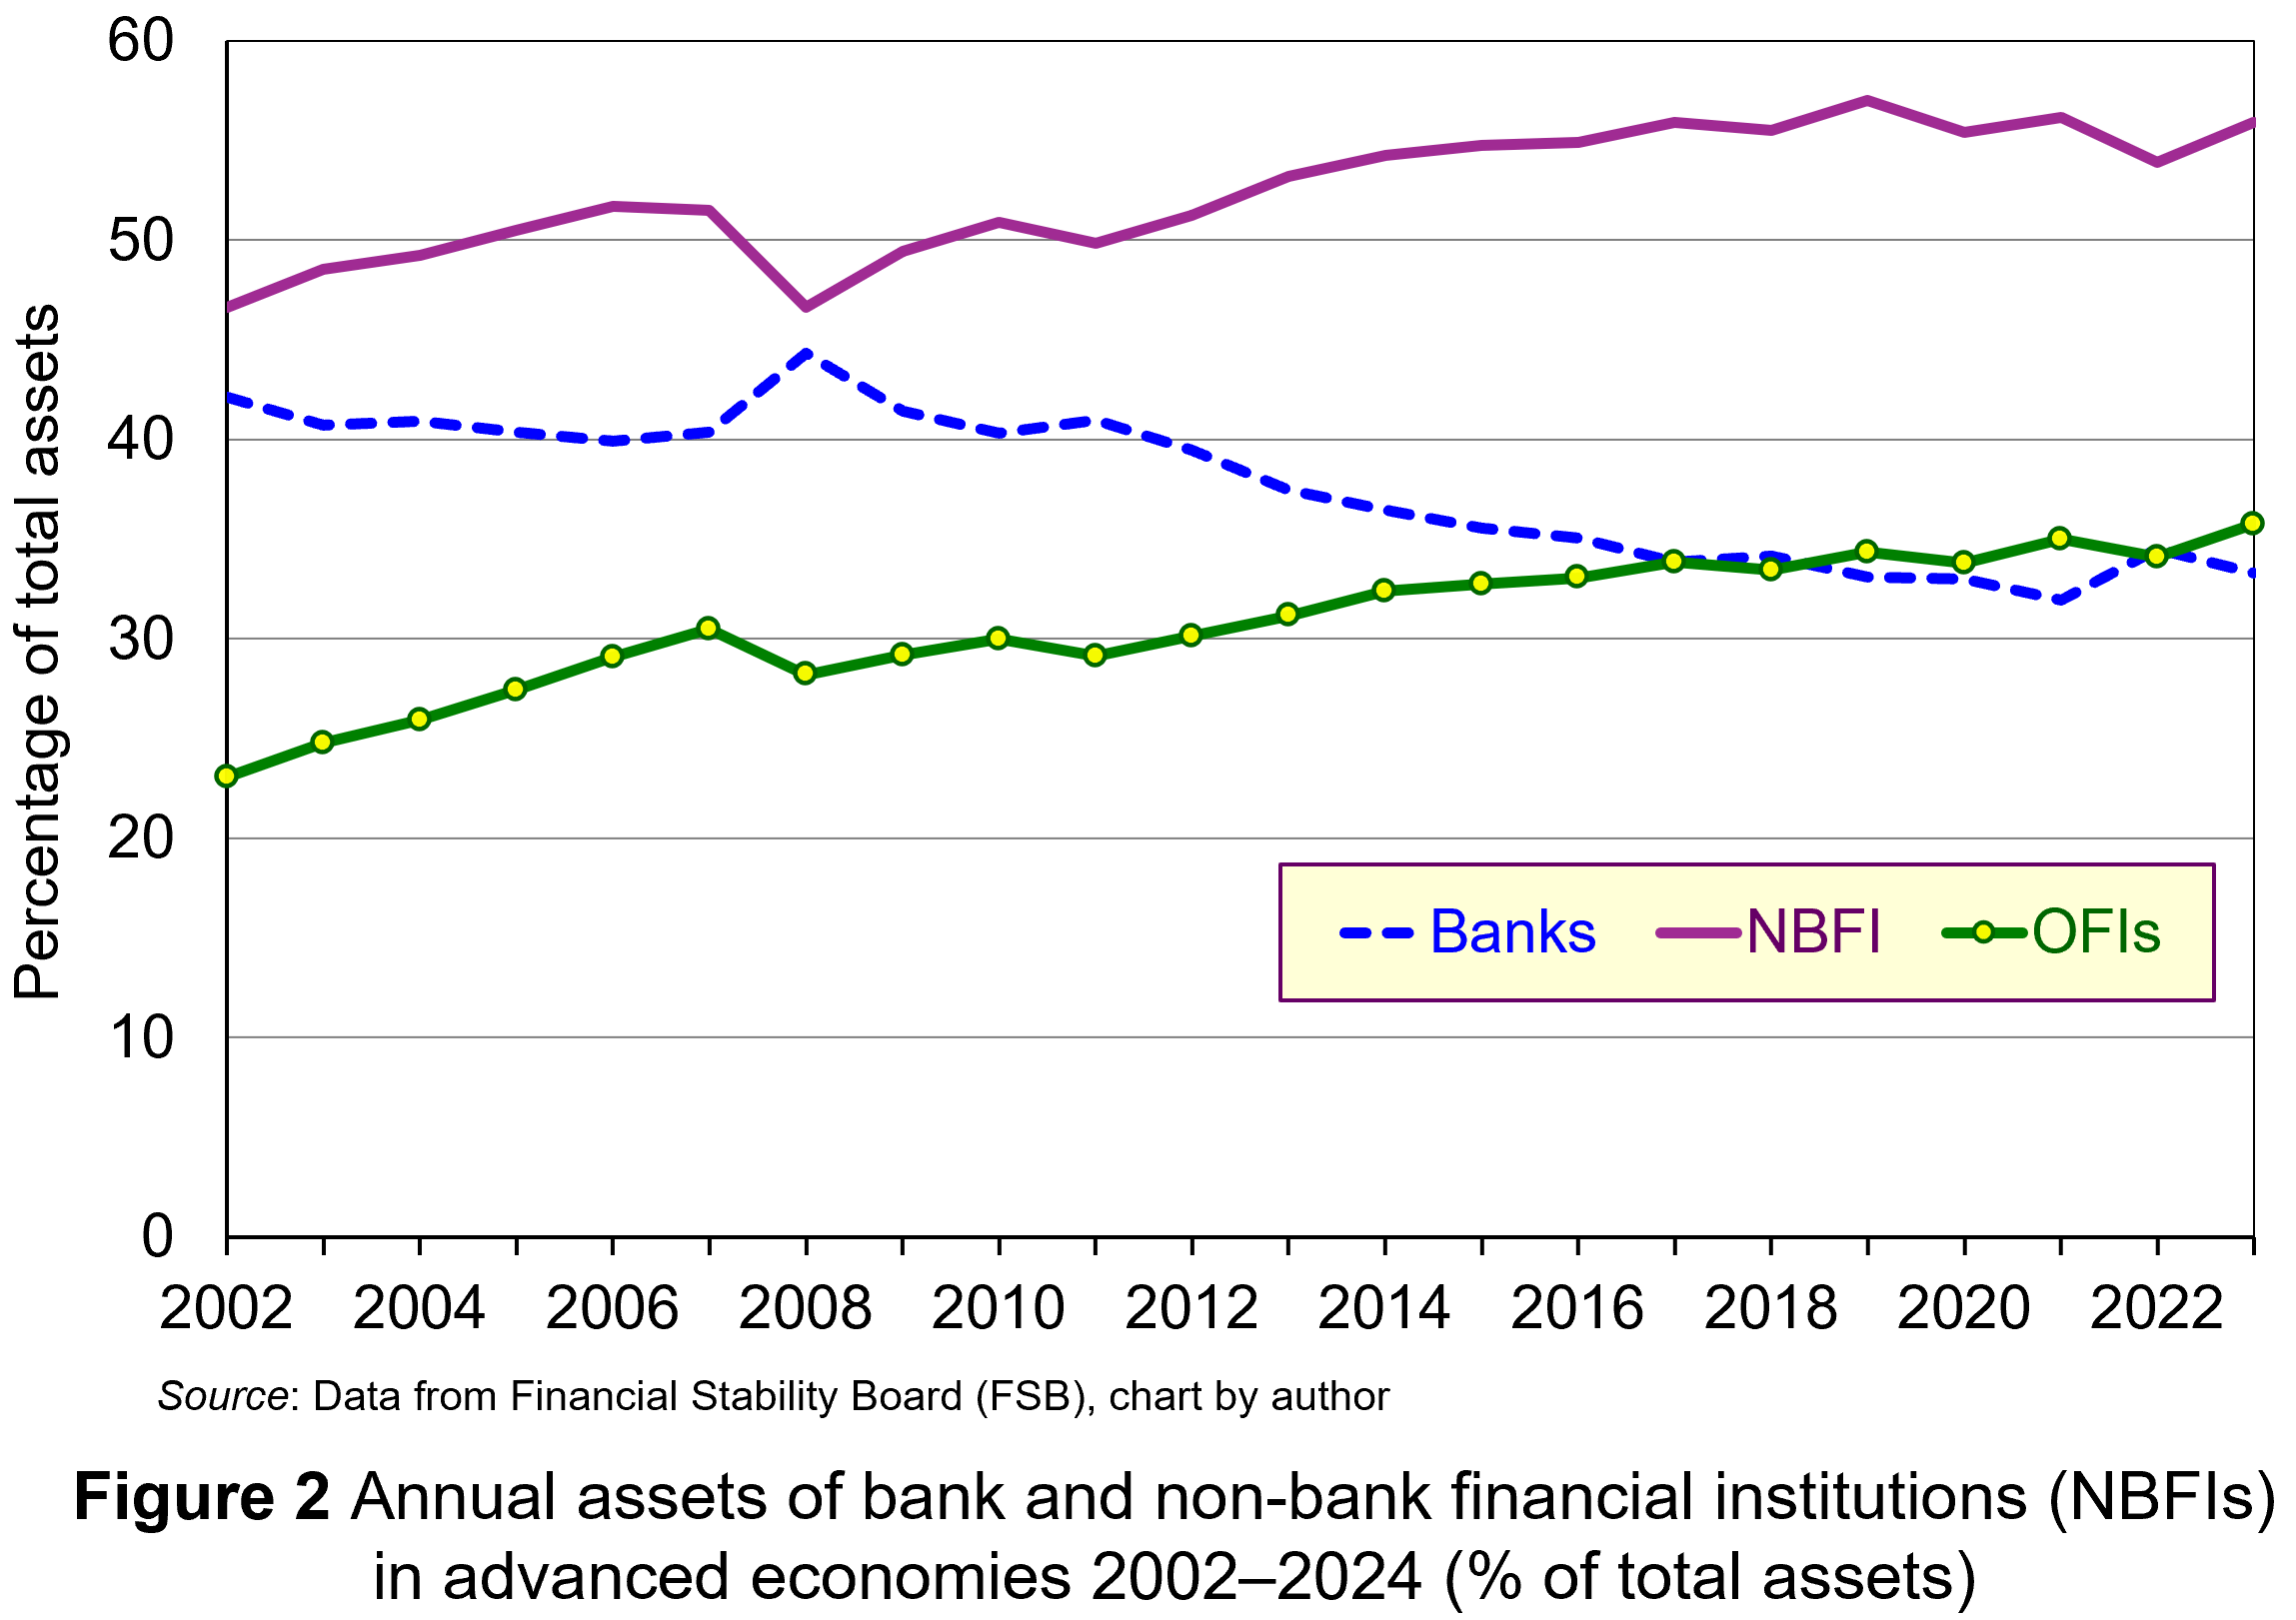 With banks originating less lending, activity has migrated to different avenues in the shadow-banking sector. This sector has always existed, but deregulation and financial innovation created opportunities for the growth of shadow banking – lending which is not financed with deposits. Traditionally, non-bank financial intermediaries (NBFIs), such as pension funds, hedge funds and insurance companies, use funds from investors to buy securities through financial markets. However, new types of NBFIs have emerged which originate loans themselves, notably private credit institutions. As Figure 2 illustrates, a lot of the expansion in the activities of NBFIs has been the due to increased lending by these institutions (defined as ‘other financial institutions (OFIs)). Note that the NBFI line includes OFIs. (Click here for a PowerPoint.)
Since, NBFIs operate outside conventional regulatory frameworks, their credit intermediation and maturity transformation are not subject to the same capital requirements or oversight that banks are. As a result, they do not need to have the same level of capital to insulate against loan losses. Therefore, lending in the shadow-banking sector has a lower marginal cost compared to equivalent lending in the banking sector. Consequently, it generates a higher rate of return. This can explain the large growth in the assets of OFIs illustrated in Figure 2.
Risks in shadow banking
 Banking involves trade-offs and this is the case whether the activities happen in the regulated or shadow-banking sector. Increasing lending increases profitability. But as lending continues to increase, at some point the risk-return profile becomes less favourable since institutions are lending to increasingly higher-risk borrowers and for higher-risk projects.
In downturns, when rates of defaults rise, such risks become apparent. Borrowers fail and default, causing significant loan losses for lenders. With lower levels of capital, NBFIs will have a lower buffer to insulate investors from these losses, increasing the likelihood of default.
Is this a problem? Well, for a long-time regulators thought not. It was thought that failures in the shadow-banking sector would have no implications for deposit-holders in regulated banks and the payments mechanism. Unfortunately, current developments in the USA have highlighted that this is unlikely to be the case.
The connections between regulated and shadow banking
The financial system is highly interconnected, and each successive financial crisis has shown that systemic risks lurk in obscure places. On the face of it, NBFIs appear separate from regulated banks. But banks’ new business models have not removed them from the lending channel, merely changed their role. Short-term financing used to be conducted and funded by banks. Now, it is conducted by NBFIs, but still financed by banks. Long-term loan financing is no longer on banks’ balance sheets. However, while the lending is conducted by NBFIs, it is largely funded by banks.
NBFIs cannot be repositories of liquidity. Since they do not have deposits and are not part of the payments system, they have no access to official liquidity backstops. So, they do so indirectly by using deposit-taking banks as liquidity insurance. Banks provide this liquidity in a variety of ways:
- Investing in the securities issued by private capital funds;
- Providing bridge financing to credit managers to securitise credit card receivables;
- Providing prime broker financing to a hedge fund engaged in proprietary trading.
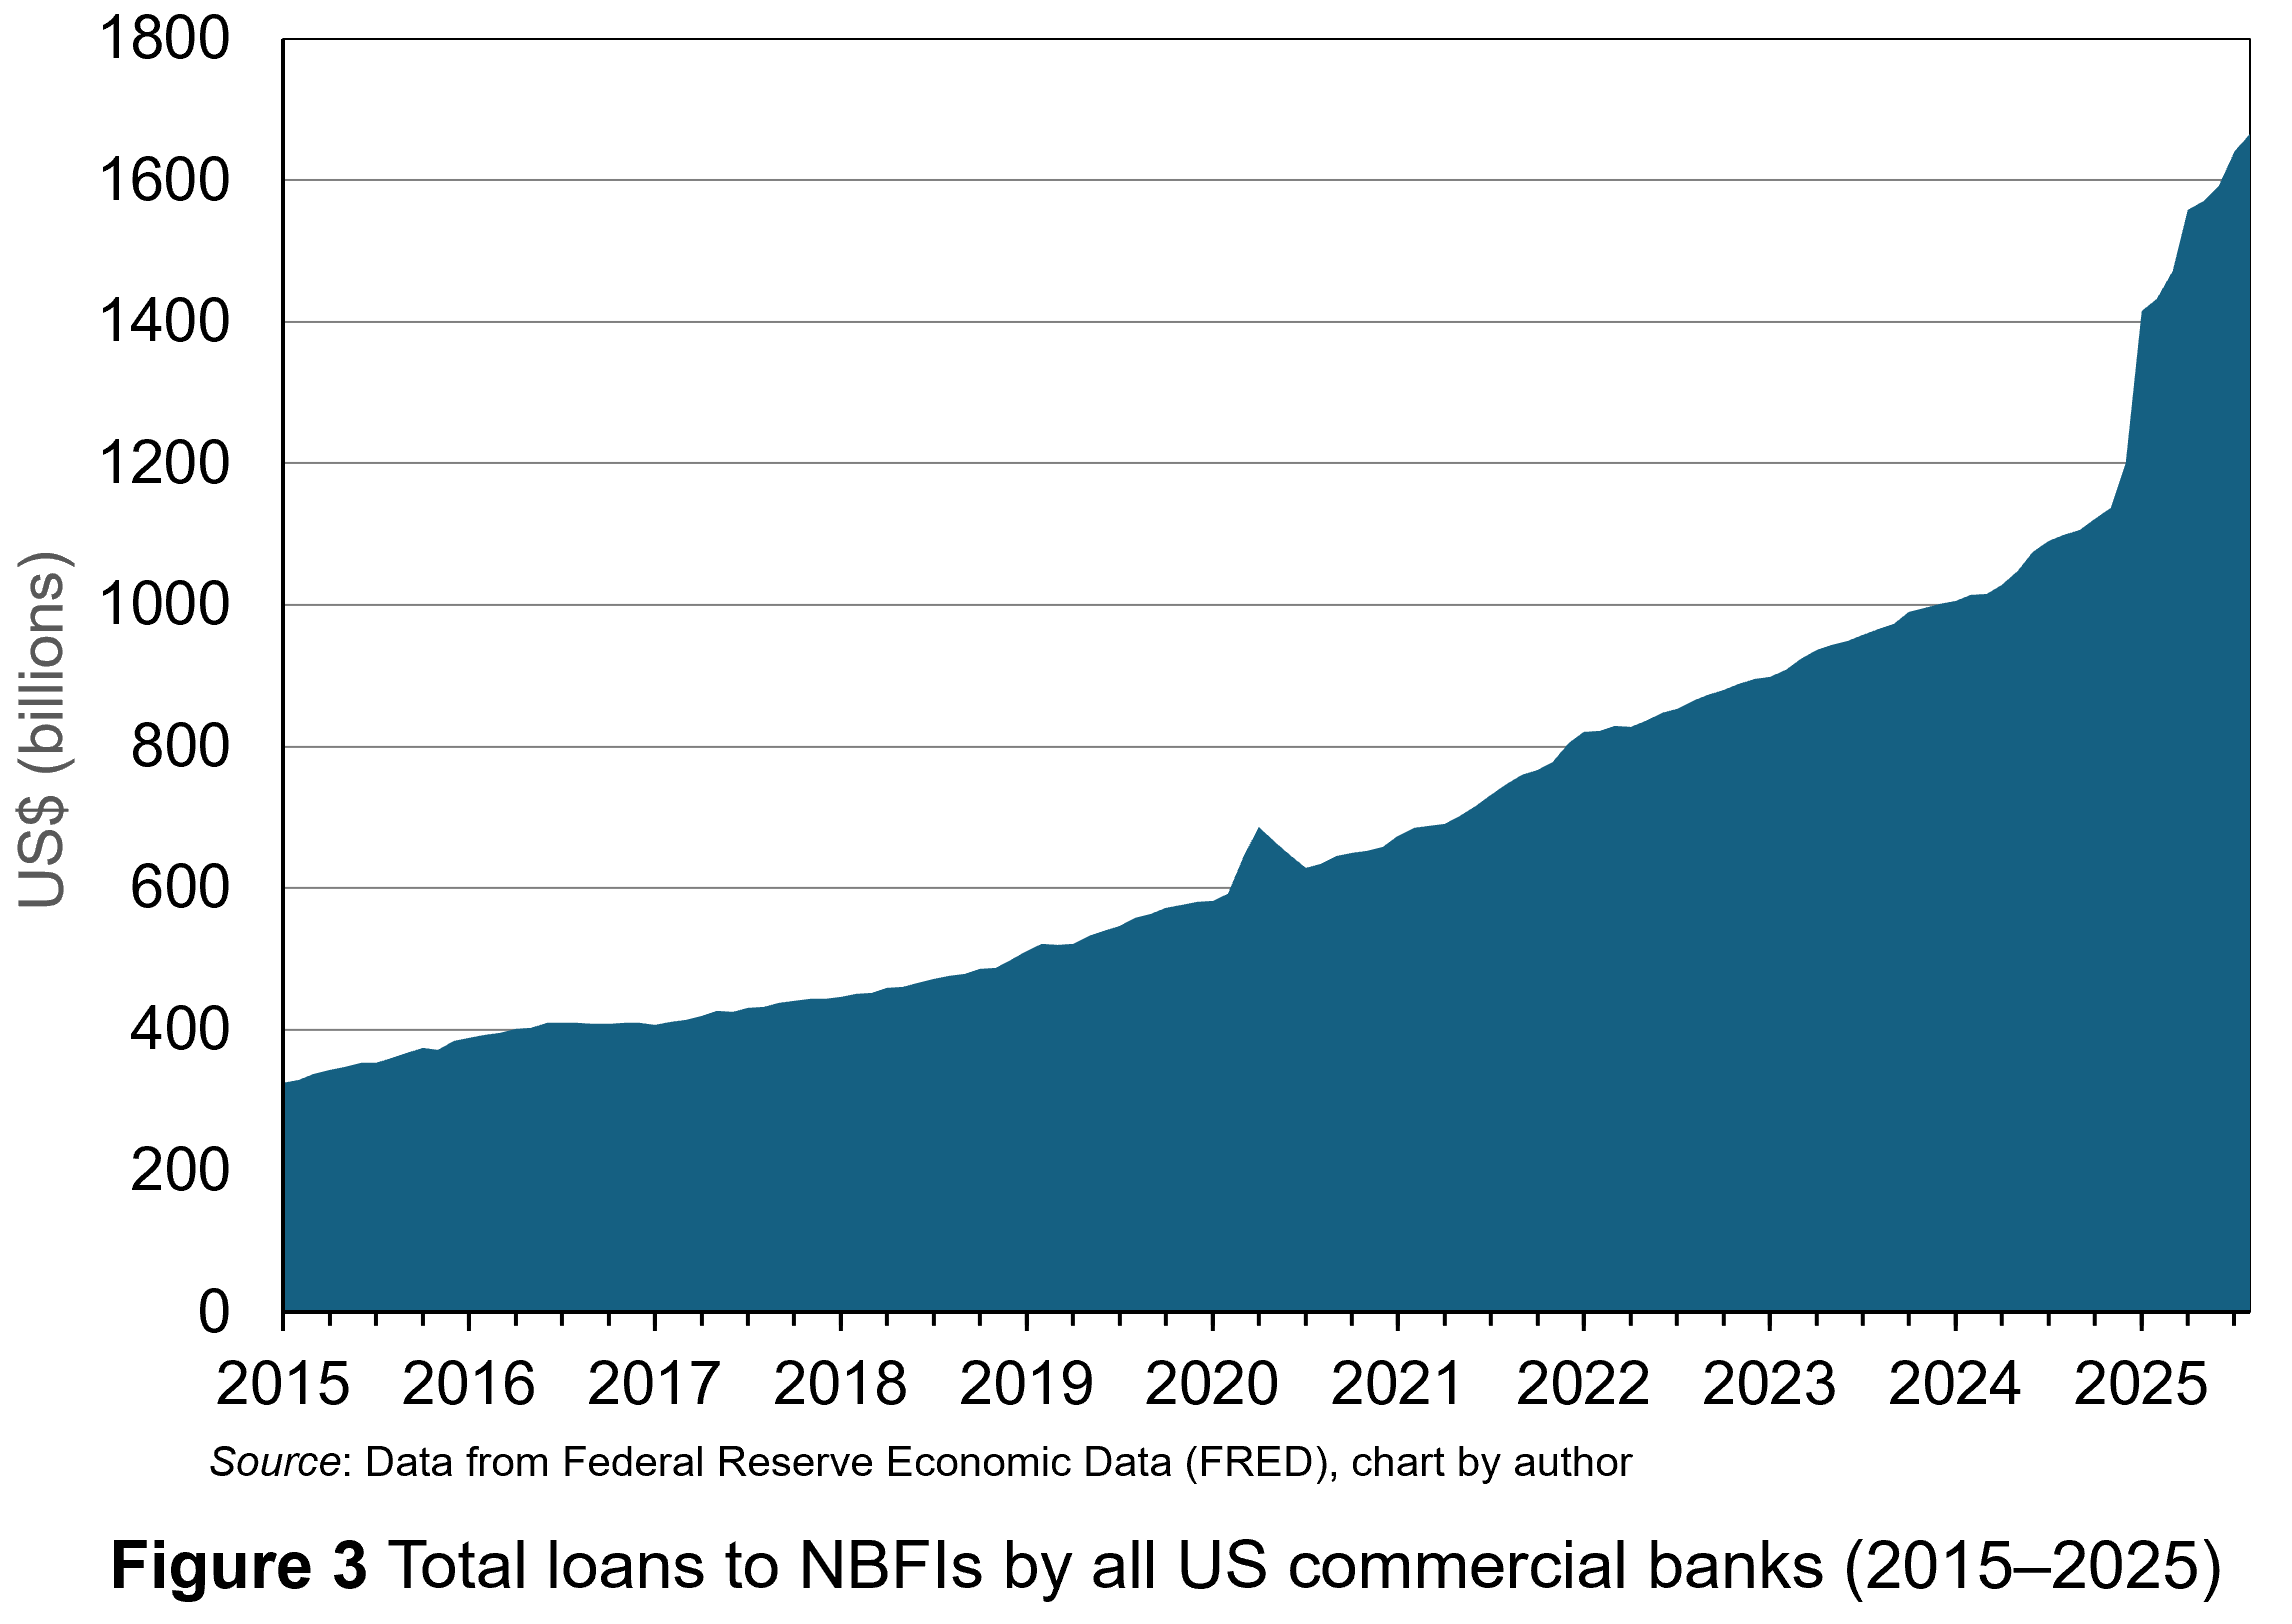 Furthermore, banks have increasingly made loans to NBFIs. Data for US commercial banks lending to the shadow-banking sector are publicly available only since 2015. But, as Figure 3 illustrates, it has seen a steady upward trend with a surge in activity in 2025. (Click here for a PowerPoint.)
Banks had an incentive to diversify into these activities since they are a source of revenue requiring less regulatory capital. The model requires risk and return to follow capital out of the banking system into the shadow-banking sector. However, while risky capital and its associated expected return have moved in the shadow-banking system, not all of the liquidity and credit default risk may have done so. Ultimately, some of that risk may be borne by the deposit-holders of the banks.
This is not an issue if banks are fully aware of the risks. However, problems arise when banks do not know the full risks they are taking.
There are reasons why this may be the case. Credit markets involve significant asymmetric information between lenders and borrowers. This creates conditions for the classic problems of moral hazard and adverse selection.
Moral hazard is a hidden action problem, whereby borrowers take greater risks because they share the possible downside losses with the lender. Adverse selection is the hidden information problem, whereby lenders do not have full information about the riskiness of borrowers or their activities.
The economics of information suggests that banks exploit scale, scope and learning economies to overcome the costs associated with asymmetric information in lending. However, that applies to direct lending when banks have full information about credit default risk on their loan book. When banks finance lending indirectly through NBFIs, there is an extension of the intermediation chain, and while banks may know the NBFIs, they will have much less information about the risks associated with the lending they are ‘underwriting’. This heightens their problems of asymmetric information associated with credit default risk.
What are the risks at present?
 The level of debt in the global economy is at unprecedented levels. Data from the International Monetary Fund (IMF) show that it rose to $351 trillion dollars in 2024, approximately 235% of weighted global gross domestic product (GDP). It is in this environment that private credit channels through NBFIs have been expanding. With this, it is more likely that NBFIs’ trade-off between credit risk and return has tilted greatly in favour of the former. Some point to the recent collapse of Tricolor and First Brands – both intermediary financing companies funded by private credit – as evidence of elevated levels of risk.
Many are pointing out that the failures observed in the USA so far have a whiff of fraud associated with them, with suggestions of multiple loans being secured against the same working capital. However, such behaviour is symptomatic of ‘late-cycle’ lending, where the incentive to squeeze more profit from lending in a more competitive environment leads to short-cuts – short-cuts that banks, at one stage removed along the intermediation chain, will have less information about.
It is in a downturn that such risks become apparent. Widening credit spreads and the reduced availability of credit causes financial stress for higher-risk borrowers. Inevitably, that higher risk will lead to higher defaults, more provision for loan losses and write-downs in the value of loan assets.
While investors in NBFIs are first in line to bear the losses, they are not the only ones exposed. At moments of stress, the credit lines that banks have provided get drawn and that increases the exposure of banks to the risks associated with NBFIs and whoever they have lent to. As NBFIs fail, the financing provided by banks will not be repaid and they will thus have to absorb losses associated with the lending of the NBFIs. So, while it appears that risk has left the banking system, it hasn’t. Ultimately, the liquidity and credit default risk of the non-bank sector is financed by bank deposits.
Furthermore, the opaqueness of the exposure of banks to risks in the shadow-banking sector may have issues for the wider financial system. In 2008, banks became wary of lending to each other during the financial crisis because they didn’t know the exposure of counterparty institutions to losses from securitised debt instruments. Now, as more and more banks reveal exposures to NBFIs, concerns about the unknown position of other banks may produce a repeat of the credit crunch which occurred then. A seizing up of credit markets will worsen any downturn. However, unlike 2008, the financial resources available to central banks and governments to deal with any consequences are severely limited.
Only time and the path of the US economy will reveal the extent of any contagion related to lending in the shadow-banking sector. However, central banks are already worried about the risks associated with the shadow-banking sector and have been taking steps to identify and ameliorate them. Events in the USA over the past few weeks may accelerate the process and bring more of that lending within the regulatory cordon.
Articles
- Bank chief says US firm collapses ring ‘alarm bells’
BBC News, Michael Sheils McNamee (21/10/25)
- BoE finds non-bank financial firms pose wider risks in crisis periods
Reuters, Lawrence White (2/12/24)
- Global Debt Remains Above 235% of World GDP
IMF Blogs, Vitor Gaspar, Carlos Eduardo Goncalves and Marcos Poplawski-Ribeiro (17/9/25)
- IMF sounds alarm about high global public debt, urges countries to build buffers
Reuters, Andrea Shalal (15/10/25)
- Major international banks performance 1980-91
Quarterly Bulletin 1992 Q3, Bank of England (1/9/92)
- Shadow Banking System: Definition, Examples, and How It Works
Investopedia, Michael Bromberg (18/10/24)
- What is private credit, and should we be worried by the collapse of US firms?
The Guardian, Kalyeena Makortoff (18/10/25)
Academic paper
Data
Questions
- Explain why the need to hold more capital raises its cost for banks.
- Why does this reduce the lending they undertake?
- What is the attraction of ‘off-balance sheet transactions’ for regulated banks?
- Analyse the asymmetric information that banks face when providing liquidity to non-bank financial institutions (NBFIs).
- Examine the dangers for the financial system associated with regulated banks’ exposure to NBFIs?
- Discuss some policy recommendations regarding bank lending to NBFIs.
The gold market has become one of the most talked-about commodity markets in 2025, with prices reaching record highs. This is largely due to increased demand from investors, who see gold as a ‘safe haven’ during times of economic and political uncertainty. Central banks are also buying more gold as a way to reduce their reliance on currencies like the US dollar. With many analysts predicting prices could reach over $4000 per ounce in the next year, the gold market is showcasing how supply and demand, confidence, and global events can all influence a commodity market.
The commodities market is where basic agricultural products, raw materials and metals, such as gold, are bought and sold, often in large quantities and across global exchanges. Commodities are typically traded either in their physical form (like gold bars) at current market prices (spot prices) or through financial contracts, where investors buy or sell in futures markets. These are where a price is agreed today to buy or sell on a specific future date.
As with other commodities, the price of gold is determined by supply and demand. Demand for gold typically rises during times of economic uncertainty as investors want a safer store of value. This results in an increase in its price. Supply and demand, and hence price, also respond to other factors, including interest rates, currency movements, economic growth and growth prospects, and geopolitical events.
Record high prices
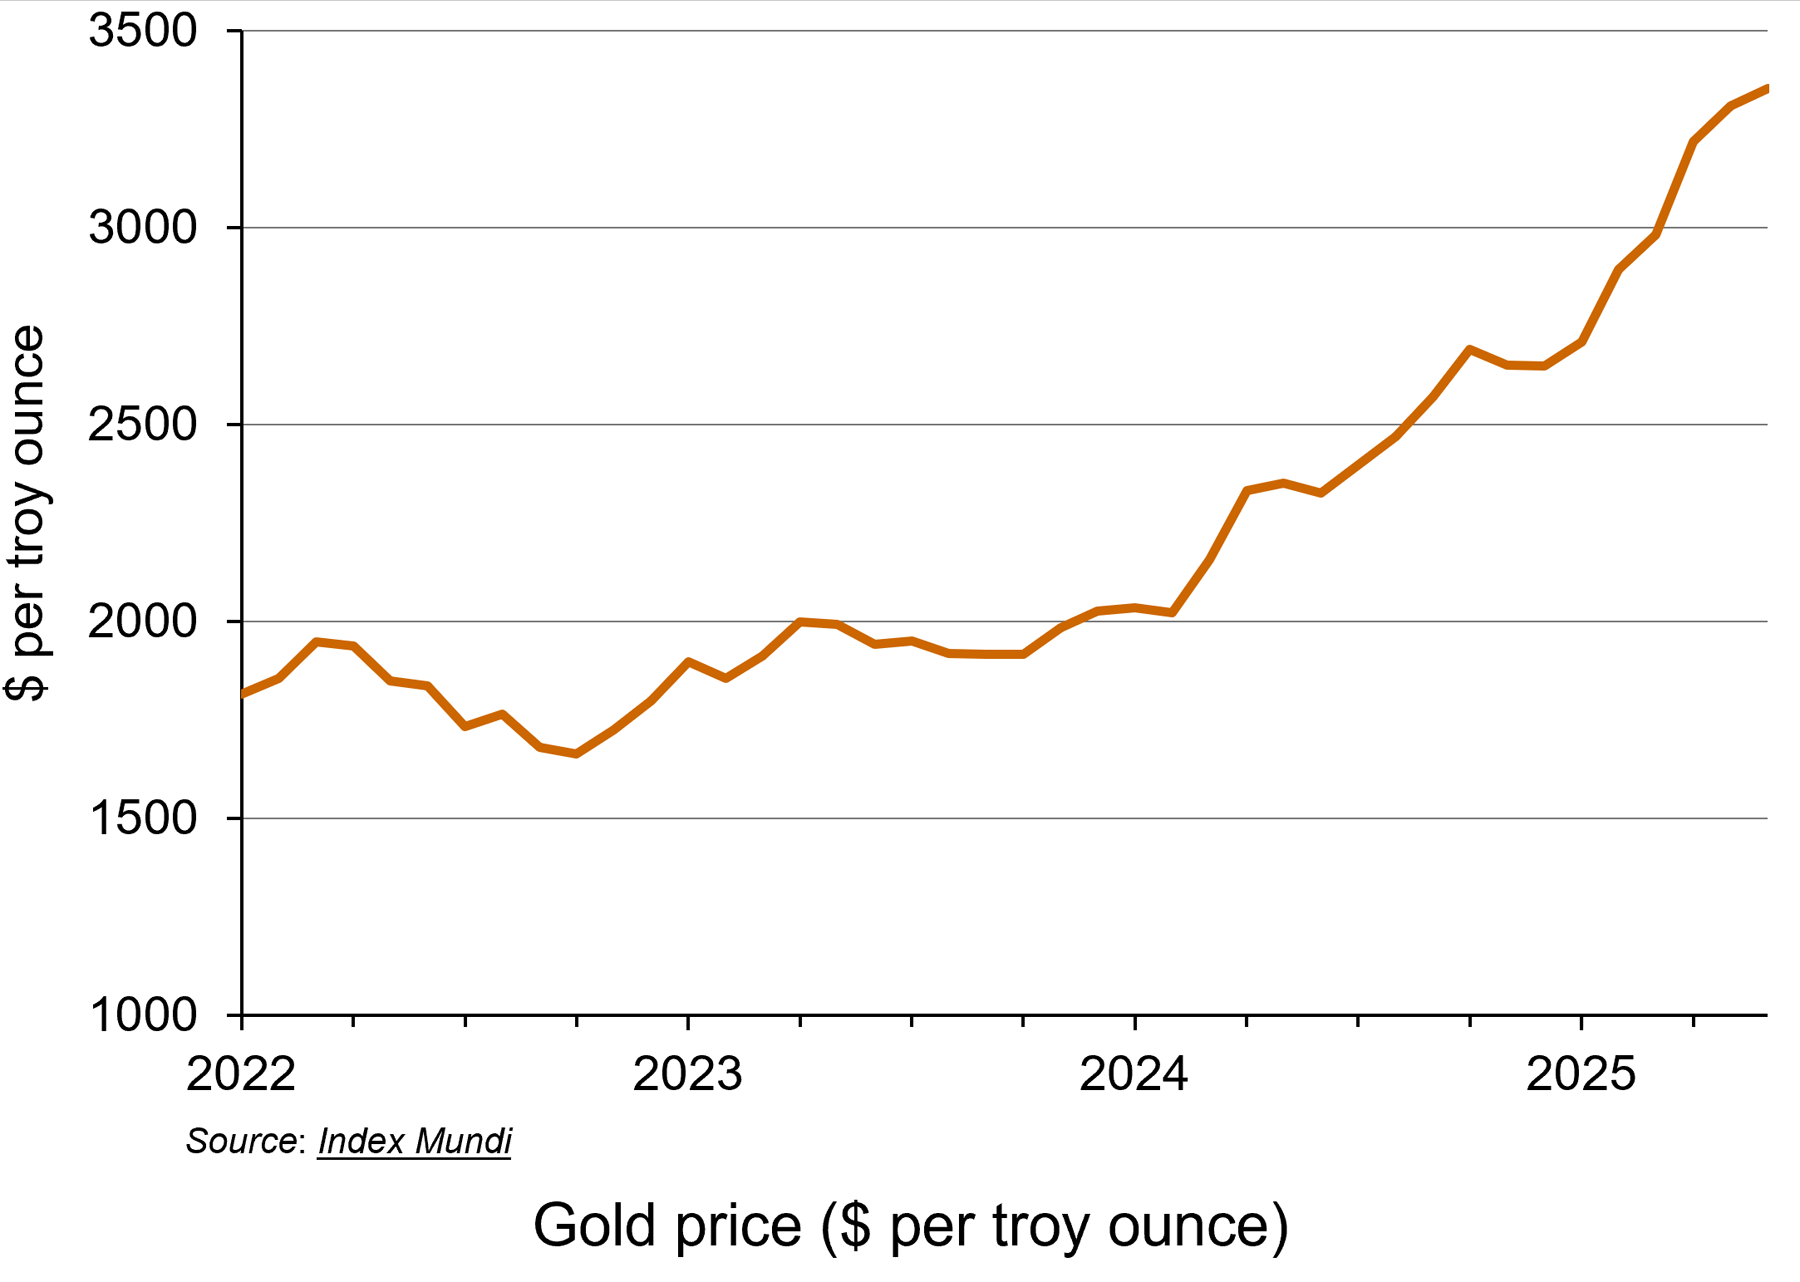 This year, the gold market has seen a remarkable rally, with the price of gold hitting a record high. Demand for the precious metal has resulted in spot prices surging over 35% to date (see the chart: click here for a PowerPoint). Rising prices earlier this year have been attributed to the US President, Donald Trump, announcing wide-ranging tariffs which have upset global trade. On 2 September, the spot gold price hit $3508.50 per ounce, continuing its upwards trend.
The price has also been lifted by expectations that the Federal Reserve (the US central bank) will cut its key interest rate, making gold an even more attractive prospect for investors. If the Federal Reserve cuts interest rates, the price of gold usually increases. This is because gold does not pay any interest or yield, so when interest rates are high, investors can earn better returns from alternatives, such as savings accounts or bonds. However, when interest rates fall, those returns become less attractive, making gold relatively more appealing.
Lower interest rates also tend to weaken the US dollar, which makes gold cheaper for foreign buyers, increasing global demand. Since gold is priced in dollars, a weaker dollar usually leads to higher gold prices.
Additionally, interest rate cuts are often a response to economic problems or uncertainty. As gold is viewed as a safer asset for investors during times of economic uncertainty, investors will typically increase their demand.
Unlike the market for currencies or shares, gold doesn’t rely on the performance of a government or company. This makes it attractive when people are worried about things like inflation, recession, war or stock market crashes. Gold is thus seen as a ‘safe haven’.
Gold and the Federal Reserve
The rise in the price of gold by more than a third this year can be linked to the US election last year, according to the director of research at BullionVault (see the BBC article below). Attitudes of the Trump administration towards the Federal Reserve have created concerns among investors. Fears that the US administration could erode the independence of the world’s most important central bank have fuelled the latest flows into the metal, which is traditionally viewed as a hedge against inflation.
According to the BBC article, Derren Nathan from Hargreaves Lansdown claims that it is Trump’s ‘attempts to undermine the independence of the Federal Reserve Bank’ that were ‘driving renewed interest in safe haven assets, including gold’. Investors are concerned that a politicised Fed would be more inclined to cut interest rates than would otherwise be the case, sending long-term inflation expectations higher.
This could lead to fears that future interest rates would then be pushed higher. This would increase the yields on longer-term government bonds by pushing down their price, as investors demand higher compensation for the increased risk of higher future interest rates reducing the value of their fixed-rate investments. This would force the US Treasury to pay higher interest on new bonds, making it more expensive to service US government debt.
Expected price rises for 2026
As we saw above, it is predicted that the price of gold will rise to $4000 per ounce next year. However, if the market sees investors move away from dollar assets, such as US Treasuries, the price increases would be even higher. Daan Struyven, co-head of global commodities research at Goldman Sachs explains ‘If 1 per cent of the privately owned US Treasury market were to flow to gold, the gold price would rise to nearly $5000 per troy ounce’ (see Financial Times article below).
 If the Federal Reserve does come under political pressure, it could affect the stability of the US economy and beyond. When gold prices rise sharply, demand usually falls in countries like China and India, which are the world’s largest buyers of gold jewellery. However, in 2025, this trend has changed. Instead of reducing their gold purchases, people in these countries have started buying investment gold, such as bars and coins, showing a shift in consumer behaviour from jewellery to investment assets.
At the same time, global events are also influencing the gold market. Suki Cooper, a metals analyst at Standard Chartered, said that events like Russia’s invasion of Ukraine have added to political uncertainty, which tends to increase demand for gold as a safe-haven asset. She also highlighted how changes in international trade policies have disrupted supply chains and contributed to higher inflation, both of which have made gold more attractive to investors. Additionally, a weaker US dollar earlier in the year made gold cheaper for buyers using other currencies, which boosted global demand even further.
Conclusion
Although the gold market is expected to remain strong over the next six months, some uncertainty remains. Many analysts predict that gold prices will stay high or even increase further, especially if interest rates in the US are cut as expected. Continued global instability, is also likely to keep demand for gold as a safe haven high. At the same time, if inflation stays elevated or trade disruptions continue, more investors may turn to gold to protect their wealth.
However, if economic conditions stabilise or interest rates rise again, gold demand could fall slightly, leading to a potential dip in prices. Overall, the outlook for gold remains positive, but sensitive to changes in global economic and political events.
Articles
- Gold price hits record high as investors seek safety
BBC News, Faarea Masud (2/9/25)
- Safe-haven gold rally gains further momentum after soft US data
Reuters, Sherin Elizabeth Varghese and Ashitha Shivaprasad (3/9/25)
- Gold vaults $3,000 in rush for safety from market, political worry
Reuters, Sherin Elizabeth Varghese and Anmol Choubey (14/3/25)
- The foundation of gold’s rally to historic highs started back in 2022
CNBC, Suki Cooper (17/3/25)
- Gold could hit nearly $5,000 if Trump undermines Fed, says Goldman Sachs
Financial Times, Emily Herbert (4/9/25)
- London’s bullion market set to trial digital gold
City AM, Maisie Grice (3/8/25)
- Gold price hits record high as investors seek safe haven
The Guardian, Julia Kollewe (2/9/25)
Data
Questions
- What factors influence the price of a commodity such as gold on the global market?
- Use a demand and supply diagram to illustrate what has been happening to the gold price in recent months.
- Find out what has been happening to silver prices. Are the explanations for the price changes the same as for gold?
- Why might investors choose to buy gold during times of economic or political uncertainty?
- How will changes in interest rates affect both the demand for and the price of gold?
- What are the possible consequences of rising gold prices for countries like India and China, where there is a traditionally high demand for gold jewellery?
- How do global events impact commodity markets? Use gold as an example in your answer.