 The UK’s poor record on productivity since the 2008 financial crisis is well documented, not least in this blog series. Output per worker has flatlined over the 17 years since the crisis. As was noted in the blog, The UK’s poor productivity record, low UK productivity is caused by a number of factors, including the lack of investment in training, the poor motivation of many workers and the feeling of being overworked, short-termism among politicians and management, and generally poor management practices.
One of the most significant issues identified by analysts and commentators is the lack of investment in physical capital, both by private companies and by the government in infrastructure. Gross fixed capital formation (a measure of investment) has been much lower in the UK compared to international competitors.
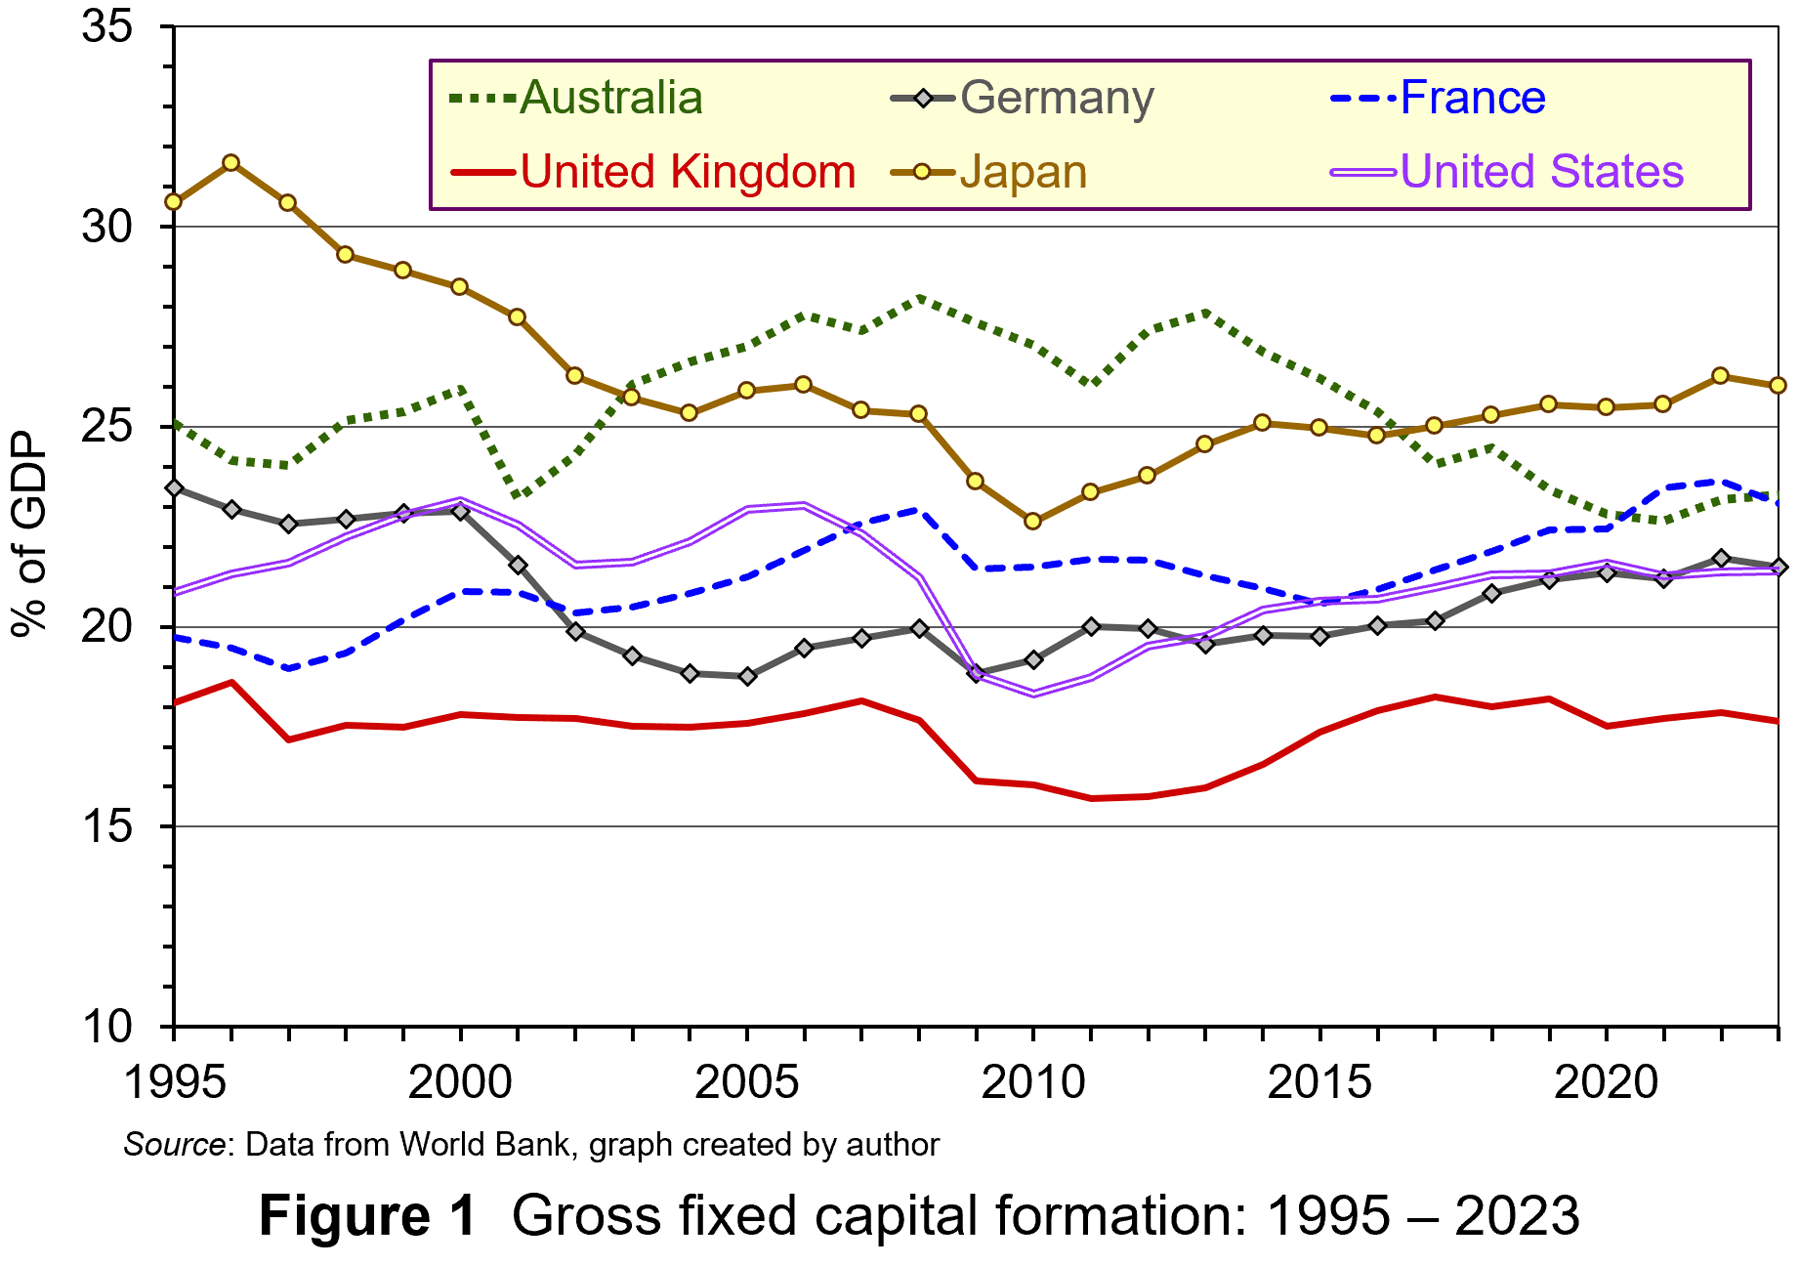 From Figure 1 it can be observed that, since the mid-1990s, the UK has consistently had lower investment as a percentage of GDP compared to other significant developed market economies. The cumulative effect of this gap has contributed to lower productivity and lower economic growth.
Interestingly, since the financial crisis, UK firms have had high profitability and associated high cash holdings. This suggests that firms have had a lot of financial resources to reinvest. However, data from the OECD suggests that reinvestment rates in the UK, typically 40–50% of profit, are much lower than in many other OECD countries. In the USA the rate is 50%, in Germany 60–70% and in Japan 70%+. There is much greater emphasis in the UK on returning funds to shareholders through dividends and share buybacks. However, the reinvestment of much of this cash within firms could have gone some way to addressing the UK’s investment gap – but, it hasn’t been done.
 Analysis by the OECD suggest that, while the cost of financing investment has declined since the financial crisis, the gap between this and the hurdle rate used to appraise investments has widened. Between 2010 and 2021 the difference nearly doubled to 4%. This increase in the hurdle rate can be related to increases in the expected rate of return by UK companies and their investors.
In this blog we will analyse (re)investment decisions by firms, discussing how increases in the expected rate of return in the UK raise the hurdle rate used to appraise investments. This reduces the incentive to engage in long-term investment. We also discuss policy prescriptions to improve reinvestment rates in the UK.
Investment and the expected rate of return
Investment involves the commitment of funds today to reap rewards in the future. This includes spending on tangible and intangible resources to improve the productive capacity of firms. Firms must decide whether the commitment of funds is worthwhile. To do so, economic theory suggests that they need to consider the compensation required by their provider of finance – namely, investors.
What rewards do investors require to keep their funds invested with the firm?
When conducting investment appraisal, firms compare the estimated rate of return from an investment with the minimum return investors are prepared to receive (termed the ‘expected return’). Normally this is expressed as a percentage of the initial outlay. Firms have to offer returns to investors which are equal to or greater than the minimum expected return – the return that is sufficient to keep funds invested in the firm. Therefore, returns above this minimum expected level are termed ‘excess returns’.
When firms conduct appraisals of potential investments, be it in tangible or intangible capital, they need to take into account the fact that net benefits, expressed as cash flows, will accrue over the life of the investment, not all at once. To do this, they use discounted cash flow (DCF) analysis. This converts future values of the net benefits to their present value. This is expressed as follows:

Where:
NPV = Net present value (discounted net cash flows);
K = Capital outlay (incurred at the present time);
C = Net cash flows (occur through the life of the investment project);
r = Minimum expected rate of return.
In this scenario, the investment involves an initial cash outlay (K), followed in subsequent periods by net cash inflows each period over the life of the investment, which in this case is 25 years. All the cash flows are discounted back to the present so that they can be compared at the same point in time.
The discount rate (r) used in appraisals to determine the present value of net cash flows is determined by the minimum expected return demanded by investors. If at that hurdle rate there are positive net cash flows (+NPV), the investment is worthwhile and should be pursued. Conversely, if at that hurdle rate there are negative net cash flows (–NPV), the investment is not worthwhile and should not be pursued.
According to economic theory, if a firm cannot find any investment projects that produce a positive NPV, and therefore satisfy the minimum expected return, it should return funds to shareholders through dividends or share buybacks so that they can invest the finance more productively.
Firm-level data from the OECD suggest that UK firms have had higher profits and this has been associated with increased cash holdings. But, due to the higher hurdle rate, less investment is perceived to be viable and thus firms distribute more of their profits through dividends and share buybacks. These payouts represent lost potential investment and cumulatively produce a significant dent in the potential output of the UK economy.
Why are expected rates of return higher in the UK?
This higher minimum rate of expected return can be explained by factors influencing its determinants; opportunity cost and risk/uncertainty.
Higher opportunity cost. Opportunity cost relates to the rate of return offered by alternatives. Investors and, by implication firms, will have to consider the rate of return offered by alternative investment opportunities. Typically, investors have focused on interest rates as a measure of opportunity cost. Higher interest rates raise the opportunity cost of an investment and increase the minimum expected rate of return (and vice versa with lower interest rates).
 However, it is not interest rates that have increased the opportunity cost, and hence the minimum expected rate of return associated with investment, in the UK since the financial crisis. For most of the period since 2008, interest rates have been extremely low, sitting at below 1%, only rising significantly during the post-pandemic inflationary surge in 2022. This indicates that this source of opportunity cost for the commitment of business investment has been extremely low.
However, there may be alternative sources of opportunity cost which are pushing up the expected rate of return. UK investors are not restricted to investing in the UK and can move their funds between international markets determined by the rate of return offered. The following table illustrates the returns (in terms of percentage stock market index gain) from investing in a sample of UK, US, French and German stock markets between August 2010 and August 2025.
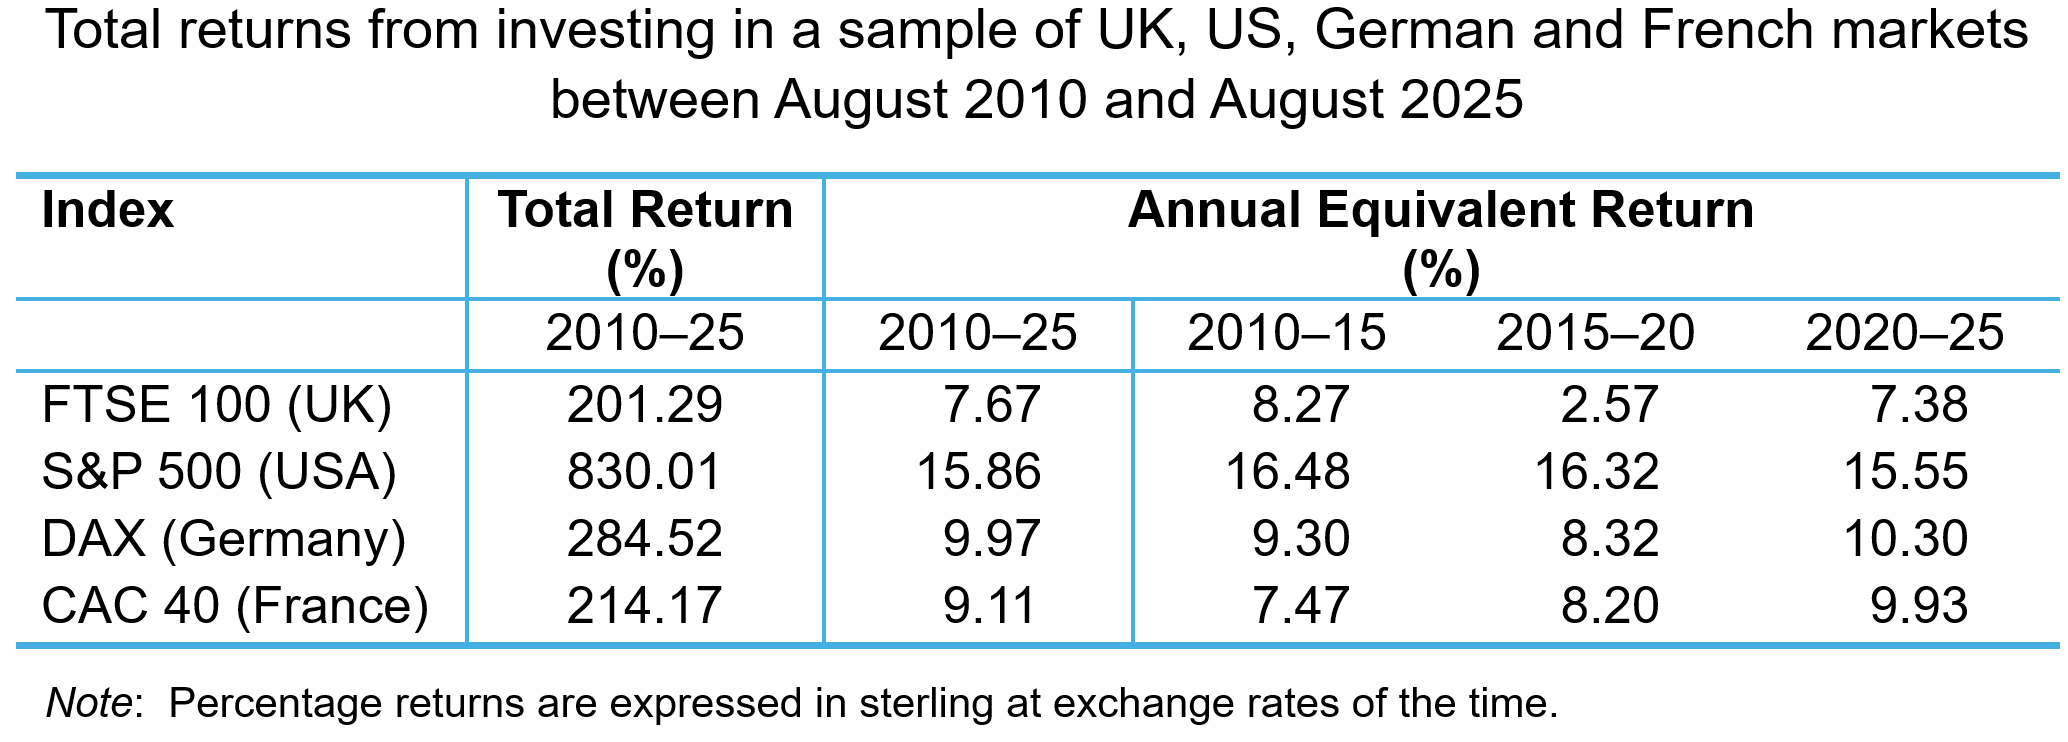
When expressed in sterling, returns offered by UK-listed companies are lower across the whole period and in most of the five-yearly sub-periods. Indeed, the annual equivalent rate of return (AER) for the FTSE 100 index across the whole period is less than half that of the S&P 500. The index offered a paltry annual return of 2.57% between 2015 and 2020, while the US index offered a return of 16.48%. Both the French and German indices offered higher rates of return, in the latter part of the period particularly. This represents a higher opportunity cost for UK investors and may have increased their expectations about the return they require for UK investments.
Greater perceived risk/uncertainty. Expected rates of return are also determined by perceptions of risk and uncertainty – the compensation investors need to bear the perceived risk associated with an investment. Investors are risk averse. They demand higher expected return as compensation for higher perceived risk. Higher levels of risk aversion increase the expected rate of return and related investment hurdle rates.
 There has been much discussion of increased uncertainty and risk aversion among global investors and firms (see the blogs Rising global uncertainty and its effects, World Uncertainty Index, The Chancellor’s fiscal dilemma and Investment set to fall as business is baffled by Trump). The COVID-19 pandemic, inflation shocks, the war in Ukraine, events across the Middle East and the trade policies adopted by the USA in 2025 have combined to produce a very uncertain business environment.
While these have been relatively recent factors influencing world-wide business uncertainty, perceptions of risk and uncertainty concerning the UK economy seem to be longer established. To measure policy-related economic uncertainty in the UK, Baker, Bloom and Davis at www.PolicyUncertainty.com construct an index based on the content analysis of newspaper articles mentioning terms reflecting policy uncertainty.
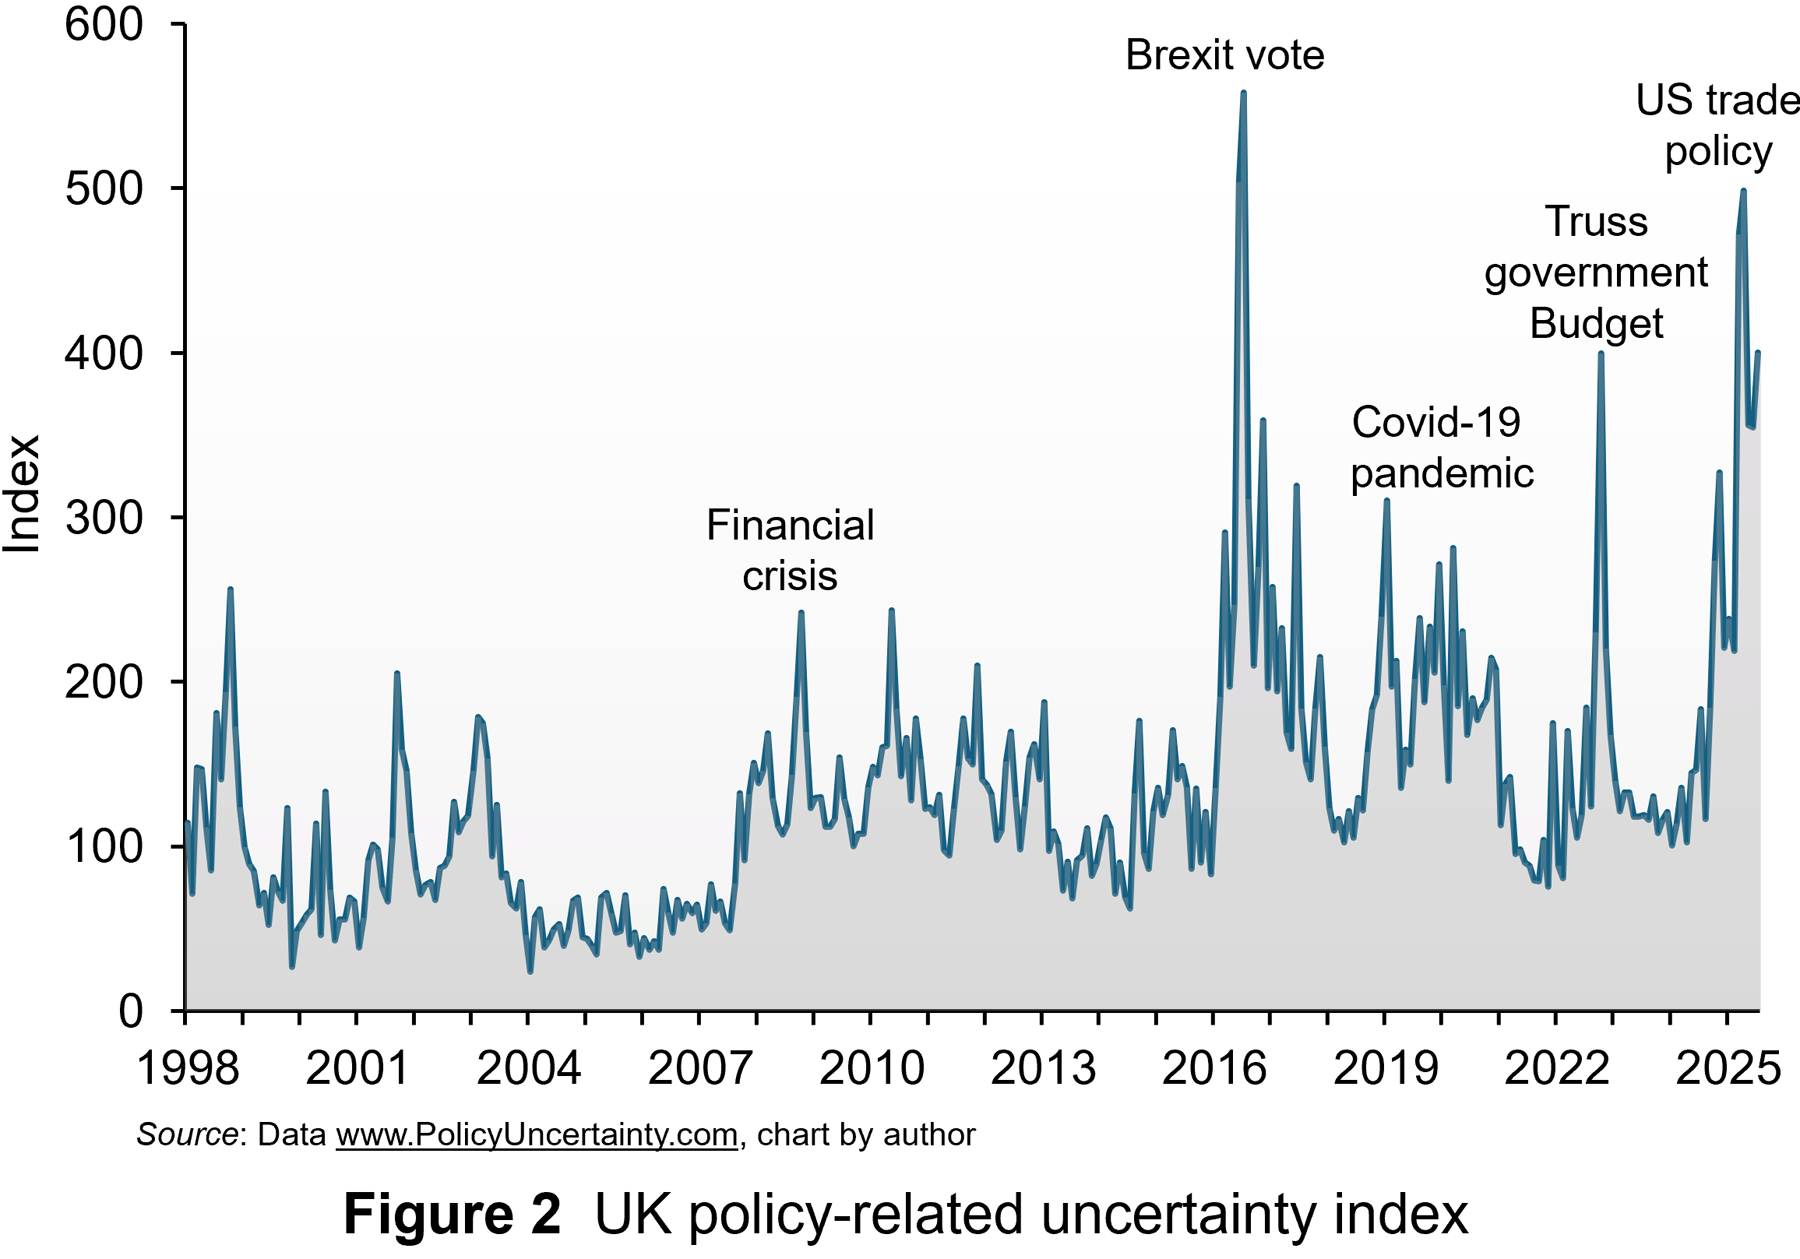 Figure 2 illustrates the monthly index from 1998 to July 2025. The series is normalised to standard deviation 1 prior to 2011 and then summed across papers, by month. Then, the series is normalised to mean 100 prior to 2011.
Some of the notable spikes in uncertainty in the UK since 2008 have been labelled. Beginning with the global financial crisis, investors and firms became much more uncertain. This was exacerbated by a series of economic shocks that hit the economy, one of which, the narrow vote to leave the European Union in 2016, was specific to the UK. This led to political turmoil and protracted negotiations over the terms of the trade deal after the UK left. This uncertainty has been exacerbated recently by the series of global shocks highlighted above and also the budget uncertainty of Liz Truss’s short-lived premiership and now the growing pressure to reduce government borrowing.
While spikes in uncertainty occurred before the financial crises, the average level of uncertainty, as measured by the index, has been much higher since the crisis. From 1998 to 2008, the average value was 89. Since 2008, the average value has been 163. Since the Brexit vote, the average value has been 185. This indicates a much higher perception of risk and uncertainty over the past 15 year and this translates into higher minimum expected return as compensation. Consequently, this makes many long-term investment projects less viable because of higher hurdle rates. This produces less productive investment in capital, contributing significantly to lower productivity.
Policy proposals
There has been much debate in the UK about promoting greater long-term investment. Reforms have been proposed to improve public participation in long-term investment through the stock market. To boost investment, this would require the investing public to be prepared to accept lower expected returns for a given level of risk or accept higher risk for a given level of returns.
Evidence suggests that the appetite for this may be very low. UK savers tend to favour less risky and more liquid cash deposits. It may be difficult to encourage them to accept higher levels of risk. In any case, even if they did, many may invest outside the UK where the risk-return trade-off is more favourable.
 Over the past 10 years, policy uncertainty has played a significant role in deterring investment. So, if there is greater continuity, this may then promote higher levels of investment.
The Labour government has proposed policies which aim to share or reduce the risk/uncertainty around long-term investment for UK businesses. For instance, a National Wealth Fund (NWF) has been established to finance strategic investment in areas such as clean energy, gigafactories and carbon capture. Unfortunately, the Fund is financed by borrowing through financial markets and the amount expected to be committed over the life of the current Parliament is only £29 billion, assuming that private capital matches public commitments in the ratio expected. It is questionable whether the Fund’s commitment will be sufficient to attract private capital.
Alternatively, Invest 2035 is a proposal to create a stable, long-term policy environment for business investment. It aims to establish an Industrial Strategy Council for policy continuity and to tackle issues like improving infrastructure, reducing energy costs and addressing skills gaps. Unfortunately, even if there is some attempt at domestic policy stability, the benefits may be more than offset by perceptions around global uncertainty, which may mean that UK investors’ minimum expected rates of return remain high and long-term investment low for the foreseeable future.
Articles
Data
Questions
- Use the marginal efficiency of capital framework to illustrate the ‘lost’ investment spending in the UK due to the investment hurdle rate being higher than the cost of capital.
- Explain the arbitrage process which produces the differences in valuations of UK securities and foreign ones due to differences in the expected rate of return.
- Sketch an indifference curve for a risk-averse investor, treating expected return and risk as two characteristics of a financial instrument.
- How does higher uncertainty affect the slope of an indifference curve for such an investor? How does this affect their investment hurdle rate?
- Analyse the extent to which the proposed polices can reduce the investment hurdle rate for UK companies and encourage greater levels of investment.
In a blog in October 2024, we looked at global uncertainty and how it can be captured in a World Uncertainty Index. The blog stated that ‘We continue to live through incredibly turbulent times. In the past decade or so we have experienced a global financial crisis, a global health emergency, seen the UK’s departure from the European Union, and witnessed increasing levels of geopolitical tension and conflict’.
Since then, Donald Trump has been elected for a second term and has introduced sweeping tariffs. What is more, the tariffs announced on so-called ‘Liberation Day‘ have not remained fixed, but have fluctuated with negotiations and threatened retaliation. The resulting uncertainty makes it very hard for businesses to plan and many have been unwilling to commit to investment decisions. The uncertainty has been compounded by geopolitical events, such as the continuing war in Ukraine, the war in Gaza and the June 13 Israeli attack on Iran.
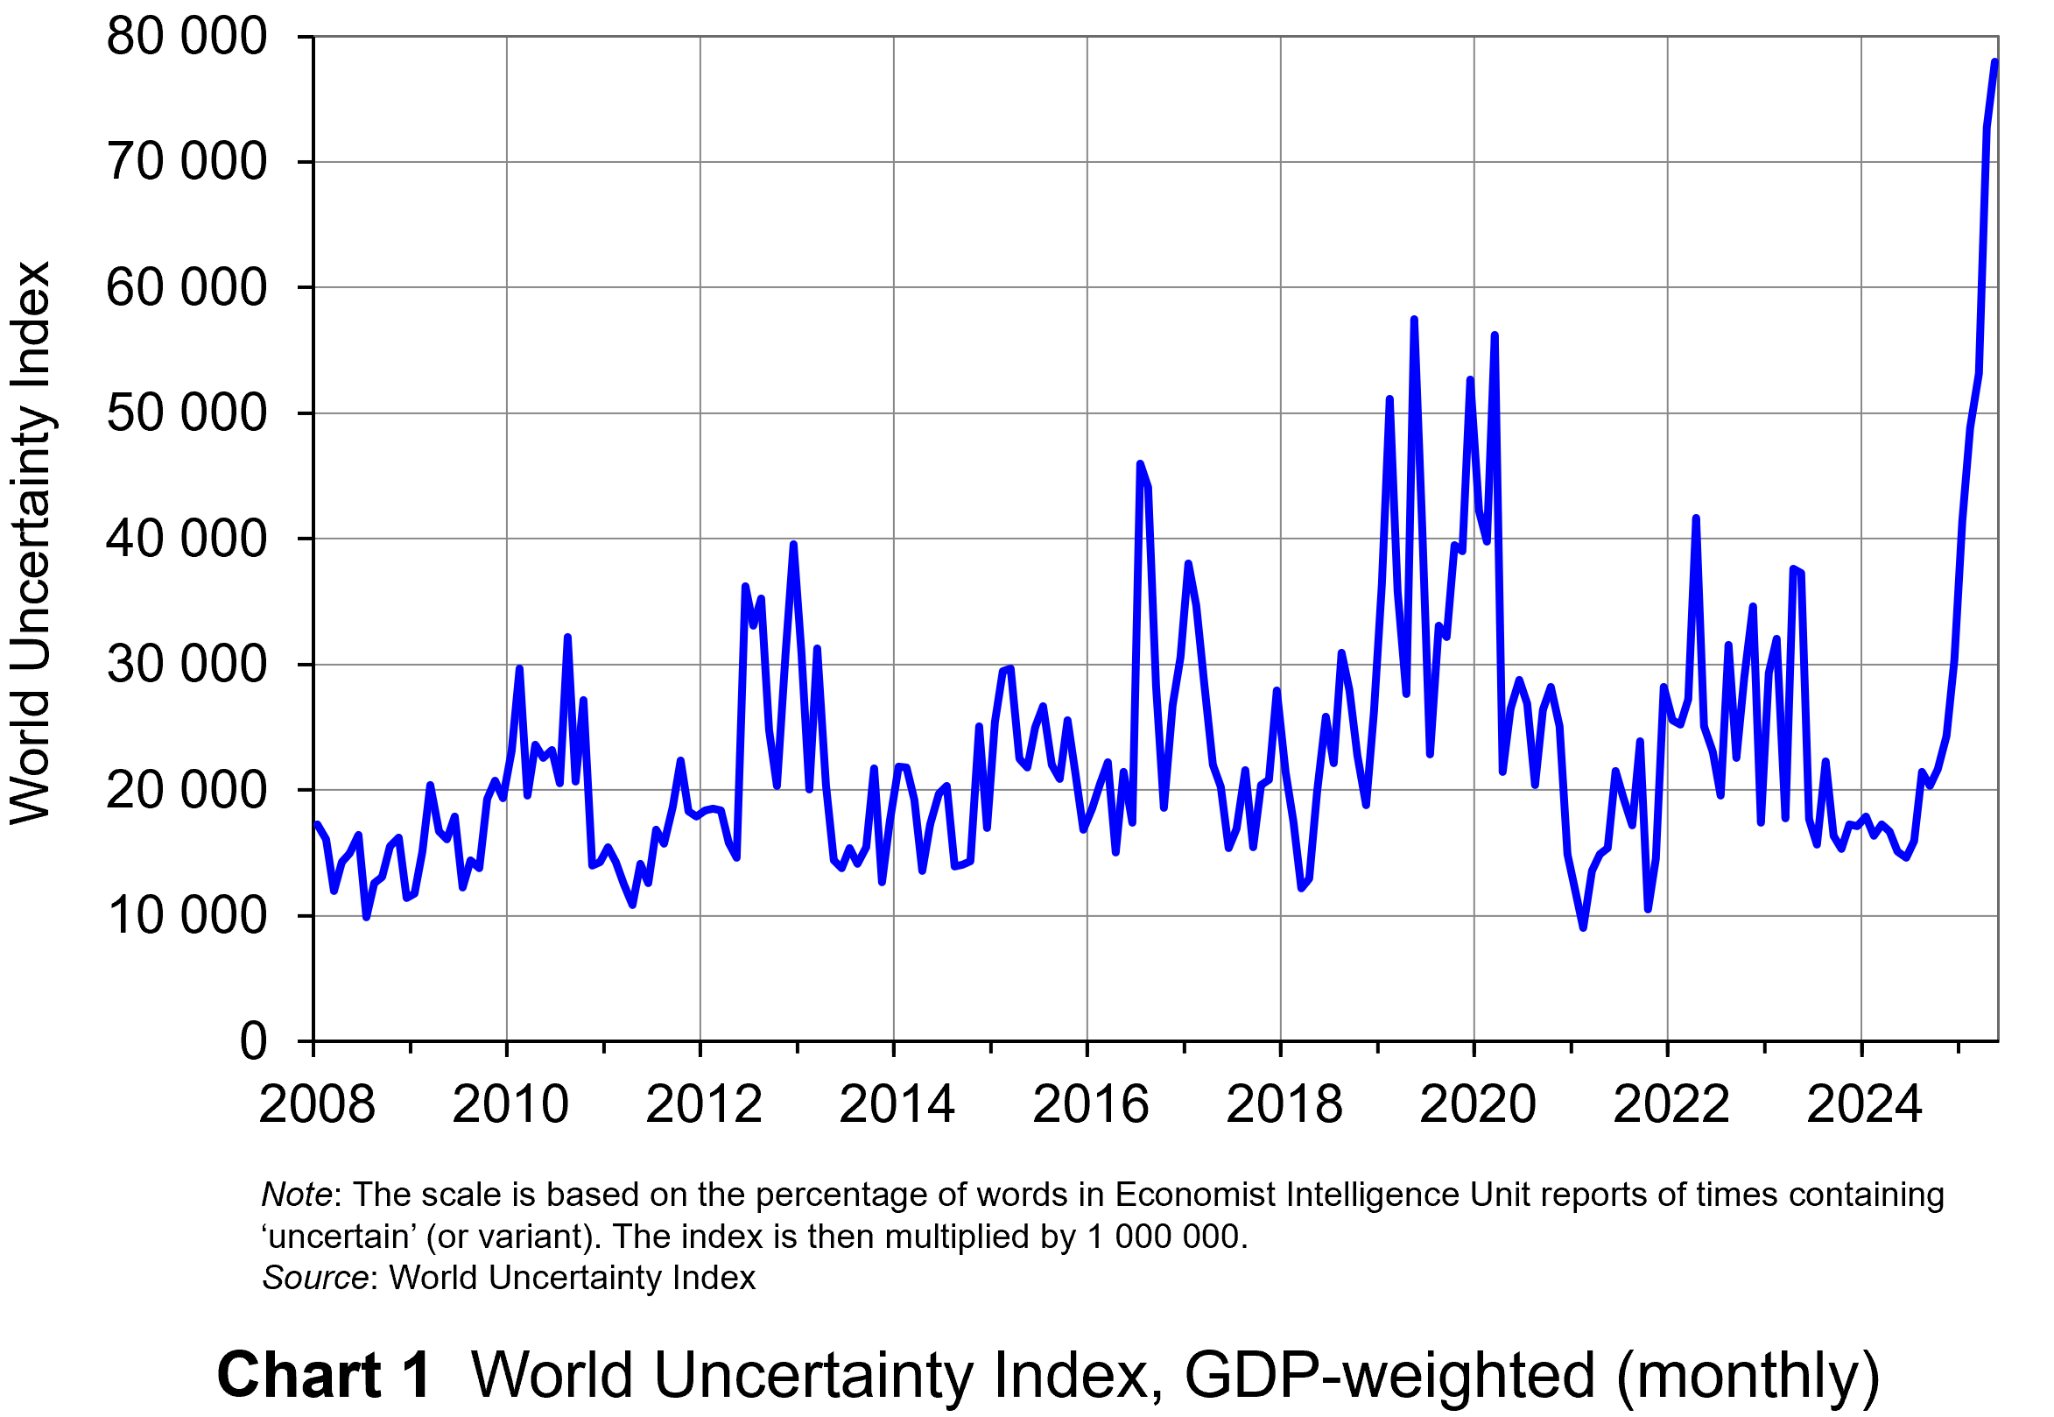 The World Uncertainty Index (WUI) tracks uncertainty around the world by applying a form of text mining known as ‘term frequency’ to the country reports produced by the Economist Intelligence Unit (EIU). The words searched for are ‘uncertain’, ‘uncertainty’ and ‘uncertainties’ and the number of times they occur as percentage of the total words is recorded. To produce the WUI this figure is then multiplied by 1m. A higher WUI number indicates a greater level of uncertainty.
The monthly global average WUI is shown in Chart 1 (click here for a PowerPoint). It is based on 71 countries. Since 2008 the WUI has averaged a little over 23 000: i.e. 2.3 per cent of the text in EIU reports contains the word ‘uncertainty’ or a close variant. In May 2025, it was almost 79 000 – the highest since the index was first complied in 2008. The previous highest was in March 2020, at the start of the COVID-19 outbreak, when the index rose to just over 56 000.
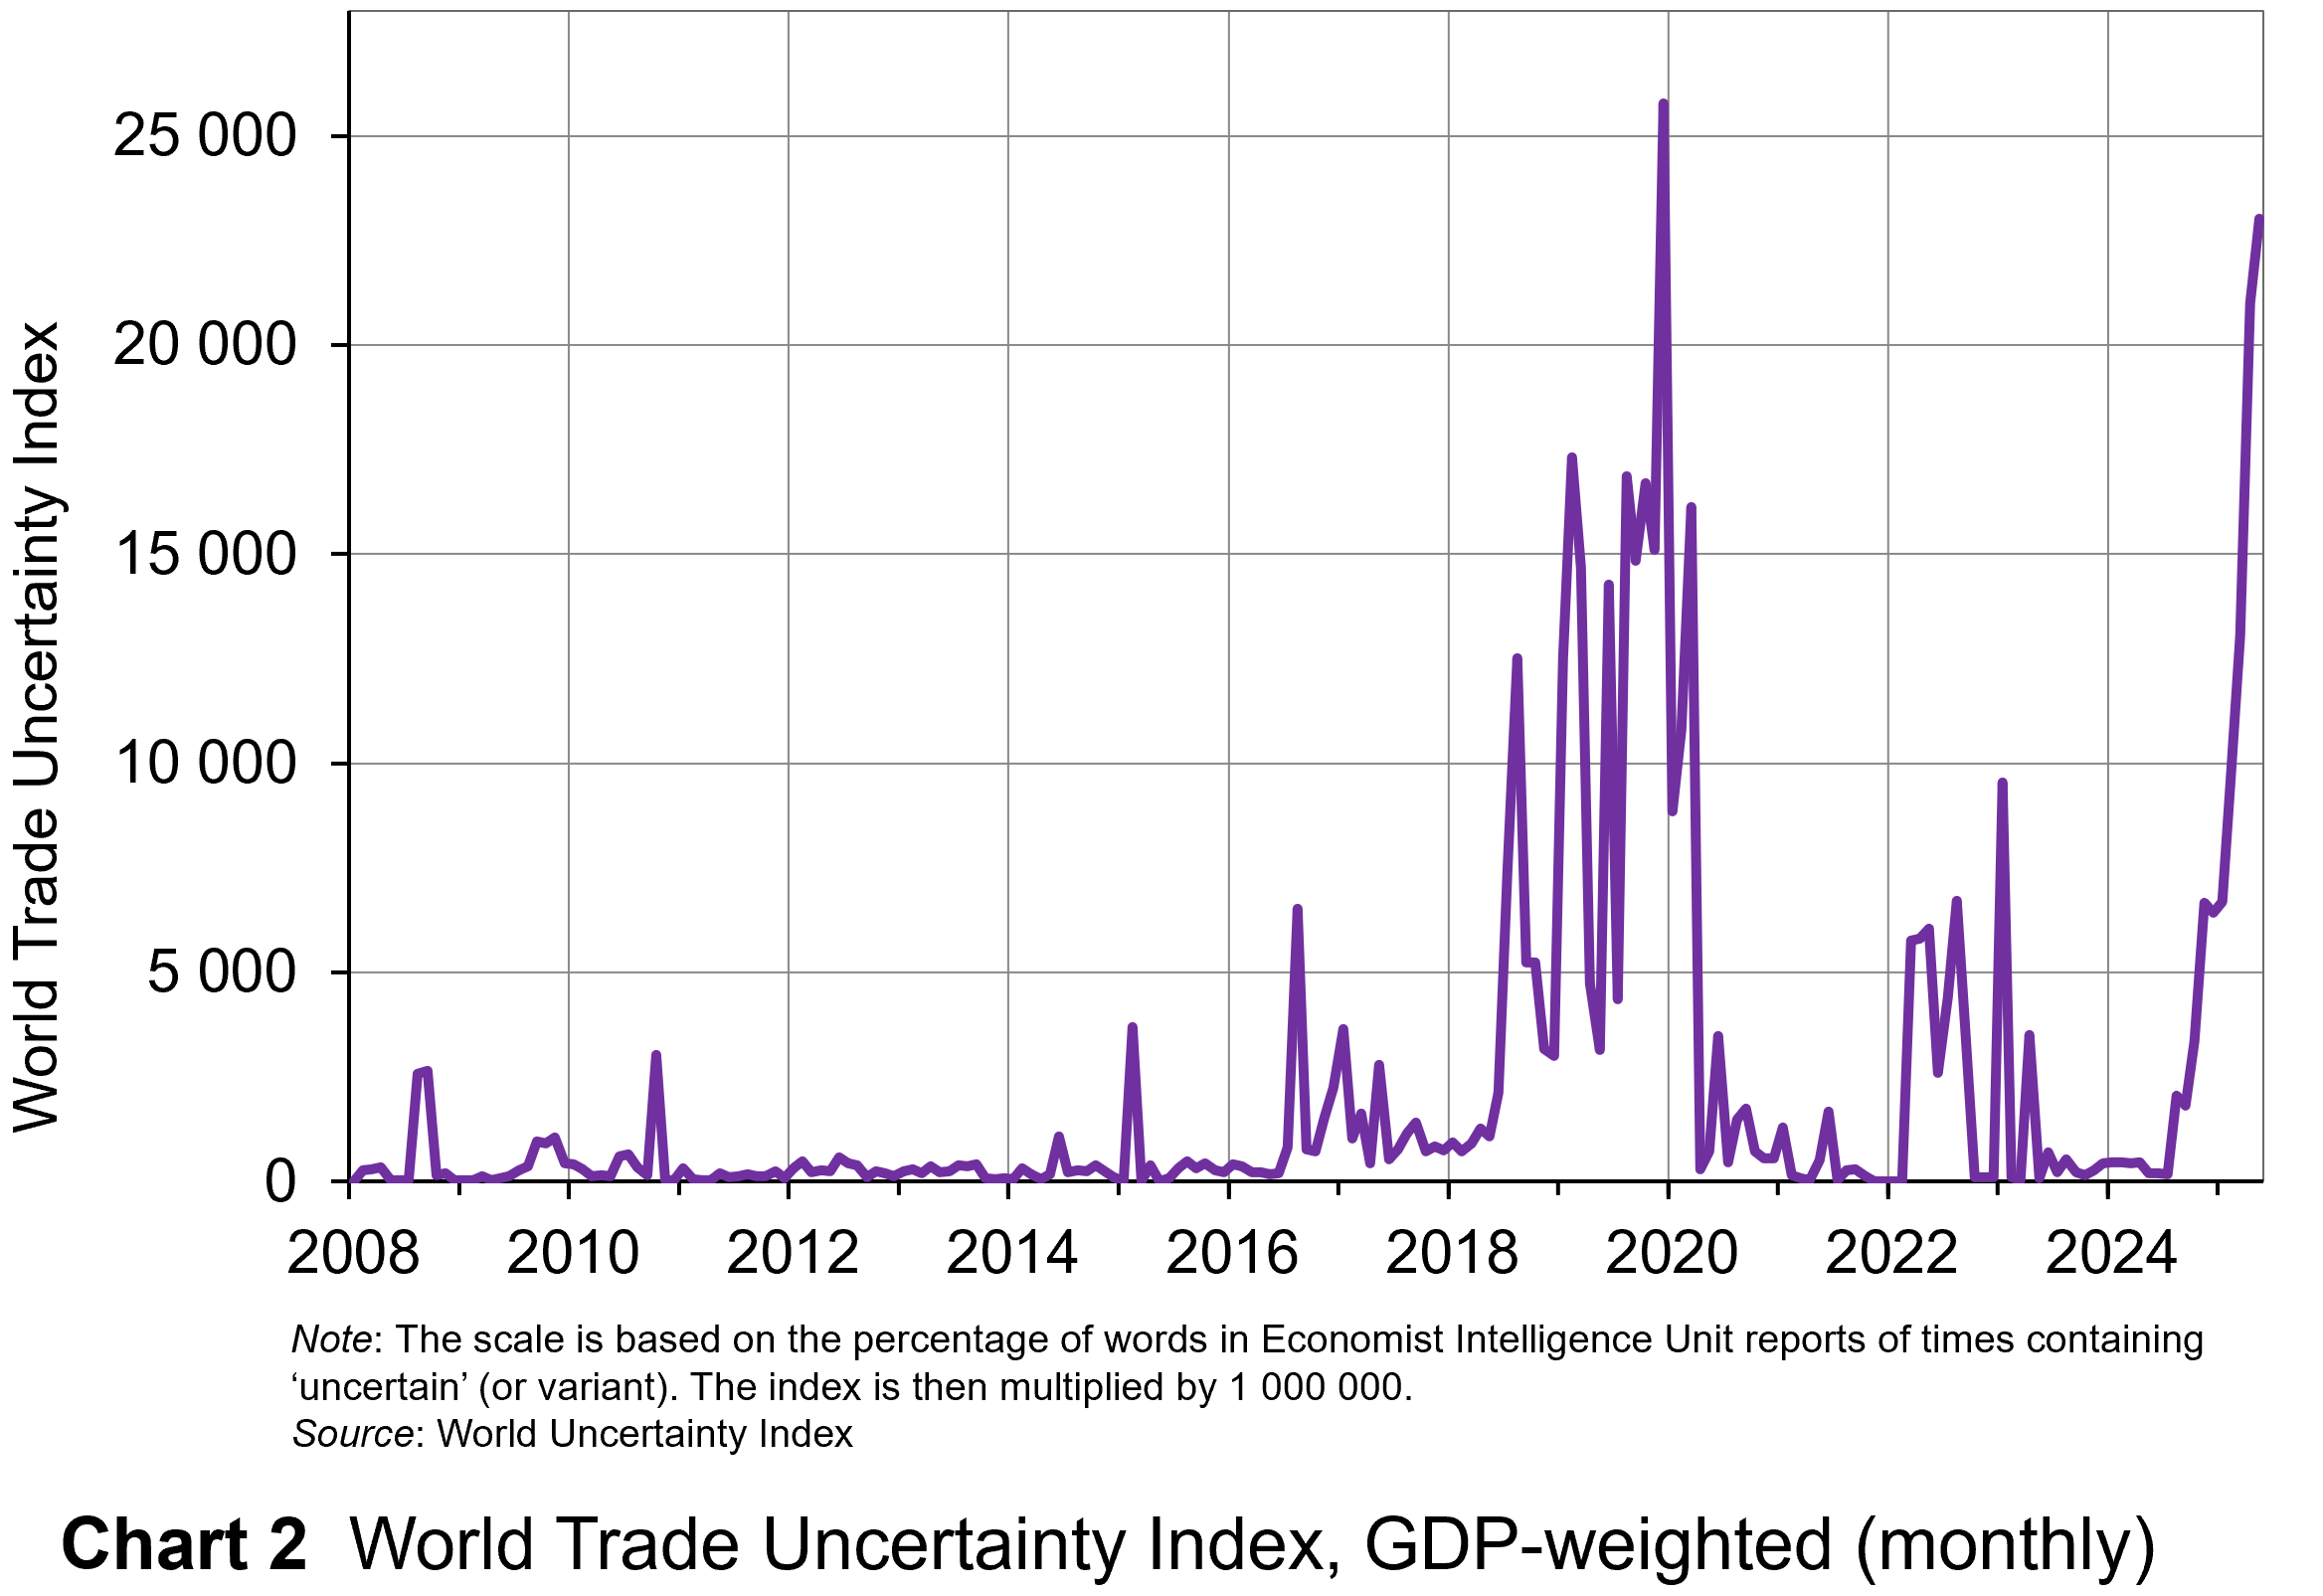 The second chart shows the World Trade Uncertainty Index (WTUI), published on the same site as the WUI (click here for a PowerPoint). The method adopted in its construction therefore mirrors that for the WUI but counts the number of times in EIU country reports ‘uncertainty’ is mentioned within proximity to a word related to trade, such as ‘protectionism’, ‘NAFTA’, ‘tariff’, ‘trade’, ‘UNCTAD’ or ‘WTO.’
The chart shows that in May 2025, the WTUI had risen to just over 23 000 – the second highest since December 2019, when President Trump imposed a new round of tariffs on Chinese imports and announced that he would restore steel tariffs on Brazil and Argentina. Since 2008, the WTUI has averaged just 2228.
It remains to be seen whether more stability in trade relations and geopolitics will allow WUI and WUTI to decline once more, or whether greater instability will simply lead to greater uncertainty, with damaging consequences for investment and also for consumption and employment.
Articles
- IMF World Economic Outlook: economic uncertainty is now higher than it ever was during COVID
The Conversation, Sergi Basco (23/4/25)
- Economic uncertainty hits new high
McKinsey, Sven Smit et al. (29/5/25)
- Trade tensions and rising uncertainty drag global economy towards recession
UNCTAD News (25/4/25)
- IMF Warns Global Economic Uncertainty Surpasses Pandemic Levels
The Global Treasurer (24/4/25)
- Britons ‘hoarding cash amid economic uncertainty and fear of outages’
The Guardian, Phillip Inman (10/6/25)
- America’s Brexit Phase
Foreign Affairs, Jonathan Haskel and Matthew J. Slaughter (10/6/25)
- Goldman Sachs’ CEO on the ‘Big, Beautiful Bill,’ Trump’s Tariffs and Economic Volatility
Politico, Sam Sutton (13/6/25)
- The Countries Where Economic Uncertainty Is Rising Fastest
24/7 Wall St., Evan Comen (9/6/25)
- Trump’s tariffs have finally kicked in, so what happens next?
The Conversation, Maha Rafi Atal (8/8/25)
Uncertainty Indices
Questions
- Explain what is meant by ‘text mining’. What are its strengths and weaknesses in assessing business, consumer and trade uncertainty?
- Explain how the UK Monthly EPU Index is derived.
- Why has uncertainty increased so dramatically since the start of 2025?
- Compare indices based on text mining with confidence indices.
- Plot consumer and business/industry confidence indicators for the past 24 months, using EC data. Do they correspond with the WUI?
- How may uncertainty affect consumers’ decisions?
 Economic growth is closely linked to investment. In the short term, there is a demand-side effect: higher investment, by increasing aggregate demand, creates a multiplier effect. GDP rises and unemployment falls. Over the longer term, higher net investment causes a supply-side effect: industrial capacity and potential output rise. This will be from both the greater quantity of capital and, if new investment incorporates superior technology, from a greater productivity of capital.
One of the biggest determinants of investment is certainty about the future: certainty allows businesses to plan investment. Uncertainty, by contrast, is likely to dampen investment. Investment is for future output and if the future is unknown, why undertake costly investment? After all, the cost of investment is generally recouped over several months or year, not immediately. Uncertainty thus increases the risks of investment.
 There is currently great uncertainty in the USA and its trading partners. The frequent changes in policy by President Trump are causing a fall in confidence and consequently a fall in investment. The past few weeks have seen large cuts in US government expenditure as his administration seeks to dismantle the current structure of government. The businesses supplying federal agencies thus face great uncertainty about future contracts. Laid-off workers will be forced to cut their spending, which will have knock-on effect on business, who will cut employment and investment as the multiplier and accelerator work through.
There are also worries that the economic chaos caused by President Trump’s frequent policy changes will cause inflation to rise. Higher inflation will prompt the Federal Reserve to raise interest rates. This, in turn, will increase the cost of borrowing for investment.
Tariff uncertainty
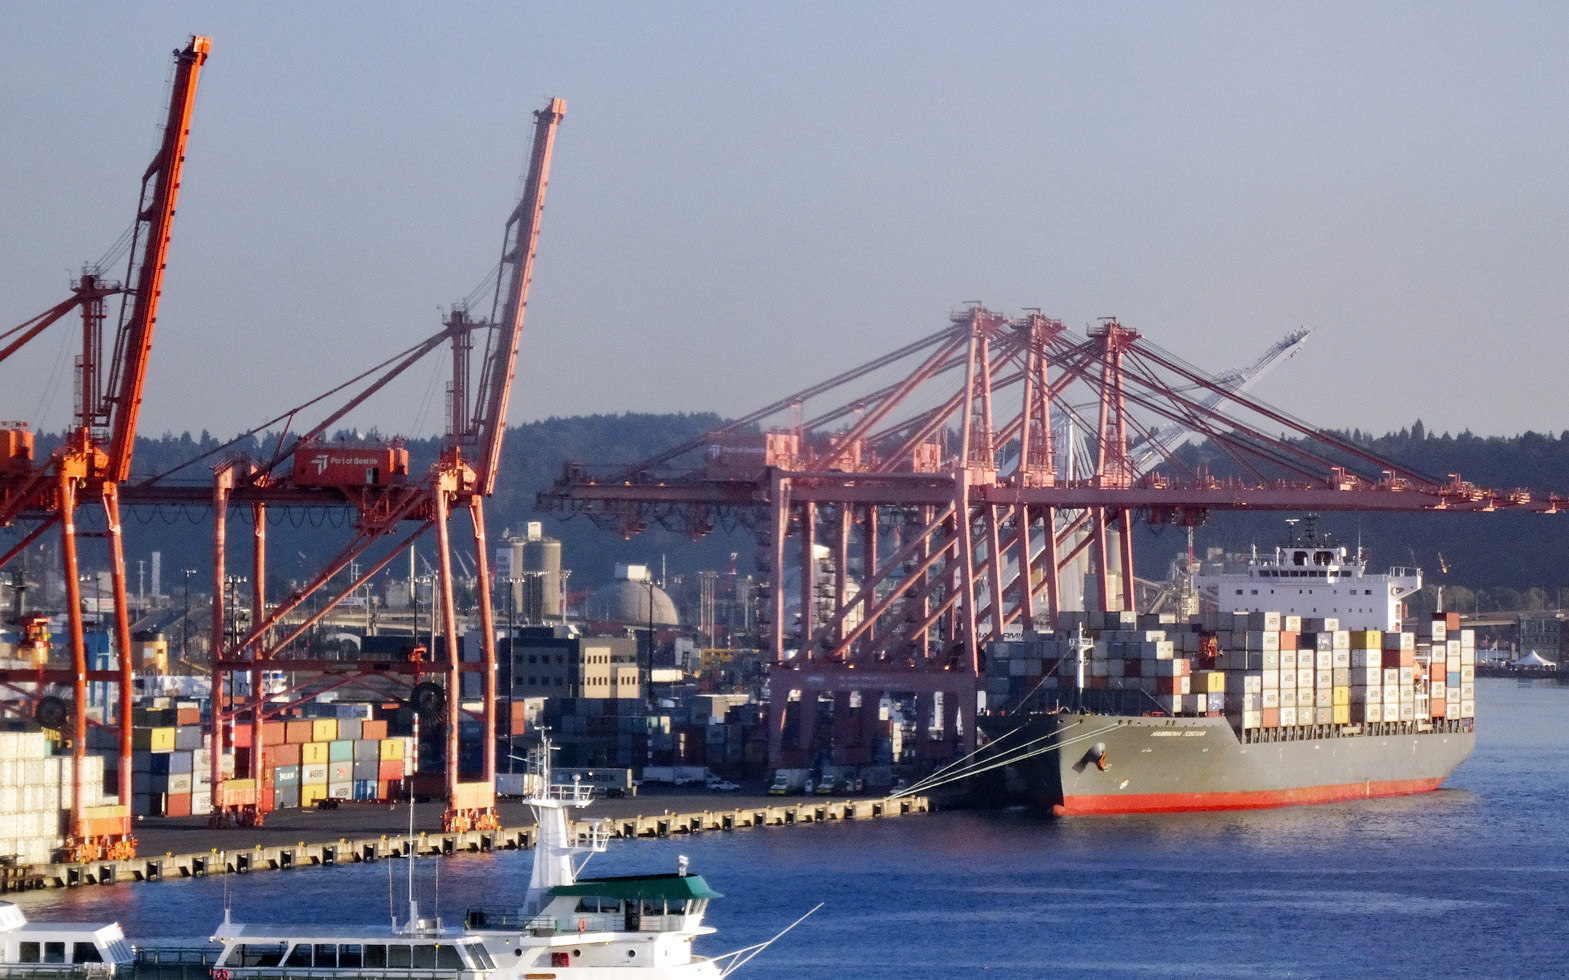 Perhaps the biggest uncertainty for business concerns the imposition of tariffs. Many US businesses rely on imports of raw materials, components, equipment, etc. Imposing tariffs on imports raises business costs. But this will vary from firm to firm, depending on the proportion of their inputs that are imported. And even when the inputs are from other US companies, those companies may rely on imports and thus be forced to raise prices to their customers. And if, in retaliation, other countries impose tariffs on US goods, this will affect US exporters and discourage them from investing.
For many multinational companies, whether based in the USA or elsewhere, supply chains involve many countries. New tariffs will force them to rethink which suppliers to use and where to locate production. The resulting uncertainty can cause them to delay or cancel investments.
Uncertainty has also been caused by the frequent changes in the planned level of tariffs. With the Trump administration using tariffs as a threat to get trading partners to change policy, the threatened tariff rates have varied depending on how trading partners have responded. There has also been uncertainty on just how the tariff policy will be implemented, making it more difficult for businesses to estimate the effect on them.
Then there are serious issues for the longer term. Other countries will be less willing to sign trade deals with the USA if they will not be honoured. Countries may increasingly look to diverting trade from the USA to other countries.
Video
Articles
- Trump’s erratic trade policies are baffling businesses, threatening investment and economic growth
Associated Press, Paul Wiseman, Anne D’innocenzio and Mae Anderson (6/3/25)
- The world is beginning to tire of Trump’s whiplash leadership
CNN, Stephen Collinson (6/3/25)
- US stocks slide and Nasdaq enters correction as chaos over Trump’s tariffs intensifies
CNN, John Towfighi (6/3/25)
- Trump’s Tariffs And Trade: Uncertainty, Chaos Or Brilliance?
Forbes, Mike Patton (6/3/25)
- How Trump’s second term might affect the market and your finances
The Conversation, Art Durnev (4/3/25)
- US corporate bond investors cautiously navigate trade war uncertainty
Reuters, Matt Tracy (6/3/25)
 This week in Trumponomics: Playing chicken with markets
Yahoo Finance, Rick Newman (8/3/25)
- Measuring fear: What the VIX reveals about market uncertainty
The FRED Blog, Aakash Kalyani (13/2/25)
- Trump shrugs off stock market slump, but economic warning signs loom
The Conversation, Conor O’Kane (17/3/25)
Data
Questions
- Find out what tariffs have been proposed, imposed and changed since Donald Trump came to office on 20 January 2025.
- In what scenario might US investment be stimulated by Donald Trump’s policies?
- What countries’ economies have gained or are set to gain from Donald Trump’s policies?
- What is the USMCA agreement? Do Donald Trump’s policies break this agreement?
- Find out and explain what has happened to the US stock market since January 2025. How do share prices affect business investment?
- Which sector’s shares have risen and which have fallen?
- Using the Data link above, find out what has been happening to the US Policy Uncertainty Index since Donald Trump was elected and explain particular spikes in the index. Is this mirrored in the global Policy Uncertainty Index?
- Are changes in the Policy Uncertainty Index mirrored in the World Uncertainty Index (WUI) and the CBOE Volatility Index: VIX?
We continue to live through incredibly turbulent times. In the past decade or so we have experienced a global financial crisis, a global health emergency, seen the UK’s departure from the European Union, and witnessed increasing levels of geopolitical tension and conflict. Add to this the effects from the climate emergency and it easy to see why the issue of economic uncertainty is so important when thinking about a country’s economic prospects.
In this blog we consider how we can capture this uncertainty through a World Uncertainty Index and the ways by which economic uncertainty impacts on the macroeconomic environment.
World Uncertainty Index
Hites Ahir, Nicholas Bloom and Davide Furceri have constructed a measure of uncertainty known as the World Uncertainty Index (WUI). This tracks uncertainty around the world using the process of ‘text mining’ the country reports produced by the Economist Intelligence Unit. The words searched for are ‘uncertain’, ‘uncertainty’ and ‘uncertainties’ and a tally is recorded based on the number of times they occur per 1000 words of text. To produce the index this figure is then multiplied up by 100 000. A higher number therefore indicates a greater level of uncertainty. For more information on the construction of the index see the 2022 article by Ahir, Bloom and Furceri linked below.
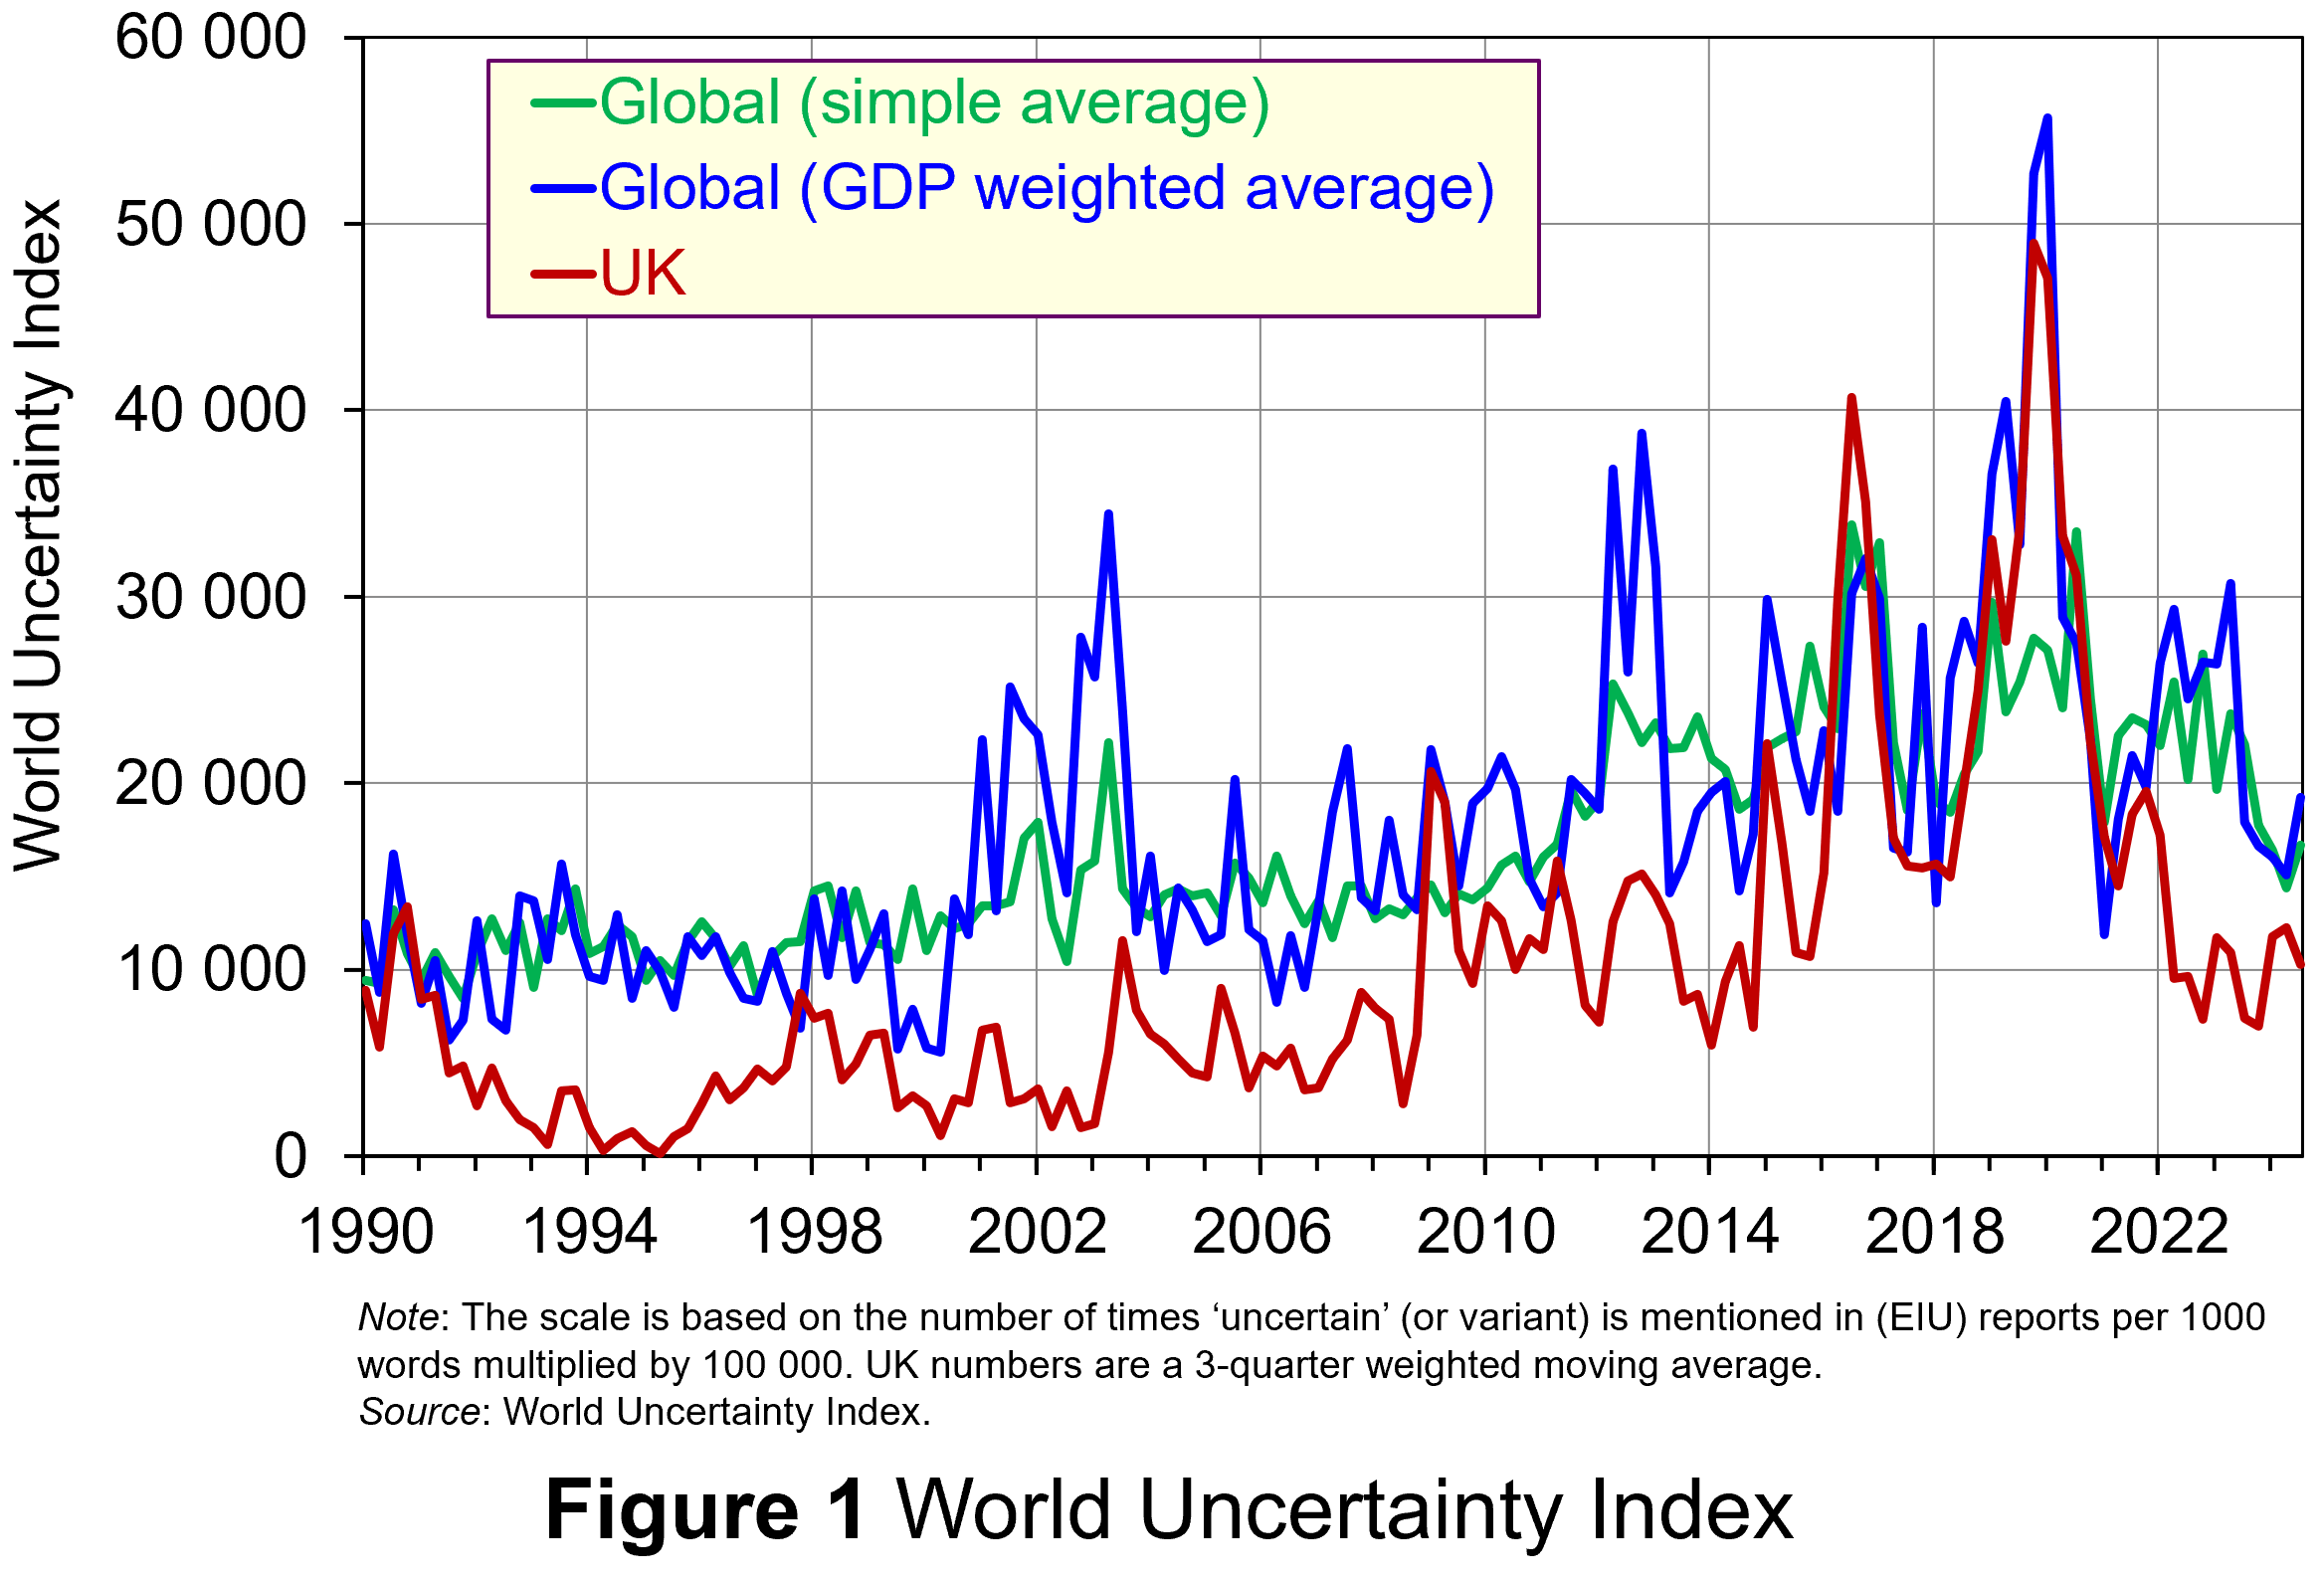 Figure 1 (click here for a PowerPoint) shows the WUI both globally and in the UK quarterly since 1991. The global index covers 143 countries and is presented as both a simple average and a GDP weighted average. The UK WUI is also shown. This is a three-quarter weighted average, the authors’ preferred measure for individual countries, where increasing weights of 0.1, 0.3 and 0.6 are used for the three most recent quarters.
From Figure 1 we can see how the level of uncertainty has been particularly volatile over the past decade or more. Events such as the sovereign debt crisis in parts of Europe in the early 2010s, the Brexit referendum in 2016, the COVID-pandemic in 2020–21 and the invasion of Ukraine in 2022 all played their part in affecting uncertainty domestically and internationally.
Uncertainty, risk-aversion and aggregate demand
Now the question turns to how uncertainty affects economies. One way of addressing this is to think about ways in which uncertainty affects the choices that people and businesses make. In doing so, we could think about the impact of uncertainty on components of aggregate demand, such as household consumption and investment, or capital expenditures by firms.
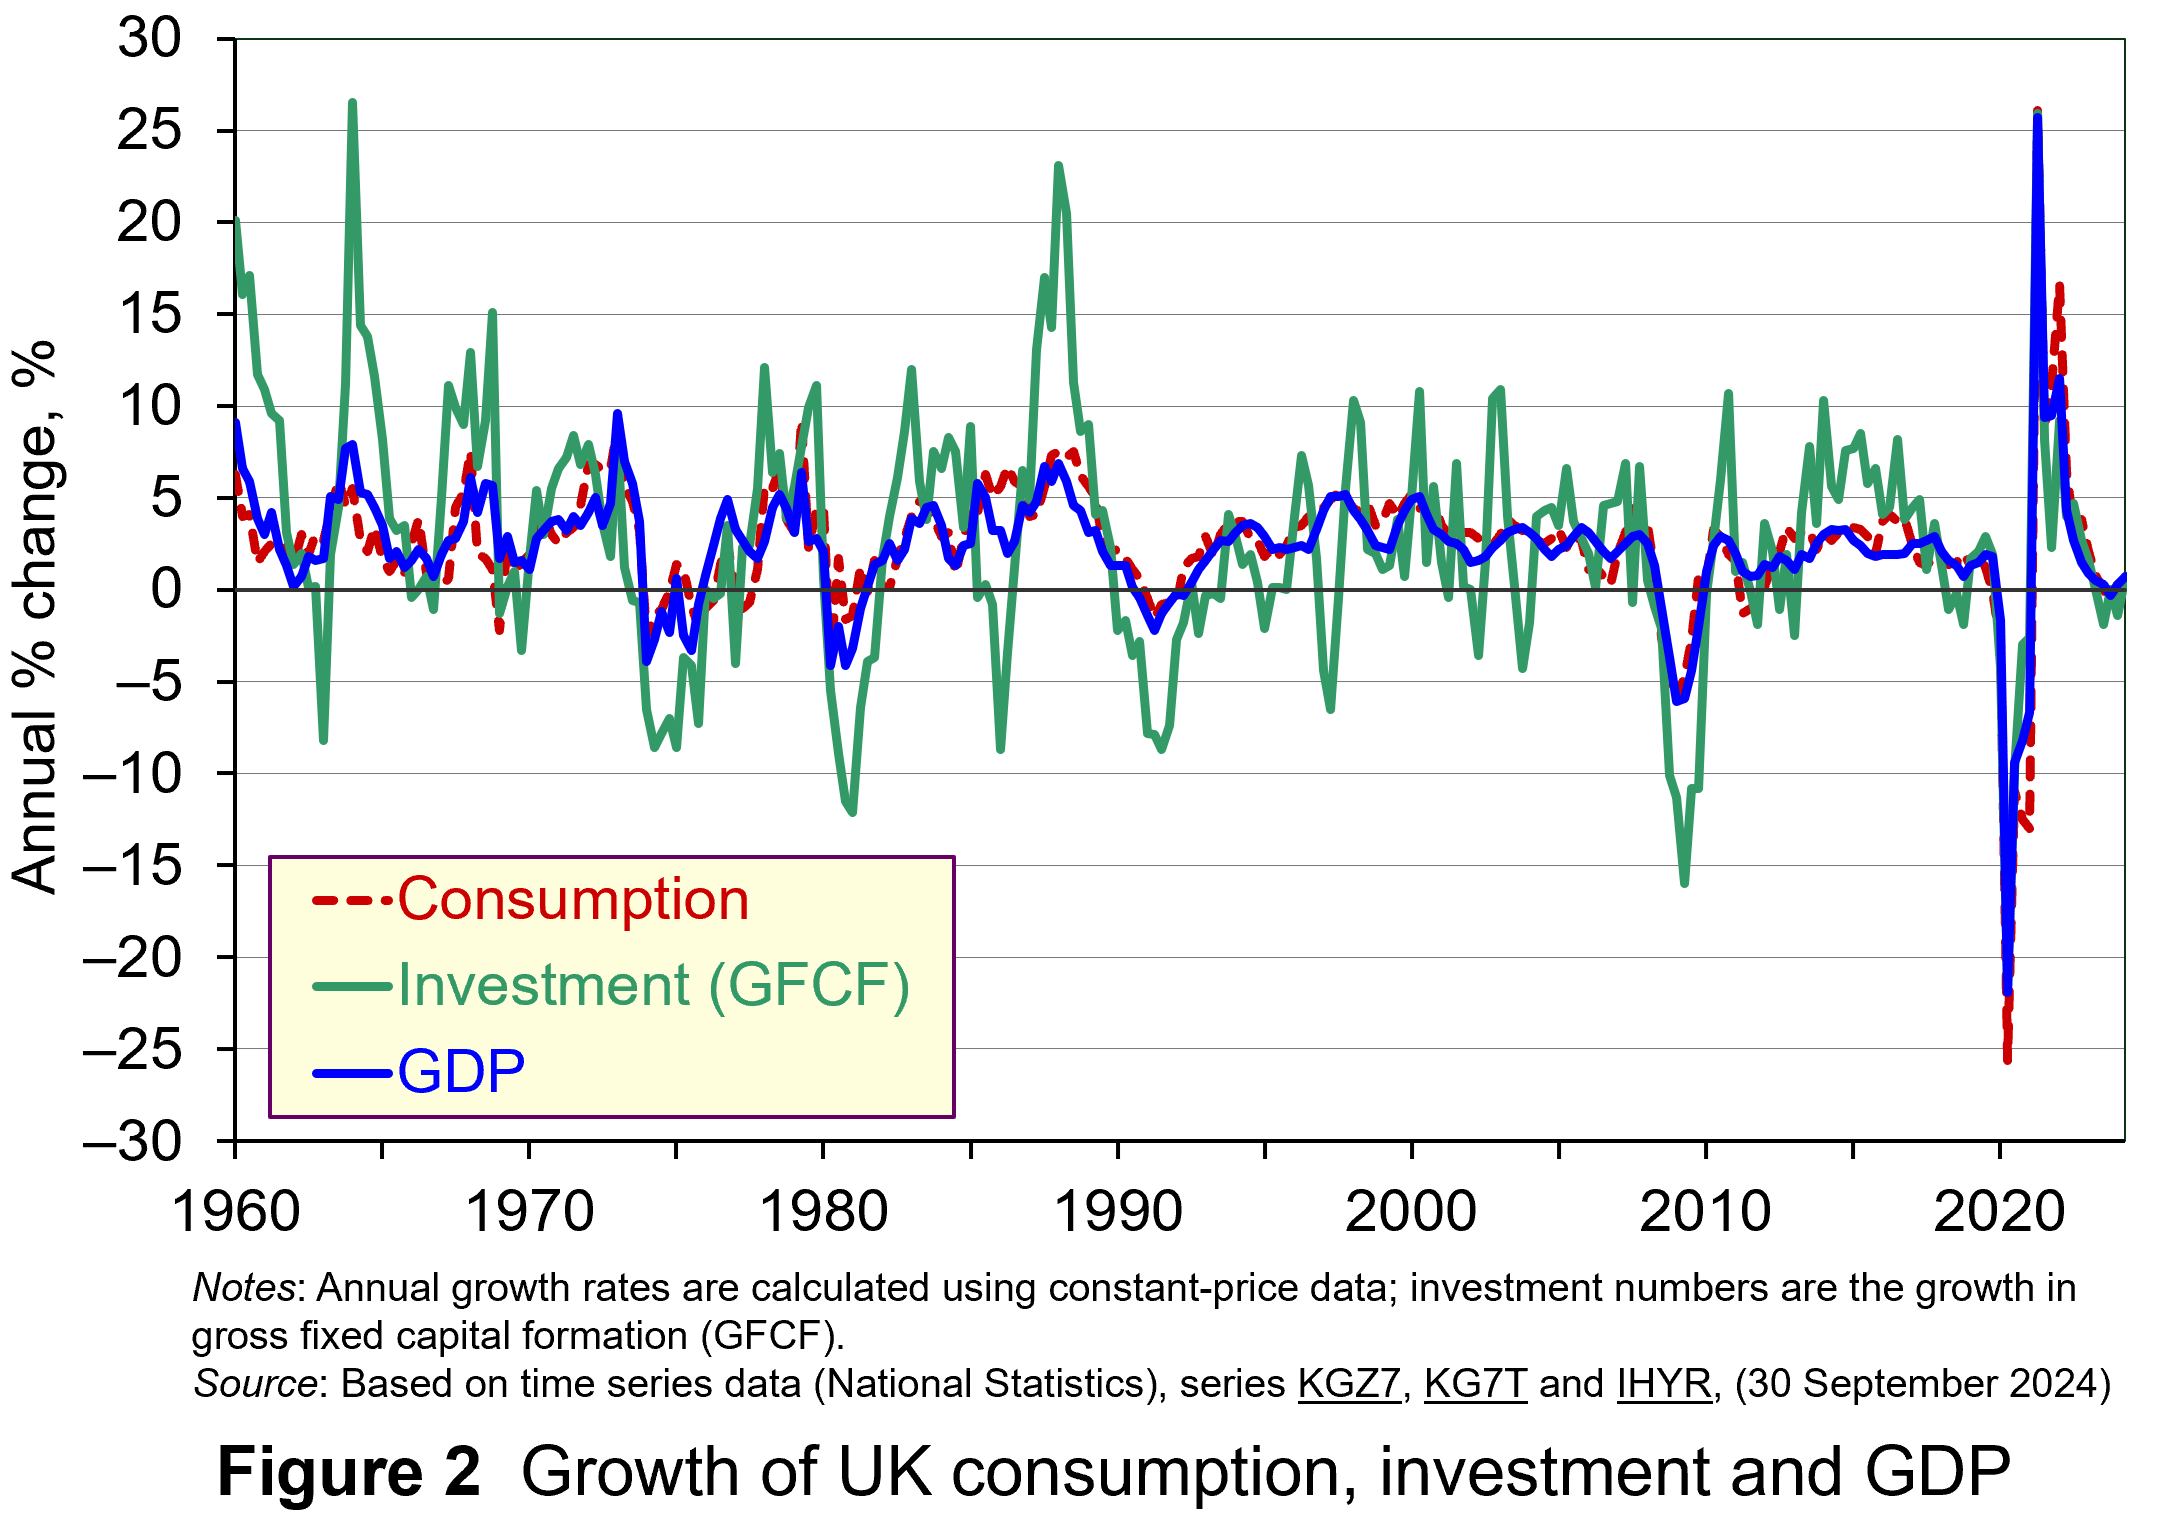 As Figure 2 shows (click here for a PowerPoint), investment is particularly volatile, and much more so than household spending. Some of this can be attributed to the ‘lumpiness’ of investment decisions since these expenditures tend to be characterised by indivisibility and irreversibility. This means that they are often relatively costly to finance and are ‘all or nothing’ decisions. In the context of uncertainty, it can make sense therefore for firms to wait for news that makes the future clearer. In this sense, we can think of uncertainty rather like a fog that firms are peering through. The thicker the fog, the more uncertain the future and the more cautious firms are likely to be.
The greater caution that many firms are likely to adopt in more uncertain times is consistent with the property of risk-aversion that we often attribute to a range of economic agents. When applied to household spending decisions, risk-aversion is often used to explain why households are willing to hold a buffer stock of savings to self-insure against unforeseen events and their future financial outcomes being worse than expected. Hence, in more uncertain times households are likely to want to increase this buffer further.
 The theory of buffer-stock saving was popularised by Christopher Carroll in 1992 (see link below). It implies that in the presence of uncertainty, people are prepared to consume less today in order to increase levels of saving, pay off existing debts, or borrow less relative to that in the absence of uncertainty. The extent of the buffer of financial wealth that people want to hold will depend on their own appetite for risk, the level of uncertainty, and the moderating effect from their own impatience and, hence, present bias for consuming today.
Risk aversion is consistent with the property of diminishing marginal utility of income or consumption. In other words, as people’s total spending volumes increase, their levels of utility or satisfaction increase but at an increasingly slower rate. It is this which explains why individuals are willing to engage with the financial system to reallocate their expected life-time earnings and have a smoother consumption profile than would otherwise be the case from their fluctuating incomes.
Yet diminishing marginal utility not only explains consumption smoothing, but also why people are willing to engage with the financial system to have financial buffers as self-insurance. It explains why people save more or borrow less today than suggested by our base-line consumption smoothing model. It is the result of people’s greater dislike (and loss of utility) from their financial affairs being worse than expected than their like (and additional utility) from them being better than expected. This tendency is only likely to increase the more uncertain times are. The result is that uncertainty tends to lower household consumption with perhaps ‘big-ticket items’, such as cars, furniture, and expensive electronic goods, being particularly sensitive to uncertainty.
Uncertainty and confidence
Uncertainty does not just affect risk; it also affects confidence. Risk and confidence are often considered together, not least because their effects in generating and transmitting shocks can be difficult to disentangle.
We can think of confidence as capturing our mood or sentiment, particularly with respect to future economic developments. Figure 3 plots the Uncertainty Index for the UK alongside the OECD’s composite consumer and business confidence indicators. Values above 100 for the confidence indicators indicate greater confidence about the future economic situation and near-term business environment, while values below 100 indicate pessimism towards the future economic and business environments.
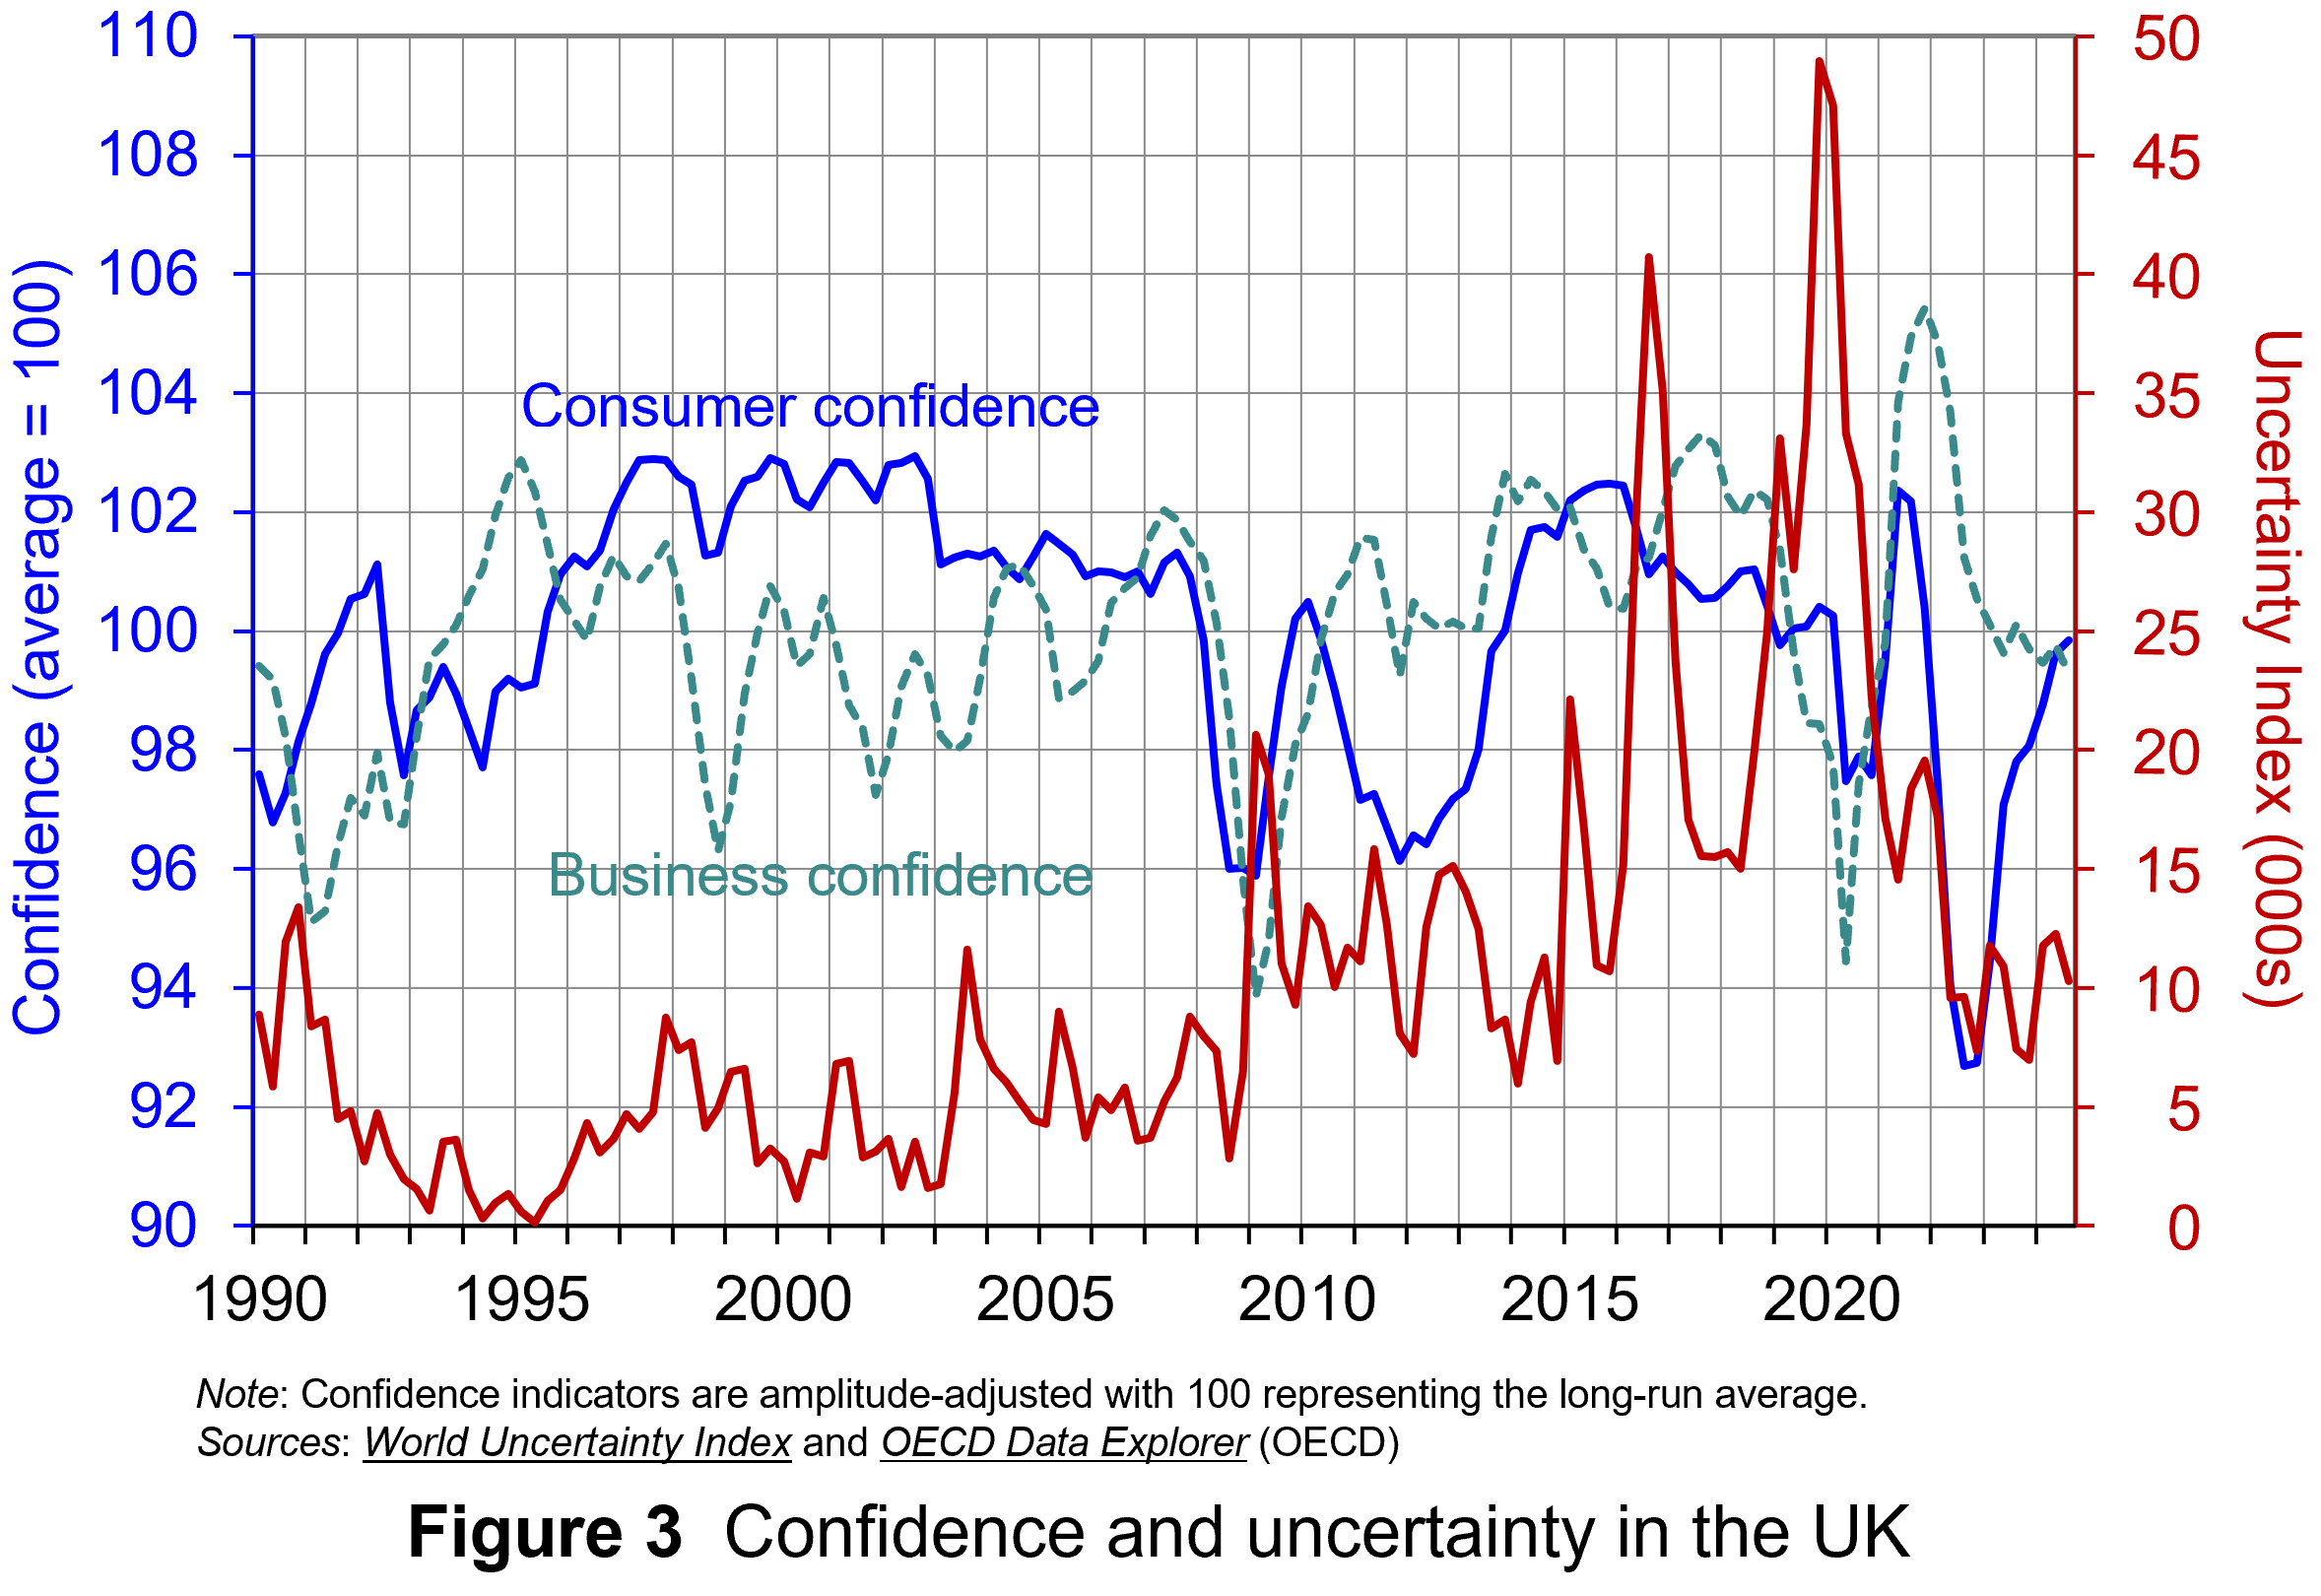 Figure 3 suggests that the relationship between confidence and uncertainty is rather more complex than perhaps is generally understood (click here for a PowerPoint). Haddow, Hare, Hooley and Shakir (see link below) argue that the evidence tends to point to changes in uncertainty affecting confidence, but with less evidence that changes in confidence affect uncertainty.
To illustrate this, consider the global financial crisis of the late 2000s. The argument can be made that the heightened uncertainty about future prospects for households and businesses helped to erode their confidence in the future. The result was that people and businesses revised down their expectations of the future (pessimism). However, although people were more pessimistic about the future, this was more likely to have been the result of uncertainty rather than the cause of further uncertainty.
Conclusion
For economists and policymakers alike, indicators of uncertainty, such as the Ahir, Bloom and Furceri World Uncertainty Index, are invaluable tools in understanding and forecasting behaviour and the likely economic outcomes that follow. Some uncertainty is inevitable, but the persistence of greater uncertainty since the global financial crisis of the late 2000s compares quite starkly with the relatively lower and more stable levels of uncertainty seen from the mid-1990s up to the crisis. Hence the recent frequency and size of changes in uncertainty show how important it to understand how uncertainty effects transmit through economies.
Academic papers
- The World Uncertainty Index
National Bureau of Economic Research, Working Paper 29763, Hites Ahir, Nicholas Bloom and Davide Furceri (February 2022)
- The Buffer-Stock Theory of Saving: Some Macroeconomic Evidence
Brookings Papers on Economic Activity, Christopher D Carroll (Vol 2, 1992)
- Macroeconomic uncertainty: what is it, how can we measure it and why does it matter?
Bank of England Quarterly Bulletin, 2013 Q2, Abigail Haddow, Chris Hare, John Hooley and Tamarah Shakir (13/6/13)
Articles
Data
Questions
- (a) Explain what is meant by the concept of diminishing marginal utility of consumption.
(b) Explain how this concept helps us to understand both consumption smoothing and the motivation to engage in buffer-stock saving.
- Explain the distinction between confidence and uncertainty when analysing macroeconomic shocks.
- Discuss which types of expenditures you think are likely to be most susceptible to uncertainty shocks.
- Discuss how economic uncertainty might affect productivity and the growth of potential output.
- How might the interconnectedness of economies affect the transmission of uncertainty effects through economies?
 In the third of our series on the distinction between nominal and real values we show its importance when analysing retail sales data. In the UK, such data are available from the Office for National Statistics. This blog revisits an earlier one, Nominal and real retail sales figures: interpreting the data, written in October 2023. We find that inflation-adjusted retail sales data reveal some stark patterns in the sector. They help contextualise some of the challenges faced by high streets up and down the UK.
The Retail Sales Index
Retail sales relate to spending on items such as food, clothing, footwear and household goods. They involve sales by retailers directly to final consumers, whether in store or online. Spending on services such as holidays, air fares and train tickets, insurance, banking, hotels and restaurants are not included, as are sales of motor vehicles. The Retail Sales Index for Great Britain is based on a monthly survey of around 5000 retailers across England, Scotland and Wales and is thought to capture around three-quarters of turnover in the retail industry.
Estimates of retail sales are published in index form. There are two indices published by the ONS: a value and volume measure. The value index reflects the total turnover of business, while the volume index adjusts the value index for price changes. Hence, the value estimates are nominal, while the volume estimates are real. The key point here is that the nominal estimates reflect both price and volume changes, whereas the real estimates adjust for price movements to capture only volume changes.
The headline ONS figures for May 2024 showed a rise by 2.9 per cent in the volume of retail sales, following a 1.8 per cent fall in April. In value terms, May saw a 3.3 per cent rise in retail sales following a 2.3 fall in March. Monthly changes can be quite volatile, even after seasonal adjustment, and sensitive to peculiar factors. For example, the poor weather in April 2024 helped to depress retail spending. It is, therefore, sensible to take a longer-term view when looking for clearer patterns in spending behaviour.
Growth of retail sales
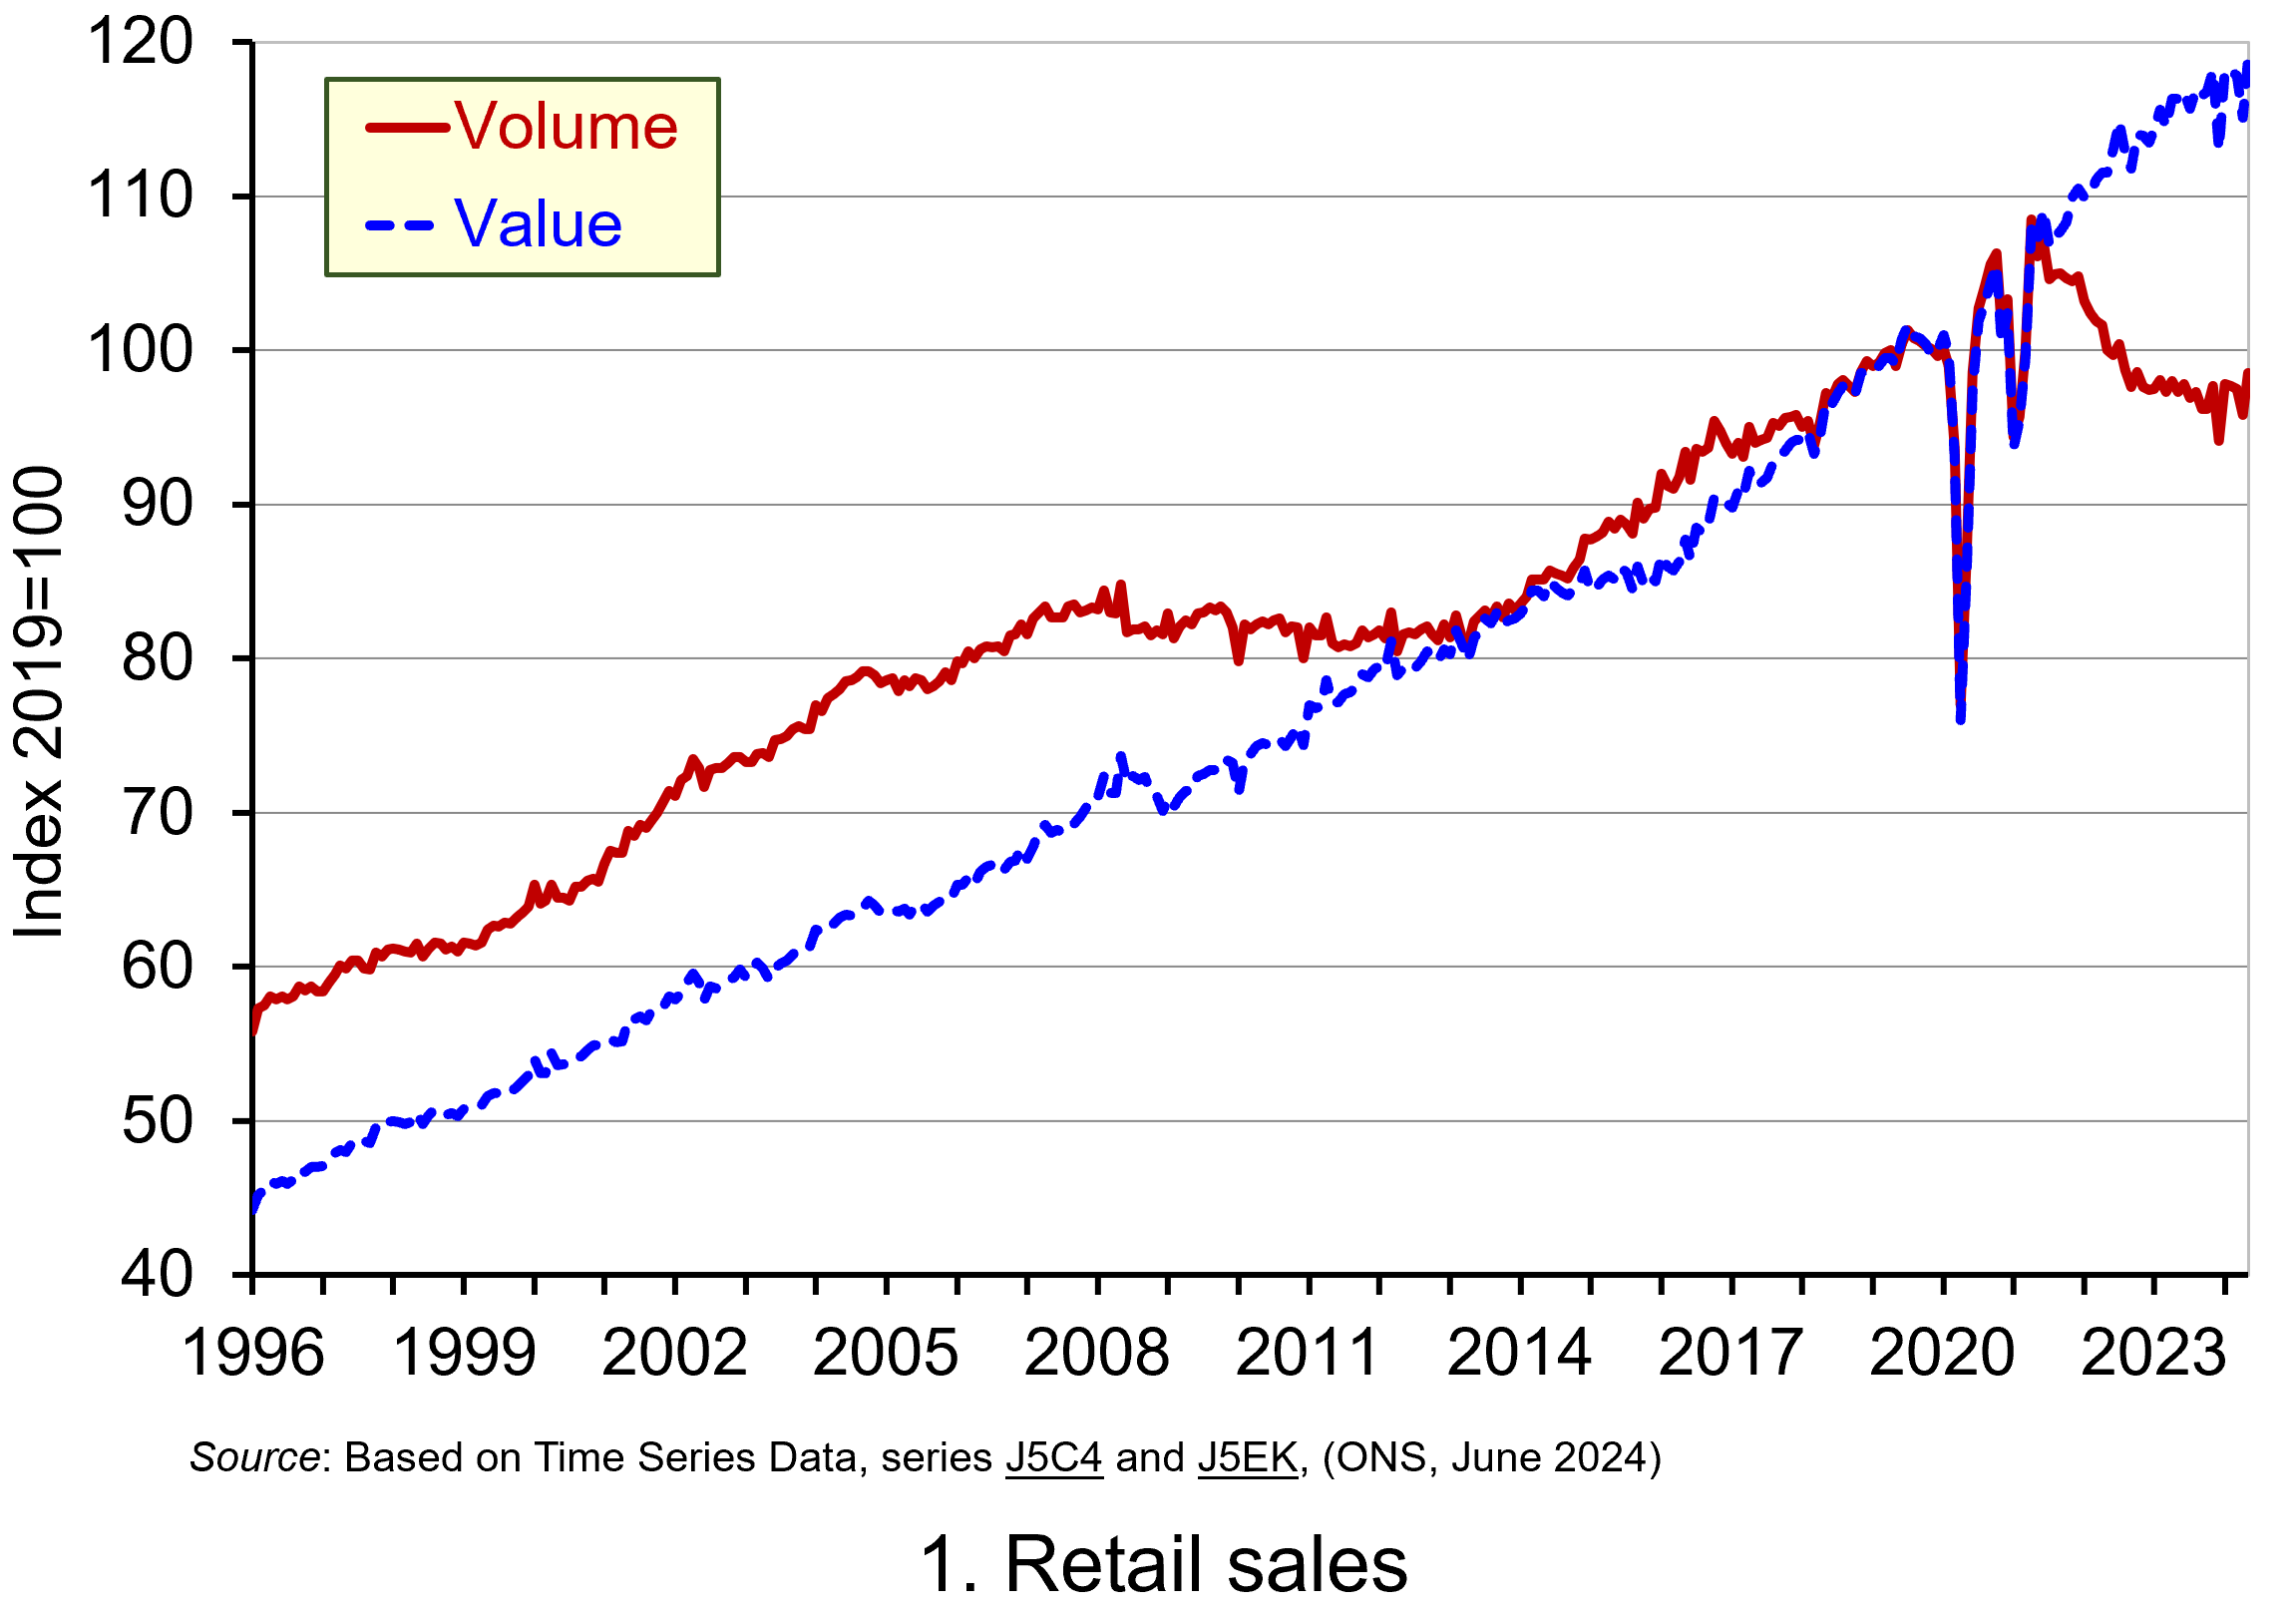 Chart 1 plots the monthly value and volume of retail sales in Great Britain since 1996. (Click here to download a PowerPoint of the chart). In value terms, monthly spending in the retail sector has increased by 169 per cent since January 1996, whereas in volume terms, spending has increased by 77 per cent. Another way of thinking about this is in terms of the average annual rate of increase. This shows that the value of spending has risen at an annual rate of 3.5 per cent while the volume of spending has risen at an annual rate of 2.0 per cent. This difference is to be expected in the presence of rising prices, since nominal growth, as we have just noted, reflects both price and volume changes.
Chart 1 helps to identify two periods where the volume of retail spending ceased to grow. The first of these is following the global financial crisis of the late 2000s. The period from 2008 to 2013 saw the volume of retail sales stagnate and flatline, with a recovery in volumes only really starting to take hold in 2014. Yet in nominal terms retail sales grew by around 14 per cent.
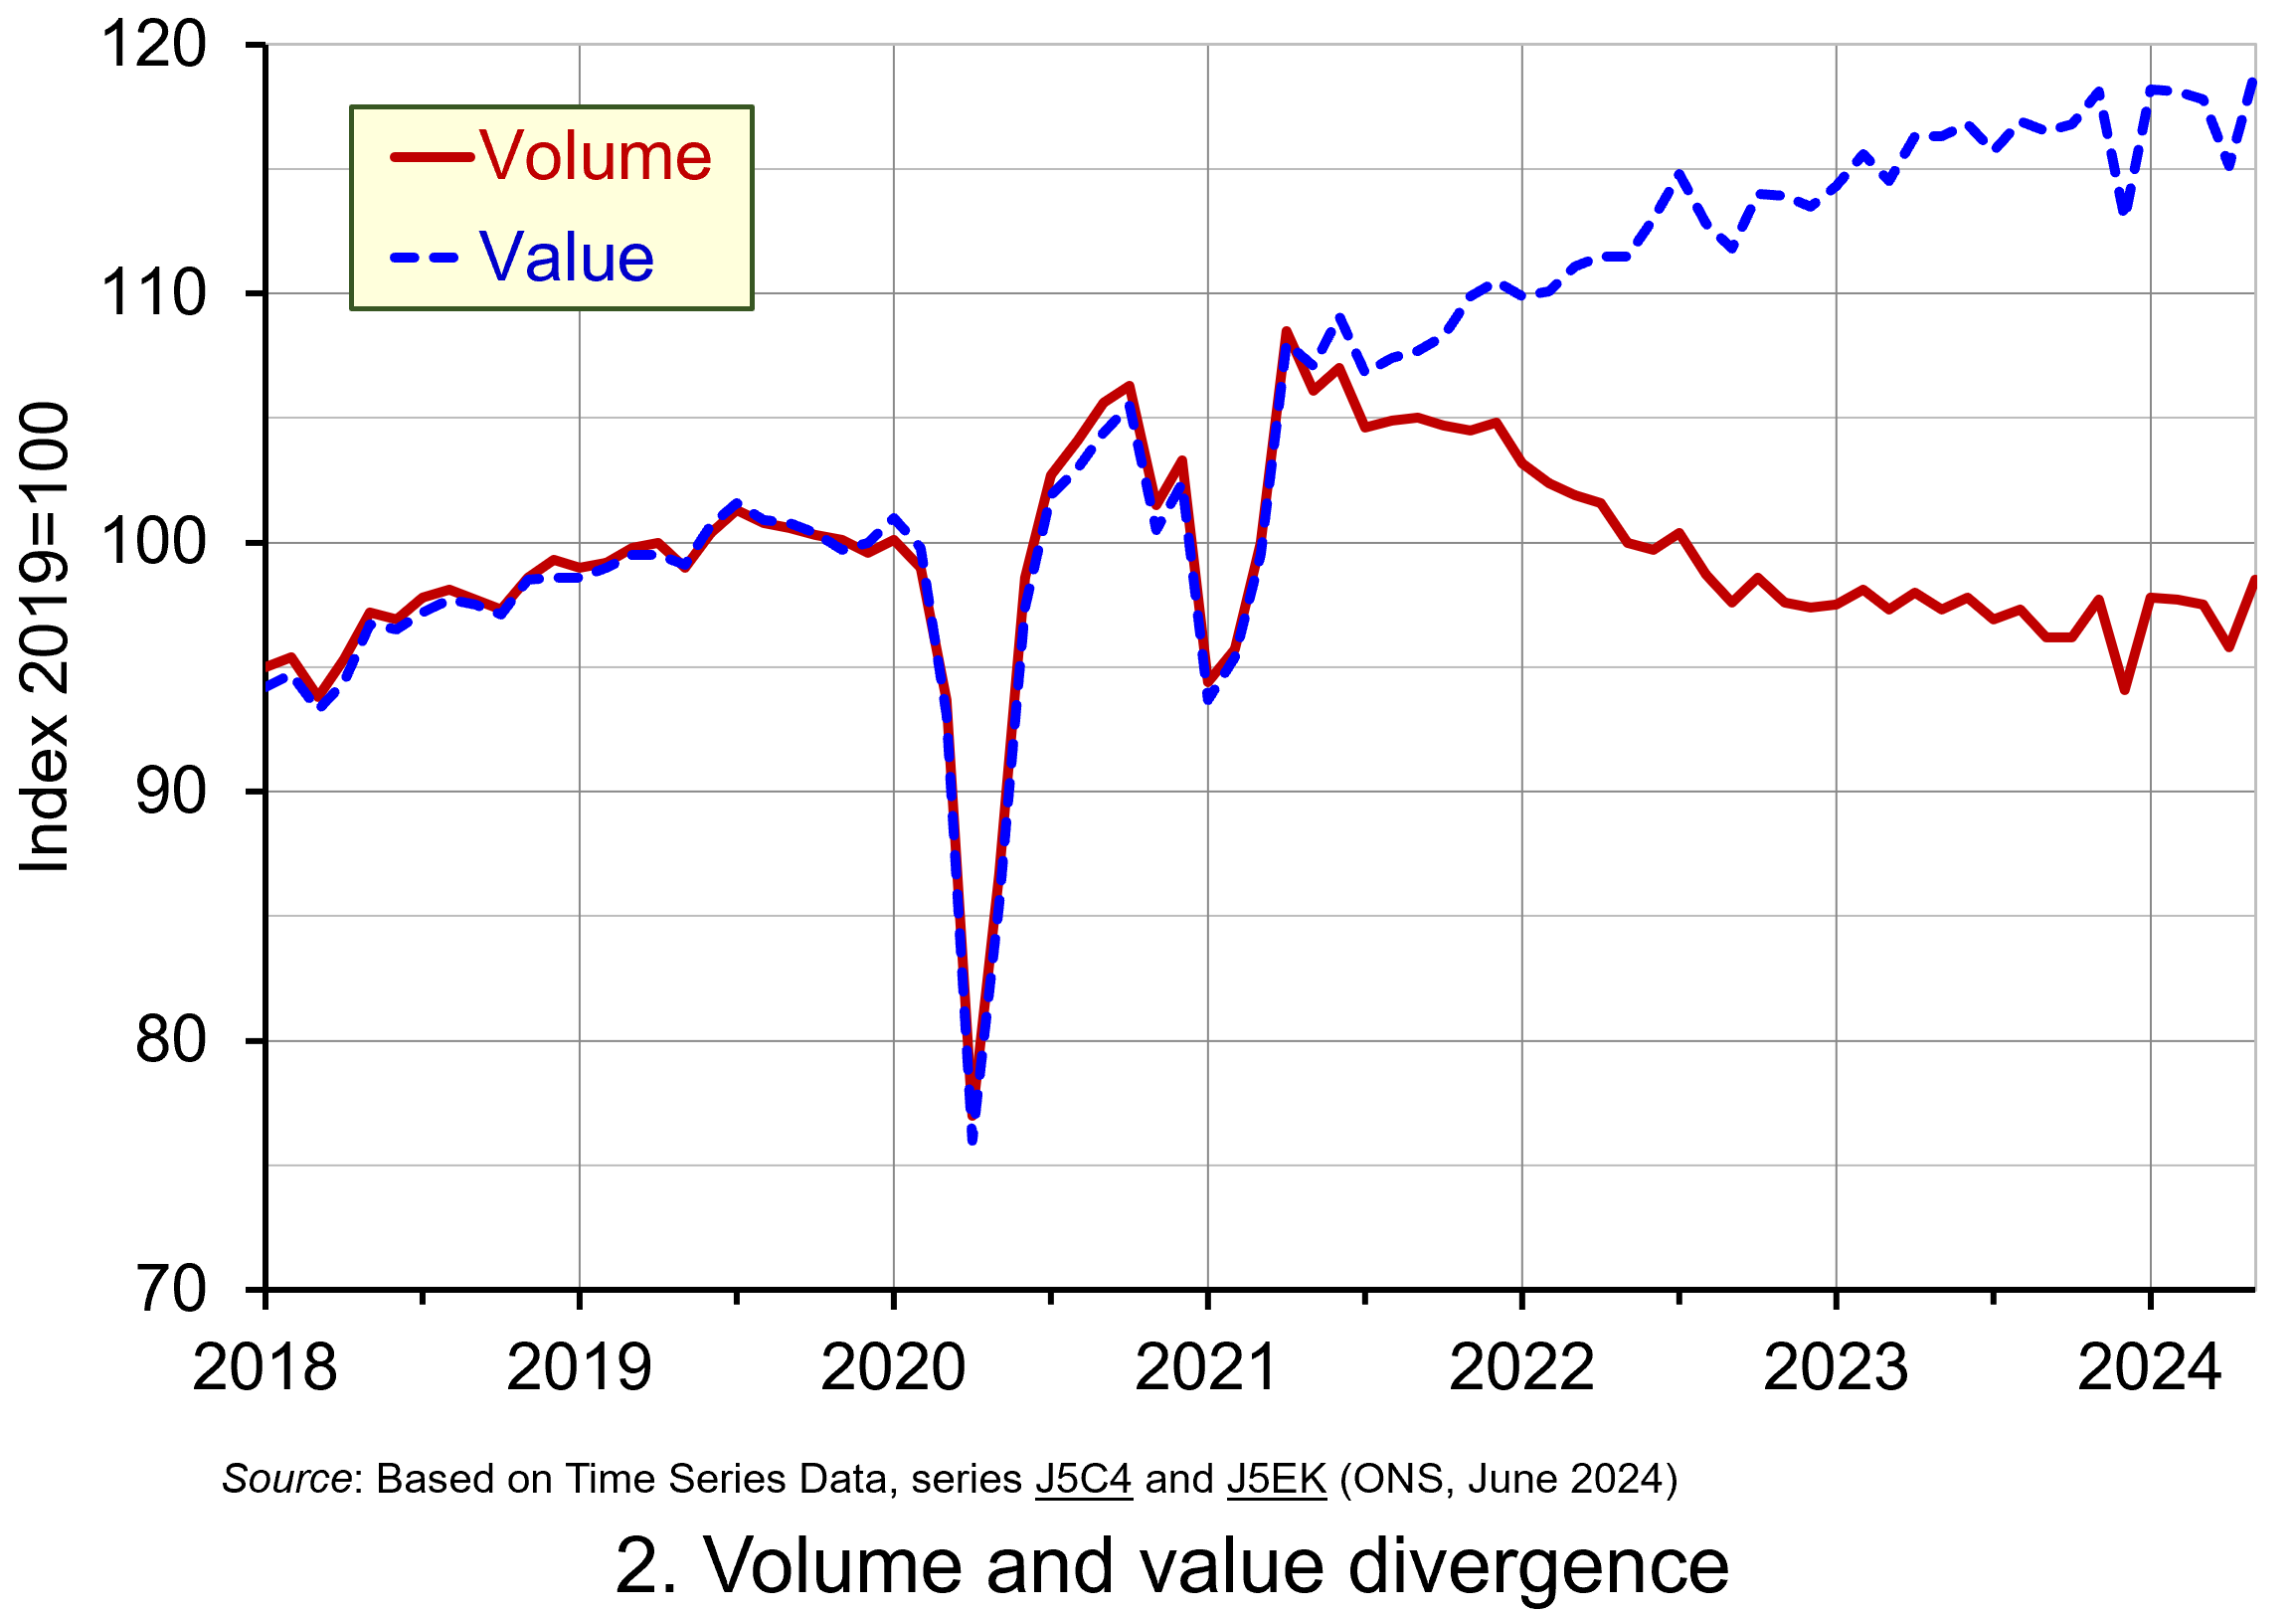 The second of the two periods is from 2021. Chart 2 helps to demonstrates the extent of the struggles of the retail sector in this period. It shows a significant divergence between the volume and value of retail sales. Indeed, between April 2021 and October 2023, while the value of retail sales increased by 8.0 per cent the volume of retail sales fell by 11.0 per cent.
The recent value-volume divergence reflects the inflation shock that began to emerge in 2021. This saw consumer prices, as measured by the Consumer Prices Index (CPI), rise across 2022 and 2023 by 9.1 per cent and 7.3 per cent respectively, with the annual rate of CPI inflation hitting 11.1 per cent in October 2022. Hence, while inflation was a drag on the volume of spending it nonetheless meant that the value of spending continued to rise. Once more this demonstrates why understanding the distinction between nominal and real is important. (Click here to download a PowerPoint of the chart).
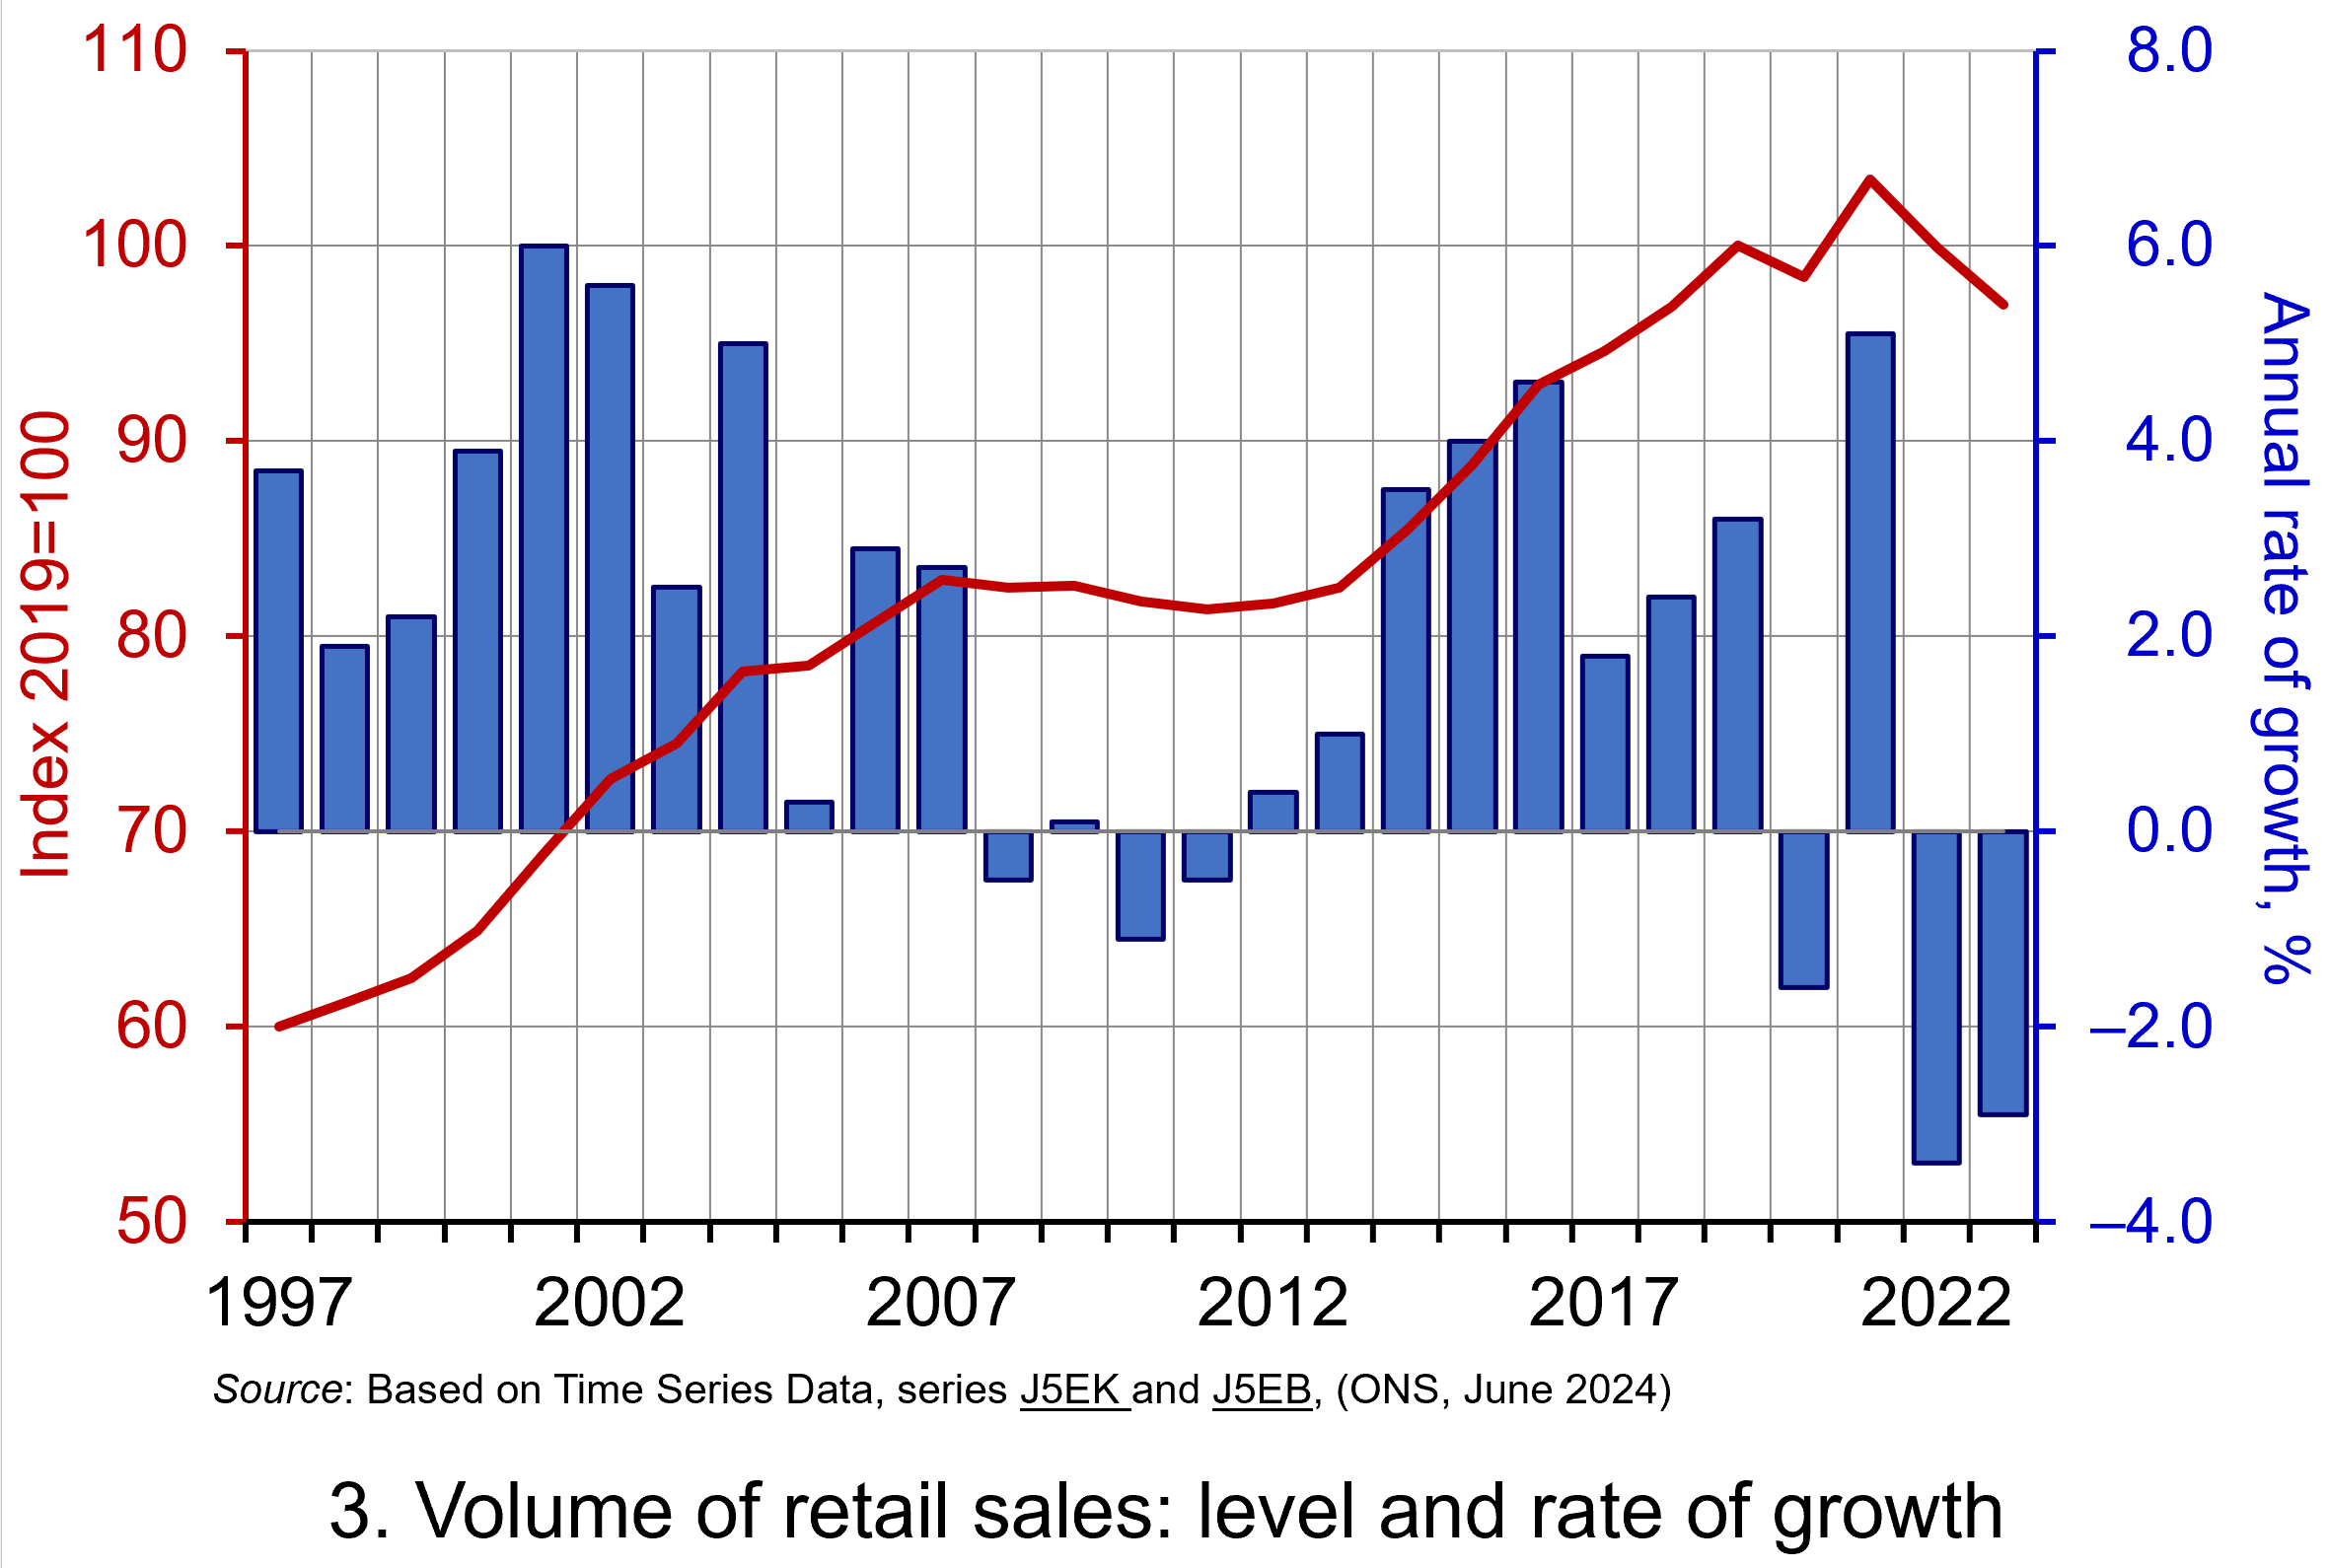 To illustrate the longer-term trend in the volume of retail spending alongside its volatility, Chart 3 plots yearly retail sales volumes and also their percentage change on the previous year.
The chart nicely captures the prolonged halt to retail sales growth following the global financial crisis, the fluctuations caused by COVID and then the sharp falls in the volume of retail spending in 2022 and 2023 as the effects of the inflationary shock on peoples’ finances bit sharply. This cost-of-living crisis significantly affected many people’s disposable income. (Click here to download a PowerPoint of the chart).
Categories of retail sales
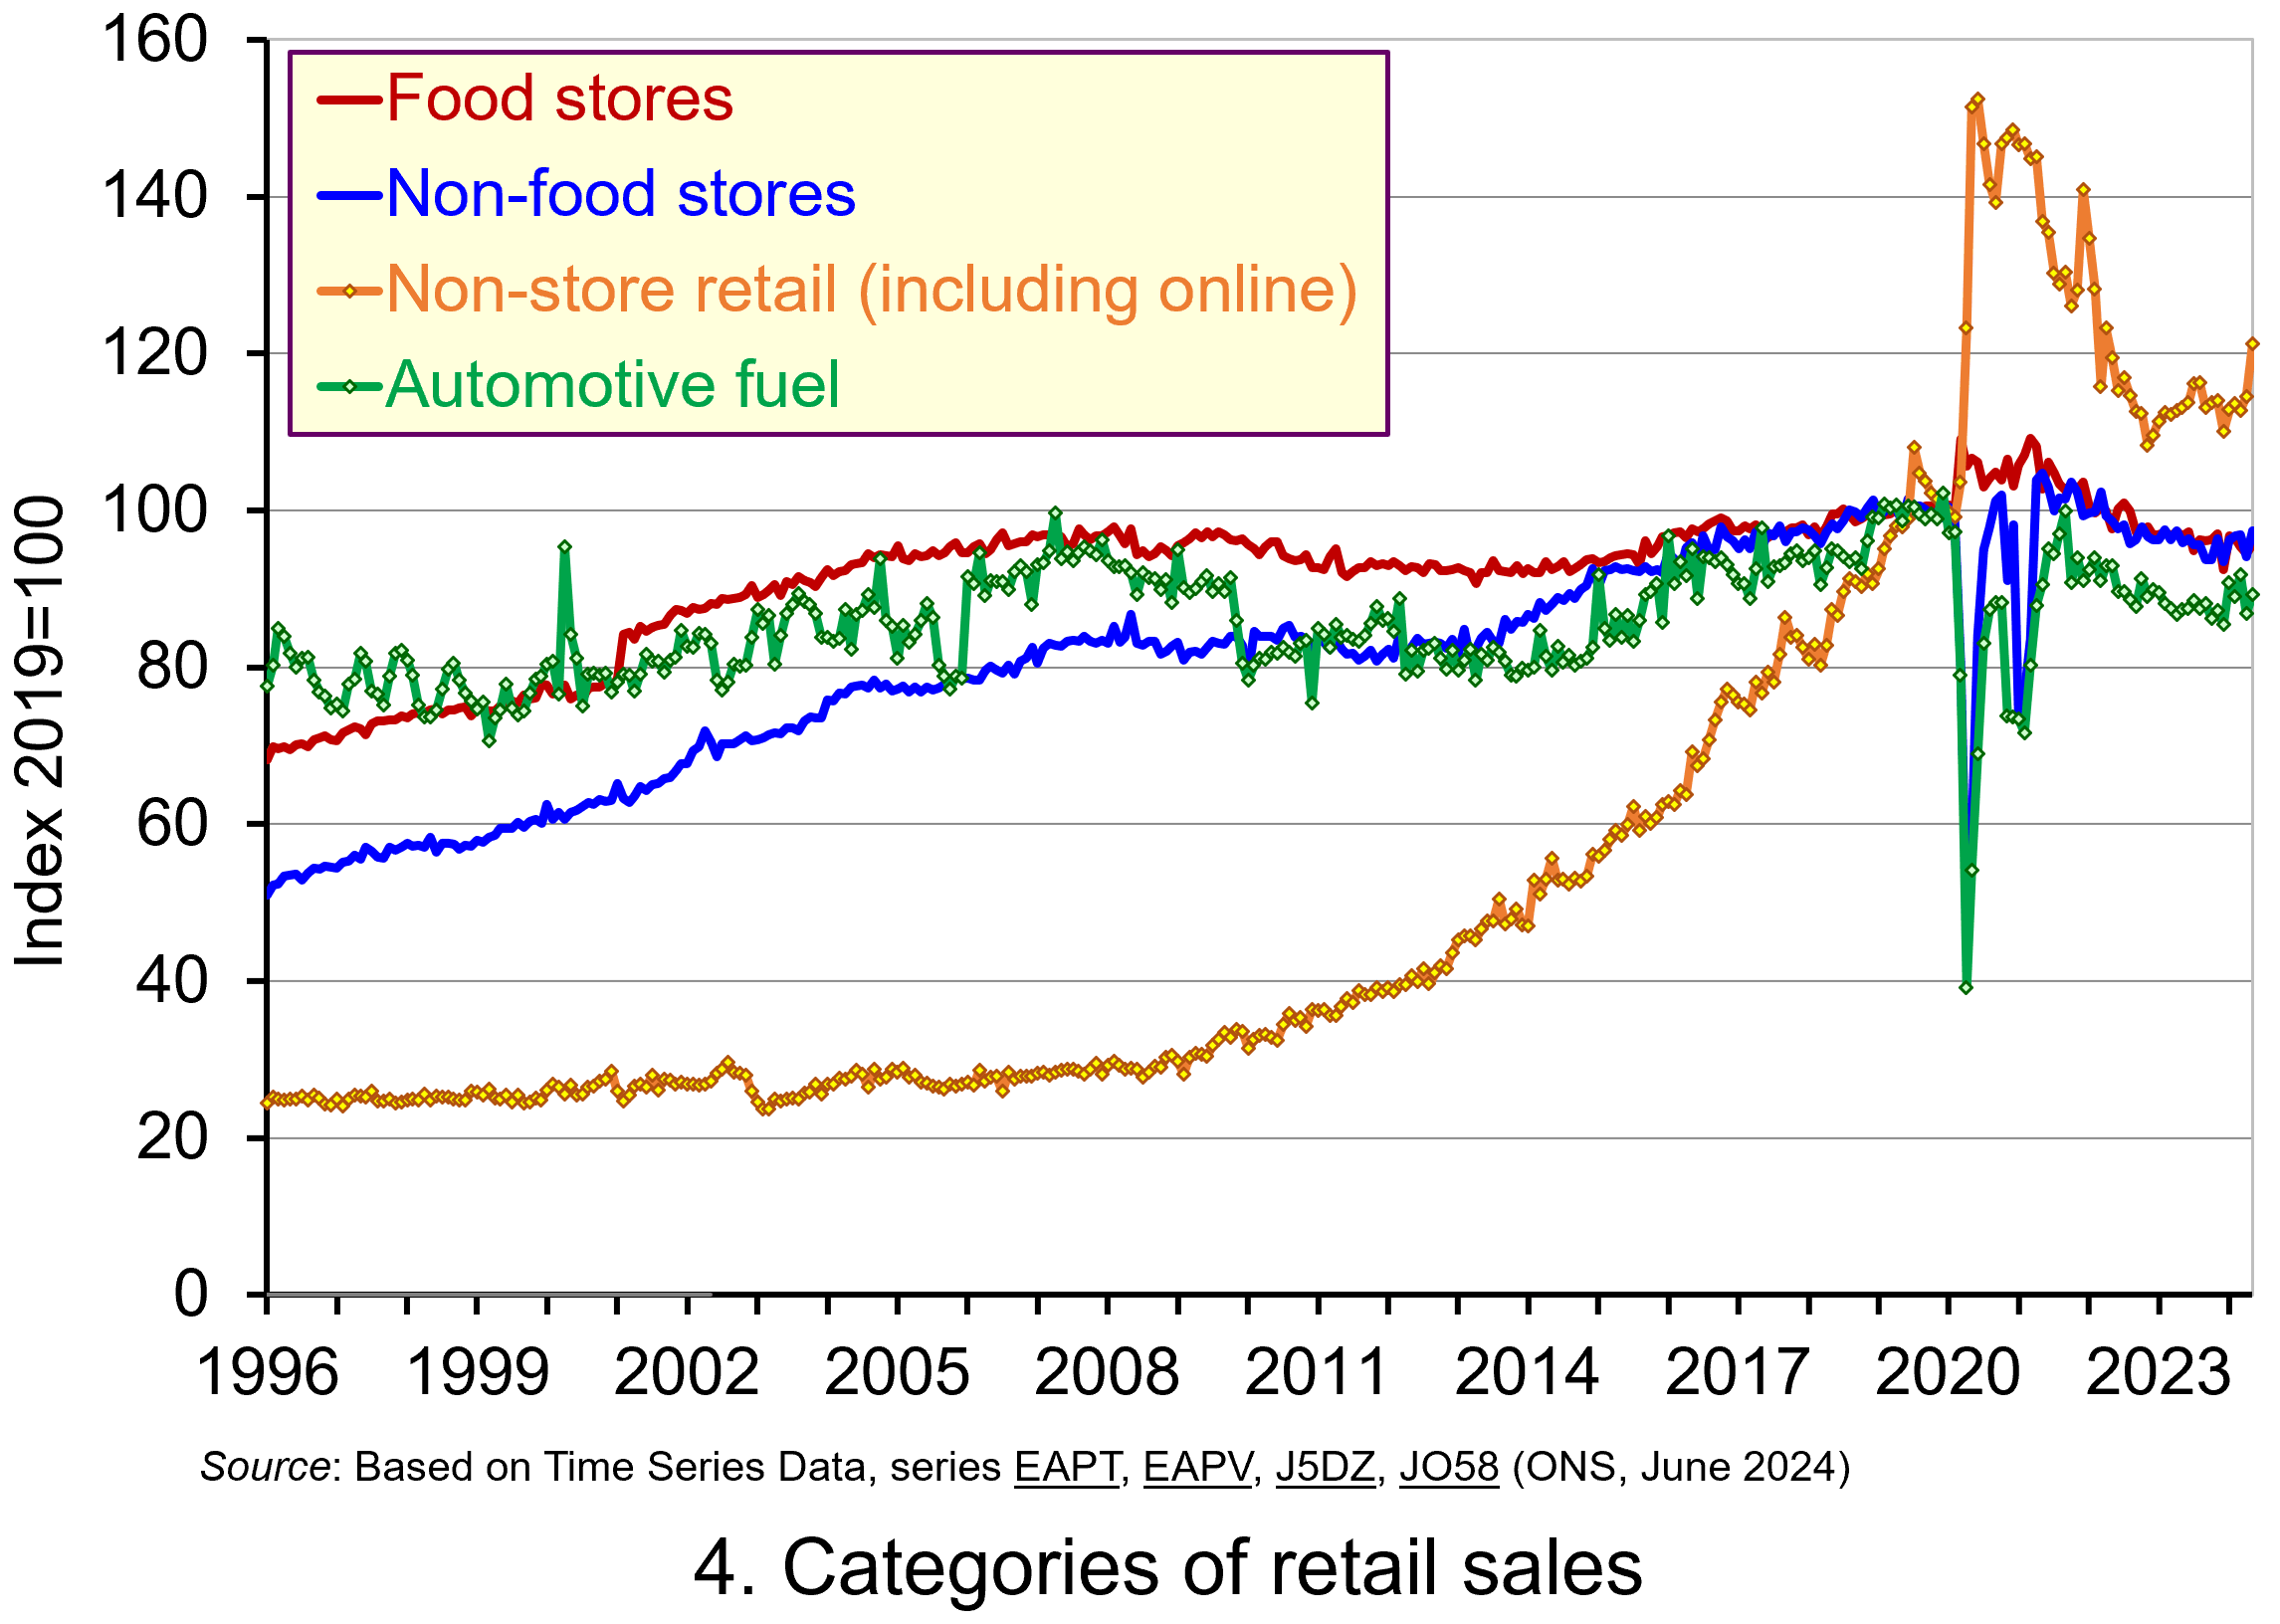 We conclude by considering categories of retail spending. Chart 4 shows volumes of retail sales by four broad categories since 1996. (Click here to download a PowerPoint of the chart). These are food stores, predominantly non-food stores, non-store retail and automotive fuel (i.e. sales of petrol and diesel “at the pumps”).
Whilst all categories have seen an increase in their spending volumes over the period as a whole, there are stark differences in this rate of growth. Perhaps not surprisingly, the most rapid growth is in non-store retail. This includes online retailing, as well as market stalls and catalogues.
The volume of retail spending in the non-store sector has grown at an average annual rate over this period of 6.3 per cent, compared with 2.6 per cent for non-food stores, 1.2 per cent for predominantly food stores and 1.0 per cent for automotive fuels. The growth of non-store retail has been even more rapid since 2010, when the average annual rate of growth in the volume of purchases has been 10.2 per cent, compared to 1.8 per cent for non-food stores, 1.0 per cent for automotive fuels and zero growth for food stores.
If we focus on the most recent patterns in the categories of retail sales, we see that the monthly volume of spending in all categories except non-store retail is now lower than the average in 2019. Specifically, when compared to 2019 levels, the volume of spending in non-food stores in May 2024 was 2.6 per cent lower, while that in food stores was 4.4 per cent lower, and the volume of spending on automotive fuels was 10.8 per cent lower. In contrast, spending in non-store retail was 21.2 per cent higher. Yet this is not to imply that this sector has been immune to the pressures faced by their high-street counterparts. Although it is difficult to disentangle fully the effects of the pandemic and lockdowns on non-store retail sales data, the downward trajectory in the volume of retail sales in the sector that occurred as the economy ‘reopened’ in 2021 and 2022 continued into 2023 when purchases fell by 3.5 per cent.
Final thoughts
The retail sector is an incredibly important part of the economy. A recent research briefing from the House of Commons Library reports that there were 2.7 million jobs in the UK retail sector in 2022, equivalent to 8.6 per cent of the country’s jobs with 314 040 retail businesses as of January 2023. Yet the importance of the retail sector cannot be captured by these statistics alone. Some would argue that the very fabric and wellbeing of our towns and cities is affected by the wellbeing of the sector and, importantly, by structural changes that affect how people interact with retail.
Articles
Research Briefing
Statistical bulletin
Data
Questions
- Which of the following is/are not counted in the UK retail sales data: (i) purchase of furniture from a department store; (ii) weekly grocery shop online; (iii) a stay at a hotel on holiday; (iv) a meal at your favourite café or restaurant?
- Why does an increase in the value of retail sales not necessarily mean that their volume has increased?
- In the presence of deflation, which will be higher: nominal or real growth rates?
- Discuss the factors that could explain the patterns in the volume of spending observed in the different categories of retail sales in Chart 4.
- Discuss what types of retail products might be more or less sensitive to changes in the macroeconomic environment.
- Conduct a survey of recent media reports to prepare a briefing discussing examples of retailers who have struggled or thrived in the recent economic environment.
- What do you understand by the concepts of ‘consumer confidence’ and ‘economic uncertainty’? How might these affect the volume of retail spending?
- Discuss the proposition that the retail sales data cast doubt on whether people are ‘forward-looking consumption smoothers’.