Prices of used fully electric cars (EVs) are falling in the UK, even though prices of used internal combustion engine (ICE) cars are rising. According to Auto Trader (see the first two articles below), in February 2023 the average price of used petrol cars rose by 3.3% compared with January and the price of used diesel cars rose by 1.4%. But the price of used EVs fell by 9.1%. This follows a fall of 2.1% in January.
But why are used EV prices falling? After all, the last few years has seen a drive to replace ICEs with EVs and hybrids, with many consumers preferring electric cars to petrol and diesel ones. What is more, vehicle excise duty is currently zero for EVs (and will be until 2025) and the sale of new ICEs will be banned from the end of the decade. The answer lies in demand and supply.
On the demand side, many existing and potential EV owners worry about the charging infrastructure. The number of EVs has grown more rapidly than the number of charging points. In 2020 there was one charging point per 16 cars; by 2022 this had worsened to one per 30 cars. Also the distribution of charging points is patchy and there is a lack of rapid and ultra-rapid chargers. Increasingly, people have to queue for access to a charger and this can substantially delay a journey and could mean missed appointments. There were many pictures in the media around Christmas of long queues for chargers at service stations and supermarkets. Poor charging infrastructure can be more of a problem for second-hand EVs, which tend to have a smaller range.
Also on the demand side is the price of fuel. After the Russian invasion of Ukraine and the rise in oil prices, the price of petrol and diesel soared. This increased the cost of running ICE vehicles and boosted the demand for EVs. But the war also drove up the price of natural gas and this price largely determines the wholesale price of electricity. With government subsidies for electricity, this constrained the rise in electricity prices. This made running an EV for a time comparatively cheaper. More recently, the price of oil has fallen and with it the price of petrol and diesel. But electricity prices are set to rise in April as government subsidies cease. The cost advantage of running an electric car is likely to disappear, or at least substantially decline.
Another substitute for second-hand EVs is new EVs. As the range of new EVs increases, then anyone thinking about buying an EV may be more tempted to buy a new one rather than a used one. Such demand has also been driven by Tesla’s decision to cut the UK prices of many of it models by between 10% and 13%.
The fall in demand for used EVs is compounded, at least in the short term, by speculation. People thinking of trading in their ICE or hybrid car for a fully electric one are likely to wait if they see prices falling. Why buy now if, by waiting, you could get the same model cheaper?
On the supply side, EV owners, faced with the infrastructure problems outlined above, are likely to sell their EV and buy an ICE or hybrid one instead. This increases the supply of used EVs. This is again compounded by speculation as people thinking of selling their EV do so as quickly as possible before price falls further.
In many other countries, there is much more rapid investment in charging infrastructure and/or subsidies for purchasing not only new but used EVs. This has prevented or limited the fall in price of used EVs.
Draw a supply and demand diagram to illustrate what has been happening in the market for used EVs.
How has the price elasticity of (a) demand and (b) supply affected the amount by which used EV prices have fallen?
Identify substitutes and complements for used electric vehicles. How relevant is the cross-price elasticity of demand for these complements and substitutes in determining price changes of used EVs?
Draw a diagram to illustrate the effect of speculation on used EV prices.
What is likely to happen to used EV prices in the months ahead? Explain.
How are externalities in car usage relevant to government action to influence the market for EVs? What should determine the size of this intervention?
Devise a short survey for people thinking of buying an EV to determine the factors that are likely to affect their decision to buy one and, if so, whether to buy a new or used one.
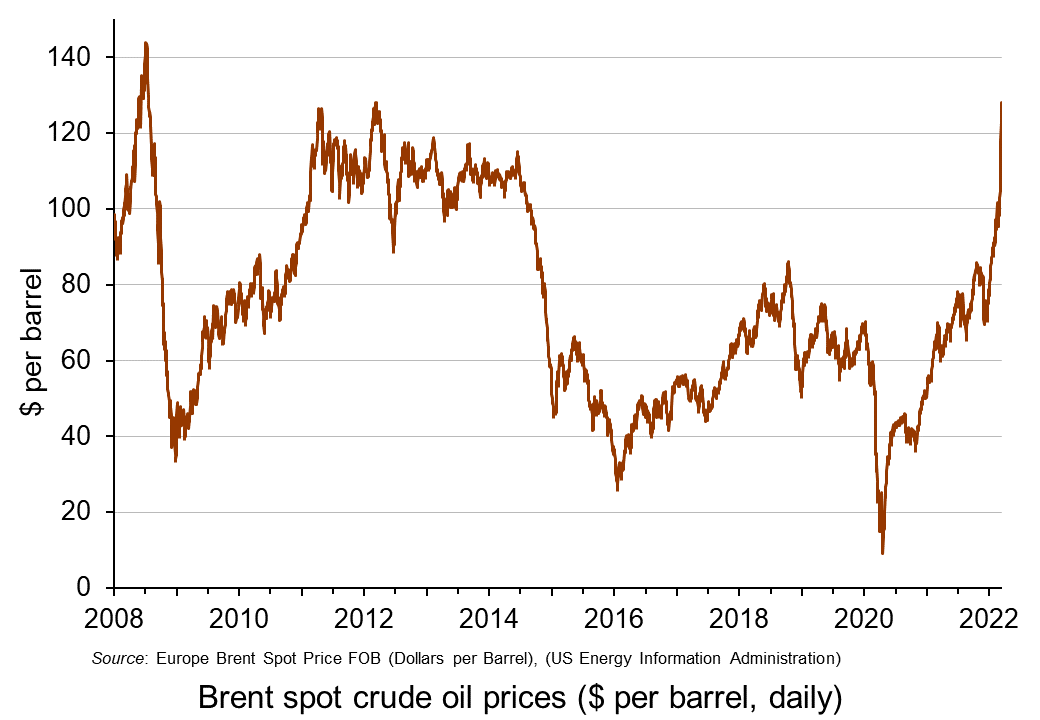
Global oil prices (Brent crude) reached $128 per barrel on 9 March, a level not seen for 10 years and surpassed only in the run up to the financial crisis in 2008. Oil prices are determined by global demand and supply, and the current surge in prices is no exception.
A rise in demand and/or a fall in supply will lead to a rise in the price. Given that both demand and supply are relatively price inelastic, such shifts can cause large rises in oil prices. Similarly, a fall in demand or rise in supply can lead to a large fall in oil prices.
These changes are then amplified by speculation. Traders try to get ahead of price changes. If people anticipate that oil prices will rise, they will buy now, or make a contract to buy more in the future at prices quoted today by buying on the oil futures market. This then pushes up both spot (current) prices and futures prices. If demand or supply conditions change, speculation will amplify the reaction to such a change.
What has happened since 2019?
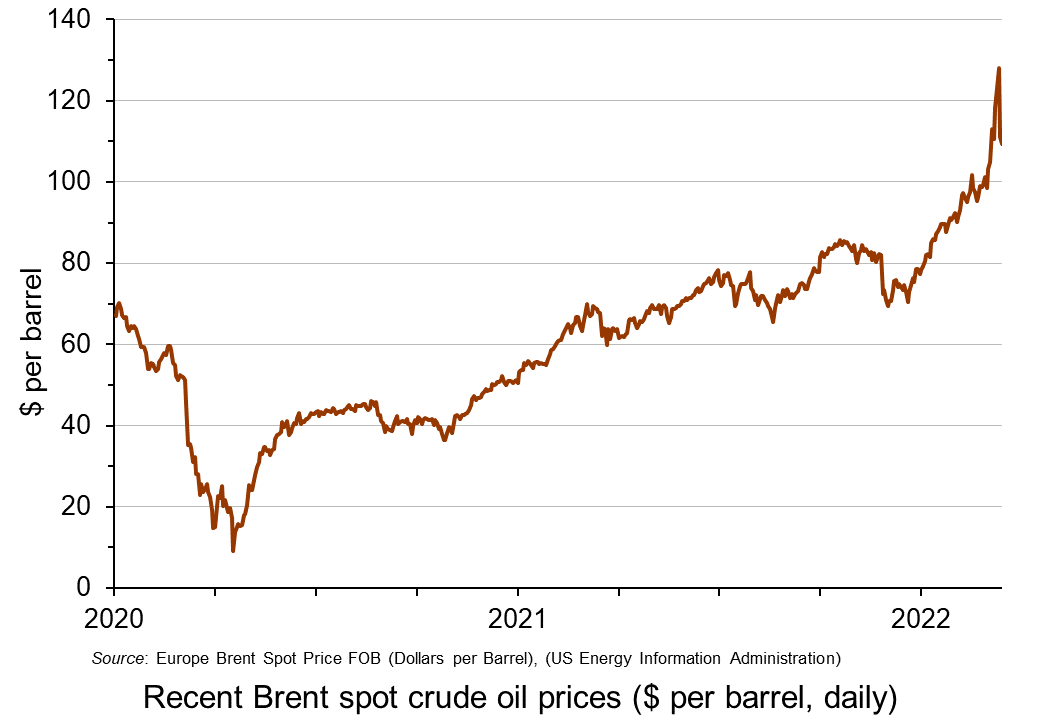
In 2019, oil was typically trading at around $60 to $70 per barrel. It then fell dramatically in early 2020 as the onset of COVID-19 led to a collapse in demand, for both transport and industry. The price fell below $20 in late April (see charts: click here for a PowerPoint).
Oil prices then rose rapidly as demand recovered somewhat but supply chains, especially shipping, were suffering disruptions. By mid-2021, oil was once more trading at around $60 to $70 per barrel. But then demand grew more strongly as economic recovery from COVID accelerated. But supply could not grow so quickly. By January 2022, Brent crude had risen above $80 per barrel.
Then worries began to grow about Russian intentions over Ukraine as Russia embarked on large-scale military exercises close to the border with Ukraine. People increasingly disbelieved Russia’s declarations that it had no intention to invade. Russia is the world’s second biggest producer of oil and people feared that deliberate disruptions to supply by Russia or other countries banning imports of Russian oil would cause supply shortages. Speculation thus drove up the oil price. By 23 February, the day before the Russian invasion of Ukraine, Brent crude had risen to $95.
With the Russian invasion, moves were made by the EU the USA and other countries to ban or limit the purchase of Russian oil. This increased the demand for non-Russian oil.
On 8 March, the USA announced that it was banning the import of Russian oil with immediate effect. The same day, the UK announced that it would phase out the import of Russian oil and oil products by the end of 2022.
The EU is much more dependent on Russian oil imports, which account for around 27% of EU oil consumption and 2/3 of extra-EU oil imports. Nevertheless, it announced that it would accelerate the move away from Russian oil and gas and towards green alternatives. By 8 March, Brent crude had risen to $128 per barrel.
The question was then whether other sources of supply would help to fill the gap. Initially it seemed that OPEC+ (excluding Russia) would not increase production beyond the quotas previously agreed by the cartel to meet recovery in world demand. But then, on 9 March, the UAE Ambassador to Washington announced that the county favoured production increases and would encourage other OPEC members to follow suit. With the announcement, the oil price fell by 11% to £111. But the next day, it rose again somewhat as the UAE seemed to backtrack, but then fell back slightly as OPEC said there was no shortage of oil.
This is obviously an unfolding story with the suffering of the Ukrainian people at its heart. But the concepts of supply and demand and their price elasticity and the role of speculation are central to understanding what will happen to oil prices in the coming months with all the consequences for poverty and economic hardship.
Use a demand and supply diagram to illustrate what has happened to oil prices over the past two years. How has the size of the effects been dependent on the price elasticity of demand for oil and the price elasticity of supply of oil?
Use a demand and supply diagram to show what has been happening to the price of natural gas over the past two years. Are the determinants similar to those in the oil market? How do they differ (if at all)?
What policy options are open to governments to deal with soaring energy prices?
What are the distributional consequences of the rise in energy prices? (see the blog: Rise in the cost of living.)
Under what circumstances are oil prices over the next six months likely (a) fall; (b) continue rising?
The suffering inflicted on the Ukrainian people by the Russian invasion is immense. But, at a much lower level, the war will also inflict costs on people in countries around the world. There will be significant costs to households in the form of even higher energy and food price inflation and a possible economic slowdown. The reactions of governments and central banks could put a further squeeze on living standards. Stock markets could fall further and investment could decline as firms lose confidence.
Russia is the world’s second largest oil supplier and any disruption to supplies will drive up the price of oil significantly. Ahead of the invasion, oil prices were rising. At the beginning of February, Brent crude was around $90 per barrel. With the invasion, it rose above $100 per barrel.
Russia is also a major producer of natural gas. The EU is particularly dependent on Russia, which supplies 40% of its natural gas. With Germany halting approval of the major new gas pipeline under the Baltic from Russia to Germany, Nord Stream 2, the price of gas has rocketed. On the day of the invasion, European gas prices rose by over 50%.
Nevertheless, with the USA deciding not to extend sanctions to Russia’s energy sector, the price of gas fell back by 32% the next day. It remains to be seen just how much the supplies of oil and gas from Russia will be disrupted over the coming weeks.
Both Russia and Ukraine are major suppliers of wheat and maize, between them responsible for 14% of global wheat production and 30% of global wheat exports. A significant rise in the price of wheat and other grains will exacerbate the current rise in food price inflation.
Russia is also a significant supplier of metals, such as copper, platinum, aluminium and nickel, which are used in a wide variety of products. A rise in their price has begun and will further add to inflationary pressures and supply-chain problems which have followed the pandemic.
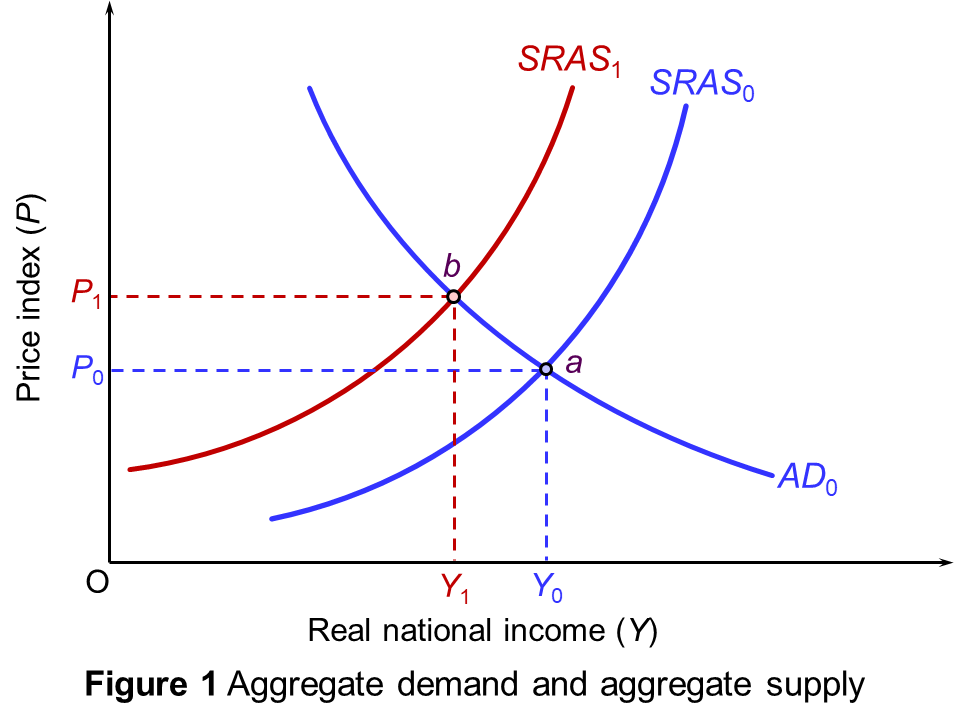
The effect of these supply shocks can be illustrated in a simple aggregate demand and supply diagram (see Figure 1), which shows a representative economy that imports energy, grain and other resources. Aggregate demand and short-run aggregate supply are initially given by AD0 and SRAS0. Equilibrium is at point a, with real national income (real GDP) of Y0 and a price index of P0.
The supply shock shifts short-run aggregate supply to SRAS1. Equilibrium moves to point b. The price index rises to P1 and real national income falls to Y1. If it is a ‘one-off’ cost increase, then the price index will settle at the new higher level and GDP at the new lower level provided that real aggregate demand remains the same. Inflation will be temporary. If, however, the SRAS curve continues to shift upwards to the left, then cost-push inflation will continue.
These supply-side shocks make the resulting inflation hard for policymakers to deal with. When the problem lies on the demand side, where the inflation is accompanied by an unsustainable boom, a contractionary fiscal and monetary policy can stabilise the economy and reduce inflation. But the inflationary problem today is not demand-pull inflation; it’s cost-push inflation. Disruptions to supply are both driving up prices and causing an economic slowdown – a situation of ‘stagflation’, or even an inflationary recession.
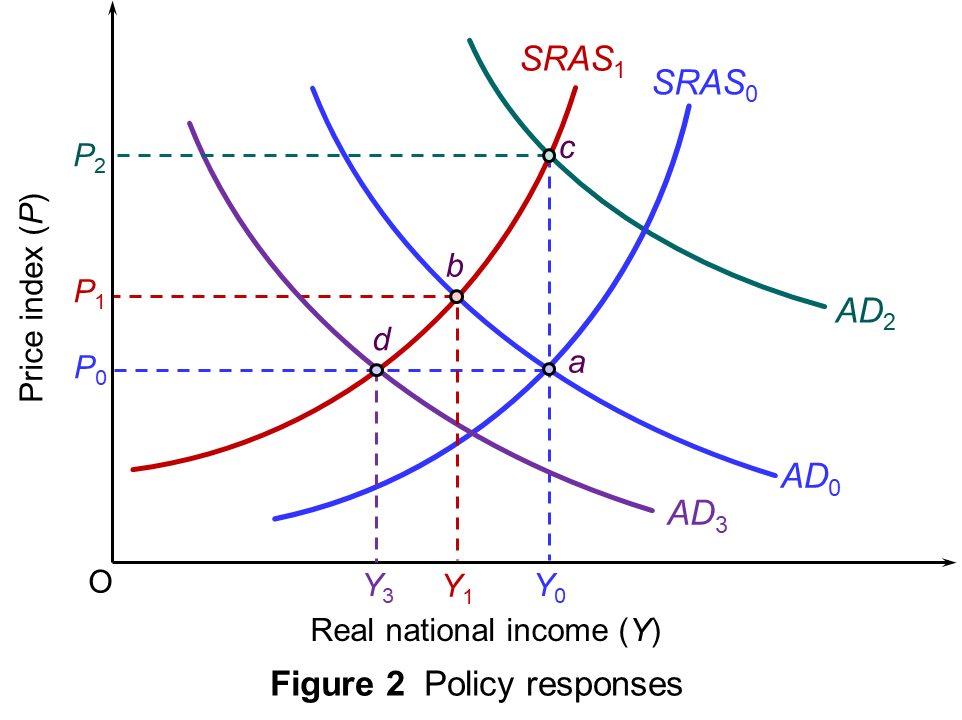
An expansionary policy, such as increasing bond purchases (quantitative easing) or increasing government spending, may help to avoid recession (at least temporarily), but will only exacerbate inflation. In Figure 2, aggregate demand shifts to AD2. Equilibrium moves to point c. Real GDP returns to Y0 (at least temporarily) but the price level rises further, to P2. (Click here for a PowerPoint of the diagram.)
A contractionary policy, such as raising interest rates or taxes, may help to reduce inflation but will make the slowdown worse and could lead to recession. In the diagram, aggregate demand shifts to AD3. Equilibrium moves to point d. The price level returns to P0 (at least temporarily) but real income falls further, to Y3.
In other words, you cannot tackle both the slowdown/recession and the inflation simultaneously by the use of demand-side policy. One requires an expansionary fiscal and/or monetary policy; the other requires fiscal and/or monetary tightening.
Then there are other likely economic stresses. If NATO countries respond by increasing defence expenditure, this will put further strain on public finances.
Sentiment is a key driver of the economy and prices. Expectations tend to be self-fulfilling. So if the war in Ukraine undermines confidence in stock markets and the real economy and further raises inflationary expectations, this pessimistic mood will tend in itself to drive down share prices, drive up inflation and drive down investment and economic growth.
If there is a negative supply shock, what will determine the size of the resulting increase in the price level and the rate of inflation over the next one or two years?
How may expectations affect (a) the size of the increase in the price level; (b) future prices of gas and oil?
Why did stock markets rise on the day after the invasion of Ukraine?
Argue the case for and against relaxing monetary policy and delaying tax rises in the light of the economic consequences of the war in Ukraine.
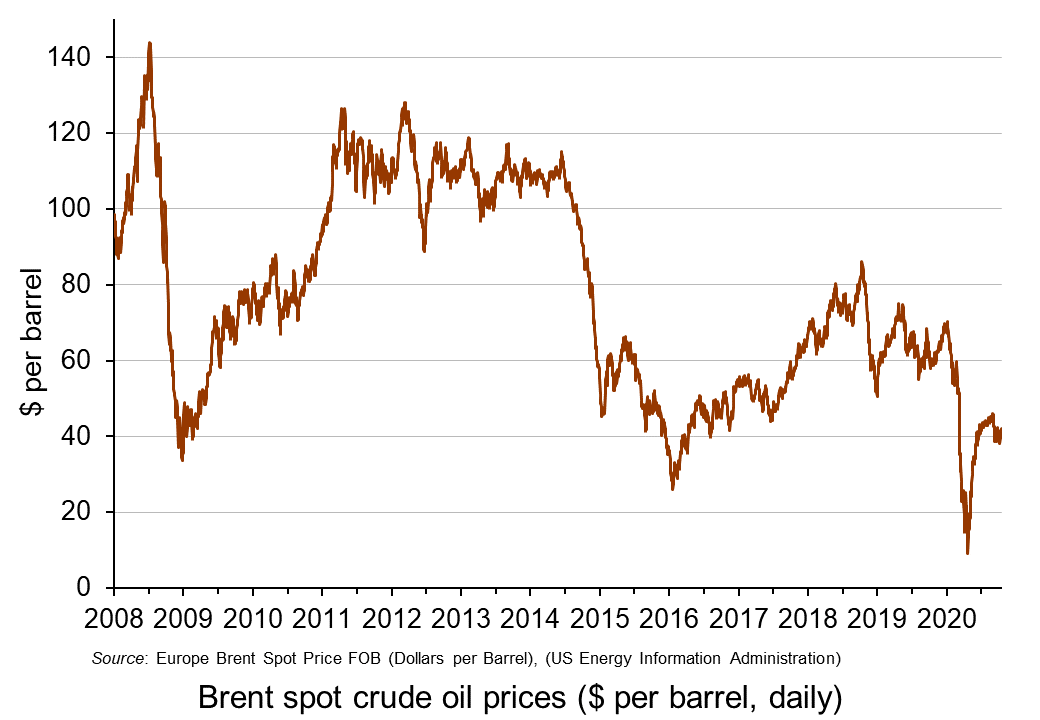
In its latest Commodity Special Feature (pages 43 to 53 of the October 2020 World Economic Outlook), the IMF examines the future of oil and other commodity prices. With the collapse in oil demand during the early stages of the coronavirus pandemic, oil prices plummeted. Brent crude fell from around $60 per barrel in late January to below $20 in April.
However, oil prices then rose somewhat and have typically been between $40 and $45 per barrel since June 2020 – still more than 35% lower than at the beginning of the year (see chart below: click here for a PowerPoint). This rise was caused by a slight recovery in demand but largely by supply reductions. These were the result partly of limits agreed by OPEC+ (OPEC, Russia and some other non-OPEC oil producing countries) and partly of reduced drilling in the USA and the closure of many shale oil wells which the lower prices had made unprofitable.
The IMF considers the future for oil prices and concludes that prices will remain subdued. It forecasts that petroleum spot prices will average $47 per barrel in 2021, up only slightly from the $42 average it predicts for 2020.
On the supply side it predicts that ‘stronger oil production growth in several non-OPEC+ countries, a faster normalization of Libya’s oil production, and a breakdown of the OPEC+ agreement’ will push up supply and push down prices. Even if the OPEC+ agreement holds, the members are set to ease their production cut by nearly 25% at the start of 2021. This rise in supply will be offset to some extent by possibly ‘excessive cuts in oil and gas upstream investments and further bankruptcies in the energy sector’.
On the demand side, the speed of the recovery from the pandemic will be a major determinant. If the second wave is long-lasting and deep, with a vaccine available to all still some way off, oil demand could remain subdued for many months. This will be compounded by the accelerating shift to renewable energy and electric vehicles and by government policies to reduce CO2 emissions.
Describe a scenario in which oil prices rebound significantly over the coming months. Illustrate your answer with a supply and demand diagram.
Describe a scenario in which oil prices fall over the coming months. Again, illustrate your answer with a supply and demand diagram.
How are the price elasticities of demand and supply relevant to the size of any oil price change?
Project forward 10 years and predict whether oil prices will be higher or lower than now. What are the major determinants of supply and demand in your prediction?
What are oil futures? What determines oil future prices?
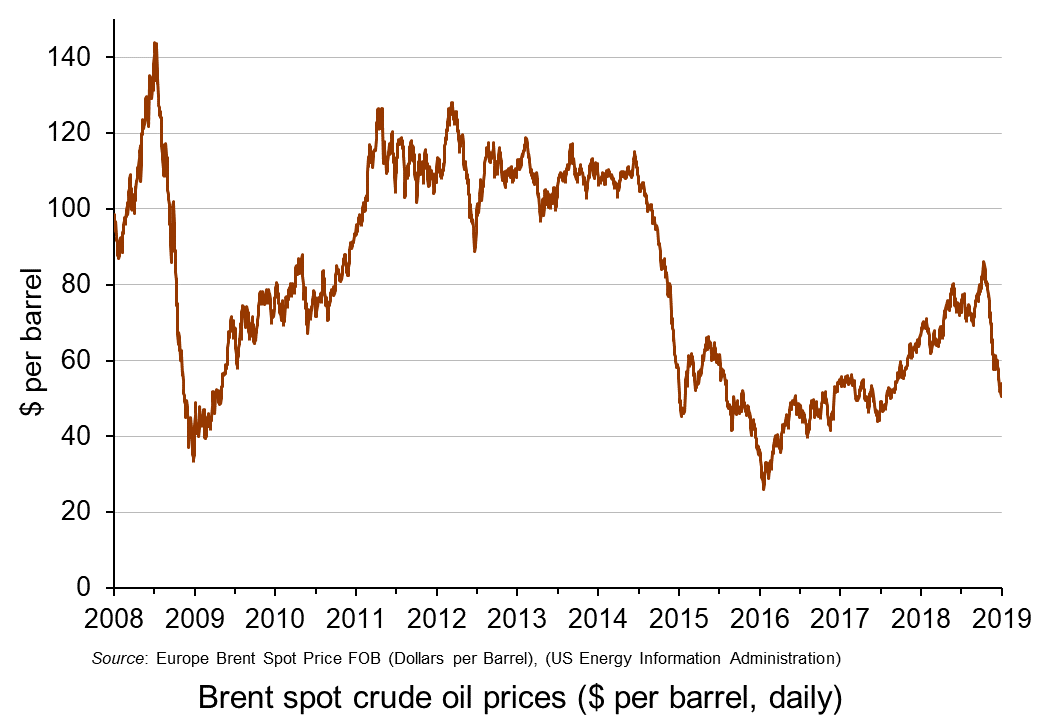
Back in October, we examined the rise in oil prices. We said that, ‘With Brent crude currently at around $85 per barrel, some commentators are predicting the price could reach $100. At the beginning of the year, the price was $67 per barrel; in June last year it was $44. In January 2016, it reached a low of $26.’ In that blog we looked at the causes on both the demand and supply sides of the oil market. On the demand side, the world economy had been growing relatively strongly. On the supply side there had been increasing constraints, such as sanctions on Iran, the turmoil in Venezuela and the failure of shale oil output to expand as much as had been anticipated.
But what a difference a few weeks can make!
Brent crude prices have fallen from $86 per barrel in early October to just over $50 by the end of the year – a fall of 41 per cent. (Click here for a PowerPoint of the chart.) Explanations can again be found on both the demand and supply sides.
On the demand side, global growth is falling and there is concern about a possible recession (see the blog: Is the USA heading for recession?). The Bloomberg article below reports that all three main agencies concerned with the oil market – the U.S. Energy Information Administration, the Paris-based International Energy Agency and OPEC – have trimmed their oil demand growth forecasts for 2019. With lower expected demand, oil companies are beginning to run down stocks and thus require to purchase less crude oil. Fracking (Source: US Bureau of Land Management Environmental Assessment, public domain image)
On the supply side, US shale output has grown rapidly in recent weeks and US output has now reached a record level of 11.7 million barrels per day (mbpd), up from 10.0 mbpd in January 2018, 8.8 mbpd in January 2017 and 5.4 mbpd in January 2010. The USA is now the world’s biggest oil producer, with Russia producing around 11.4 mpbd and Saudi Arabia around 11.1 mpbd.
Total world supply by the end of 2018 of around 102 mbpd is some 2.5 mbpd higher than expected at the beginning of 2018 and around 0.5 mbpd greater than consumption at current prices (the remainder going into storage).
So will oil prices continue to fall? Most analysts expect them to rise somewhat in the near future. Markets may have overcorrected to the gloomy news about global growth. On the supply side, global oil production fell in December by 0.53 mbpd. In addition OPEC and Russia have signed an accord to reduce their joint production by 1.2 mbpd starting this month (January). What is more, US sanctions on Iran have continued to curb its oil exports.
But whatever happens to global growth and oil production, the future price will continue to reflect demand and supply. The difficulty for forecasters is in predicting just what the levels of demand and supply will be in these uncertain times.
 Prices of used fully electric cars (EVs) are falling in the UK, even though prices of used internal combustion engine (ICE) cars are rising. According to Auto Trader (see the first two articles below), in February 2023 the average price of used petrol cars rose by 3.3% compared with January and the price of used diesel cars rose by 1.4%. But the price of used EVs fell by 9.1%. This follows a fall of 2.1% in January.
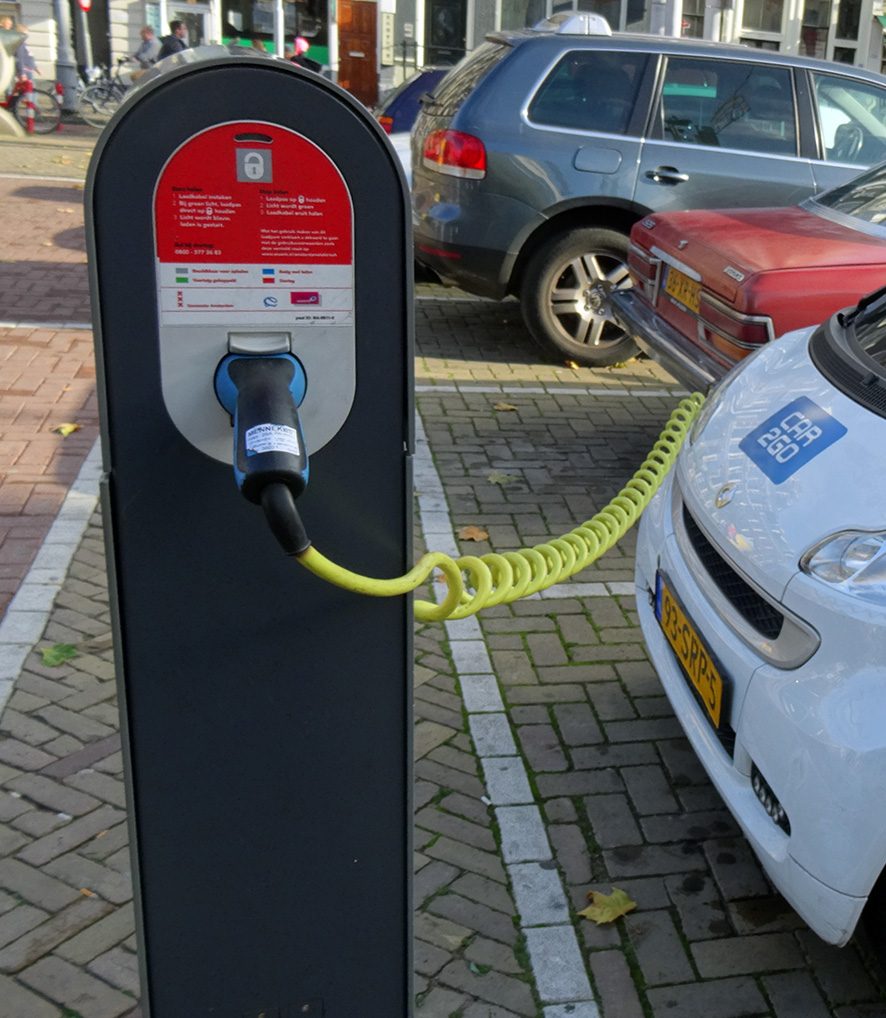 On the demand side, many existing and potential EV owners worry about the charging infrastructure. The number of EVs has grown more rapidly than the number of charging points. In 2020 there was one charging point per 16 cars; by 2022 this had worsened to one per 30 cars. Also the distribution of charging points is patchy and there is a lack of rapid and ultra-rapid chargers. Increasingly, people have to queue for access to a charger and this can substantially delay a journey and could mean missed appointments. There were many pictures in the media around Christmas of long queues for chargers at service stations and supermarkets. Poor charging infrastructure can be more of a problem for second-hand EVs, which tend to have a smaller range.
 More recently, the price of oil has fallen and with it the price of petrol and diesel. But electricity prices are set to rise in April as government subsidies cease. The cost advantage of running an electric car is likely to disappear, or at least substantially decline.
 Global oil prices (Brent crude) reached $128 per barrel on 9 March, a level not seen for 10 years and surpassed only in the run up to the financial crisis in 2008. Oil prices are determined by global demand and supply, and the current surge in prices is no exception.
 In 2019, oil was typically trading at around $60 to $70 per barrel. It then fell dramatically in early 2020 as the onset of COVID-19 led to a collapse in demand, for both transport and industry. The price fell below $20 in late April (see charts: click
  Then worries began to grow about Russian intentions over Ukraine as Russia embarked on large-scale military exercises close to the border with Ukraine. People increasingly disbelieved Russia’s declarations that it had no intention to invade. Russia is the world’s second biggest producer of oil and people feared that deliberate disruptions to supply by Russia or other countries banning imports of Russian oil would cause supply shortages. Speculation thus drove up the oil price. By 23 February, the day before the Russian invasion of Ukraine, Brent crude had risen to $95.
 On 8 March, the USA announced that it was banning the import of Russian oil with immediate effect. The same day, the UK announced that it would phase out the import of Russian oil and oil products by the end of 2022.
  Russia is also a major producer of natural gas. The EU is particularly dependent on Russia, which supplies 40% of its natural gas. With Germany halting approval of the major new gas pipeline under the Baltic from Russia to Germany, Nord Stream 2, the price of gas has rocketed. On the day of the invasion, European gas prices rose by over 50%.
  The effect of these supply shocks can be illustrated in a simple aggregate demand and supply diagram (see Figure 1), which shows a representative economy that imports energy, grain and other resources. Aggregate demand and short-run aggregate supply are initially given by AD0 and SRAS0. Equilibrium is at point a, with real national income (real GDP) of Y0 and a price index of P0.
 An expansionary policy, such as increasing bond purchases (quantitative easing) or increasing government spending, may help to avoid recession (at least temporarily), but will only exacerbate inflation. In Figure 2, aggregate demand shifts to AD2. Equilibrium moves to point c. Real GDP returns to Y0 (at least temporarily) but the price level rises further, to P2. (Click
  In its latest
  The IMF considers the future for oil prices and concludes that prices will remain subdued. It forecasts that petroleum spot prices will average $47 per barrel in 2021, up only slightly from the $42 average it predicts for 2020.
 Back in October, we examined the
  Brent crude prices have fallen from $86 per barrel in early October to just over $50 by the end of the year – a fall of 41 per cent. (Click