 It is impossible to make both precise and accurate forecasts of a country’s rate of economic growth, even a year ahead. And the same goes for other macroeconomic variables, such as the rate of unemployment or the balance of trade. The reason is that there are so many determinants of these variables, such as political decisions or events, which themselves are unpredictable. Economics examines the effects of human interactions – it is a social science, not a natural science. And human behaviour is hard to forecast.
Leading indicators
Nevertheless, economists do make forecasts. These are best estimates, taking into account a number of determinants that can be currently measured, such as tax or interest rate changes. These determinants, or ‘leading indicators’, have been found to be related to future outcomes. For example, surveys of consumer and business confidence give a good indication of future consumer expenditure and investment – key components of GDP.
Leading indicators do not have to be directly causal. They could, instead, be a symptom of underlying changes that are themselves likely to affect the economy in the future. For example, changes in stock market prices may reflect changes in confidence or changes in liquidity. It is these changes that are likely to have a direct or indirect causal effect on future output, employment, prices, etc.
Macroeconomic models show the relationships between variables. They show how changes in one variable (e.g. increased investment) affect other variables (e.g. real GDP or productivity). So when an indicator changes, such as a rise in interest rates, economists use these models to estimate the likely effect, assuming other things remain constant (ceteris paribus). The problem is that other things don’t remain constant. The economy is buffeted around by a huge range of events that can affect the outcome of the change in the indicator or the variable(s) it reflects.
Forecasting can never therefore be 100% accurate (except by chance). Nevertheless, by carefully studying leading indicators, economists can get a good idea of the likely course of the economy.
Leading indicators of the US economy
At the start of 2019, several leading indicators are suggesting the US economy is likely to slow and might even go into recession. The following are some of the main examples.
Political events. This is the most obvious leading indicator. If decisions are made that are likely to have an adverse effect on growth, a recession may follow. For example, decisions in the UK Parliament over Brexit will directly impact on UK growth.
 As far as the USA is concerned, President Trump’s decision to put tariffs on steel and aluminium imports from a range of countries, including China, the EU and Canada, led these countries to retaliate with tariffs on US imports. A tariff war has a negative effect on growth. It is a negative sum game. Of course, there may be a settlement, with countries agreeing to reduce or eliminate these new tariffs, but the danger is that the trade war may continue long enough to do serious damage to global economic growth.
But just how damaging it is likely to be is impossible to predict. That depends on future political decisions, not just those of the recent past. Will there be a global rise in protectionism or will countries pull back from such a destructive scenario? On 29 December, President Trump tweeted, ‘Just had a long and very good call with President Xi of China. Deal is moving along very well. If made, it will be very comprehensive, covering all subjects, areas and points of dispute. Big progress being made!’ China said that it was willing to work with the USA over reaching a consensus on trade.
Rises in interest rates. If these are in response to a situation of excess demand, they can be seen as a means of bringing inflation down to the target level or of closing a positive output gap, where real national income is above its potential level. They would not signify an impending recession. But many commentators have interpreted rises in interest rates in the USA as being different from this.
The Fed is keen to raise interest rates above the historic low rates that were seen as an ’emergency’ response to the financial crisis of 2007–8. It is also keen to reverse the policy of quantitative easing and has begun what might be described as ‘quantitative tightening’: not buying new bonds when existing ones that it purchased during rounds of QE mature. It refers to this interest rate and money supply policy as ‘policy normalization‘. The Fed maintains that such policy is ‘consistent with sustained expansion of economic activity, strong labor market conditions, and inflation near the Committee’s symmetric 2 percent objective over the medium term’.
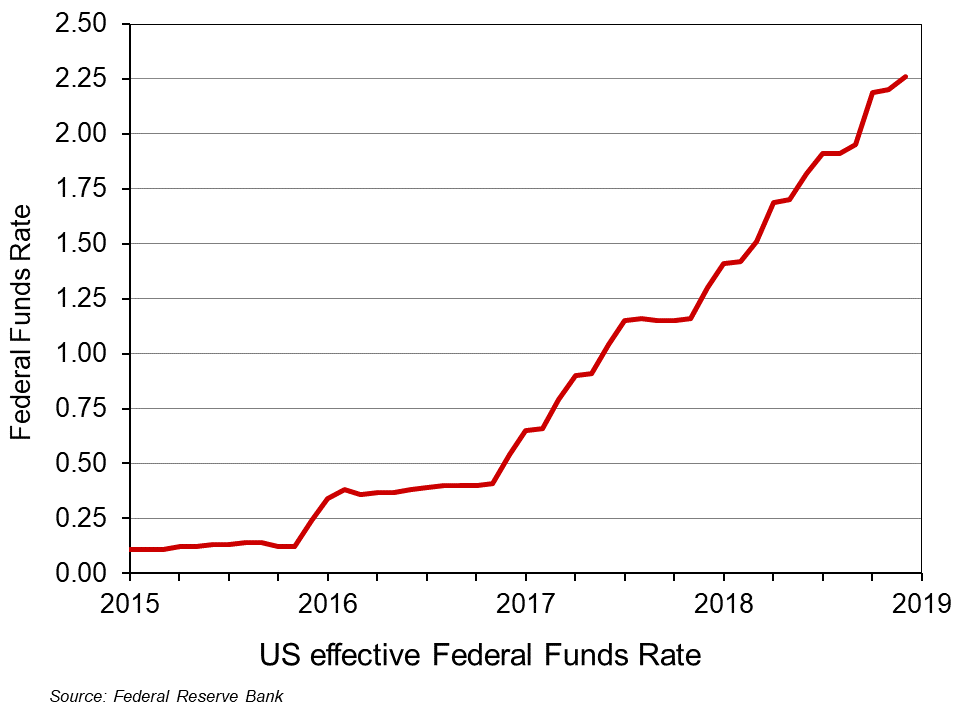 However, many commentators, including President Trump, have accused the Fed of going too fast in this process and of excessively dampening the economy. It has already raised the Federal Funds Rate nine times by 0.25 percentage points each time since December 2015 (click here for a PowerPoint file of the chart). What is more, announcing that the policy will continue makes such announcements themselves a leading indicator of future rises in interest rates, which are a leading indicator of subsequent effects on aggregate demand. The Fed has stated that it expects to make two more 0.25 percentage point rises during 2019.
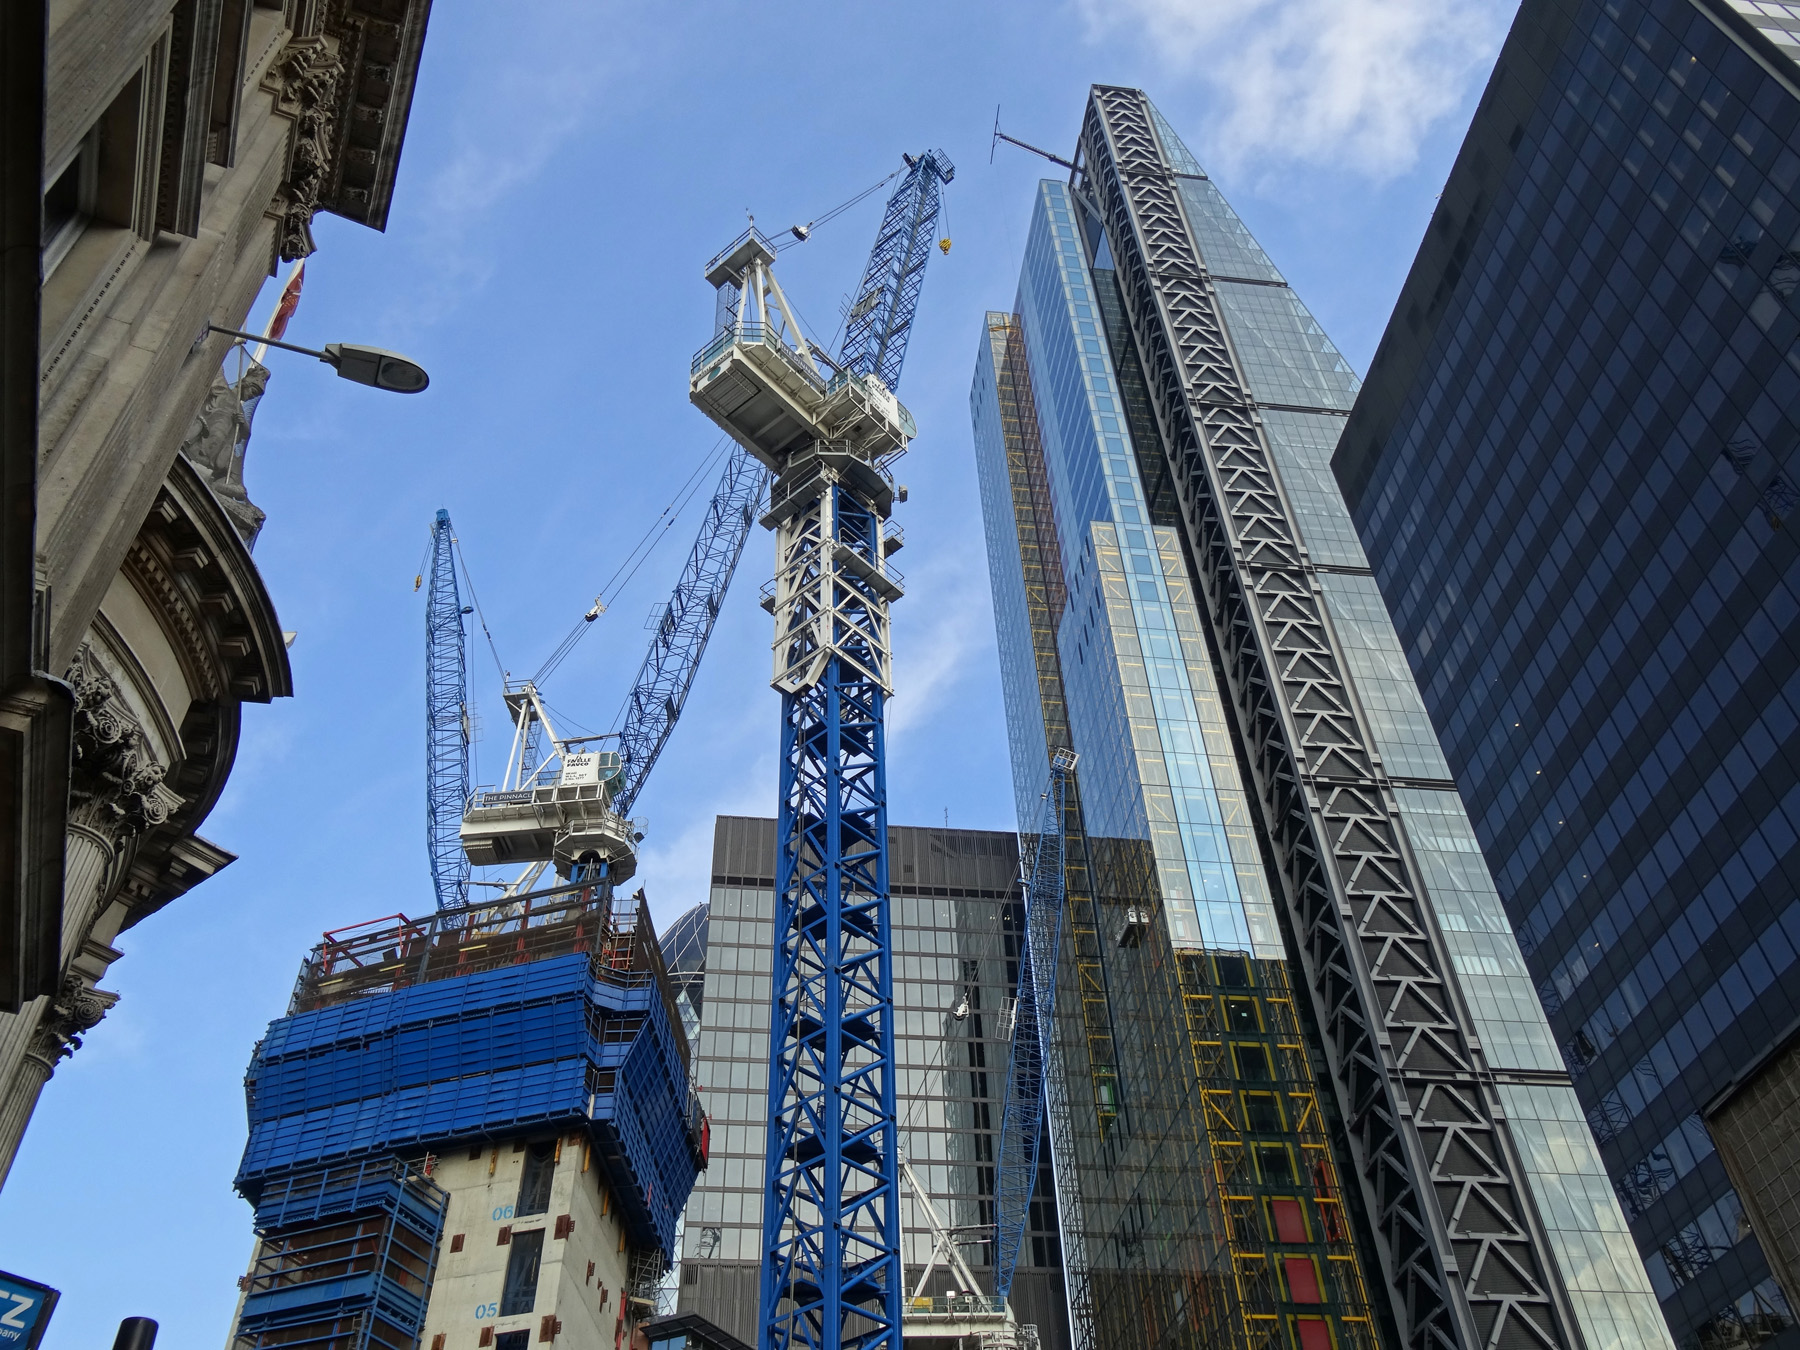 Surveys of consumer and business confidence. These are some of the most significant leading indicators as consumer confidence affects consumer spending and business confidence affects investment. According to the Duke CFO Global Business Outlook, an influential survey of Chief Financial Officers, ‘Nearly half (48.6 per cent) of US CFOs believe that the US will be in recession by the end of 2019, and 82 per cent believe that a recession will have begun by the end of 2020’. Such surveys can become self-fulfilling, as a reported decline in confidence can itself undermine confidence as both firms and consumers ‘catch’ the mood of pessimism.
Stock market volatility. When stock markets exhibit large falls and rises, this is often a symptom of uncertainty; and uncertainty can undermine investment. Stock market volatility can thus be a leading indicator of an impending recession. One indicator of such volatility is the VIX index. This is a measure of ’30-day expected volatility of the US stock market, derived from real-time, mid-quote prices of S&P 500® Index (SPXSM) call and put options. On a global basis, it is one of the most recognized measures of volatility – widely reported by financial media and closely followed by a variety of market participants as a daily market indicator.’ The higher the index, the greater the volatility. Since 2004, it has averaged 18.4; from 17 to 28 December 2018, it averaged 28.8. From 13 to 24 December, the DOW Jones Industrial Average share index fell by 11.4 per cent, only to rise by 6.2 per cent by 27 December. On 26 December, the S&P 500 index rallied 5 per cent, its best gain since March 2009.
Not all cases of market volatility, however, signify an impending recession, but high levels of volatility are one more sign of investor nervousness.
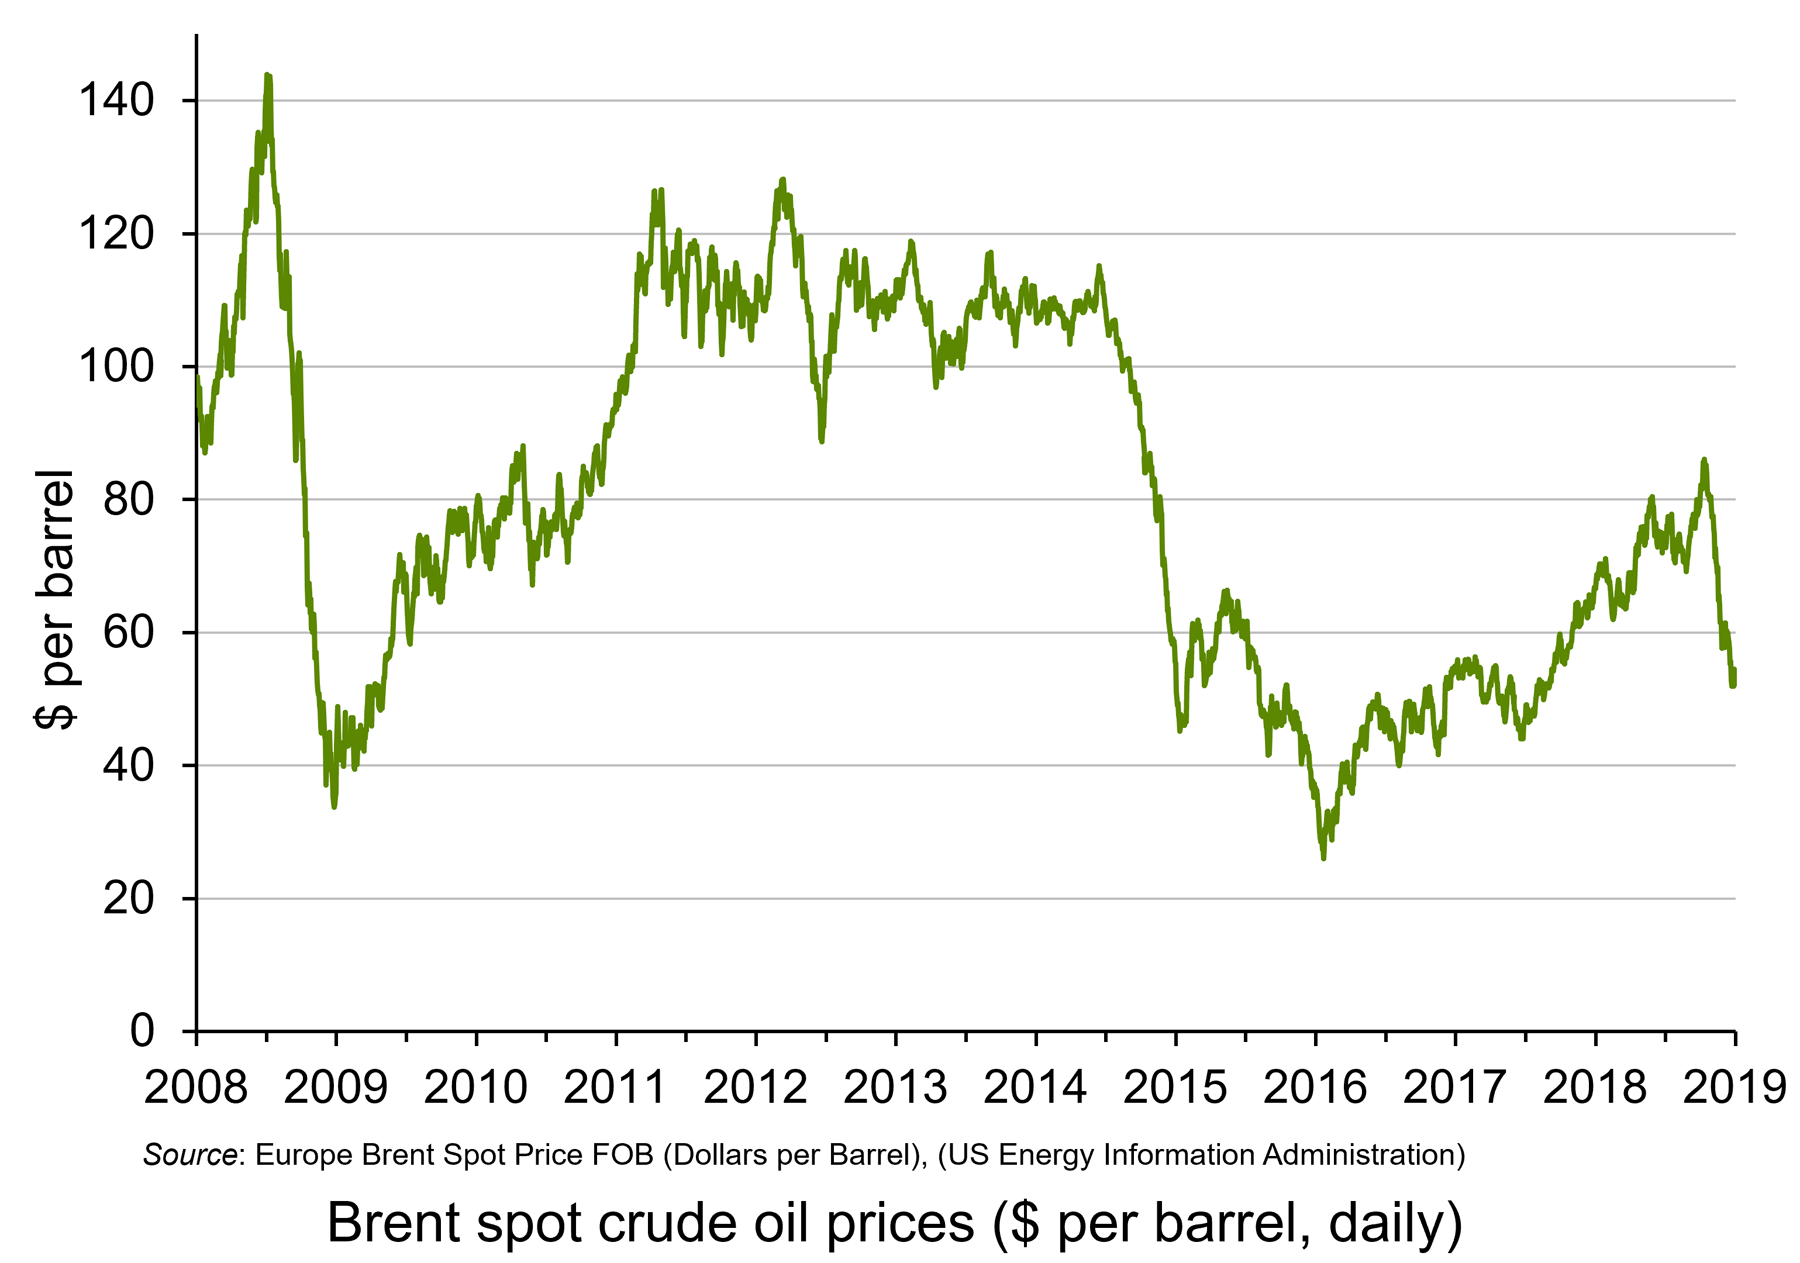 Oil prices. When oil prices fall, this can be explained by changes on the demand and/or supply side of the oil market. Oil prices have fallen significantly over the past two months. Until October 2018, oil prices had been rising, with Brent Crude reaching $86 per barrel by early October. By the end of the year the price had fallen to just over $50 per barrel – a fall of 41 per cent. (Click here for a PowerPoint file of the chart.) Part of the explanation is a rise in supply, with shale oil production increasing and also increased output from Russia and Saudi Arabia, despite a commitment by the two countries to reduce supply. But the main reason is a fall in demand. This reflects both a fall in current demand and in anticipated future demand, with fears of oversupply causing oil companies to run down stocks.
Falling oil prices resulting from falling demand are thus an indicator of lack of confidence in the growth of future demand – a leading indicator of a slowing economy.
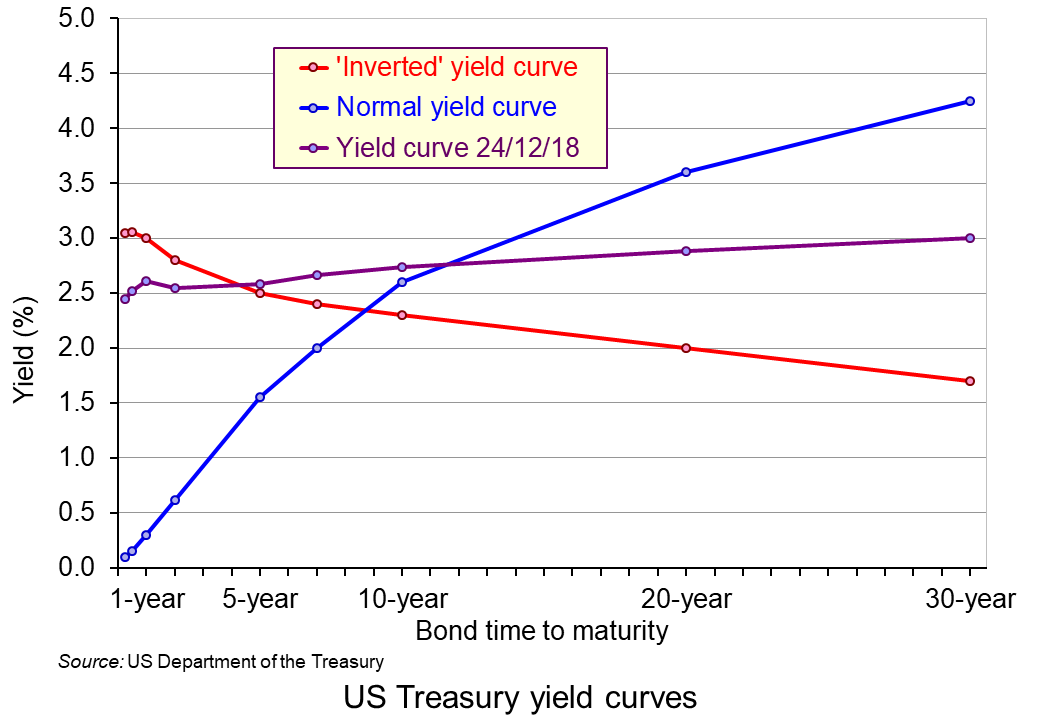 The yield curve. This depicts the yields on government debt with different lengths to maturity at a given point in time. Generally, the curve slopes upwards, showing higher rates of return on bonds with longer to maturity. This is illustrated by the blue line in the chart. (Click here for a PowerPoint file of the chart.) This is as you would expect, with people requiring a higher rate of return on long-term lending, where there is normally greater uncertainty. But, as the Bloomberg article, ‘Don’t take your eyes off the yield curve‘ states:
Occasionally, the curve flips, with yields on short-term debt exceeding those on longer bonds. That’s normally a sign investors believe economic growth will slow and interest rates will eventually fall. Research by the Federal Reserve Bank of San Francisco has shown that an inversion has preceded every US recession for the past 60 years.
The US economy is 37 quarters into what may prove to be its longest expansion on record. Analysts surveyed by Bloomberg expect gross domestic product growth to come in at 2.9 percent this year, up from 2.2 percent last year. Wages are rising as unfilled vacancies hover near all-time highs.
With times this good, the biggest betting game on Wall Street is when they’ll go bad. Barclays Plc, Goldman Sachs Group Inc., and other banks are predicting inversion will happen sometime in 2019. The conventional wisdom: Afterward it’s only a matter of time – anywhere from 6 to 24 months – before a recession starts.
As you can see from the chart, the yield curve on 24 December 2018 was still slightly upward sloping (expect between 6-month and 1-year bonds) – but possibly ready to ‘flip’.
However, despite the power of an ‘inverted’ yield in predicting previous recessions, it may be less reliable now. The Fed, as we saw above, has already signalled that it expects to increase short-term rates in 2019, probably at least twice. That alone could make the yield curve flatter or even downward sloping. Nevertheless, it is still generally thought that a downward sloping yield curve would signal belief in a likely slowdown, if not outright recession.
So, is the USA heading for recession?
The trouble with indicators is that they suggest what is likely – not what will definitely happen. Governments and central banks are powerful agents. If they believed that a recession was likely, then fiscal and monetary policy could be adjusted. For example, the Fed could halt its interest rate rises and quantitative tightening, or even reverse them. Also, worries about protectionism may subside if the USA strikes new trade deals with various countries, as it did with Canada and Mexico in USMCA.
Articles
- A jarring new survey shows CEOs think a recession could strike as soon as year-end 2019
Business Insider, Joe Ciolli (17/12/18)
- 4 Recession Indicators to Watch Now
Barron’s, Campbell Harvey (20/12/18)
- 9 Reasons the US Will Have a Recession Next Year
24/7 Wall St, Douglas A. McIntyre (26/12/18)
- The global economy is living dangerously – but don’t expect superpowers to follow the 2008 script
Independent, Ben Chu (3/1/19)
- Could a recession be just around the corner?
The Conversation, Amitrajeet A Batabyal (6/12/18)
- The US is on the edge of the economic precipice – Trump may push it over
The Guardian, Robert Reich (23/12/18)
- US prepares to hit the wall as reckless Trump undoes years of hard work
The Guardian, (Business Leader) (23/12/18)
- The first signs of the next recession
New Statesman, Helen Thompson (23/11/18)
- Is a Recession Coming? CFOs Predict 2019 Recession, Majority Expect Pre-2020 Market Crash
Newsweek, Benjamin Fearnow (12/12/18)
- Trade slowdown coming at worst time for world economy, markets
Reuters, Jamie McGeever (19/12/18)
- How to spot the next recession
The Week, Jeff Spross (27/11/18)
- What Is a Recession, and Why Are People Talking About the Next One?
New York Times, Niraj Chokshi (17/12/180
- For the American Economy, Storm Clouds on the Horizon
New York Times, Binyamin Appelbaum (28/11/18)
- Don’t Take Your Eyes Off the Yield Curve
Bloomberg Businessweek, Liz McCormick and Jeanna Smialek (16/11/18)
- What to expect from 2019’s ‘post-peak’ economy
CNN, Larry Hatheway (19/12/18)
- Worried about the next recession? Here’s what to watch instead of the yield curve
Quartz, Gwynn Guilford (17/12/18)
- Leading Economic Indicators and How to Use Them
The Balance, Kimberly Amadeo (10/9/18)
Surveys and Data
Questions
- Define the term ‘recession’.
- Are periods of above-trend expansion necessarily followed by a recession?
- Give some examples of leading indicators other than those given above and discuss their likely reliability in predicting a recession.
- Find out what has been happening to confidence levels in the EU over the past 12 months. Does this provide evidence of an impending recession in the EU?
- For what reasons may there be lags between a change in an indicator and a change in the variables for which it is an indicator?
- Why has the shape of the yield curve previously been a good predictor of the future course of the economy? Is it likely to be at present?
- What is the relationship between interest rates, government bond prices (‘Treasuries’ in the USA) and the yield on such bonds?
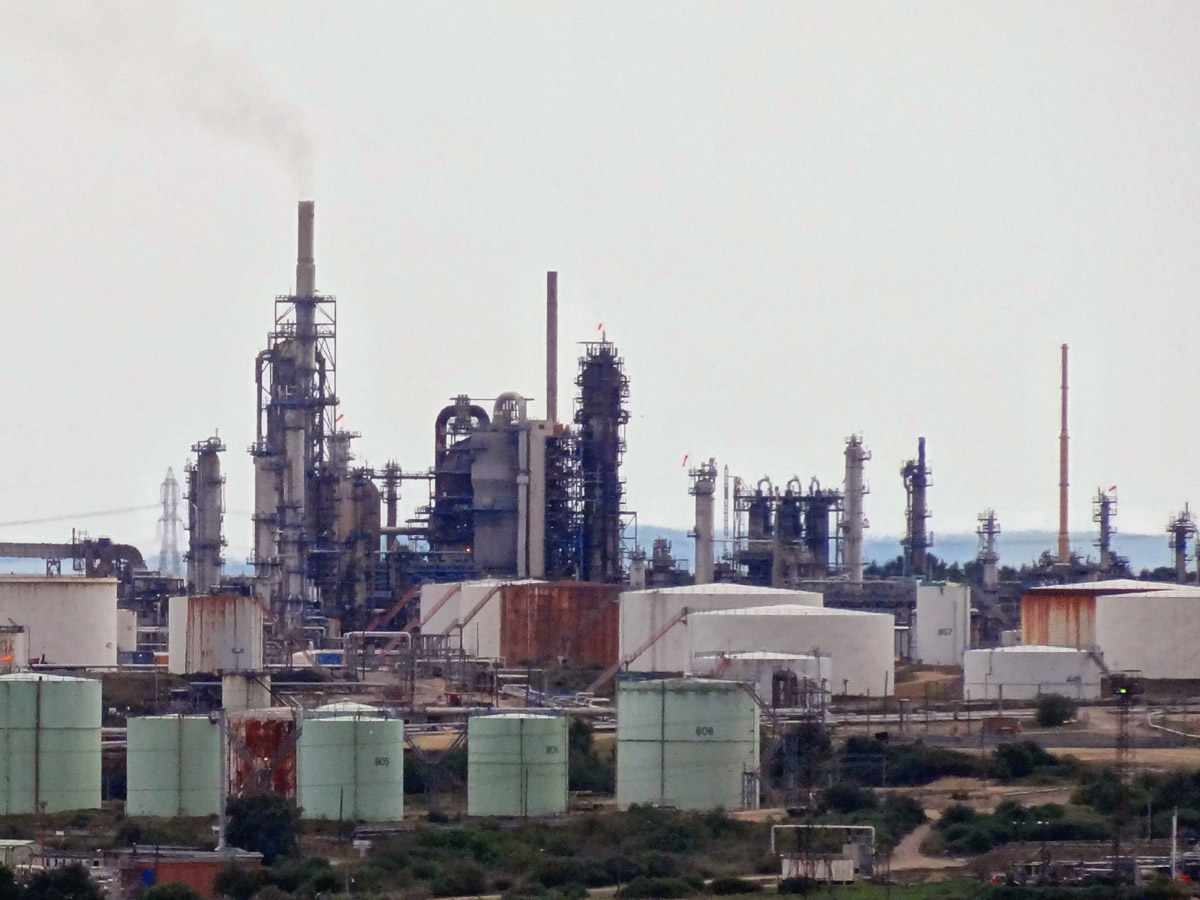 Oil prices have been rising in recent weeks. With Brent crude currently at around $85 per barrel, some commentators are predicting the price could reach $100. At the beginning of the year, the price was $67 per barrel; in June last year it was $44. In January 2016, it reached a low of $26. But what has caused the price to increase?
On the demand side, the world economy has been growing relatively strongly. Over the past three years, global growth has averaged 3.5%. This has helped to offset the effects of more energy efficient technologies and the gradual shift away from oil to alternative sources of energy.
On the supply side, there have been growing constraints.
The predicted resurgence of shale oil production, after falls in both output and investment when oil prices were low in 2016, has failed to materialise as much as expected. The reason is that pipeline capacity is limited and there is very little 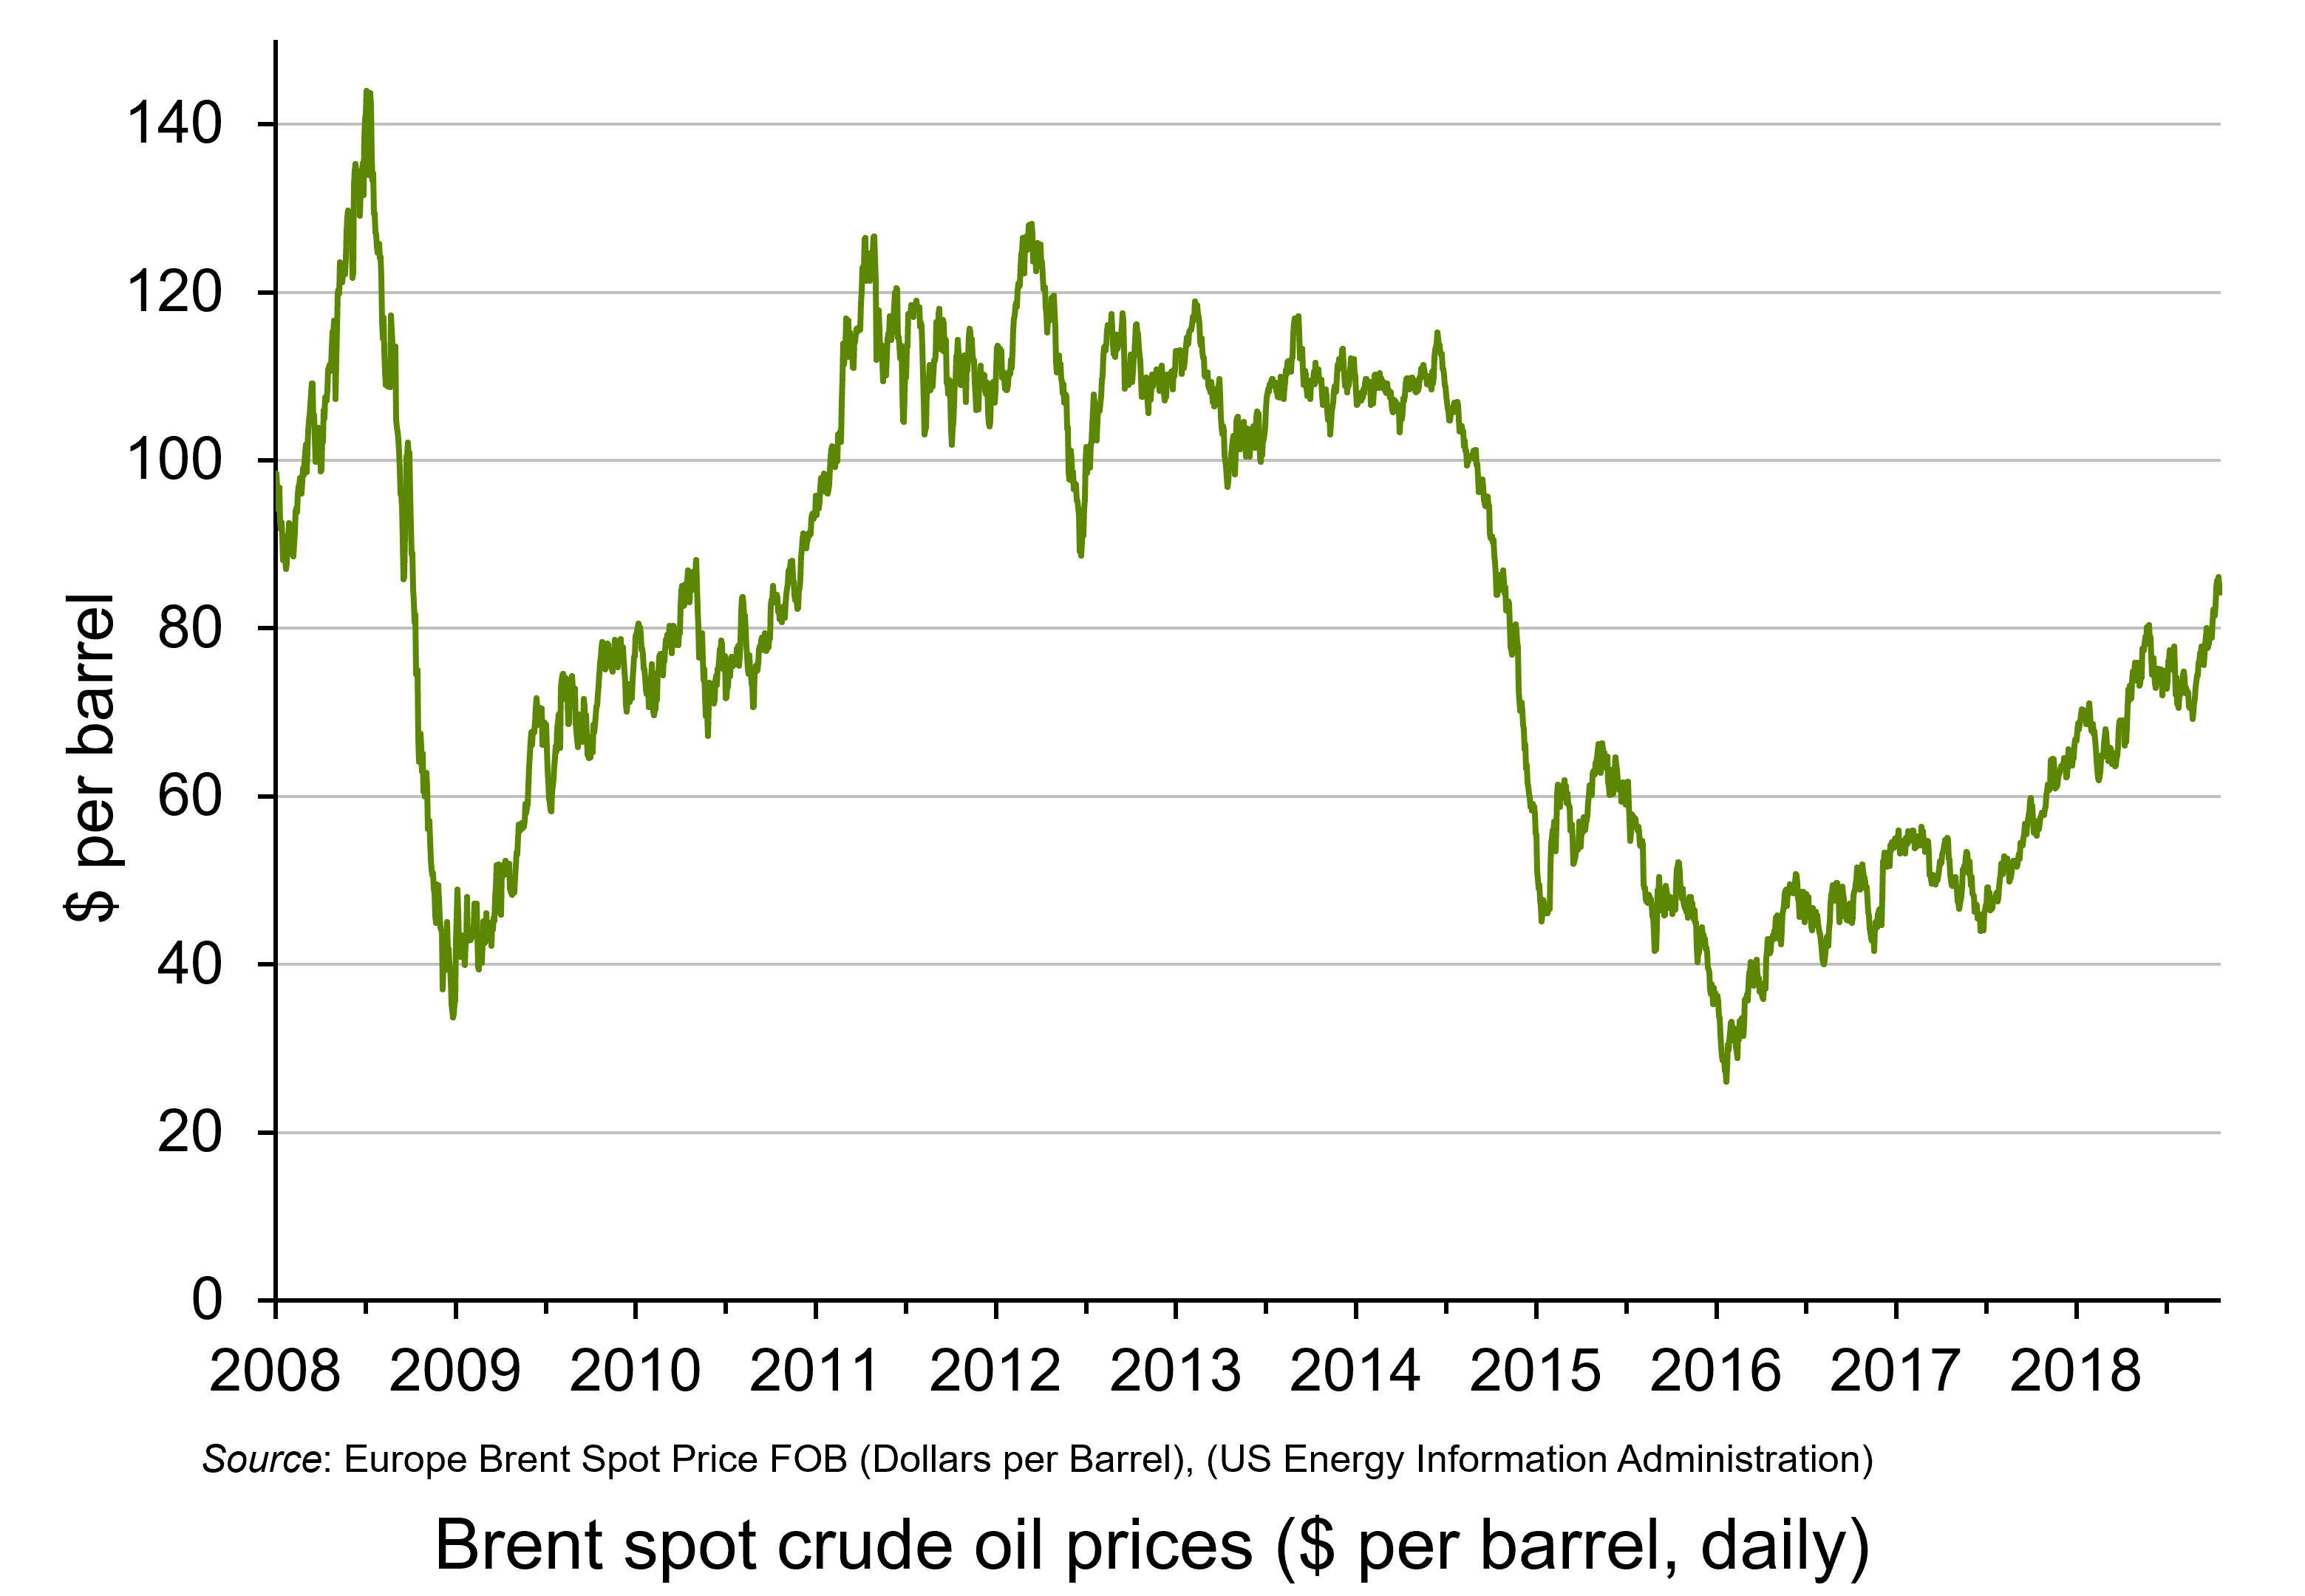 scope for transporting more oil from the major US producing area – the Permian basin in West Texas and SE New Mexico. There are similar pipeline capacity constraints from Canadian shale fields. The problem is compounded by shortages of labour and various inputs.
But perhaps the most serious supply-side issue is the renewed sanctions on Iranian oil exports imposed by the Trump administration, due to come into force on 4 November. The USA is also putting pressure on other countries not to buy Iranian oil. Iran is the world’s third largest oil exporter.
Also, there has been continuing turmoil in the Venezuelan economy, where inflation is currently around 500 000 per cent and is expected to reach 1 million per cent by the end of the year. Consequently, the country’s oil output is down. Production has fallen by more than a third since 2016. Venezuela was the world’s third largest oil producer.
Winners and losers from high oil prices
The main gainers from high oil prices are the oil producing countries, such as Russia and Saudi Arabia. It will also encourage investment in oil exploration and new oil wells, and could help countries, such as Colombia, with potential that is considered underexploited. However, given that the main problem is a lack of supply, rather than a surge in demand, the gains will be more limited for those countries, such as the USA and Canada, suffering from supply constraints. Clearly there will be no gain for Iran.
 In terms of losers, higher oil prices are likely to dampen global growth. If the oil price reaches $100 per barrel, global growth could be around 0.2 percentage points lower than had previously been forecast. In its latest World Economic Outlook, published on 8 October, the IMF has already downgraded its forecast growth for 2018 and 2019 to 3.7% from the 3.9% it forecast six months ago – and this forecast is based on the assumption that oil prices will be $69.38 a barrel in 2018 and $68.76 a barrel in 2019.
Clearly, the negative effect will be greater, the larger a country’s imports are as a percentage of its GDP. Countries that are particularly vulnerable to higher oil prices are the eurozone, Japan, China, India and most other Asian economies. Lower growth in these countries could have significant knock-on effects on other countries.
Consumers in advanced oil-importing countries would face higher fuel costs, accounting for an additional 0.3 per cent of household spending. Inflation could rise by as much as 1 percentage point.
The size of the effects depends on just how much oil prices rise and for how long. This depends on various demand- and supply-side factors, not least of which in the short term is speculation. Crucially, global political events, and especially US policies, will be the major driving factor in what happens.
Articles
Data
Questions
- Draw a supply and demand diagram to illustrate what has been happening to oil prices in the past few weeks and what is likely to happen in the coming weeks.
- What is the significance of the price elasticity of demand and supply in determining the size of oil price increase?
- What determines (a) the price elasticity of demand for oil; (b) the income elasticity of demand for oil; (c) the price elasticity of supply of oil?
- Why might oil prices overshoot the equilibrium price that reflects changed demand and supply conditions?
- Use demand and supply diagrams to illustrate (a) the destabilising effects that speculation could have on oil prices; (b) a stabilising effect.
- What industries might gain from higher oil prices and why?
- What would OPEC’s best policy be in the current circumstances? Explain.
OPEC, for some time, was struggling to control oil prices. Faced with competition from the fracking of shale oil in the USA, from oil sands in Canada and from deep water and conventional production by non-OPEC producers, its market power had diminished. OPEC now accounts for only around 40% of world oil production. How could a ‘cartel’ operate under such conditions?
One solution was attempted in 2014 and 2015. Faced with plunging oil prices which resulted largely from the huge increase in the supply of shale oil, OPEC refused to cut its output and even increased it slightly. The aim was to keep prices low and to drive down investment in alternative sources, especially in shale oil wells, many of which would not be profitable in the long term at such prices.
In late 2016, OPEC changed tack. It introduced its first cut in production since 2008. In September it introduced a new quota for its members that would cut OPEC production by 1.2 million barrels per day. At the time, Brent crude oil price was around $46 per barrel.
In December 2016, it also negotiated an agreement with non-OPEC producers, and most significantly Russia, that they would also cut production, giving a total cut of 1.8 million barrels per day. This amounted to around 2% of global production. In March 2017, it was agreed to extend the cuts for the rest of the year and in November 2017 it was agreed to extend them until the end of 2018.
With stronger global economic growth in 2017 and into 2018 resulting in a growth in demand for oil, and with OPEC and Russia cutting back production, oil prices rose rapidly again (see chart: click here for a PowerPoint). By January 2018, the Brent crude price had risen to around $70 per barrel.
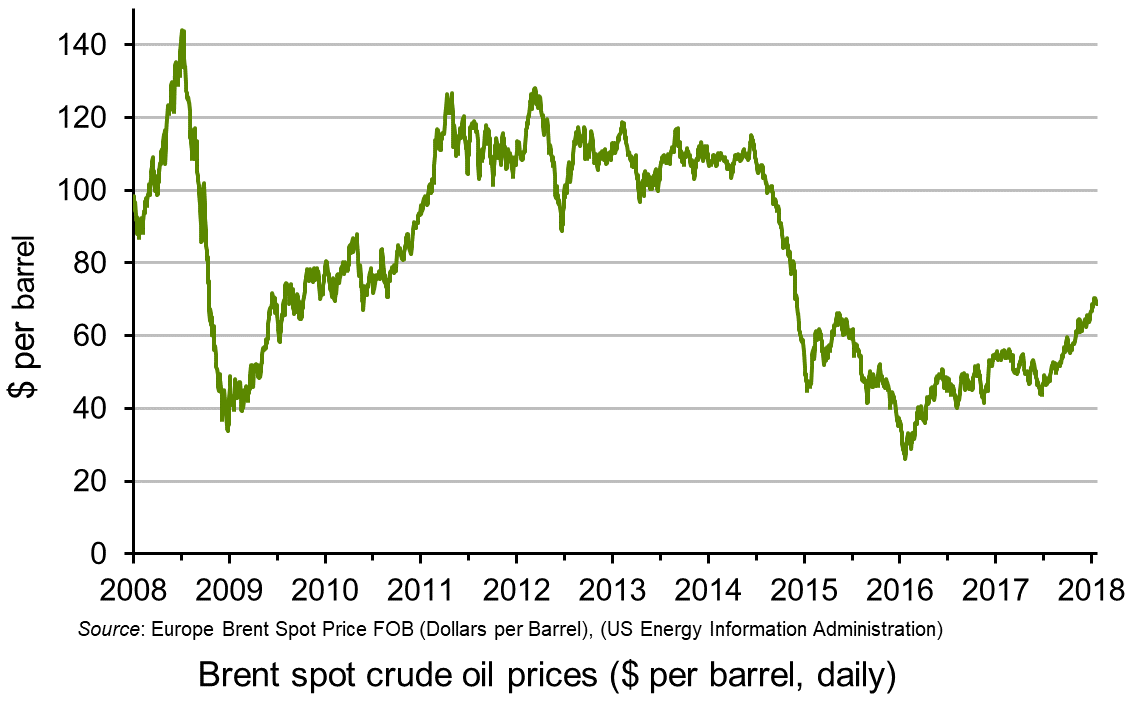
Low oil prices had had the effect of cutting investment in shale oil wells and other sources and reducing production from those existing ones which were now unprofitable. The question being asked today is to what extent oil production from the USA, Canada, the North Sea, etc. will increase now that oil is trading at around $70 per barrel – a price, if sustained, that would make investment in many shale and other sources profitable again, especially as costs of extracting shale oil is falling as fracking technology improves. US production since mid-2016 has already risen by 16% to nearly 10 million barrels per day. Costs are also falling for oil sand and deep water extraction.
In late January 2018, Saudi Arabia claimed that co-operation between oil producers to limit production would continue beyond 2018. Shale oil producers in the USA are likely to be cheered by this news – unless, that is, Saudi Arabia and the other OPEC and non-OPEC countries party to the agreement change their minds.
Videos
 OPEC’s Control of the Oil Market Is Running on Fumes Bloomberg (21/12/17)
Oil Reaches $70 a Barrel for First Time in Three Years Bloomberg, Stuart Wallace (11/1/18)
Banks Increasingly Think OPEC Will End Supply Cuts as Oil Hits $70 Bloomberg, Grant Smith (15/1/18)
Articles
Oil prices rise to hit four-year high of $70 a barrel BBC News (11/1/18)
Overshooting? Oil hits highest level in almost three years, with Brent nearing $70 Financial Times, Anjli Raval (10/1/18)
Can The Oil Price Rally Continue? OilPrice, Nick Cunningham (14/1/18)
Will This Cause An Oil Price Reversal? OilPrice, Olgu Okumus (22/1/18)
The world is not awash in oil yet
Arab News, Wael Mahdi (14/1/15)
‘Explosive’ U.S. oil output growth seen outpacing Saudis, Russia CBC News (19/1/18)
Oil’s Big Two seeking smooth exit from cuts The Business Times (23/1/18)
Saudi comments push oil prices higher BusinessDay, Henning Gloystein (22/1/18)
Report
Short-term Energy Outlook U.S. Energy Information Administration (EIA) (9/1/18)
Questions
- Using supply and demand diagrams, illustrate what has happened to oil prices and production over the past five years. What assumptions have you made about the price elasticity of supply and demand in your analysis?
- If the oil price is above the level at which it is profitable to invest in new shale oil wells, would it be in the long-term interests of shale oil companies to make such investments?
- Is the structure of the oil industry likely to result in long-term cycles in oil prices? Explain why or why not.
- Investigate the level of output from, and investment in, shale oil wells over the past three years. Explain what has happened.
- Would it be in the interests of US producers to make an agreement with OPEC on production quotas? What would prevent them from doing so?
- What is likely to happen to oil prices over the coming 12 months? What assumptions have you made and how have they affected your answer?
- If the short-term marginal costs of operating shale oil wells is relatively low (say, below $35 per barrel) but the long-term marginal cost (taking into account the costs of investing in new wells) is relatively high (say, over $65 per barrel) and if the life of a well is, say, 5 years, how is this likely to affect the pattern of prices and output over a ten-year period? What assumptions have you made and how do they affect your answer?
- If oil production from countries not party to the agreement between OPEC and non-OPEC members increases rapidly and if, as a result, oil prices start to fall again, what would it be in OPEC’s best interests to do?
 Oil prices are determined by demand and supply. Changes in oil prices are the result of shifts in demand and/or supply, with the size of the price change depending on the size of the shift and the price elasticity of demand and supply.
Some of the shifts are long term, with the price of oil varying from year to year or even moving in a particular direction for longer periods of time. Thus the opening up of new supplies, such as from fracking wells, can lead to a long-term fall in oil prices, while agreements by, say, OPEC to curb output can lead to a long-term rise in prices (see the blogs The oil see-saw, OPEC deal pushes up oil prices and An oil glut).
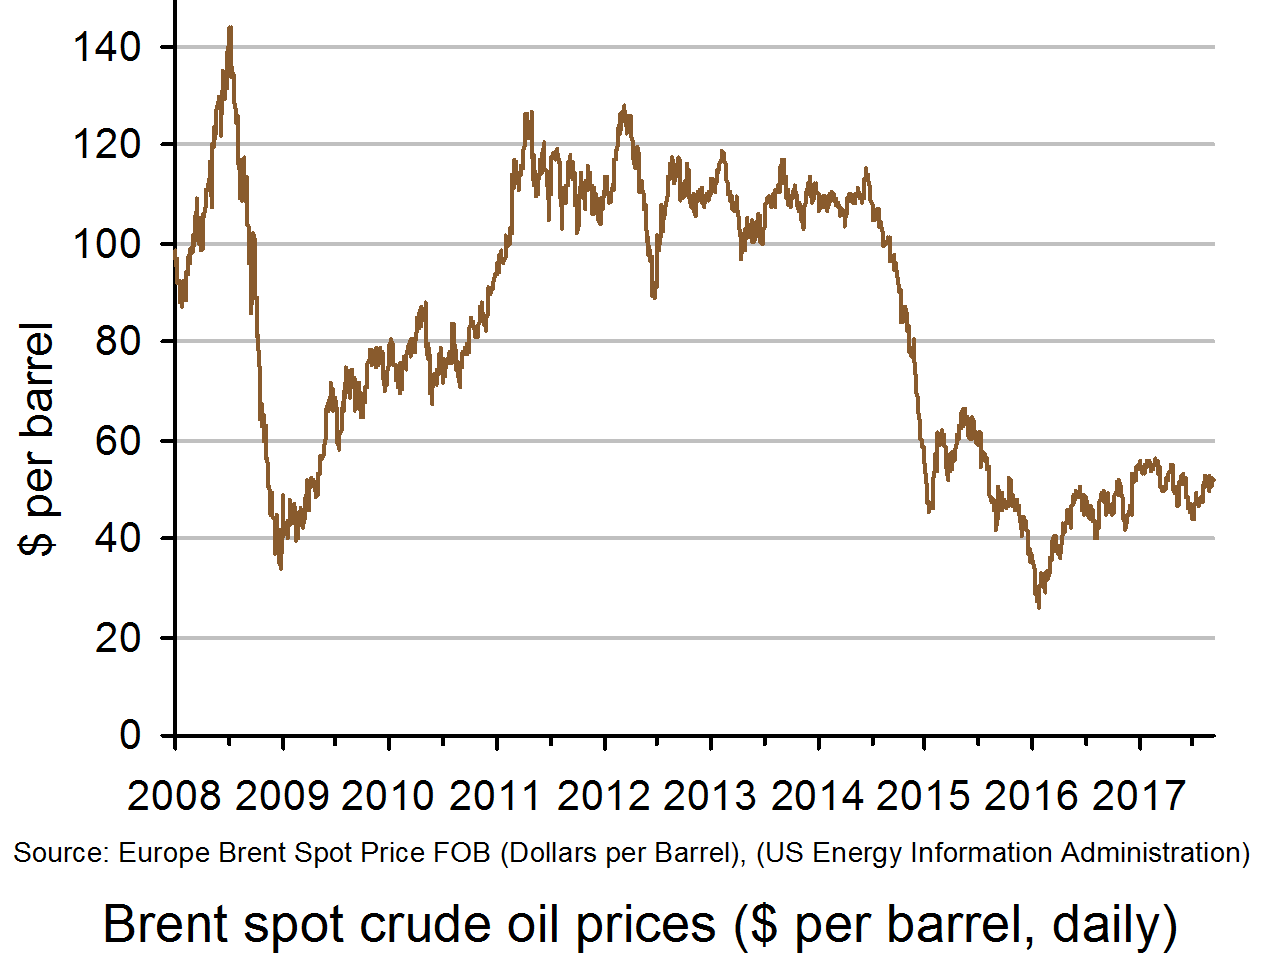
Medium and long-term price movements can also reflect medium and long-term changes in demand, such as a recession – oil prices fell dramatically as the world economy slid into recession in 2008/9 and then recovered as the global economy recovered.
Another long-term factor is the development of substitutes, such as renewable energy, which can reduce the demand for oil; another is developments that economise on power, such as more fuel-efficient vehicles and machines.
But oil prices do not just reflect these long-term movements in demand and supply. They also reflect daily and weekly movements as demand and supply respond to global and national events.
Two such events occurred at the end of August/beginning of September this year. The first was Hurricane Harvey. Even though it was downgraded to a tropical storm as it made landfall across the coast of the Gulf of Mexico, it dumped massive amounts of rain on southern Texas and Louisiana. This disrupted oil drilling and refining, shutting down a quarter of the entire US refining capacity. 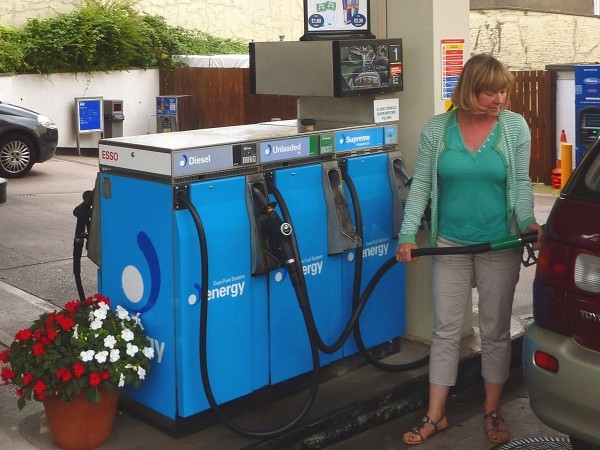 The initial effect was a surge in US oil prices in late August as oil production in much of Texas shut down and a rise in petrol prices as supplies from refineries fell.
Then prices fell back again in early September as production and refining resumed and as it became apparent that there had been less damage to oil infrastructure than initially feared. Also the USA tapped into some of its strategic oil reserves to make up for the shortfall in supply.
Then in early September, the North Koreans tested a hydrogen bomb – much larger than the previous atom bombs it had tested. This prompted fears of US retaliation and heightened tensions in the region. As the Reuters article states:
That put downward pressure on crude as traders moved money out of oil – seen as high-risk markets – into gold futures, traditionally viewed as a safe haven for investors. Spot gold prices rose for a third day, gaining 0.9 per cent on Monday
Quite large daily movements in oil prices are not uncommon as traders respond to such events. A major determinant of short-term demand is expectations, and nervousness about events can put substantial downward pressure on oil prices if it is felt that there could be a downward effect on the global economy – or substantial upward pressure if it is felt that supplies might be disrupted. Often markets over-correct, with prices moving back again as the situation becomes clearer and as nervousness subsides.
Articles
U.S. crude edges higher, gasoline tumbles after Harvey Reuters, Libby George (4/9/17)
Global oil prices fall after North Korea nuclear weapon test Independent, Henning Gloystein (4/9/17)
Brent crude oil falls after North Korea nuclear test The Indian Express (4/9/17)
Oil prices remain volatile AzerNews, Sara Israfilbayova (4/7/17)
Questions
- What are the determinants of the price elasticity of demand for oil?
- Search news articles to find some other examples of short-term movements in oil prices as markets responded to some political or natural event.
- Why do markets often over-correct?
- Explain the long-term oil price movements over the past 10 years.
- Why is gold seen as a ‘safe haven’?
- If refineries buy oil from oil producers, what would determine the net effect on oil prices of a decline in oil production and a decline in demand for oil by the refineries?
- What role does speculation play in determining oil prices? Explain how such speculation could (a) reduce price volatility; (b) increase price volatility. Under what circumstances is (b) more likely than (a)?
 In the blog OPEC deal pushes up oil prices John discussed the agreement made by OPEC members to reduce total oil output from the start of 2017, with Saudi Arabia making the biggest cut in output. The amount of oil being provided is a key determinant of the oil price and this agreement to reduce oil output contributed to rising prices. However, now oil prices have begun to fall (see chart below) with Saudi Arabia in particular recording an increase in output but all OPEC nations noting that global crude stocks had risen.
Supply and demand are key here and over the past few years, it has been a problem of excess supply that has led to low prices. OPEC nations have been aiming to achieve greater stability in global oil markets. Given the excess supply, it has been output of oil that the cartel member have been trying to cut. That was the point of the agreement that came into effect from the start of 2017. However, even with the recent increase in production Saudi Arabia notes that its output is still in line with its output target. The 10 percent fall in crude prices over such a short period of time has led to renewed concerns that pledges to reduce production will not be met. However Saudi Arabia’s energy ministry stated:
“Saudi Arabia assures the market that it is committed and determined to stabilising the global oil market by working closely with all other participating Opec and non-Opec producers.”
There were already concerns about the oil market relating to a potential increase in US shale oil output. Oil producers include OPEC and non-OPEC members and so while the cartel has agreed to cut production, it has little control over production from non-cartel members. 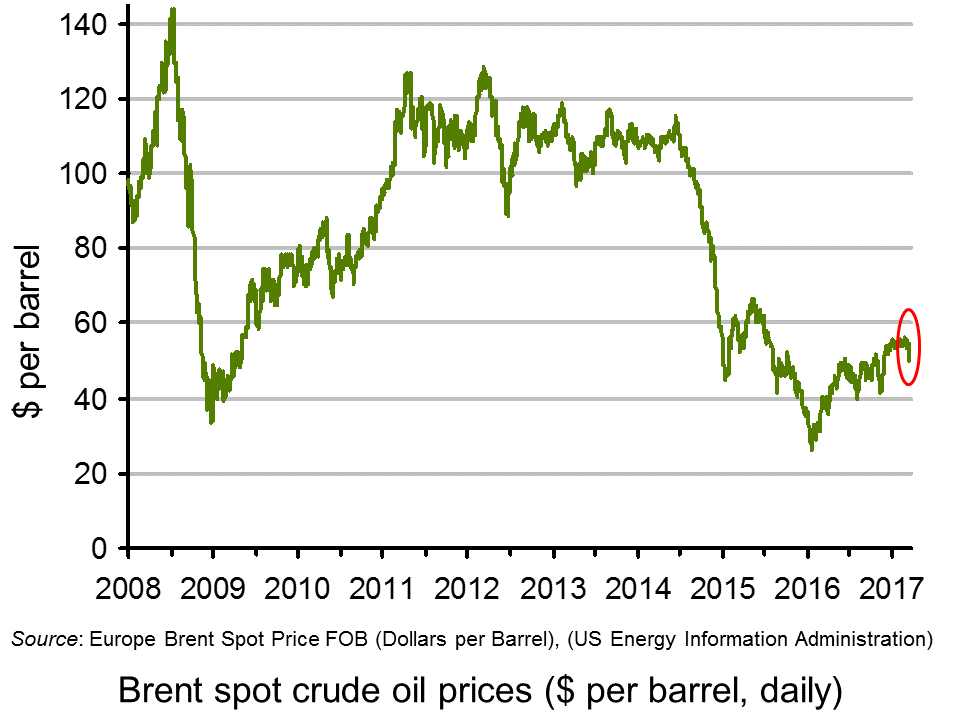 This was one of the main factors that contributed to the oil price lows that we previously saw. OPEC’s forecast for oil production from non-OPEC member has been raised for 2017 and overall production from all oil producing nations looks set to increase for the year, despite OPEC curbing output by 1.2 million barrels per day. However, despite the 10% drop, the price of crude oil ($50) still remains well above its low of $28 in January 2016.
Oil prices are one of the key factors that affect inflation and with UK inflation expected to rise, this fall in oil prices may provide a small and temporary pause in the rise in the rate of inflation. There are many inter-related factors that affect oil prices and it really is a supply and demand market. If US shale oil production continues to rise, then total oil output will rise too and this will push down prices. If OPEC members undertake further production curbs, then this will push supply back down. Then we have demand to consider! Watch this space.
Report
OPEC Monthly Oil Market Report OPEC (14/3/17)
Articles
Saudis stand by commitment to oil production cuts Financial Times, Anjli Raval and David Sheppard (15/3/17)
Oil prices fall after Opec stocks rise BBC News (14/3/17)
Crude oil price slumps to new three-month low after OPEC supply warning Independent, Alex Lawler (14/3/17)
Opinion: Saudi Arabis has a big motivating interest in keeping oil prices high MarketWatch, Thomas H Kee Jr. (14/3/17)
Why oil prices may come under even more pressure next month Investor’s Business Daily, Gillian Rich (13/3/17)
Oil price crashes back towards $50 as Opec raises US oil forecasts The Telegraph, Jillian Ambrose (14/3/17)
Data and Information
Brent Crude Prices Daily US Energy Information Administration
OPEC Homepage Organisation of the Petroleum Exporting Countries
Questions
- What are the demand and supply-side factors that affect oil prices? Do you think demand and supply are relatively elastic or inelastic? Explain your answer.
- Use a demand and supply diagram to illustrate how OPEC production curbs will affect oil prices.
- If we now take into account US shale production rising, how will this affect oil prices?
- Why have OPEC members agreed to curb oil production? Is it a rational decision?
- What are the key points from the oil market report?
- How do oil prices affect a country’s rate of inflation?
- What, do you think, are oil prices likely to be at the end of the year? What about in ten years? Explain your answer.
- Should the USA continue to invest in new shale oil production?