 With businesses increasing their use of AI, this is likely to have significant effects on employment. But how will this affect the distribution of income, both within countries and between countries?
In some ways, AI is likely to increase inequality within countries as it displaces low-skilled workers and enhances the productivity of higher-skilled workers. In other ways, it could reduce inequality by allowing lower-skilled workers to increase their productivity, while displacing some higher-skilled workers and managers through the increased adoption of automated processes.
The effect of AI on the distribution of income between countries will depend crucially on its accessibility. If it is widely available to low-income countries, it could significantly enhance the productivity of small businesses and workers in such countries and help to reduce the income gap with the richer world. If the gains in such countries, however, are largely experienced by multinational companies, whether in mines and plantations, or in labour-intensive industries, such as garment production, few of the gains may accrue to workers and global inequality may increase.
Redistribution within a country
 The deployment of AI may result in labour displacement. AI is likely to replace both manual and white-collar jobs that involve straightforward and repetitive tasks. These include: routine clerical work, such as data entry, filing and scheduling; paralegal work, contract drafting and legal research; consulting, business research and market analysis; accounting and bookkeeping; financial trading; proofreading, copy mark-up and translation; graphic design; machine operation; warehouse work, where AI-enabled warehouse robots do many receiving, sorting, stacking, retrieval, carrying and loading tasks (e.g. Amazon’s Sequoia robotic system); basic coding or document sifting; market research and advertising design; call-centre work, such as enquiry handling, sales, telemarketing and customer service; hospitality reception; sales cashiers in supermarkets and stores; analysis of health data and diagnosis. Such jobs can all be performed by AI assistants, AI assisted robots or chat bots.
Women are likely to be disproportionately affected because they perform a higher share of the administrative and service roles most exposed to AI.
Workers displaced by AI may find that they can find employment only in lower-paid jobs. Examples include direct customer-facing roles, such as bar staff, shop assistants, hairdressers and nail and beauty consultants.
Such job displacement by AI is likely to redistribute income from relatively low-skilled labour to capital: a redistribution from wages to profits. This will tend to lead to greater inequality.
AI is also likely to lead to a redistribution of income towards certain types of high-skilled labour that are difficult to replace with AI but which could be enhanced by it. Take the case of skilled traders, such as plumbers, electricians and carpenters. They might be able to use AI in their work to enhance their productivity, through diagnosis, planning, problem-solving, measurement, etc. but the AI would not displace them. Instead, it could increase their incomes by allowing them to do their work more efficiently or effectively and thus increase their output per hour and enhance their hourly reward. Another example is architecture, where AI can automate repetitive tasks and open up new design possibilities, allowing architects to focus on creativity, flexibility, aesthetics, empathy with clients and ethical decision-making.
An important distinction is between disembodied and embodied AI investment. Disembodied AI investment could include AI ‘assistants’, such as ChatGPT and other software that can be used in existing jobs to enhance productivity. Such investment can usually be rolled out relatively quickly. Although the extra productivity may allow some reduction in the number of workers, disembodied AI investment is likely to be less disruptive than embodied AI investment. The latter includes robotics and automation, where workers are replaced by machines. This would require more investment and may be slower to be adopted.
Then there are jobs that will be created by AI. These include prompt engineers, who develop questions and prompt techniques to optimise AI output; health tech experts, who help organisations implement new medical AI products; AI educators, who train people in the uses of AI in the workplace; ethics advisors, who help companies ensure that their uses of AI are aligned with their values, responsibilities and goals; and cybersecurity experts who put systems in place to prevent AI stealing sensitive information. Such jobs may be relatively highly paid.
 In other cases, the gains from AI in employment are likely to accrue mainly to the consumer, with probably little change in the incomes of the workers themselves. This is particularly the case in parts of the public sector where wages/salaries are only very loosely related to productivity and where a large part of the work involves providing a personal service. For example, health professionals’ productivity could be enhanced by AI, which could allow faster and more accurate diagnosis, more efficient monitoring and greater accuracy in surgery. The main gainers would be the patients, with probably little change in the incomes of the health professionals themselves. Teachers’ productivity could be improved by allowing more rapid and efficient marking, preparation of materials and record keeping, allowing more time to be spent with students. Again, the main gainers would be the students, with little change in teachers’ incomes. Other jobs in this category include social workers, therapists, solicitors and barristers, HR specialists, senior managers and musicians.
Thus there is likely to be a distribution away from lower-skilled workers to both capital and higher-skilled workers who can use AI, to people who work in new jobs created by AI and to the consumers of certain services.
AI will accelerate productivity growth and, with it, GDP growth, but will probably displace workers faster than new roles emerge. This is likely to increase inequality and be a major challenge for society. Can the labour market adapt? Could the effects be modified if people moved to a four- or three-day week? Will governments introduce statutory limits to weekly working hours? Will training and education adapt to the new demands of employers?
Redistribution between countries
 AI threatens to widen the global rich–poor divide. It will give wealthier nations a productivity and innovation edge, which could displace low-skilled jobs in low-income nations. Labour-intensive production could be replaced by automated production, with the capital owned by the multinational companies of just a few countries, such as the USA and China, which between them account for 40% of global corporate AI R&D spending. For some companies, it would make sense to relocate production to rich countries, or certain wealthier developing countries, with better digital infrastructure, advanced data systems and more reliable power supply.
For other companies, however, production might still be based in low-income countries to take advantage of low-cost local materials. But there would still be a redistribution from wages in such countries to the profits of multinationals.
But it is not just in manufacturing where low-income countries are vulnerable to the integration of AI. Several countries, such as India, the Philippines, Mexico and Egypt have seen considerable investment in call centres and IT services for business process outsourcing and customer services. AI now poses a threat to employment in this industry as it has the potential to replace large numbers of workers.
AI-related job losses could exacerbate unemployment and deepen poverty in poorer countries, which, with limited resources, limited training and underdeveloped social protection systems, are less equipped to absorb economic and social shocks. This will further widen the global divide. In the case of embodied AI investment, it may only be possible in low-income countries through multinational investment and could displace many traditional jobs, with much of the benefit going in additional multinational profit.
But it is not all bad news for low-income countries. AI-driven innovations in healthcare, education, and agriculture, if adopted in poor countries, can make a significant contribution to raising living standards and can slow, or even reverse, the widening gap between rich and poor nations. Some of the greatest potential is in small-scale agriculture. Smallholders can boost crop yields though precision farming powered by AI; AI tools can help farmers buy seeds, fertilisers and animals and sell their produce at optimum times and prices; AI-enabled education tools can help farmers learn new techniques.
Articles
- New Skills and AI Are Reshaping the Future of Work
IMF Blog, Kristalina Georgieva (14/1/26)
- Generative AI: degenerative for jobs?
Bank Underground, Bank of England blog, Edward Egan (22/1/26)
- Artificial intelligence (AI) and employment
UK Parliament Research Briefing Lydia Harriss and Sam Money-Kyrle (23/12/25)
- Is Your Job AI-Proof? What to Know About AI Taking Over Jobs
Built In, Matthew Urwin (27/8/25)
- AI likely to displace jobs, says Bank of England governor
BBC News, Michael Race (19/12/25)
- These Jobs Will Fall First as AI Takes Over the Workplace
Forbes, Jack Kelly (30/4/25)
- Disrupted or displaced? How AI is shaking up jobs
exec-appointments.com, Anjli Raval (9/7/25)
- Navigate the economic risks and challenges of generative AI
EY-Parthenon, Lydia Boussour (25/6/24)
- AI Isn’t Increasing Inequality; It’s Revealing the Gaps We Haven’t Wanted to See
HR News, Mark Abbott (18/12/25)
- AI promises efficiency, but it’s also amplifying labour inequality
The Conversation, Mehnaz Rafi (3/12/25)
- 10 Jobs AI Will Replace in 2025
Live Career, Marta Bongilaj (29/12/25)
- From steam to Silicon: Why inequality persists
Aik News HD (Pakistan), Ahmed Fawad Farooq (27/12/25)
- Rethinking AI’s role in income inequality
PwC: The Leadership Agenda (4/9/25)
- How Europe Can Capture the AI Growth Dividend
IMF Blog, Florian Misch, Ben Park, Carlo Pizzinelli and Galen Sher (20/11/25)
- The Next Great Divergence
UNDP: Asia and the Pacific (2/12/25)
- AI risks sparking a new era of divergence as development gaps between countries widen, UNDP report finds
UNDP Press Release (2/12/25)
- AI threatens to widen inequality among states: UN
Aljazeera (2/12/25)
- AI risks deepening inequality, says head of world’s largest SWF
Financial Times, James Fontanella-Khan and Sun Yu (23/11/25)
- Three Reasons Why AI May Widen Global Inequality
Center for Global Development, Philip Schellekens and David Skilling (17/10/24)
- AI Will Transform the Global Economy. Let’s Make Sure It Benefits Humanity
IMF Blog, Kristalina Georgieva (14/1/24)
- AI’s $4.8 trillion future: UN Trade and Development alerts on divides, urges action
UNCTAD Press Release (7/4/25)
- AI could affect 40% of jobs and widen inequality between nations, UN warns
CNBC, Dylan Butts (4/4/25)
Questions
- What types of job are most vulnerable to AI?
- How will AI change the comparative advantage of low-income countries and what effect will it be likely to have on the pattern of global trade?
- Assess alternative policies that governments in high-income countries can adopt to offset the growth in inequality caused by the increasing use of AI.
- What policies can governments in low-income countries or aid agencies adopt to offset the growth in inequality within low-income countries and between high- and low-income countries?
- How might the growth of AI affect your own approach to career development?
- Is AI likely to increase or decrease economic power? Explain.
Large European banks call for further integration, but is it in consumers’ interests?
 Those of a certain age may remember the fanfare which heralded the introduction of the Single European market (SEM) on 1 January 1993. It promised the removal of internal barriers to the movement of goods, services, capital and people. One sector that was noticeably absent from the single market, however, was banking.
Moves towards banking union only started after the global financial crisis in 2008. However, as a report published on the 2 September 2025 by the Association of Financial Markets in Europe (AFME) highlights, the institutional frameworks of banking in the EU are still deeply fragmented – the promised integration through the European Banking Union (EBU) is still incomplete. This has put European banks at a competitive disadvantage in global markets compared with rivals from the USA and Asia, thereby reducing their profitability and growth prospects. The report called on the European Central Bank (ECB) and national regulatory authorities to remove hurdles to cross-border banking services in the EU. This would enhance the strategic position of European banks.
In this blog we will trace the development of the EBU and analyse the current state of integration. We discuss the AFME proposals for achieving greater integration and highlight their benefits for large banks. We also analyse the barriers which limit full integration and examine the risks that retail customers might see few benefits from the proposed changes.
What is meant by European Banking Union (EBU)?
The 1993 Single European Market (SEM) in goods and services removed internal barriers to the movement of goods, services, capital and people within the EU. As part of this, there were harmonised standards and regulations for goods and services, no capital controls, mutual recognition of professional qualifications and common regulations on consumer protection, product safety, environmental protection and labour rights.
This integration of previously restricted domestic markets was designed to boost economic growth, employment and competitiveness by increasing trade and investment flows. Offering consumers greater choice would expose firms to greater competition. This would drive down prices and encourage greater efficiency and innovation. It has generally achieved these goals across many industries.
However, banking was excluded from integration. The 1985 White Paper, Completing the Internal Market, proposed the liberalisation of financial services, but banking remained regulated at the national level. This was influenced by interrelated economic, political and institutional forces, national sovereignty and political sensitivities, fragmented regulation and concerns about risk.
 Even as the EU moved towards economic and monetary union (EMU) during the 1990s, there was no discussion of integration for the banking industry. However, that changed following the 2008 financial crisis and 2011 eurozone crisis. Both episodes exposed vulnerabilities in the EU banking system which required taxpayer support. It was proposed that deeper integration of the banking sector would ensure its stability and resilience. This stimulated moves towards European Banking Union (EBU), starting with the European Council agreeing its creation in 2012. There are three institutional pillars to the Union:
- The Single Supervisory Mechanism (2014) for systemically important financial institutions (SIFIs) ensures consistent oversight. SIFIs are banks with over €30 billion of liabilities or 20% of national GDP.
- The Single Resolution Mechanism (2016) manages the orderly resolution of failing banks with minimal costs to taxpayers. There is a central board for resolution decisions and a fund financed by the banking industry to support resolution actions.
- A European Deposit Insurance Scheme (still under negotiation) is proposed to protect depositors uniformly across the banking union against bank default.
The Union is intended to operate under a harmonised set of EU laws, known as the ‘Single Rulebook’, which includes implementing the BASEL III capital requirements, regulating national deposit insurance and setting rules for managing failing banks.
What is the state of integration at present?
Moves towards European Banking Union (EBU) have contributed to enhancing the resilience of the European banking system. This was one of its major objectives. European banks are much more secure having increased capital and liquidity levels, reduced credit risks and become less reliant on state-aid. They are also less profitable.
The AFME report points to remaining gaps in Banking Union which raise the cost for banks offering cross-border retail banking within the EU and limit the incentive to do so. The report identifies four such gaps.
 1. Ring fencing. Although there is a single supervisory mechanism for large systemically important institutions, since the financial crisis national regulators have implemented ‘ring-fencing’. This aims to protect retail banking activities from riskier investment banking. Ring-fencing retains liquidity, dividends and other bank assets within national borders to protect their retail banking sectors from contagion. The ECB estimates €225 billion of capital and €250 billion of liquidity is trapped by such national restrictions. Further, unharmonized and unpredictable use of capital buffers adds complexity for capital management at a multinational level. This particularly impacts large institutions. Banks’ cross-border activities are impeded since they are restricted in the way they can use capital and liquidity across the bloc.
The report argues that the stringent requirements of the ECB and the multiple layers of macroprudential requirements imposed at national level have led to an unnecessarily high level of capital. This disadvantages large European banks compared to their international competitors.
2. Impediments to cross-border M&As in banking within the EU. This is due to cumbersome authorisation processes, involving multiple authorities at both national and supra-national level. Further, national authorities may interfere in the process of M&As in a bid to prevent domestic banks being acquired by ones from other parts of the EU. A recent example is UniCredit’s bid for Germany’s Commerzbank, which the German government opposes. These characteristics restrict opportunities for consolidation and efficiency gains for European banks.
The AFME report estimates that once eurozone banks grow beyond €450 billion in total assets, they suffer from negative synergies putting them at a competitive disadvantage to global competitors. Indeed, US banks are able to leverage scale economies from their domestic market to enter large EU markets. An example is JP Morgan’s entry into multiple EU markets through its Chase brand.
3. Contributions to the Single Resolution Fund (SRF) are complex and lack transparency. This makes it difficult for banks to predict future commitments. The fund itself and its target level were determined at a time when banks had low buffers. Since then, European banks have raised their loss absorbing capacity and the AFME report proposes that further increases in contributions to the fund need to be carefully considered and reviewed.
4. The Deposit Guarantee Scheme remains unimplemented and there are still differences in national schemes. This situation creates uncertainty for banks, which would like the European scheme for large systemically important institutions to be implemented fully.
These AFME proposals focus on the aspects of banking union which benefit large European institutions in their strategic competition with global rivals. These aspects would create ‘European’ banks as opposed to ‘national’ ones. This would give them the scale to be ‘champions’ in global competition. In particular, the large banks want lower capital requirements and the relaxation of national ring-fencing for retail banking to allow them greater freedom to achieve scale and scope economies across the bloc.
To what extent this will benefit retail customers, however, is debateable.
Will retail banking customers benefit?
Retail banking across Europe remains deeply fragmented, with significant price differentials from country to country. The following table illustrates pricing differentials for two retail products – loans and mortgages – across a sample of EU countries for July 2025.
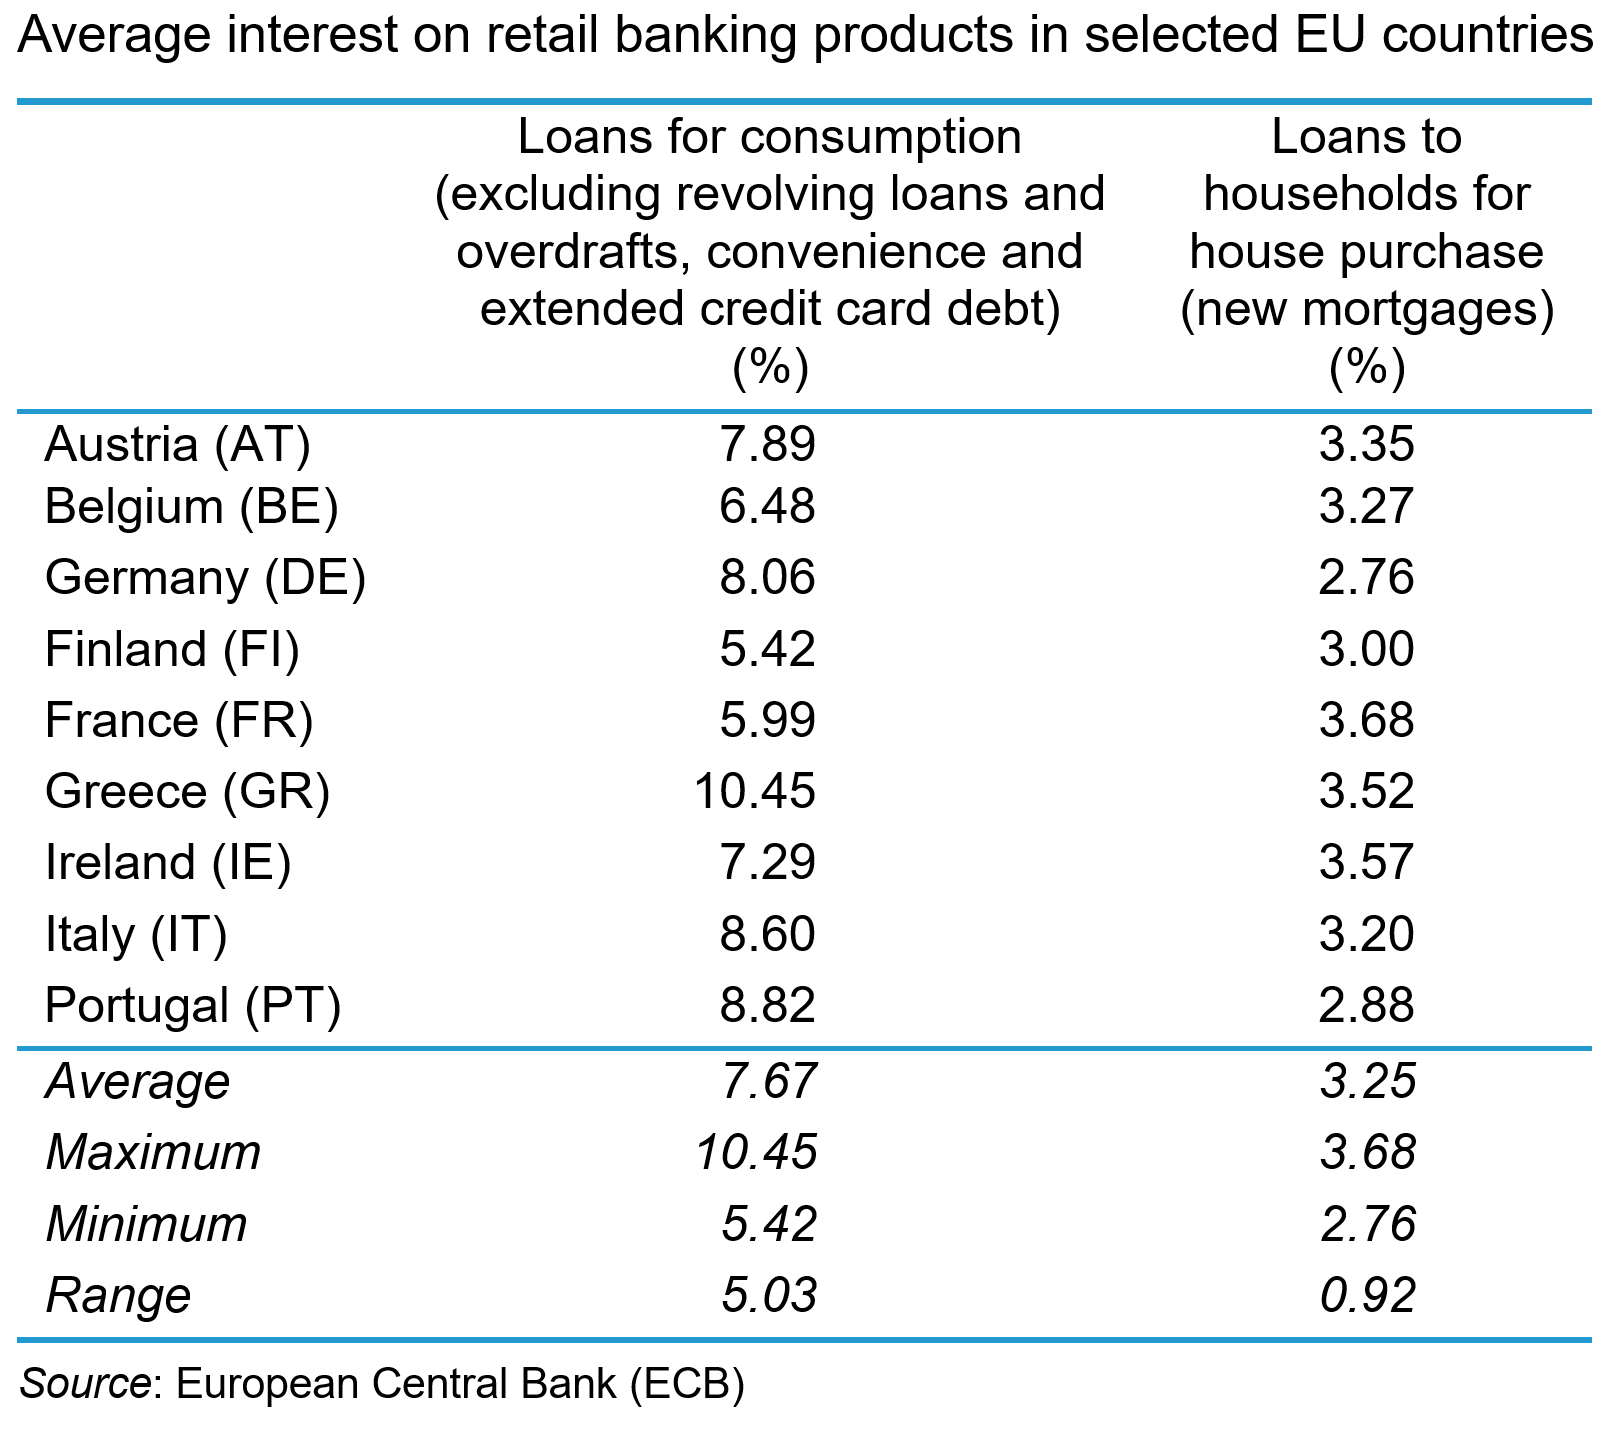
The data show a range of average interest rates offered across the countries with a range of 5.03% for loans to households and 0.92% for new mortgages. These price differentials reflect a broad array of factors, not least the different institutional legal and risk characteristics of the national markets. They also reflect varying degrees of competition and the lack of cross-border trade in retail banking products. Retail banking remains a largely domestic industry within the EU. Cross-border banking services remain a marginal activity with non-domestic retail deposits rising by just 0.5% and non-domestic retail loans rising by just 0.3% between 2016 and 2024.
There are both natural and policy-induced barriers, which means that retail banking will remain largely segmented by nation.
 On the demand-side, retail banking is largely a relational rather than a transactional service, with consumption taking place over a long time-period with significant financial risks attached. Even with deposit insurance and a lender of last resort (the central bank), consumers exhibit significant loss aversion in their use of retail banking services. Consequently, trust and confidence are important characteristics for consumers and that means they are likely to prefer to use familiar domestic institutions.
Further, perceptions about switching costs mean that consumers are reluctant to change suppliers. Such costs are exacerbated by language, cultural and legal differences between European countries, which can make the perceived costs of banking beyond national boundaries prohibitively expensive and create a preference for local institutions.
Consumer preferences can also create idiosyncratic market structures for retail banking services in particular countries. For instance, in several countries across the EU, notably Germany, mutualised credit unions account for significant shares of retail banking. This may limit the potential for foreign banks to penetrate Europe’s largest market.
There are also policy-induced obstacles to cross-border retail banking which operate on the demand-side. These include discriminatory tax treatment of foreign financial services which deters their purchase by consumers. Further, there are still eight different currencies used in the EU across the 27 member states (Denmark, Poland and Sweden are three significant examples). This creates costs and risks associated with currency exchange for consumers that may deter their use of cross-border deposits and loans. The full adoption of a single currency across the EU seems a long way off, which will limit the potential for a single banking market, particularly in the retail segment.
Retail banking as a public utility
 Some argue that retail banking is a public utility and should be regulated as such. It has a simple business model, taking deposits, making payments and making loans. Like other utilities, such as water and energy, retail banking is an essential service for the smooth functioning of the economy and society. Like other utilities, bank failures create severe problems for the economy and society.
Since the financial crisis, stability in retail banking has been much more highly valued. In the period preceding the crisis, banks had used retail deposits to cross-subsidise their risky investment banking. The bank failures that resulted from this had severe economic consequences. The danger today is that by relaxing capital and liquidity restrictions too much, large banks may once again engage in risky behaviour, subsidised by retail banking – for example, by engaging in cross-border M&As. These may benefit their shareholders but provide little benefit to retail customers.
Further, allowing these large banks freedom to move funds around the bloc may lead to capital being concentrated in the most profitable markets, leaving less profitable markets / countries underserved. Retail banking, as a public utility, should be required to provide services there.
Who ultimately benefits?
The integration of banking services in the EU has progressed since the financial crisis, producing a more resilient system. However, there are features of retail banking which mean that integration which benefits consumers may be difficult to achieve.
Addressing the policy gaps identified by the AFME report may benefit large European banks by facilitating the scale economies to make them competitive internationally. However, until consumers are prepared, or able, to source banking services beyond national borders, they will see little benefit from European Banking Union (EBU) through lower prices and/or better service. The nature of retail banking in the EU suggests that this is unlikely any time soon.
Furthermore, since retail banking exhibits features of a public utility, regulators need to be wary of permitting the type of behaviour by large institutions which creates dangerous systemic risk. The worry is that, in the drive to create ‘European Champions’ in banking, regulators ignore the potential impact on retail customers.
Articles
Book
Report
Data and Information
Questions
- Using an average cost (AC) schedule, illustrate the efficiency benefits for large European banks from banking union.
- Analyse the sources of efficiency gains that European banks can gain from cross-border M&As.
- Explain how European retail banking customers could gain from such efficiency.
- Analyse why they may not.
- Analyse whether retail banking in Europe needs to be regulated as a public utility.
 In a blog in October 2024, we looked at global uncertainty and how it can be captured in a World Uncertainty Index. The blog stated that ‘We continue to live through incredibly turbulent times. In the past decade or so we have experienced a global financial crisis, a global health emergency, seen the UK’s departure from the European Union, and witnessed increasing levels of geopolitical tension and conflict’.
Since then, Donald Trump has been elected for a second term and has introduced sweeping tariffs. What is more, the tariffs announced on so-called ‘Liberation Day‘ have not remained fixed, but have fluctuated with negotiations and threatened retaliation. The resulting uncertainty makes it very hard for businesses to plan and many have been unwilling to commit to investment decisions. The uncertainty has been compounded by geopolitical events, such as the continuing war in Ukraine, the war in Gaza and the June 13 Israeli attack on Iran.
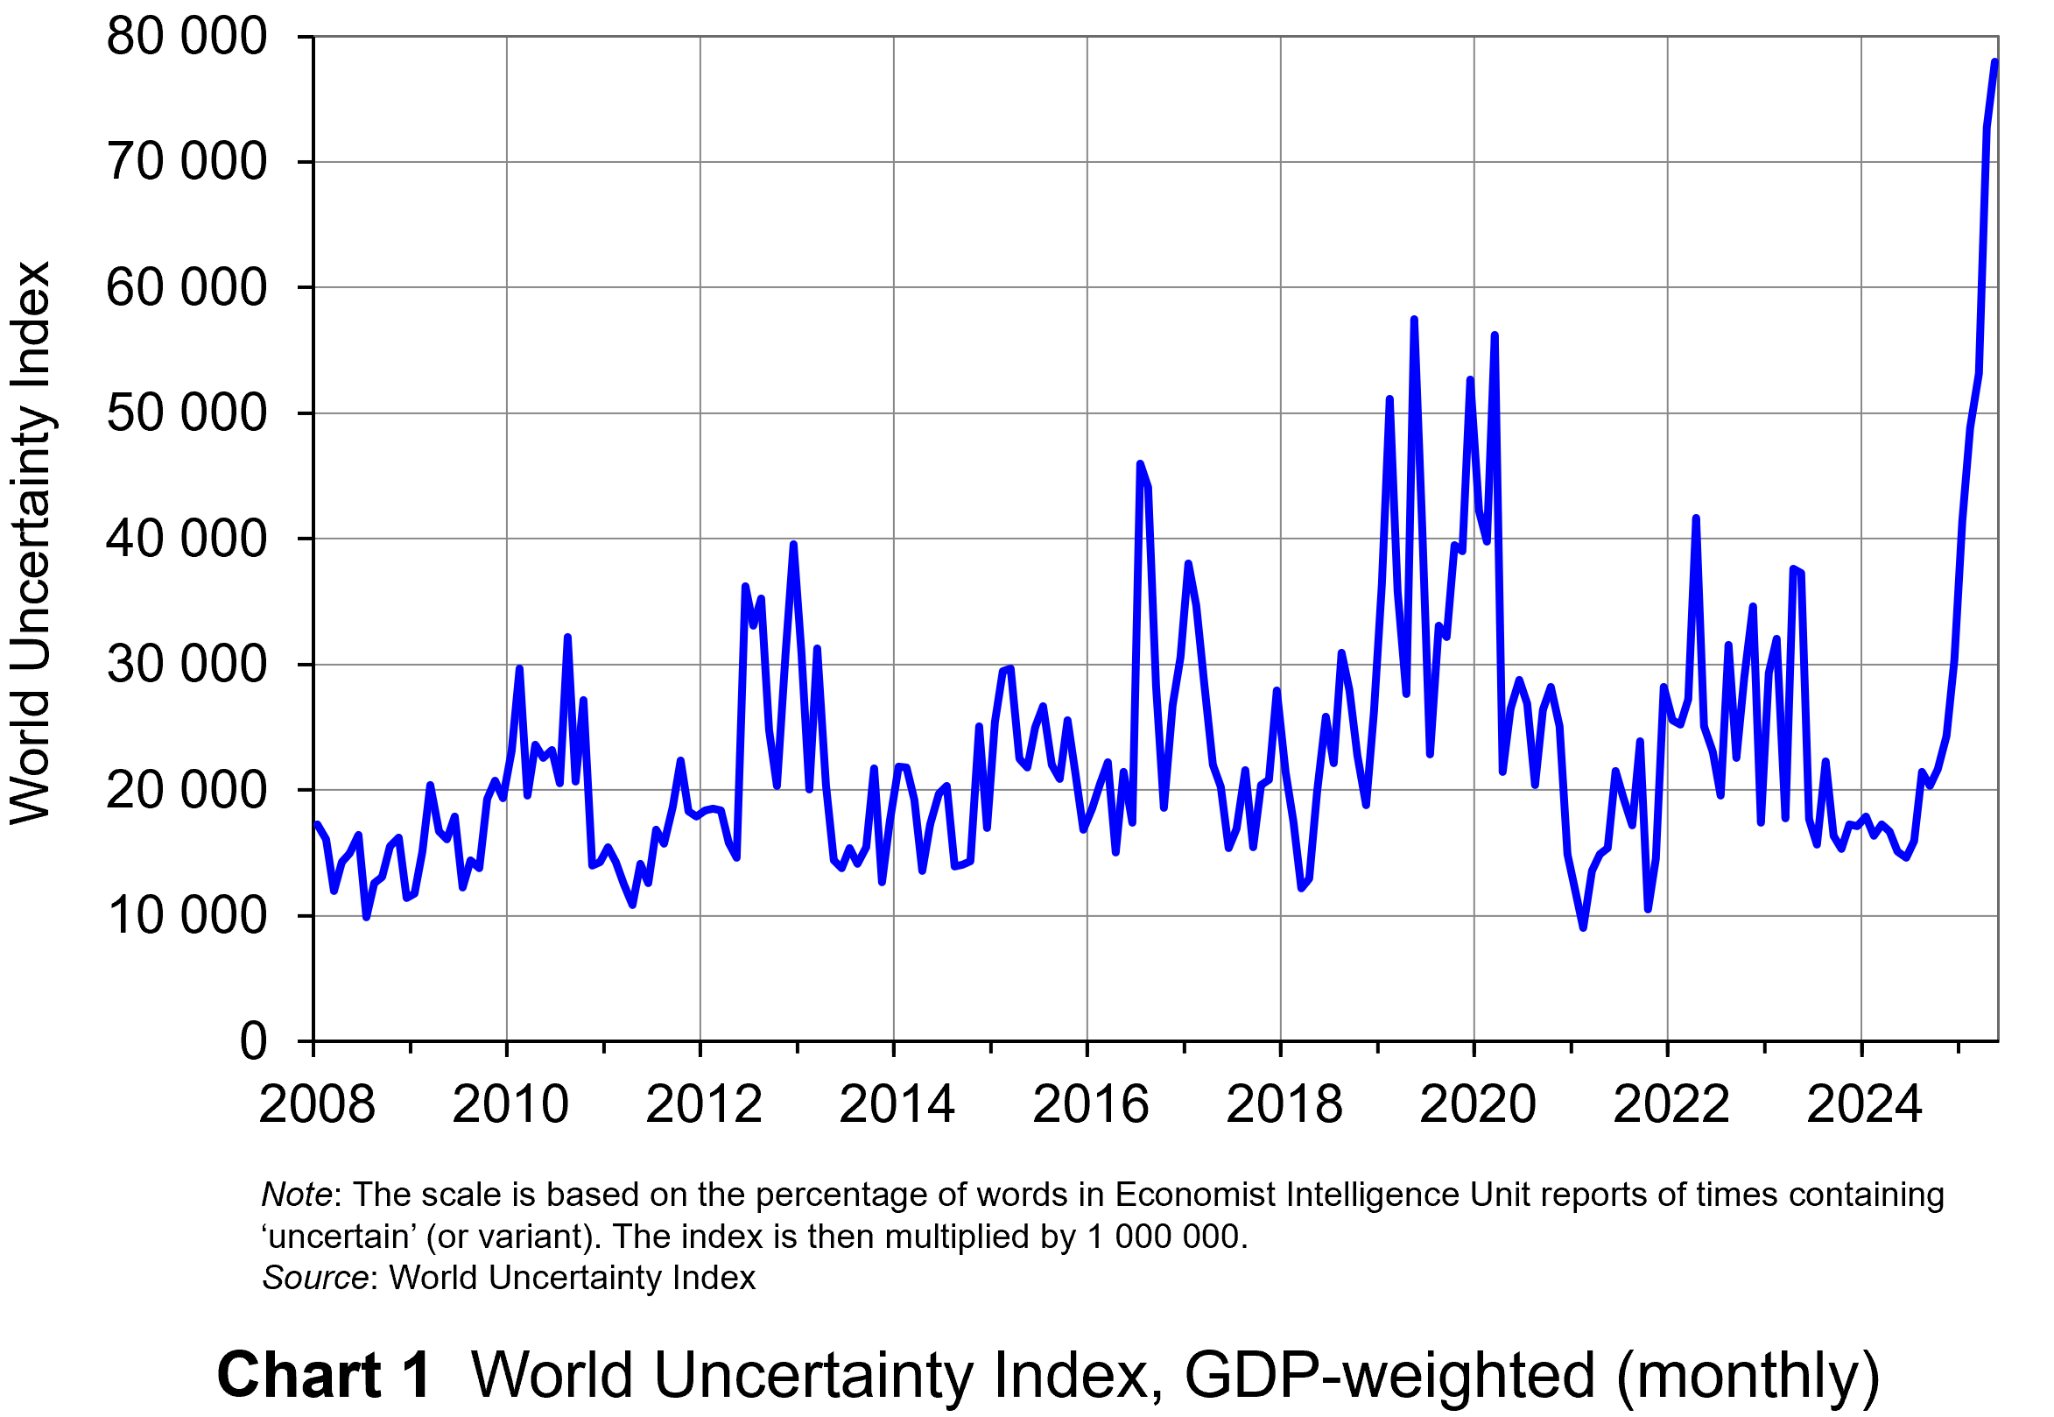 The World Uncertainty Index (WUI) tracks uncertainty around the world by applying a form of text mining known as ‘term frequency’ to the country reports produced by the Economist Intelligence Unit (EIU). The words searched for are ‘uncertain’, ‘uncertainty’ and ‘uncertainties’ and the number of times they occur as percentage of the total words is recorded. To produce the WUI this figure is then multiplied by 1m. A higher WUI number indicates a greater level of uncertainty.
The monthly global average WUI is shown in Chart 1 (click here for a PowerPoint). It is based on 71 countries. Since 2008 the WUI has averaged a little over 23 000: i.e. 2.3 per cent of the text in EIU reports contains the word ‘uncertainty’ or a close variant. In May 2025, it was almost 79 000 – the highest since the index was first complied in 2008. The previous highest was in March 2020, at the start of the COVID-19 outbreak, when the index rose to just over 56 000.
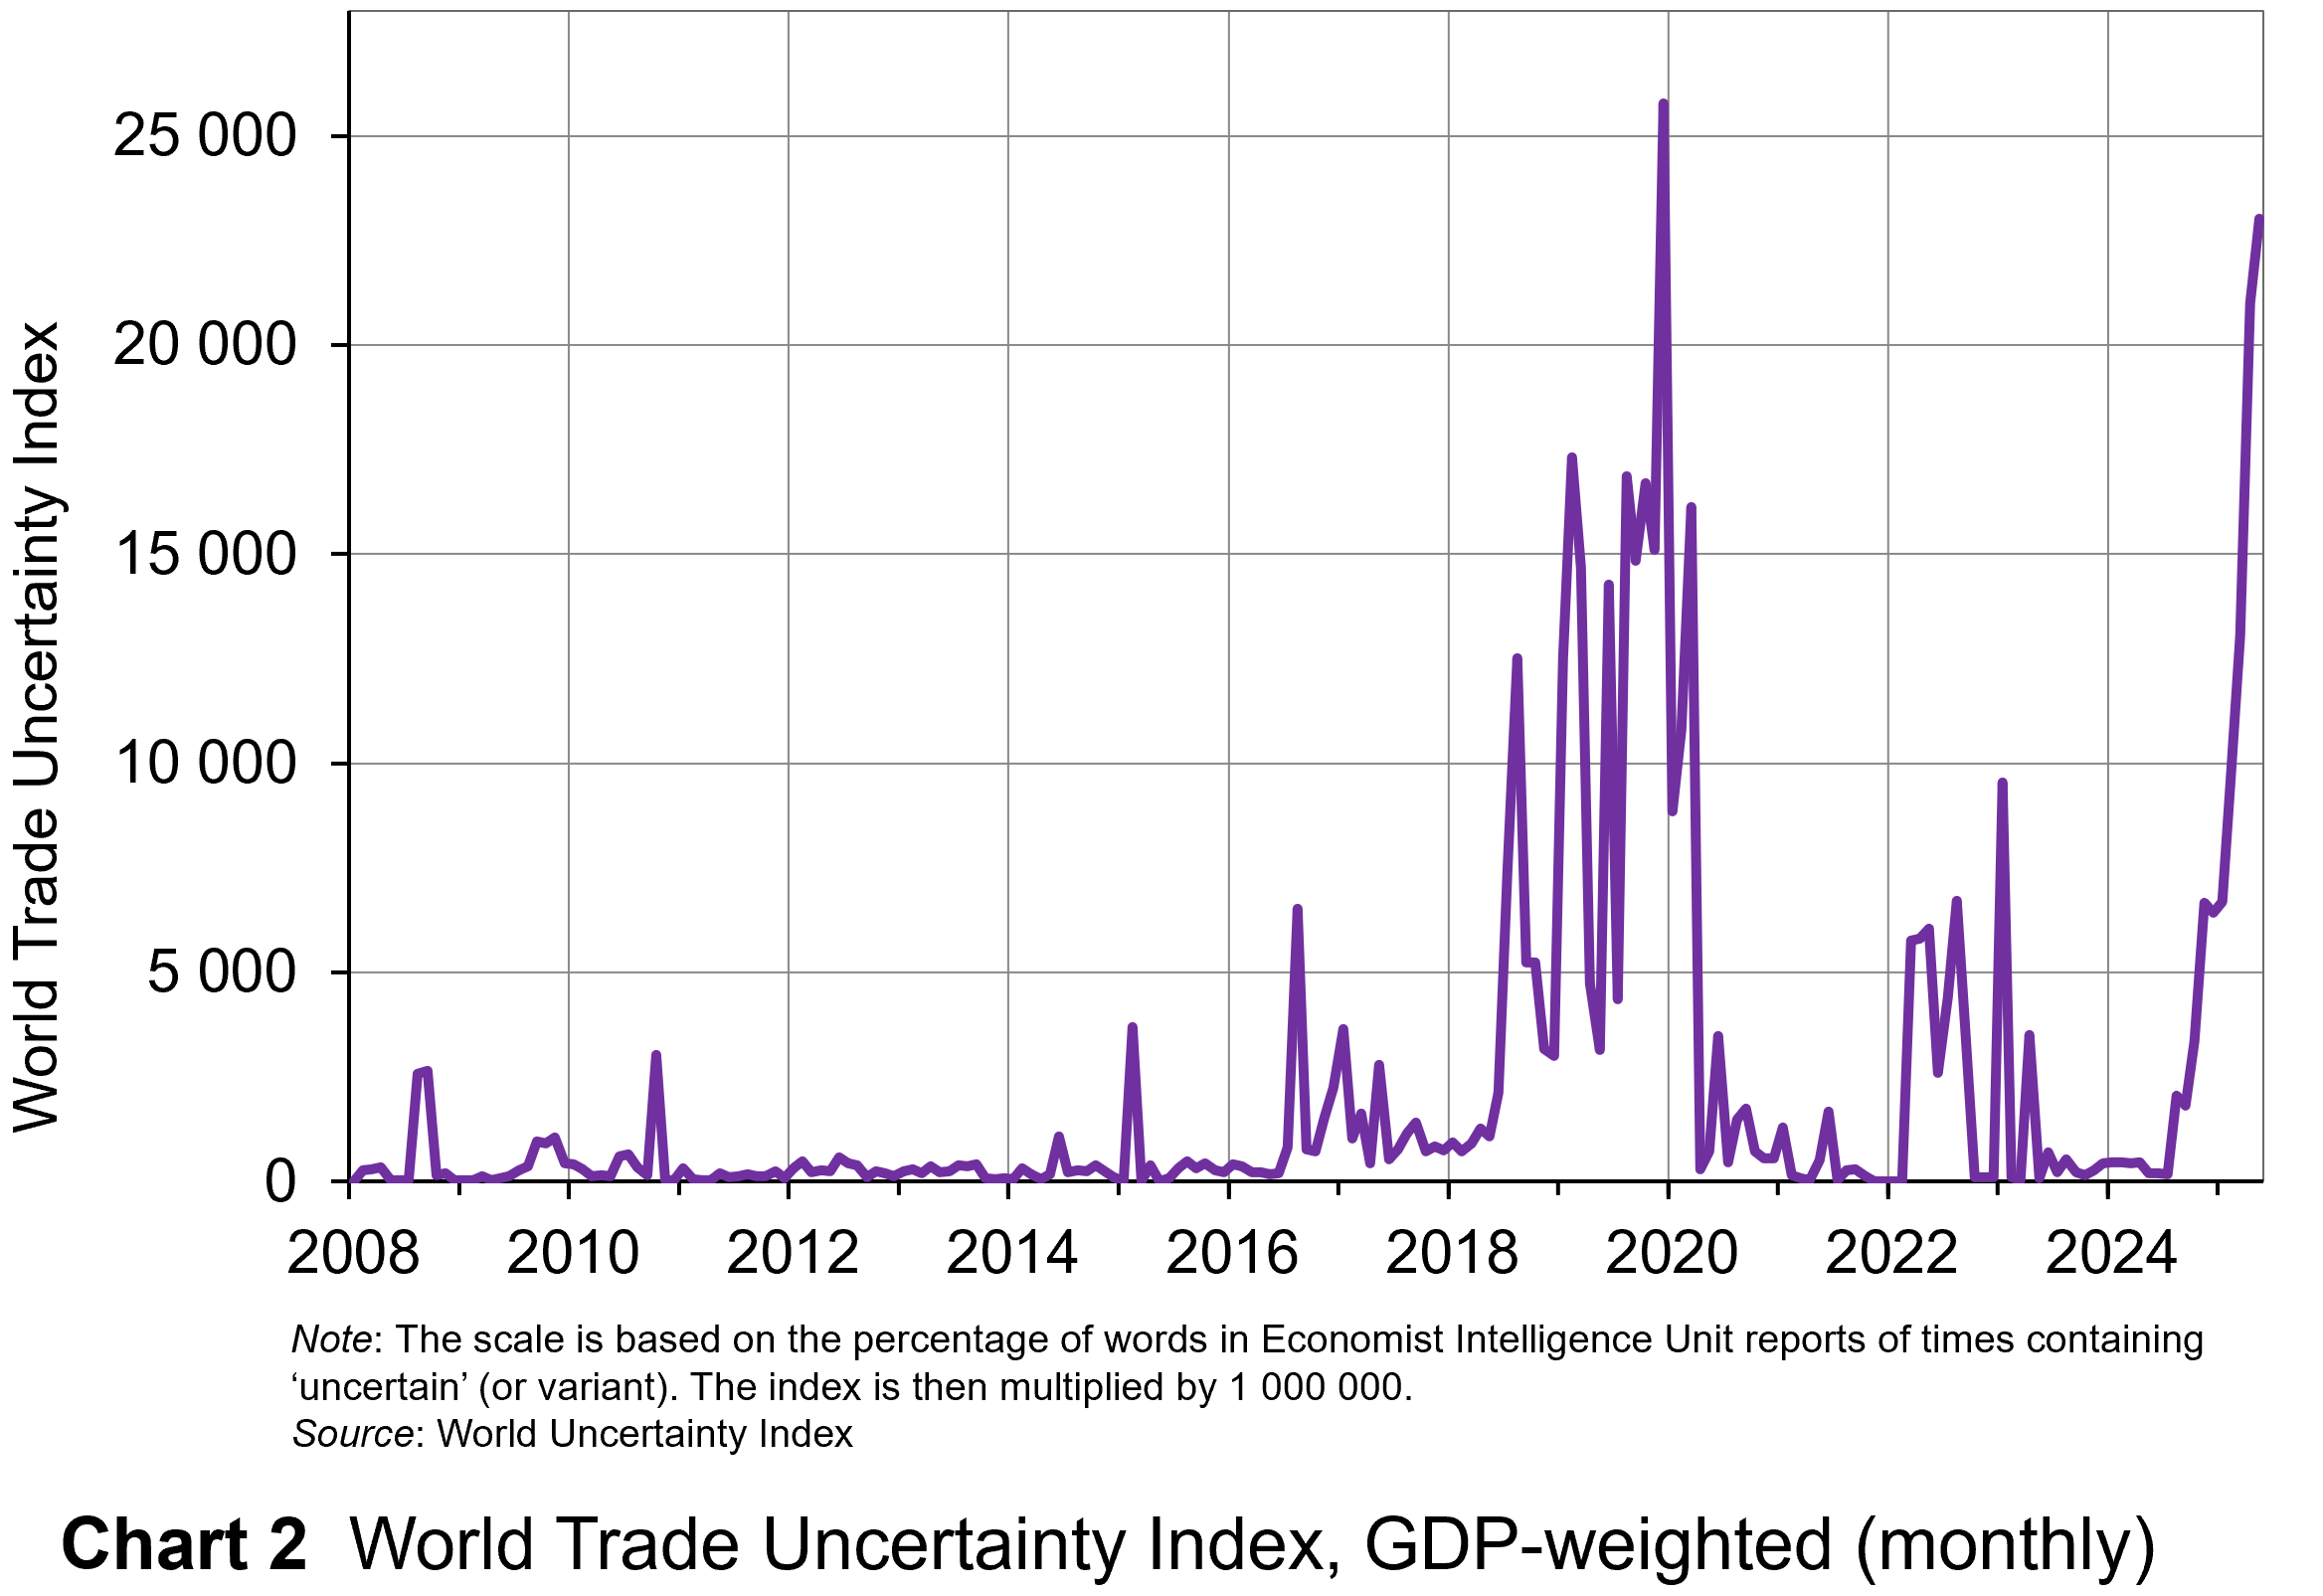 The second chart shows the World Trade Uncertainty Index (WTUI), published on the same site as the WUI (click here for a PowerPoint). The method adopted in its construction therefore mirrors that for the WUI but counts the number of times in EIU country reports ‘uncertainty’ is mentioned within proximity to a word related to trade, such as ‘protectionism’, ‘NAFTA’, ‘tariff’, ‘trade’, ‘UNCTAD’ or ‘WTO.’
The chart shows that in May 2025, the WTUI had risen to just over 23 000 – the second highest since December 2019, when President Trump imposed a new round of tariffs on Chinese imports and announced that he would restore steel tariffs on Brazil and Argentina. Since 2008, the WTUI has averaged just 2228.
It remains to be seen whether more stability in trade relations and geopolitics will allow WUI and WUTI to decline once more, or whether greater instability will simply lead to greater uncertainty, with damaging consequences for investment and also for consumption and employment.
Articles
- IMF World Economic Outlook: economic uncertainty is now higher than it ever was during COVID
The Conversation, Sergi Basco (23/4/25)
- Economic uncertainty hits new high
McKinsey, Sven Smit et al. (29/5/25)
- Trade tensions and rising uncertainty drag global economy towards recession
UNCTAD News (25/4/25)
- IMF Warns Global Economic Uncertainty Surpasses Pandemic Levels
The Global Treasurer (24/4/25)
- Britons ‘hoarding cash amid economic uncertainty and fear of outages’
The Guardian, Phillip Inman (10/6/25)
- America’s Brexit Phase
Foreign Affairs, Jonathan Haskel and Matthew J. Slaughter (10/6/25)
- Goldman Sachs’ CEO on the ‘Big, Beautiful Bill,’ Trump’s Tariffs and Economic Volatility
Politico, Sam Sutton (13/6/25)
- The Countries Where Economic Uncertainty Is Rising Fastest
24/7 Wall St., Evan Comen (9/6/25)
- Trump’s tariffs have finally kicked in, so what happens next?
The Conversation, Maha Rafi Atal (8/8/25)
Uncertainty Indices
Questions
- Explain what is meant by ‘text mining’. What are its strengths and weaknesses in assessing business, consumer and trade uncertainty?
- Explain how the UK Monthly EPU Index is derived.
- Why has uncertainty increased so dramatically since the start of 2025?
- Compare indices based on text mining with confidence indices.
- Plot consumer and business/industry confidence indicators for the past 24 months, using EC data. Do they correspond with the WUI?
- How may uncertainty affect consumers’ decisions?
We continue to live through incredibly turbulent times. In the past decade or so we have experienced a global financial crisis, a global health emergency, seen the UK’s departure from the European Union, and witnessed increasing levels of geopolitical tension and conflict. Add to this the effects from the climate emergency and it easy to see why the issue of economic uncertainty is so important when thinking about a country’s economic prospects.
In this blog we consider how we can capture this uncertainty through a World Uncertainty Index and the ways by which economic uncertainty impacts on the macroeconomic environment.
World Uncertainty Index
Hites Ahir, Nicholas Bloom and Davide Furceri have constructed a measure of uncertainty known as the World Uncertainty Index (WUI). This tracks uncertainty around the world using the process of ‘text mining’ the country reports produced by the Economist Intelligence Unit. The words searched for are ‘uncertain’, ‘uncertainty’ and ‘uncertainties’ and a tally is recorded based on the number of times they occur per 1000 words of text. To produce the index this figure is then multiplied up by 100 000. A higher number therefore indicates a greater level of uncertainty. For more information on the construction of the index see the 2022 article by Ahir, Bloom and Furceri linked below.
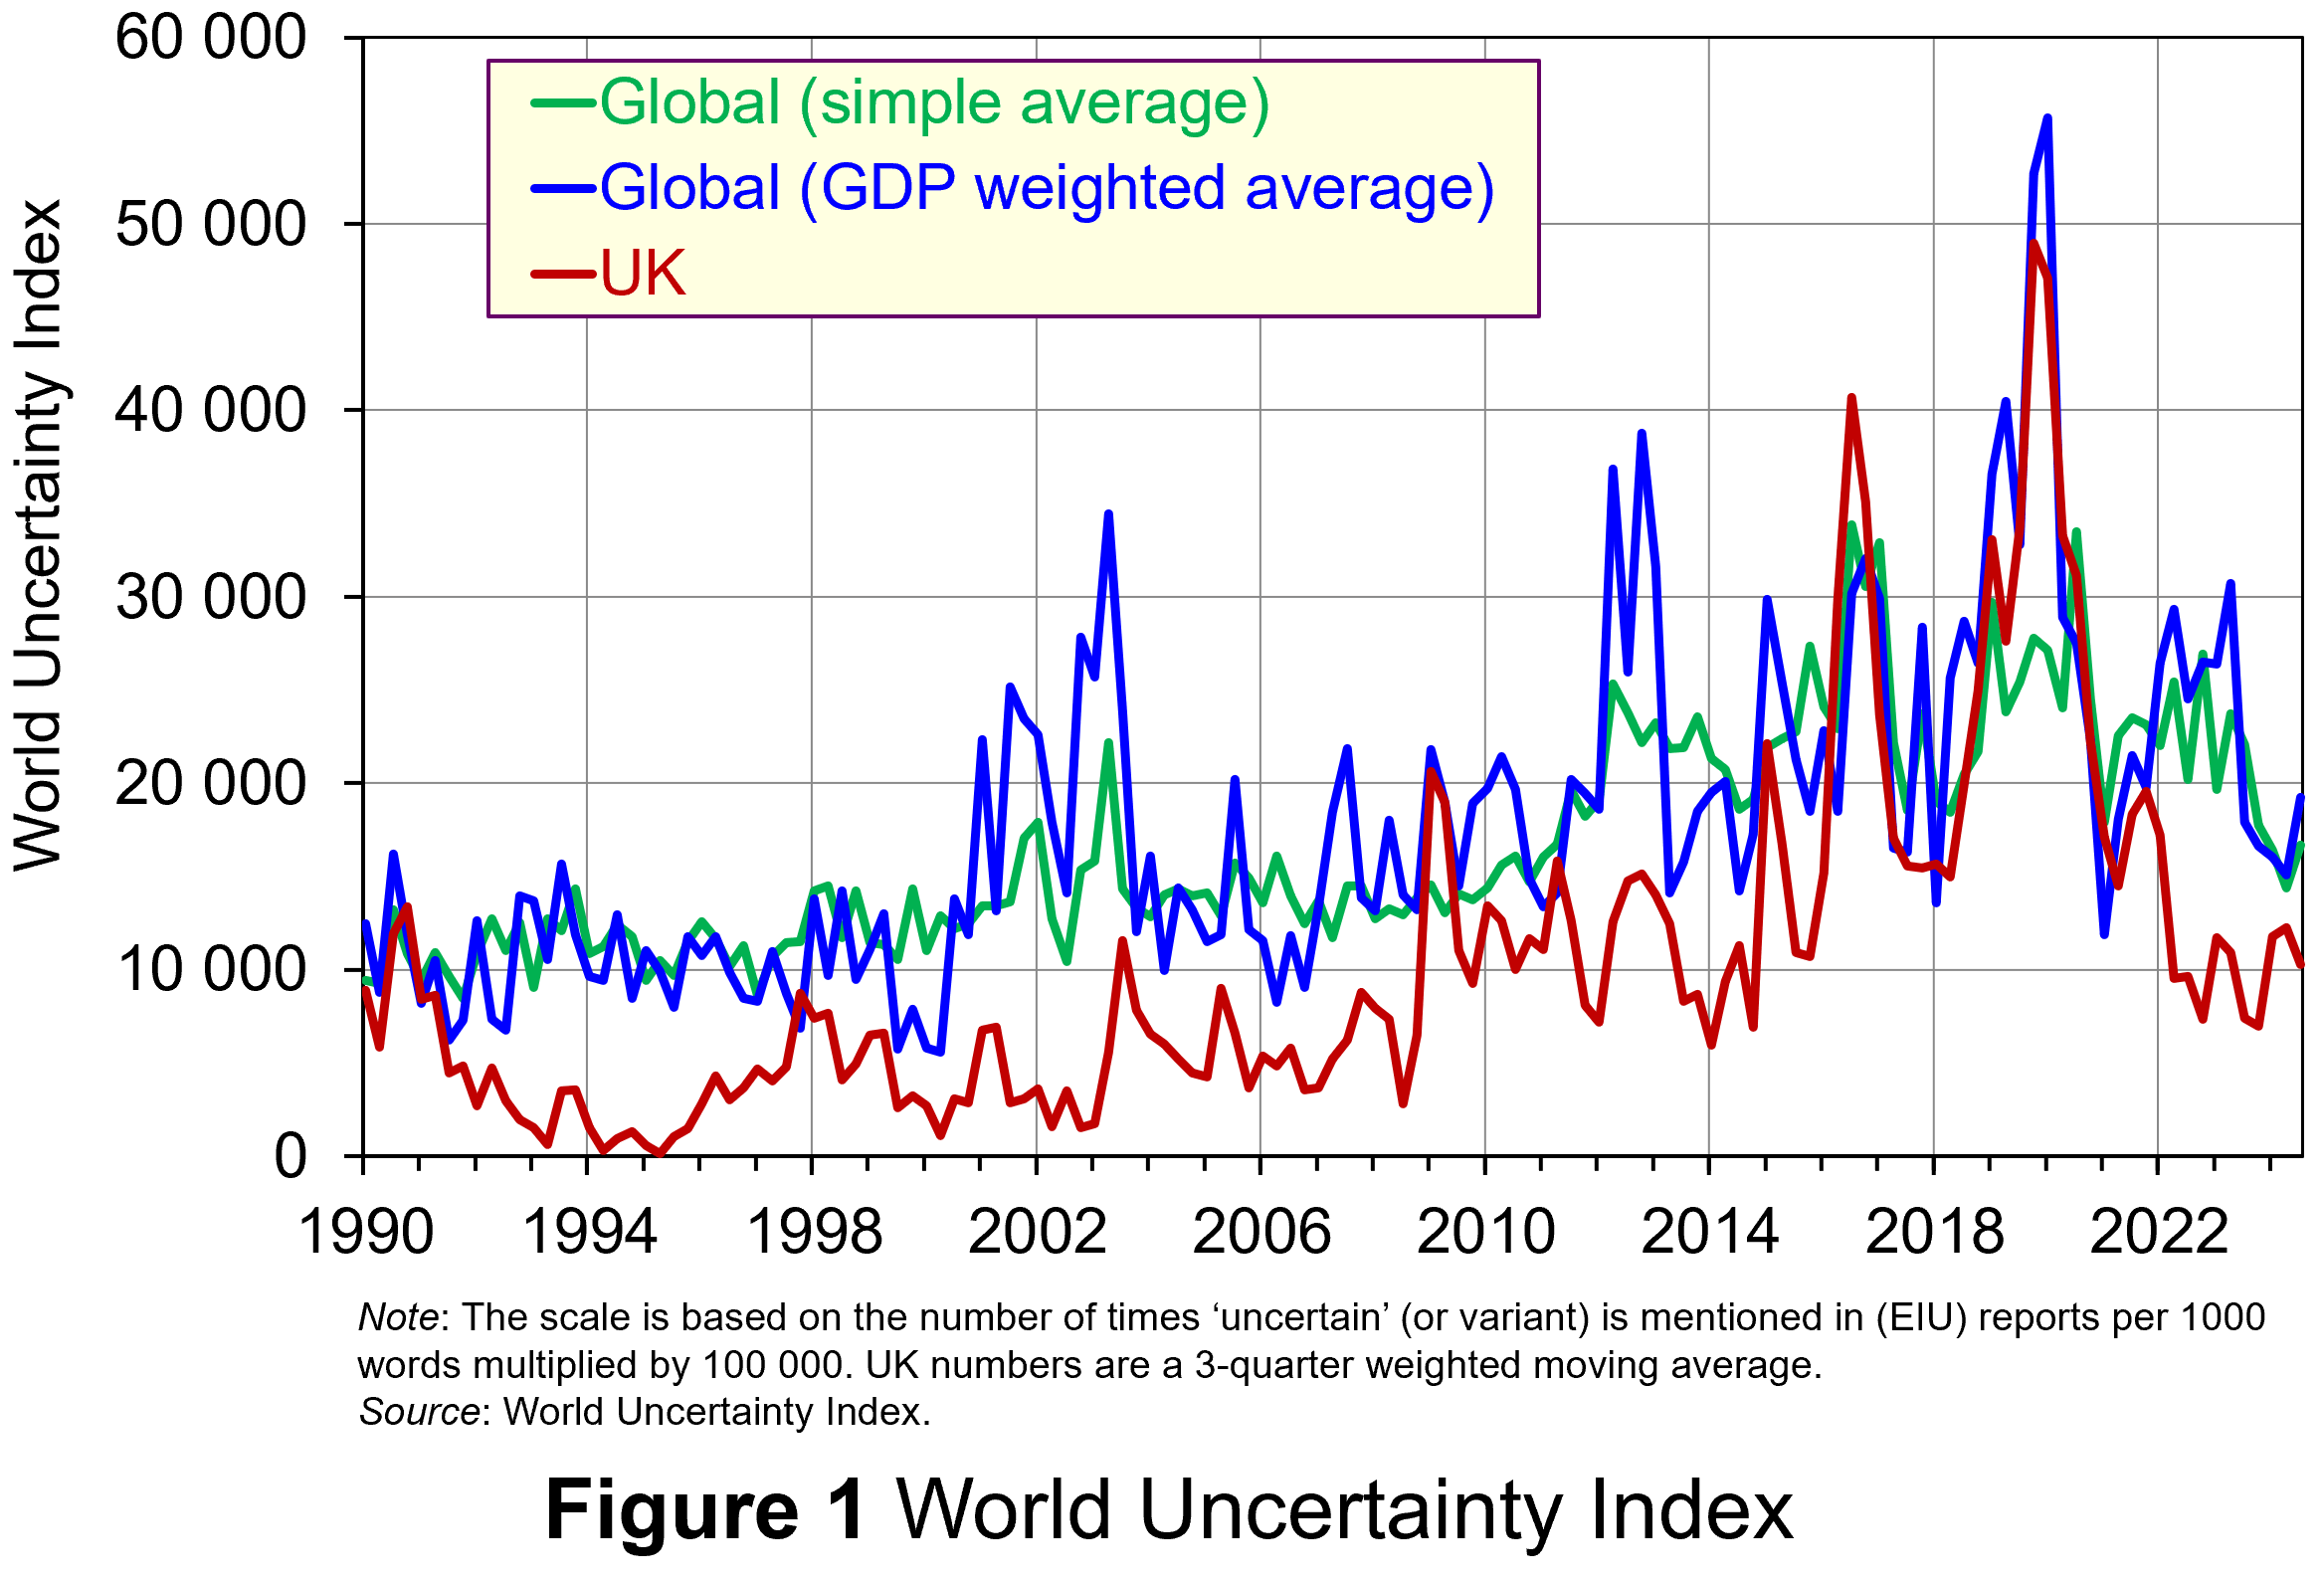 Figure 1 (click here for a PowerPoint) shows the WUI both globally and in the UK quarterly since 1991. The global index covers 143 countries and is presented as both a simple average and a GDP weighted average. The UK WUI is also shown. This is a three-quarter weighted average, the authors’ preferred measure for individual countries, where increasing weights of 0.1, 0.3 and 0.6 are used for the three most recent quarters.
From Figure 1 we can see how the level of uncertainty has been particularly volatile over the past decade or more. Events such as the sovereign debt crisis in parts of Europe in the early 2010s, the Brexit referendum in 2016, the COVID-pandemic in 2020–21 and the invasion of Ukraine in 2022 all played their part in affecting uncertainty domestically and internationally.
Uncertainty, risk-aversion and aggregate demand
Now the question turns to how uncertainty affects economies. One way of addressing this is to think about ways in which uncertainty affects the choices that people and businesses make. In doing so, we could think about the impact of uncertainty on components of aggregate demand, such as household consumption and investment, or capital expenditures by firms.
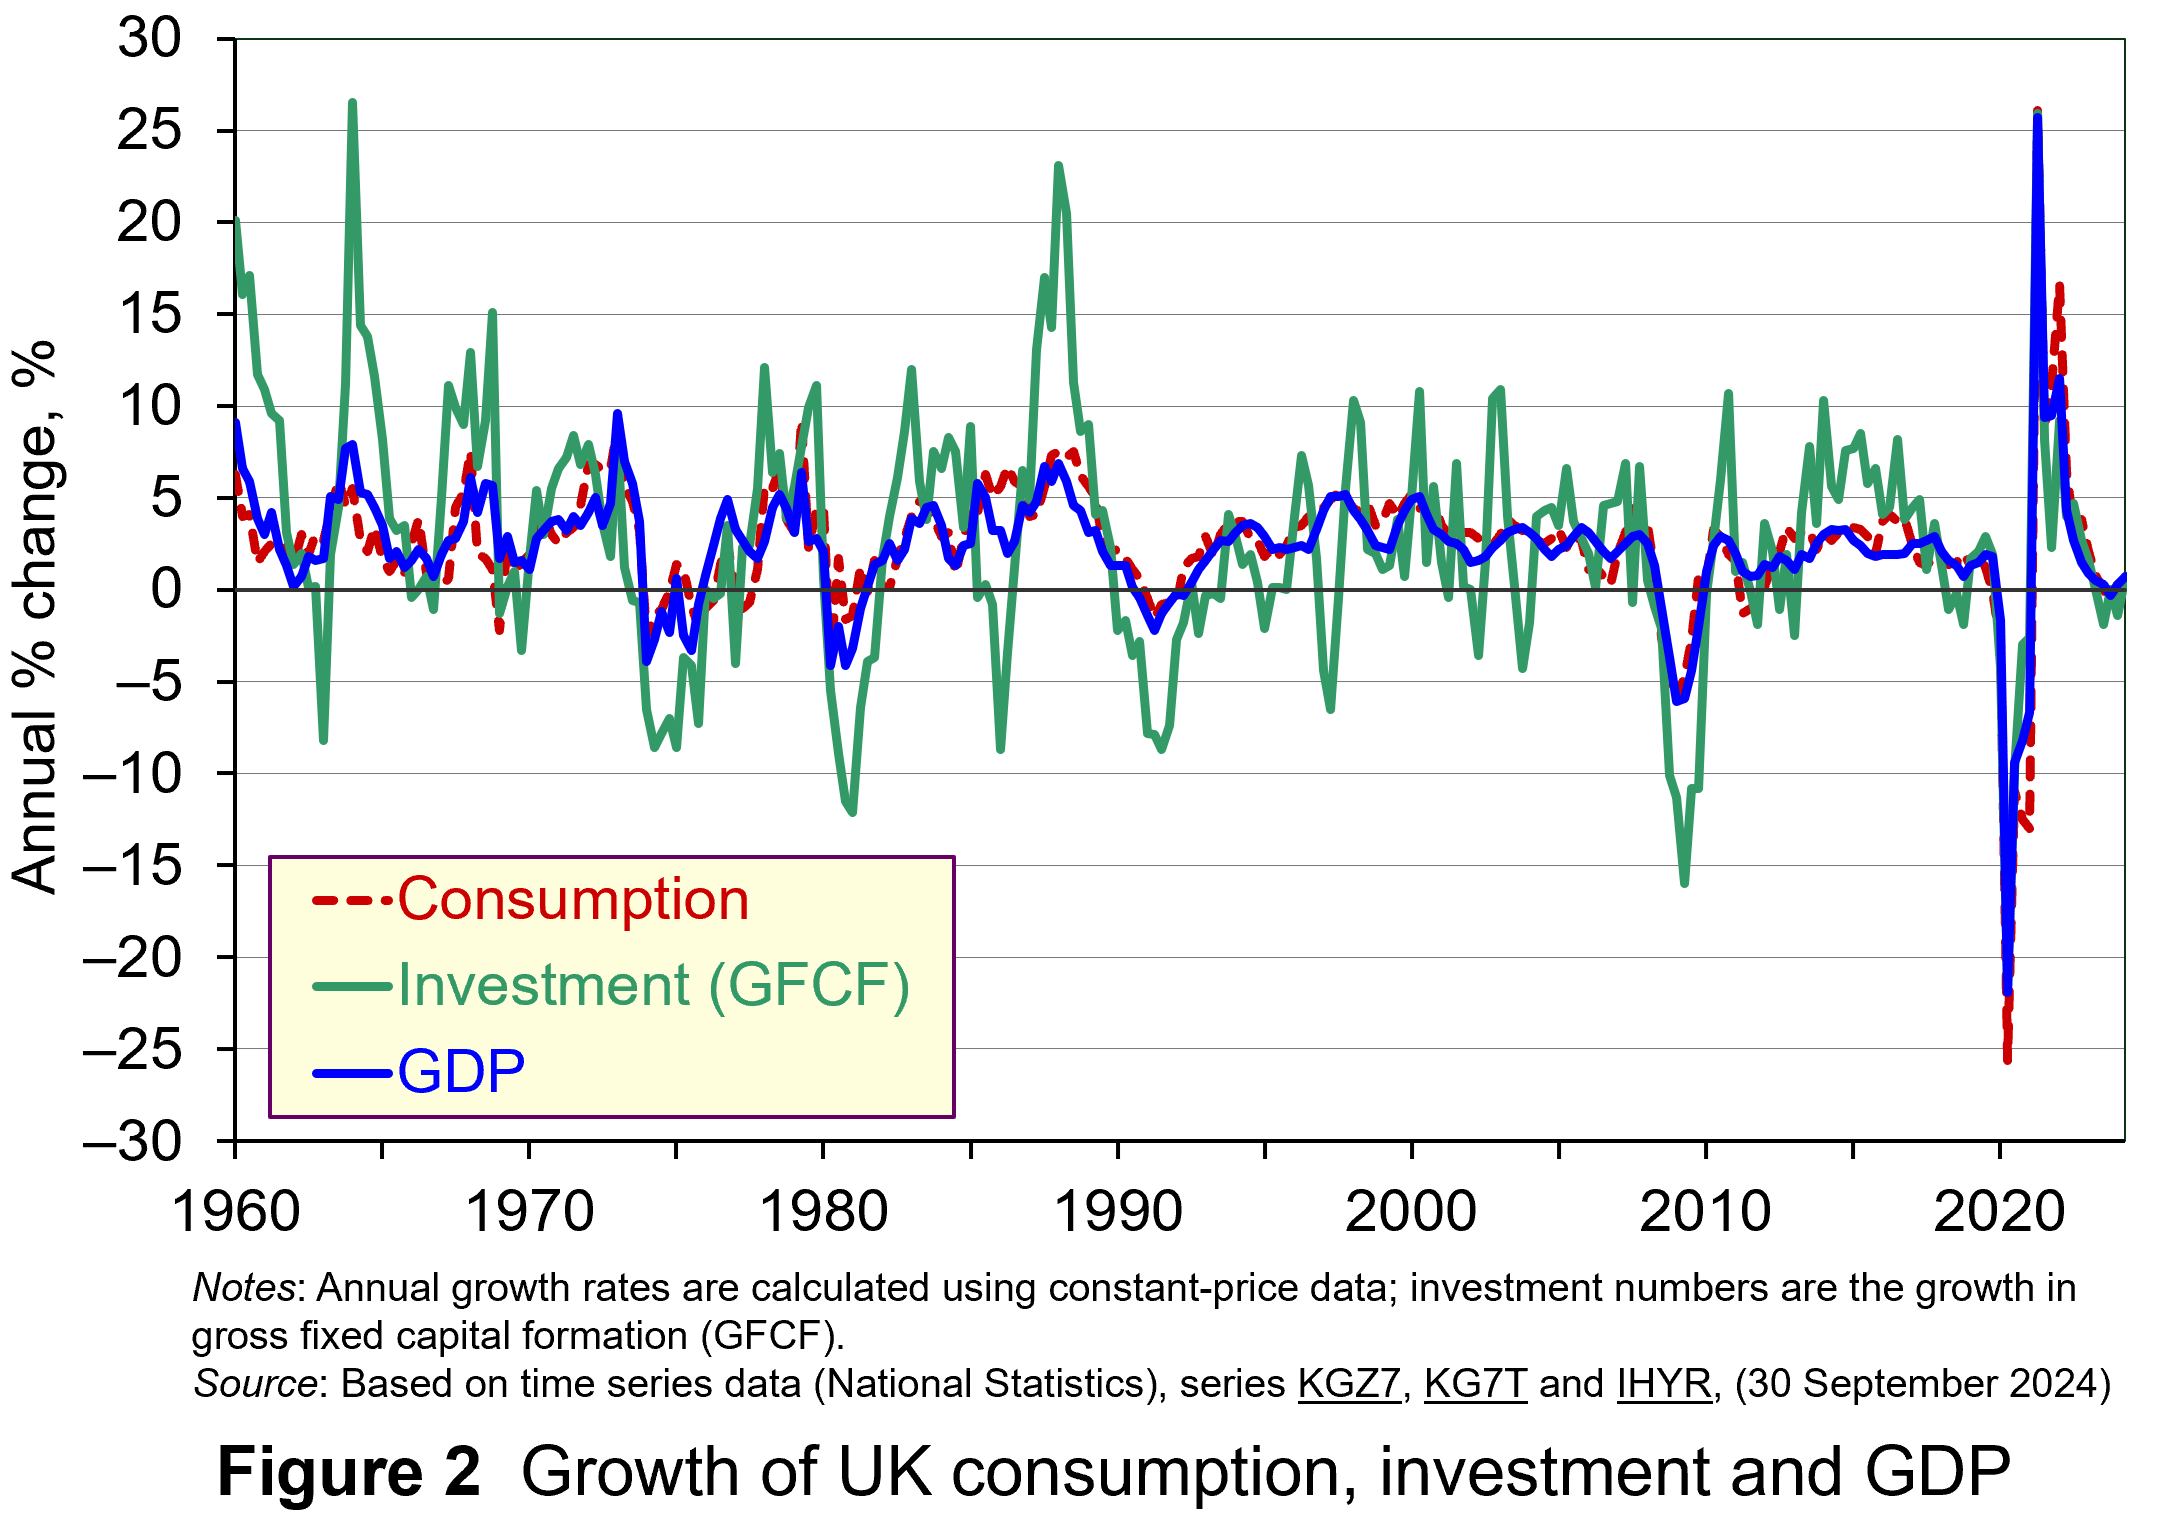 As Figure 2 shows (click here for a PowerPoint), investment is particularly volatile, and much more so than household spending. Some of this can be attributed to the ‘lumpiness’ of investment decisions since these expenditures tend to be characterised by indivisibility and irreversibility. This means that they are often relatively costly to finance and are ‘all or nothing’ decisions. In the context of uncertainty, it can make sense therefore for firms to wait for news that makes the future clearer. In this sense, we can think of uncertainty rather like a fog that firms are peering through. The thicker the fog, the more uncertain the future and the more cautious firms are likely to be.
The greater caution that many firms are likely to adopt in more uncertain times is consistent with the property of risk-aversion that we often attribute to a range of economic agents. When applied to household spending decisions, risk-aversion is often used to explain why households are willing to hold a buffer stock of savings to self-insure against unforeseen events and their future financial outcomes being worse than expected. Hence, in more uncertain times households are likely to want to increase this buffer further.
 The theory of buffer-stock saving was popularised by Christopher Carroll in 1992 (see link below). It implies that in the presence of uncertainty, people are prepared to consume less today in order to increase levels of saving, pay off existing debts, or borrow less relative to that in the absence of uncertainty. The extent of the buffer of financial wealth that people want to hold will depend on their own appetite for risk, the level of uncertainty, and the moderating effect from their own impatience and, hence, present bias for consuming today.
Risk aversion is consistent with the property of diminishing marginal utility of income or consumption. In other words, as people’s total spending volumes increase, their levels of utility or satisfaction increase but at an increasingly slower rate. It is this which explains why individuals are willing to engage with the financial system to reallocate their expected life-time earnings and have a smoother consumption profile than would otherwise be the case from their fluctuating incomes.
Yet diminishing marginal utility not only explains consumption smoothing, but also why people are willing to engage with the financial system to have financial buffers as self-insurance. It explains why people save more or borrow less today than suggested by our base-line consumption smoothing model. It is the result of people’s greater dislike (and loss of utility) from their financial affairs being worse than expected than their like (and additional utility) from them being better than expected. This tendency is only likely to increase the more uncertain times are. The result is that uncertainty tends to lower household consumption with perhaps ‘big-ticket items’, such as cars, furniture, and expensive electronic goods, being particularly sensitive to uncertainty.
Uncertainty and confidence
Uncertainty does not just affect risk; it also affects confidence. Risk and confidence are often considered together, not least because their effects in generating and transmitting shocks can be difficult to disentangle.
We can think of confidence as capturing our mood or sentiment, particularly with respect to future economic developments. Figure 3 plots the Uncertainty Index for the UK alongside the OECD’s composite consumer and business confidence indicators. Values above 100 for the confidence indicators indicate greater confidence about the future economic situation and near-term business environment, while values below 100 indicate pessimism towards the future economic and business environments.
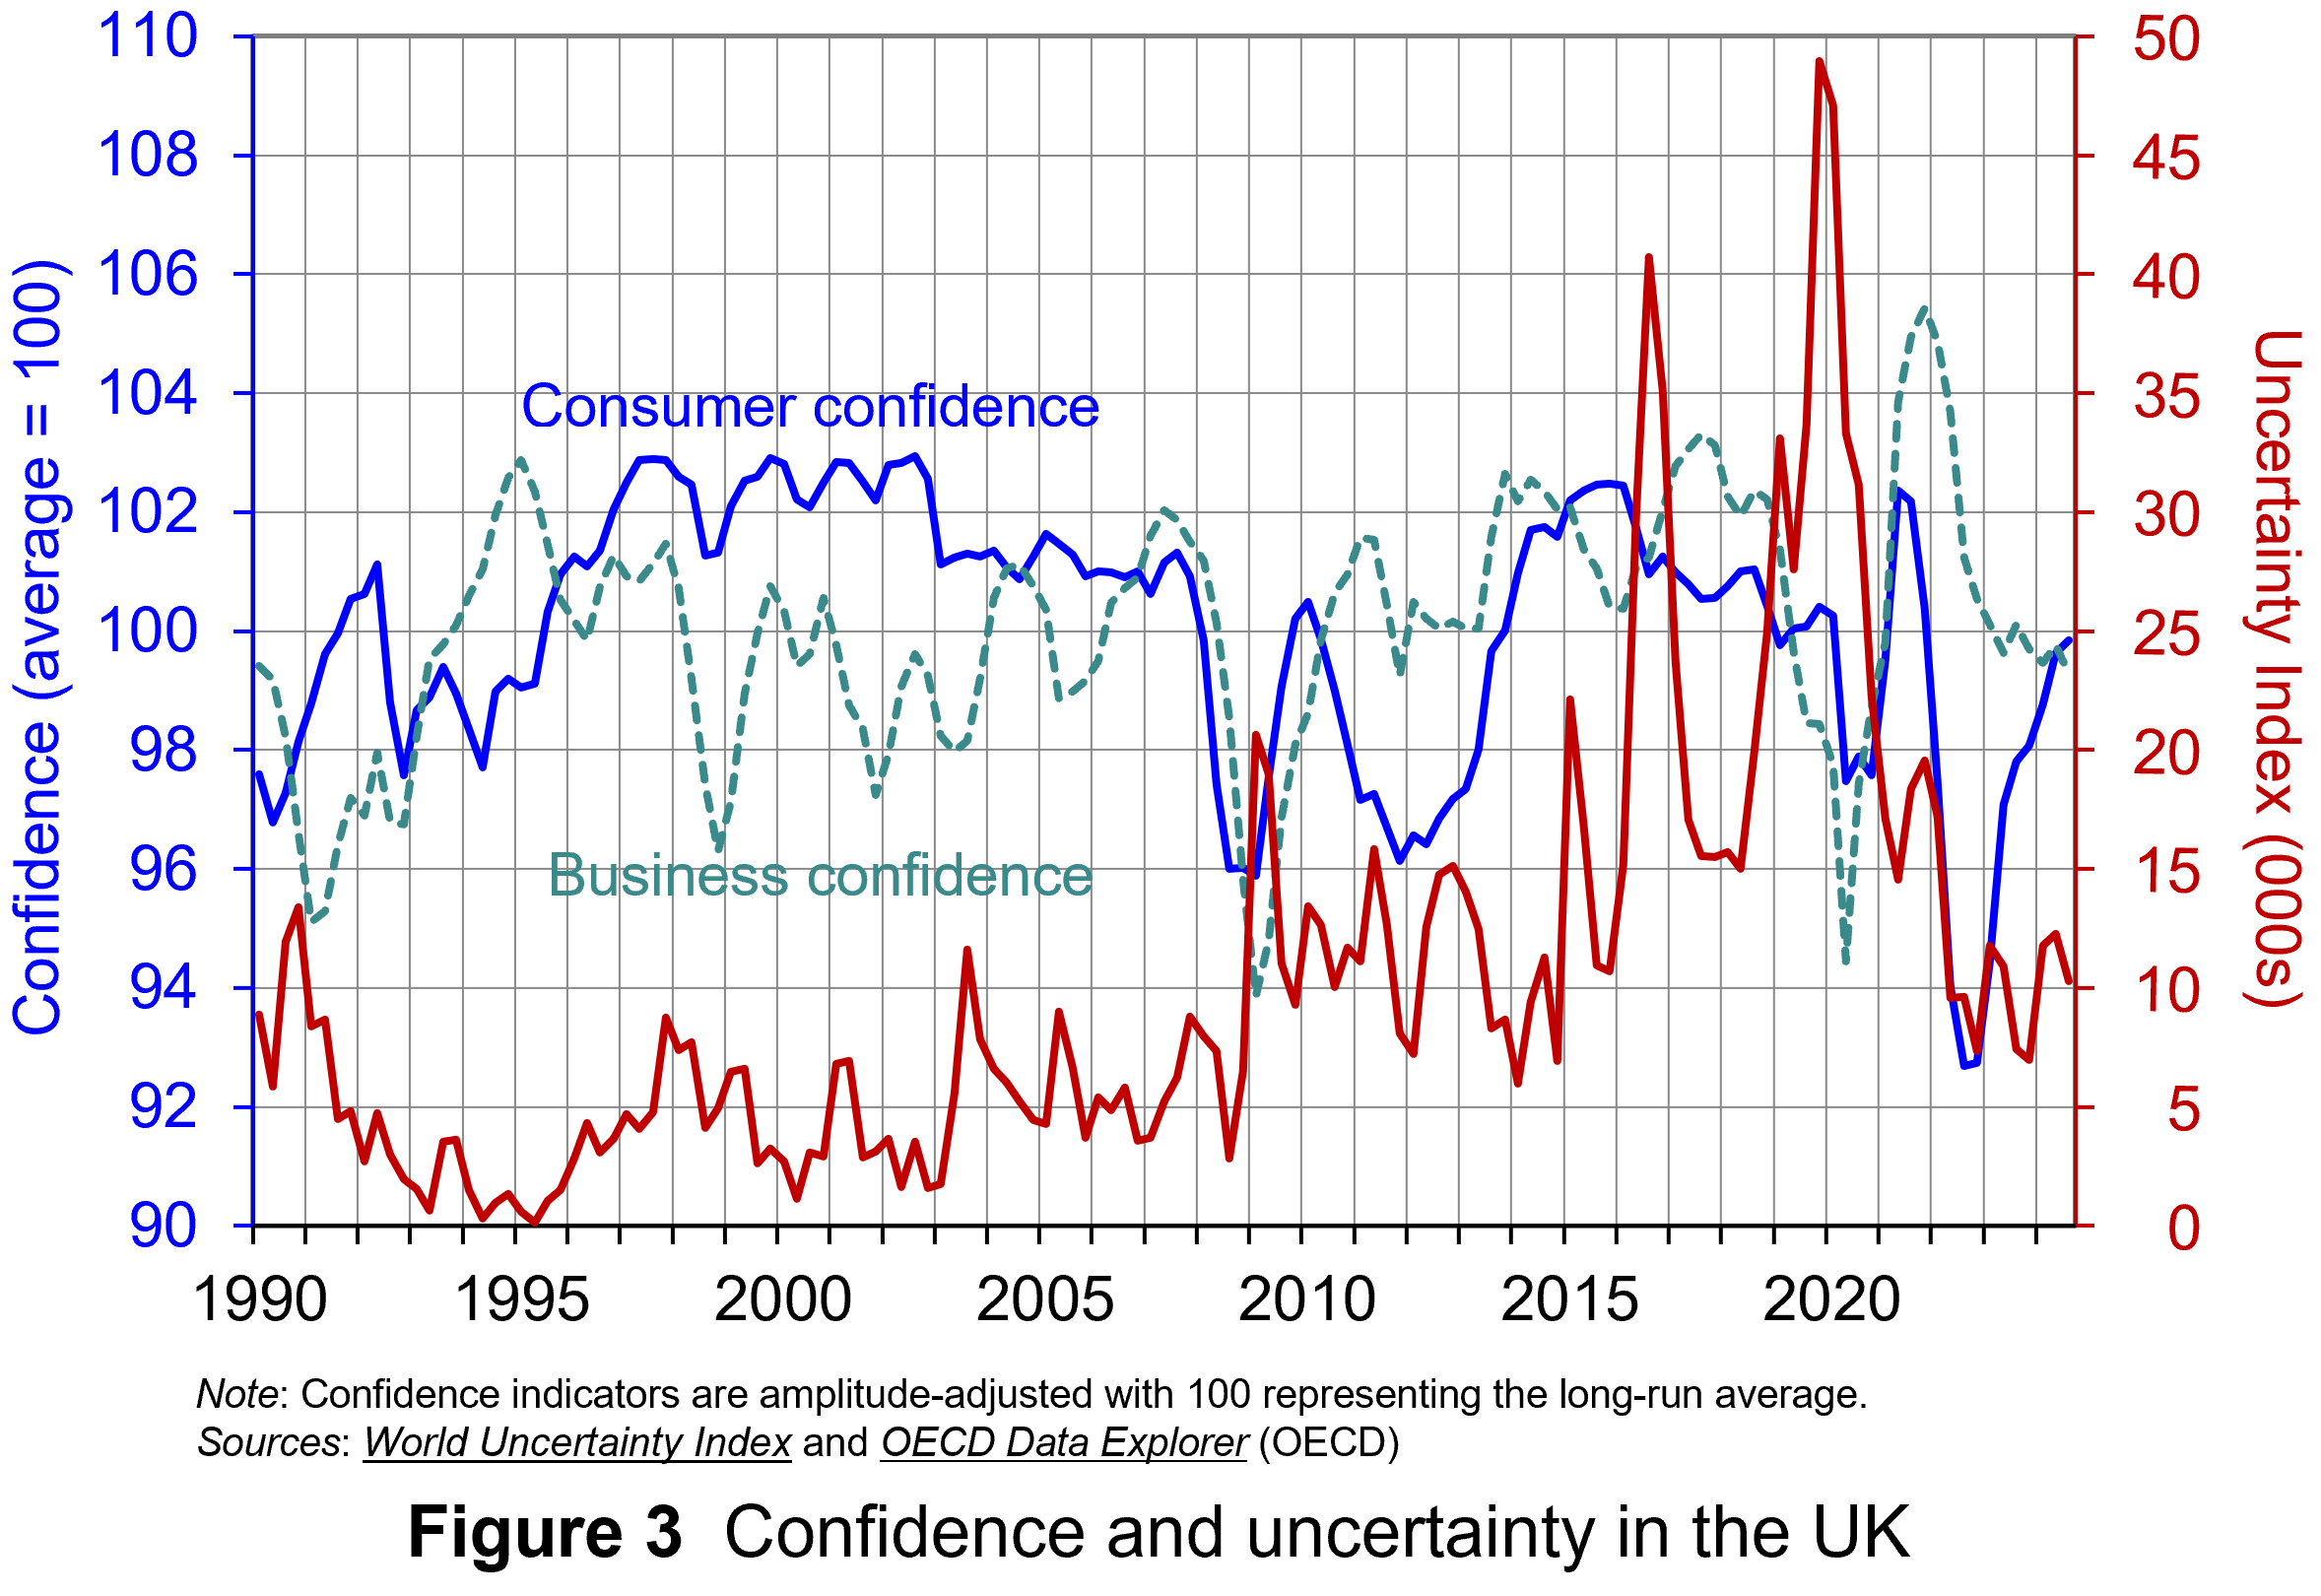 Figure 3 suggests that the relationship between confidence and uncertainty is rather more complex than perhaps is generally understood (click here for a PowerPoint). Haddow, Hare, Hooley and Shakir (see link below) argue that the evidence tends to point to changes in uncertainty affecting confidence, but with less evidence that changes in confidence affect uncertainty.
To illustrate this, consider the global financial crisis of the late 2000s. The argument can be made that the heightened uncertainty about future prospects for households and businesses helped to erode their confidence in the future. The result was that people and businesses revised down their expectations of the future (pessimism). However, although people were more pessimistic about the future, this was more likely to have been the result of uncertainty rather than the cause of further uncertainty.
Conclusion
For economists and policymakers alike, indicators of uncertainty, such as the Ahir, Bloom and Furceri World Uncertainty Index, are invaluable tools in understanding and forecasting behaviour and the likely economic outcomes that follow. Some uncertainty is inevitable, but the persistence of greater uncertainty since the global financial crisis of the late 2000s compares quite starkly with the relatively lower and more stable levels of uncertainty seen from the mid-1990s up to the crisis. Hence the recent frequency and size of changes in uncertainty show how important it to understand how uncertainty effects transmit through economies.
Academic papers
- The World Uncertainty Index
National Bureau of Economic Research, Working Paper 29763, Hites Ahir, Nicholas Bloom and Davide Furceri (February 2022)
- The Buffer-Stock Theory of Saving: Some Macroeconomic Evidence
Brookings Papers on Economic Activity, Christopher D Carroll (Vol 2, 1992)
- Macroeconomic uncertainty: what is it, how can we measure it and why does it matter?
Bank of England Quarterly Bulletin, 2013 Q2, Abigail Haddow, Chris Hare, John Hooley and Tamarah Shakir (13/6/13)
Articles
Data
Questions
- (a) Explain what is meant by the concept of diminishing marginal utility of consumption.
(b) Explain how this concept helps us to understand both consumption smoothing and the motivation to engage in buffer-stock saving.
- Explain the distinction between confidence and uncertainty when analysing macroeconomic shocks.
- Discuss which types of expenditures you think are likely to be most susceptible to uncertainty shocks.
- Discuss how economic uncertainty might affect productivity and the growth of potential output.
- How might the interconnectedness of economies affect the transmission of uncertainty effects through economies?
 In the second of a series of blogs looking at applications of the distinction between nominal and real indicators, we revisit the blog Getting Real with Growth last updated in October 2021.
In this blog, we discuss how, in making a meaningful comparison over time of a country’s national income and, therefore, the aggregate purchasing power of its people, we need to take inflation into account. Likewise, if we want to analyse changes in the volume of production, we need to eliminate the effects of price changes on GDP. This is important when analysing the business cycle and identifying periods of boom or bust. Hence, in this updated blog we take another look at what real GDP data reveal about both longer-term economic growth and the extent of economic volatility – or what we refer to as the twin characteristics of economic growth.
Real and nominal GDP
The nominal (or current-price) estimate for UK gross domestic product in 2023 was £2.687 trillion. The estimate of national output or national income is based primarily on the production of final goods and services and, hence, purchased by the final user. It therefore largely excludes intermediate goods and services: i.e. goods and services that are transformed or used up in the process of making something else, although data on imports and exports do include intermediate goods and services. The 2023 figure represents a nominal increase in national income of 7.2 per cent on the £2.51 trillion recorded in 2022. These values make no adjustment for inflation and therefore reflect the prices of output that were prevailing at the time.
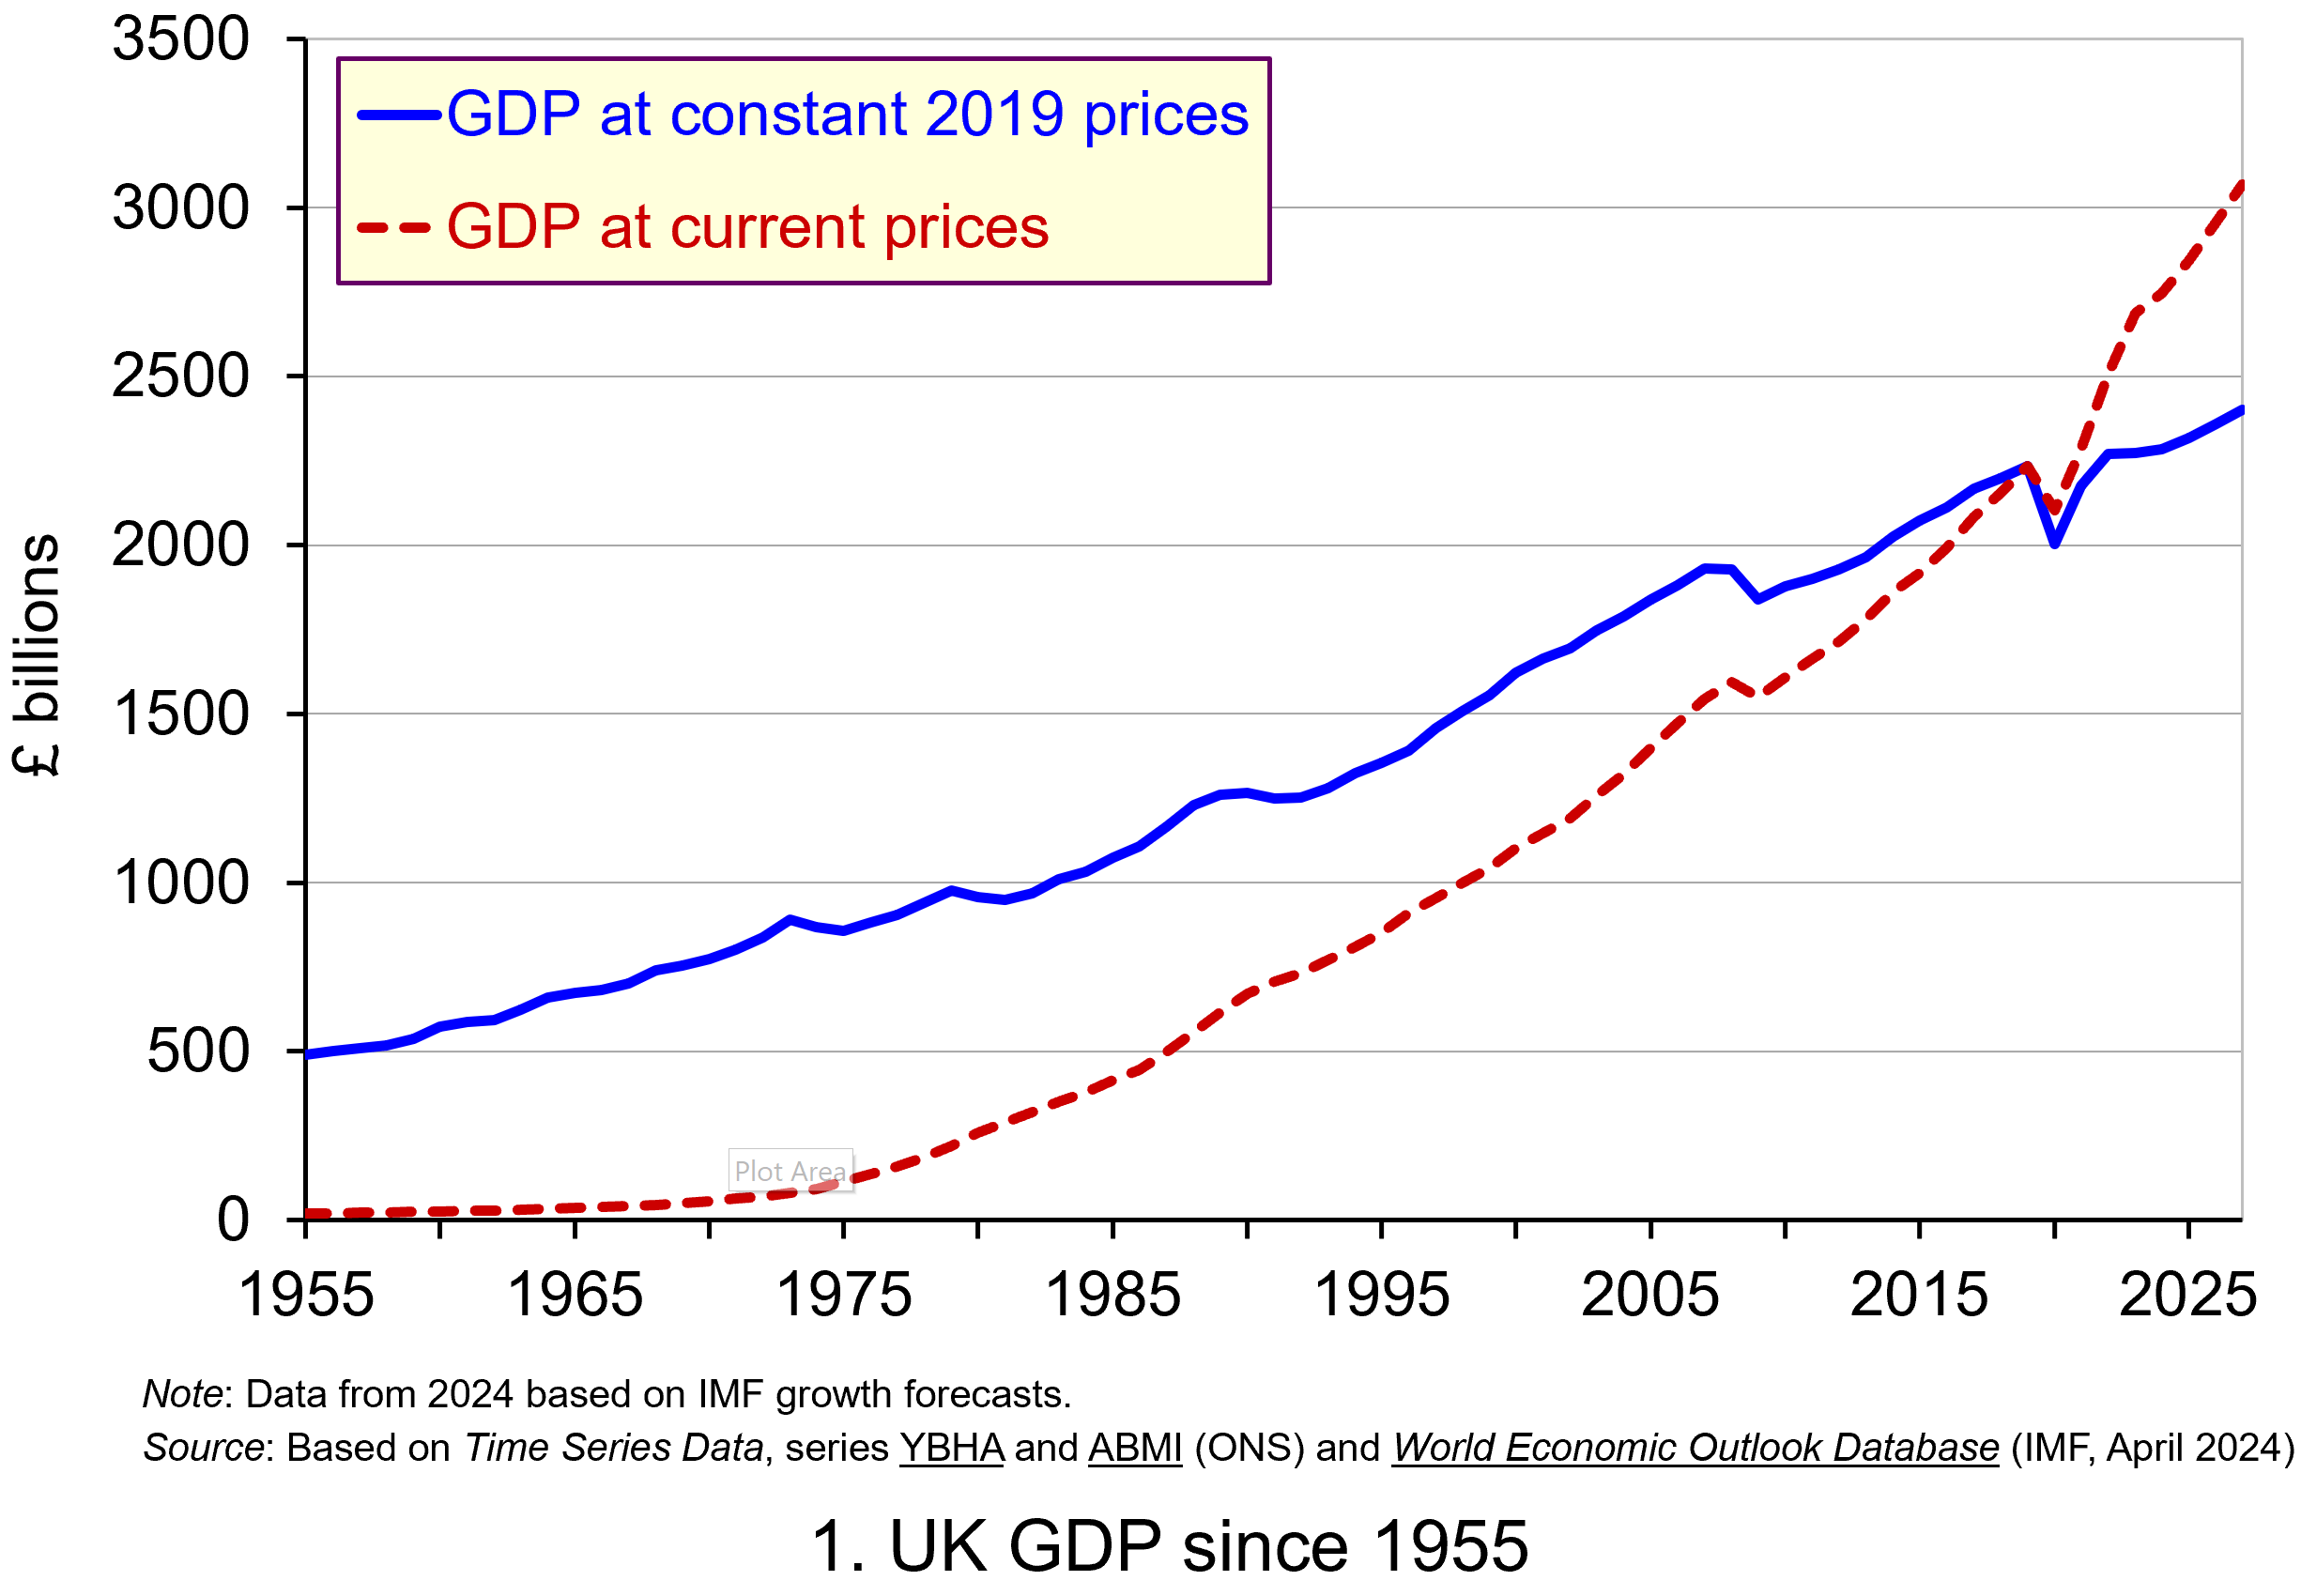 Chart 1 shows current-price estimates of GDP from 1955, when the value of GDP was estimated at £19.2 billion. The £2.687 trillion figure recorded for 2023 is an increase of over 140 times that in 1955, a figure that rises to 160 times if we compare the 1950 value with the latest IMF estimate for 2027. However, if we want to make a more meaningful comparison of the country’s national income we need to adjust for inflation. (Click here to download a PowerPoint of the chart.)
Long-term growth in real GDP
If we measure GDP at constant prices, we eliminate the effect of inflation. To construct a constant-price series for GDP, a process known as chain-linking is used. This involves taking consecutive pairs of years, e.g. 2022 and 2023, and estimating what GDP would be in the most recent year (in this case, 2023) if the previous year’s prices (i.e. 2022) had continued to prevail. By calculating the percentage change from the previous year’s GDP value we have an estimate of the volume change. If this is repeated for other pairs of years, we have a series of percentage changes that capture the volume changes from year-to-year. Finally, a reference year is chosen and the percentage volume changes are applied backwards and forwards from the nominal GDP value for the reference year.
In effect, a real GDP series creates a quantity measure in monetary terms. Chart 1 shows GDP at constant 2019 prices (real GDP) alongside GDP at current prices (nominal GDP). Consider first the real GDP numbers for 1955 and 2023. GDP in 1950 at 2019 prices was £491.2 billion. This is higher than the current-price value because prices in 2019 (the reference year) were higher than those in 1955. Meanwhile, GDP in 2023 when measured at 2019 prices was £2.273 trillion. This constant-price value is smaller than the corresponding current-price value because prices in 2019 where lower than those in 2023.
 Between 1955 and 2023 real GDP increased 4.6 times. If we extend the period to 2027, again using the latest IMF estimates, the increase is 4.9 times. Because we have removed the effect of inflation, the real growth figure is much lower than the nominal growth figure.
Crucially, what we are left with is an indicator of the long-term growth in the volume of the economy’s output and hence an increase in national income that is backed up by an increase in production. Whereas nominal growth rates are affected by changes in both volumes and prices, real growth rates reflect only changes in volumes.
The upward trajectory observed in constant-price GDP is therefore evidence of positive longer-term growth. This is one of the twin characteristics of growth.
Short-term fluctuations in the growth of real GDP
The second characteristic is fluctuations in the rate of growth from period to period. We can see this second characteristic more clearly by plotting the percentage change in real GDP from year to year.
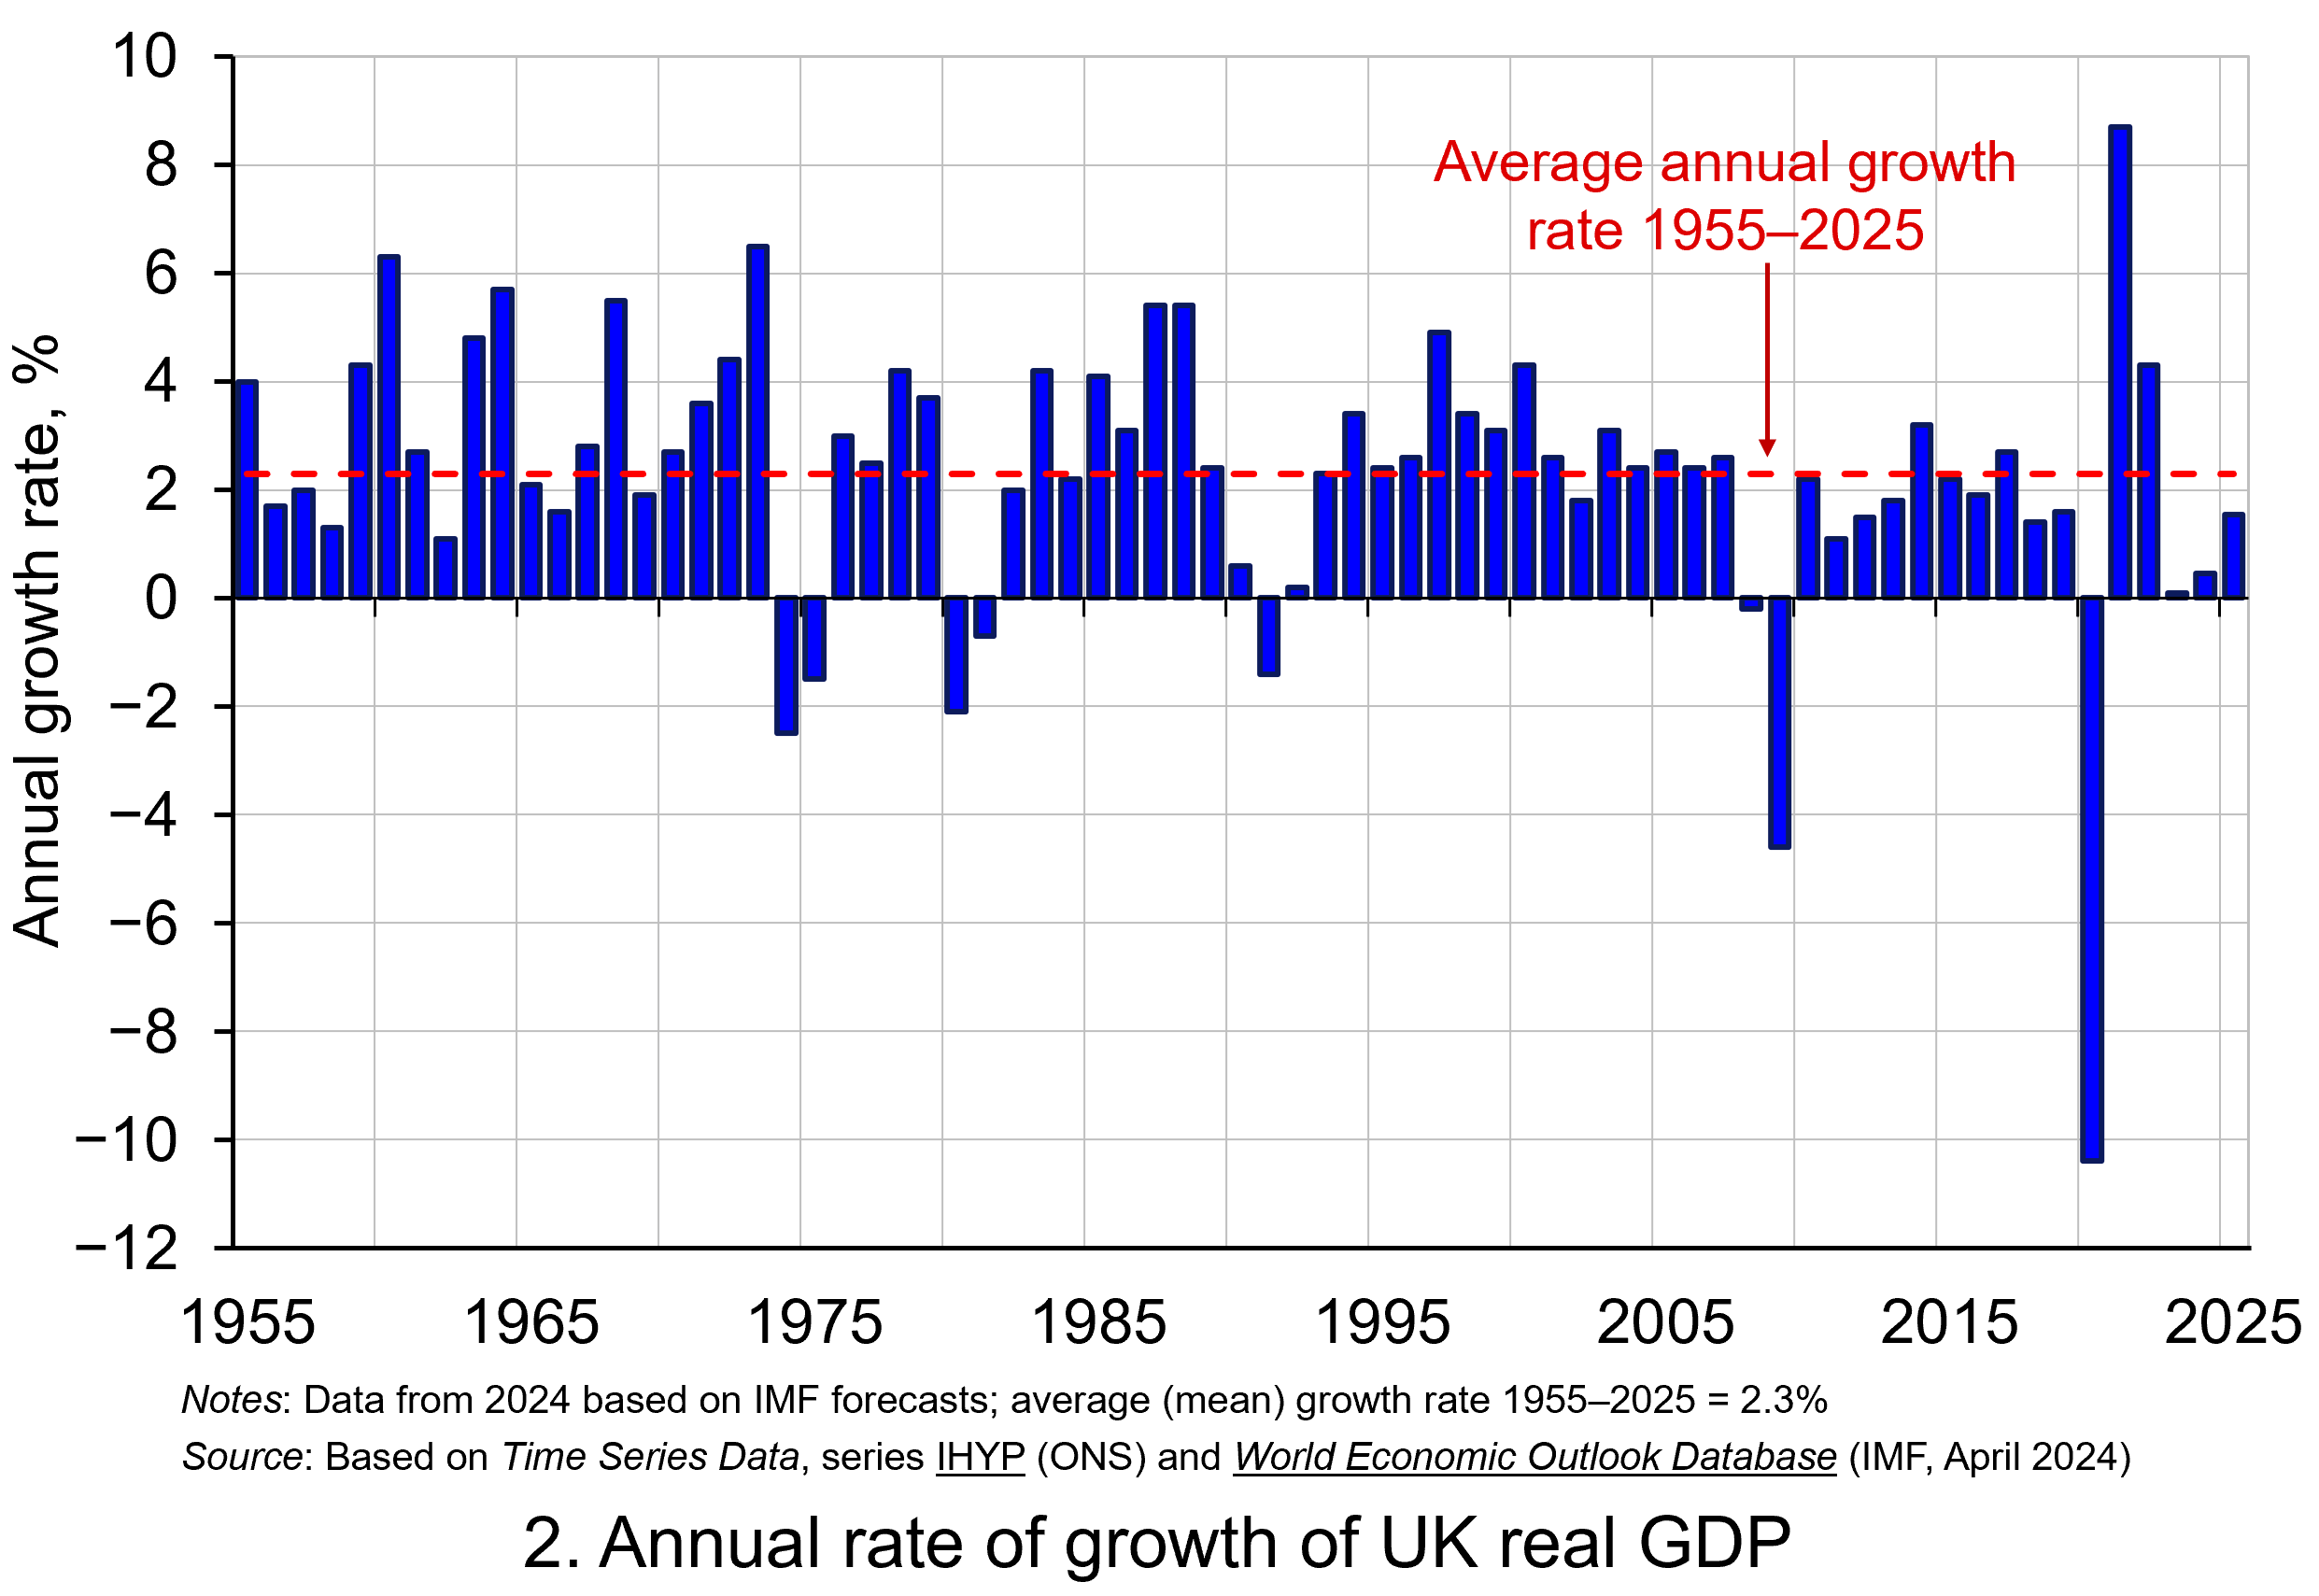 Chart 2 shows the annual rate of growth in real GDP each year from 1955 to 2025. From it, we see the inherent instability that is a key characteristic of the macroeconomic environment. This instability is, of course, mirrored in the output path of real GDP in Chart 1, but the annual rates of growth show the instability more clearly. We can readily see the impact on national output of the global financial crisis of 2007–8 and the global COVID pandemic.
In 2009, constant-price GDP in the UK fell by 4.6 per cent, whereas current-price GDP fell by 2.8 per cent. Then, in 2020, constant-price GDP and, hence, the volume of national output fell by 10.4 per cent, as compared to a 5.8 per cent fall in current-price GDP. These global, ‘once-in-a-generation’ shocks are stark examples of the instability that characterises economies and which generate the ‘ups and downs’ in an economy’s output path, known more simply as ‘the business cycle’. (Click here to download a PowerPoint copy of the chart.)
Determinants of long-and short-term growth
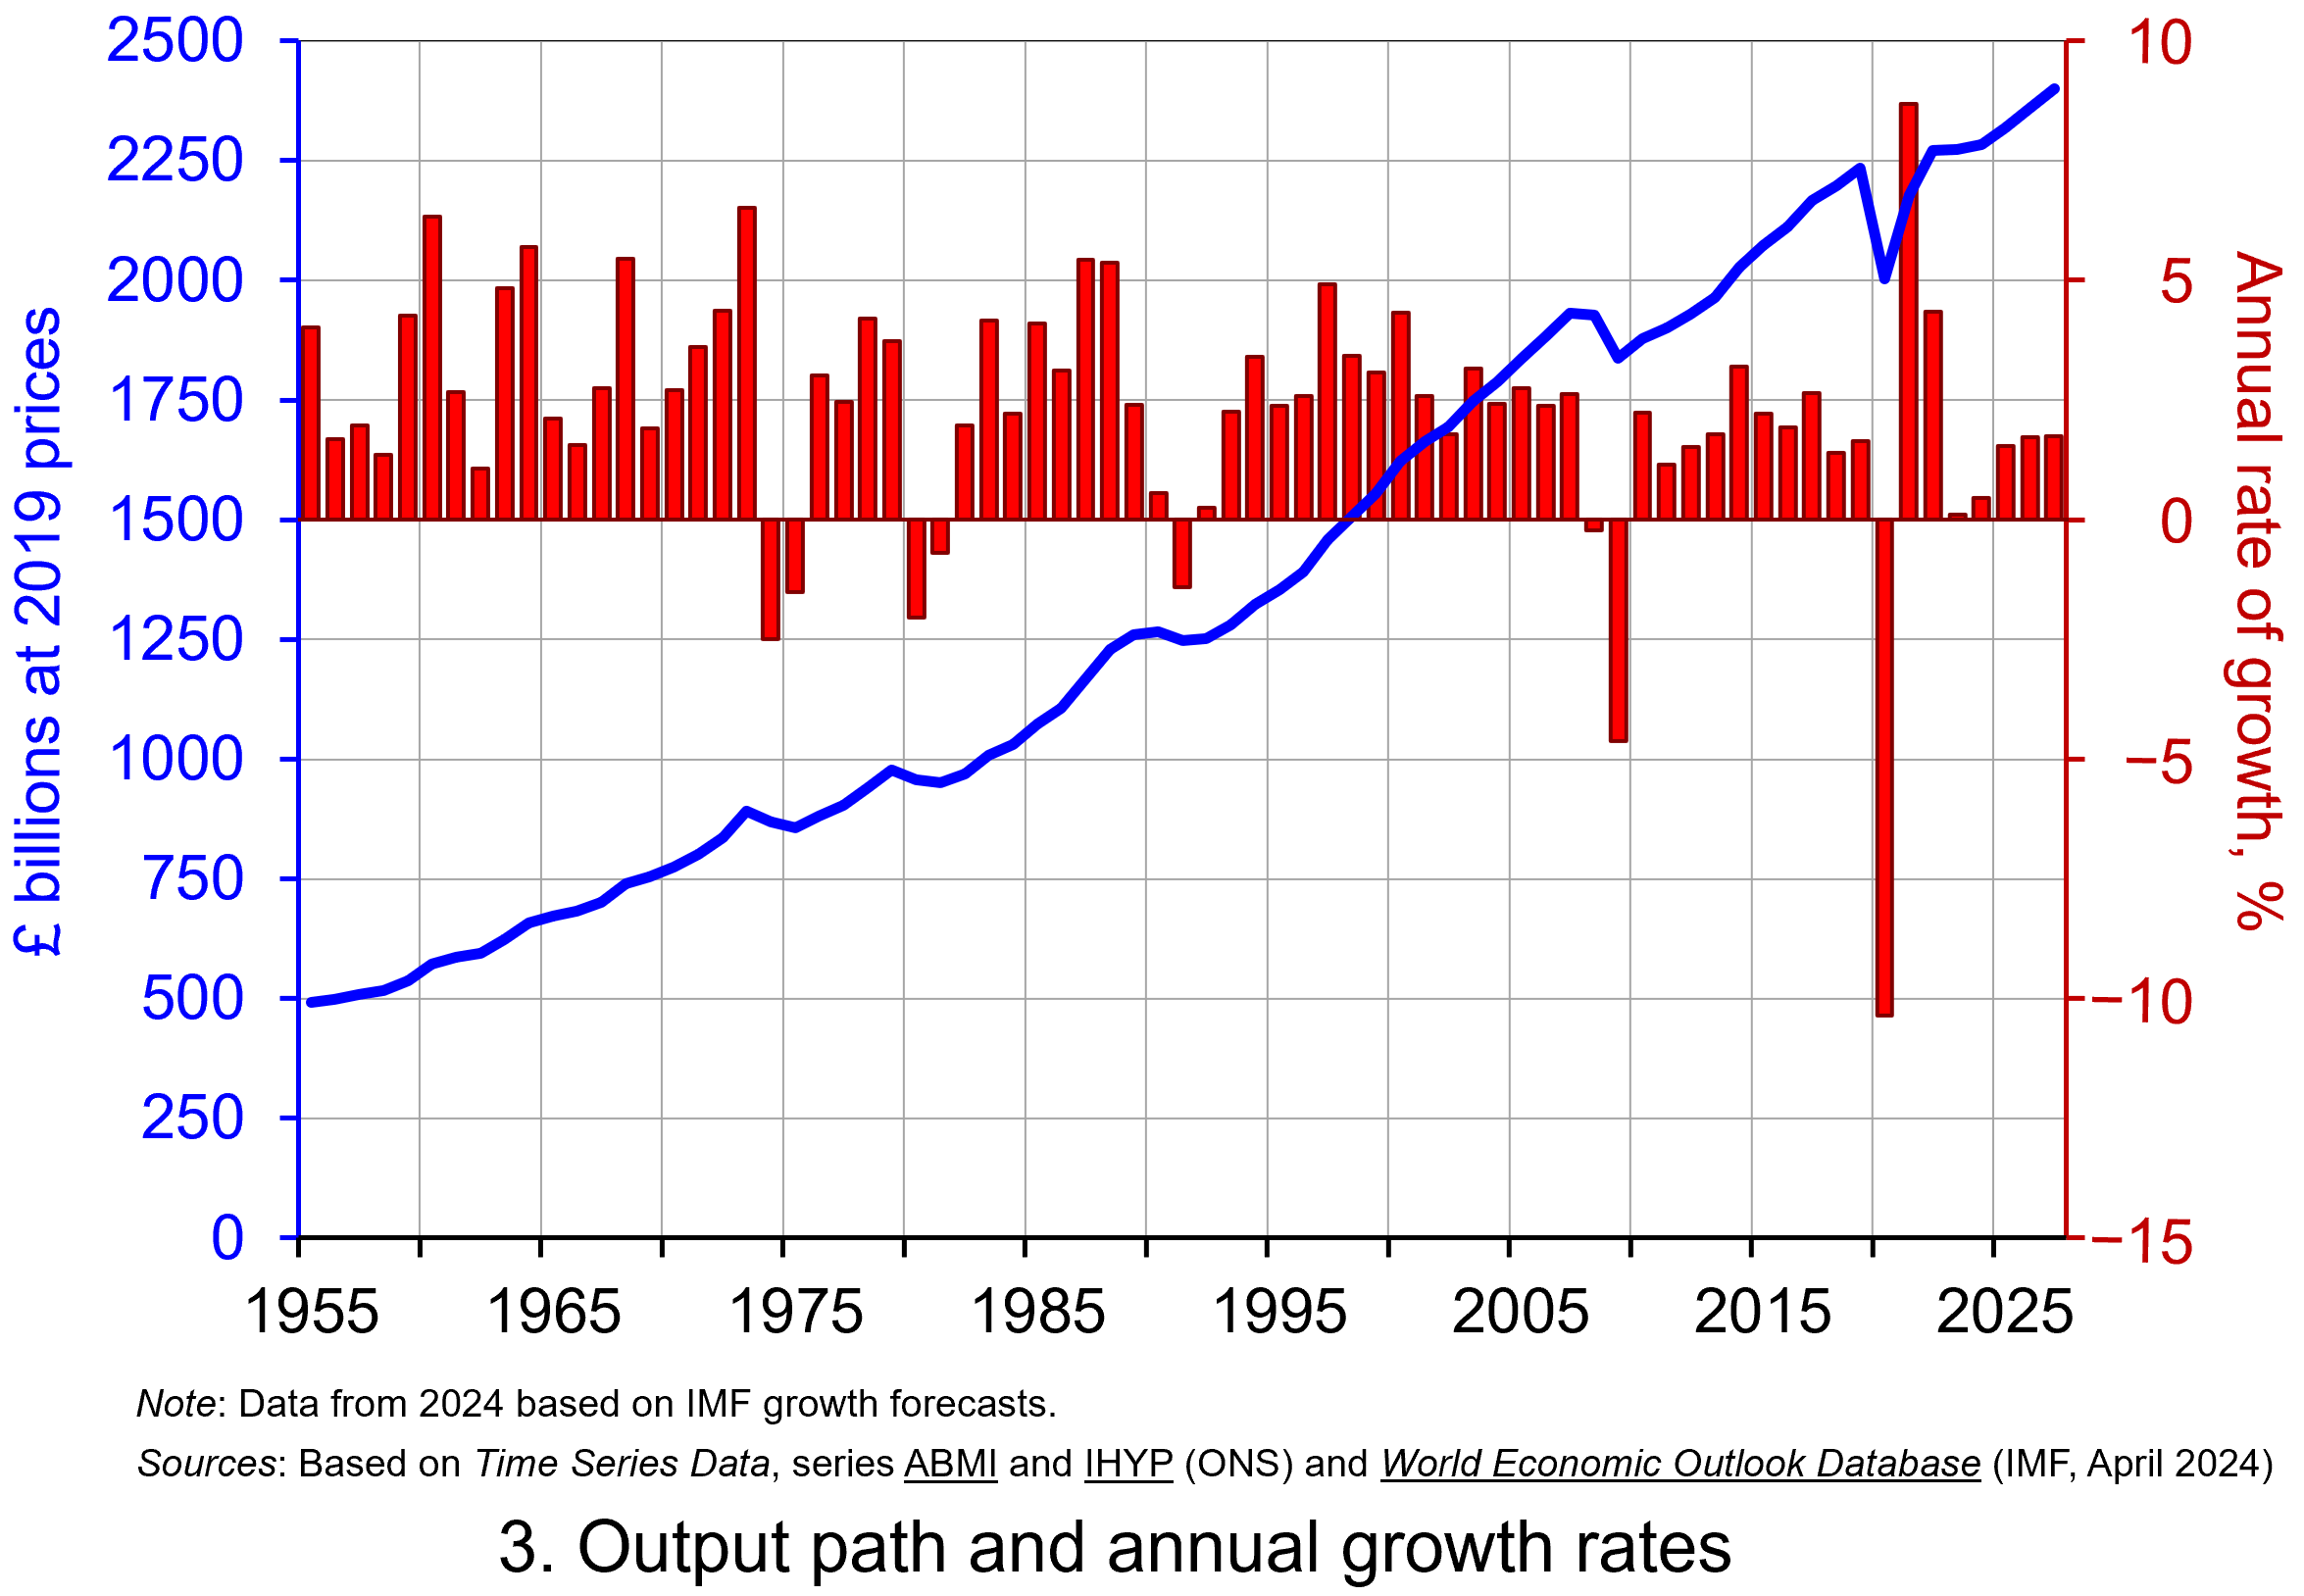 The twin characteristics of growth can be seen simultaneously by combining the output path (shown by the levels of real GDP) with the annual rates of growth. This is shown in Chart 3. The longer-term growth seen in the economy’s output path is generally argued to be driven by the quantity and quality of the economy’s resources, and their effectiveness when combined in production (i.e. their productivity). In other words, it is the supply side of the economy that determines the trajectory of the output path over the longer term. (Click here to download a PowerPoint copy of the chart.)
However, the fluctuations we observe in short-term growth rates tend to reflect shocks, also known as impulses, that originate either from the ability and or willingness of purchasers to consume (demand-side shocks) or producers to supply (supply-side shocks). These impulses are then amplified (or ‘propagated’) via the multiplier, expectations and other factors, and their effects, therefore, transmitted through the economy. Unusually in the case of the pandemic, the lockdown measures employed by governments around the world resulted in simultaneous negative aggregate demand and aggregate supply shocks.
Persistence effects
Explanations of the business cycle and of long-term growth are not mutually exclusive. The shocks and the propagation mechanisms that help to create and shape the business cycle can themselves have enduring or persistent effects on output. The global financial crisis, fuelled by unsustainable lending and the overstretch of private-sector balance sheets, which then spilt over to the public sector as governments attempted to stabilise the financial system and support aggregate demand, is argued by some to have created the conditions for low-growth persistence seen in many countries in the 2010s. This type of persistence is known as hysteresis as it originates from a negative demand shock.
Economists and policymakers were similarly concerned that the pandemic would also generate persistence in the form of scarring effects that might again affect the economy’s output path. Such concerns help to explain why many governments introduced furlough schemes to protect jobs and employment income, as well as provide grants or loans to business.
Per capita output
To finish, it is important to recognise that, when thinking about living standards, it is the growth in real GDP per capita that we need to consider. A rise in real GDP will only lead to a rise in overall living standards if it is faster than the rise in population.
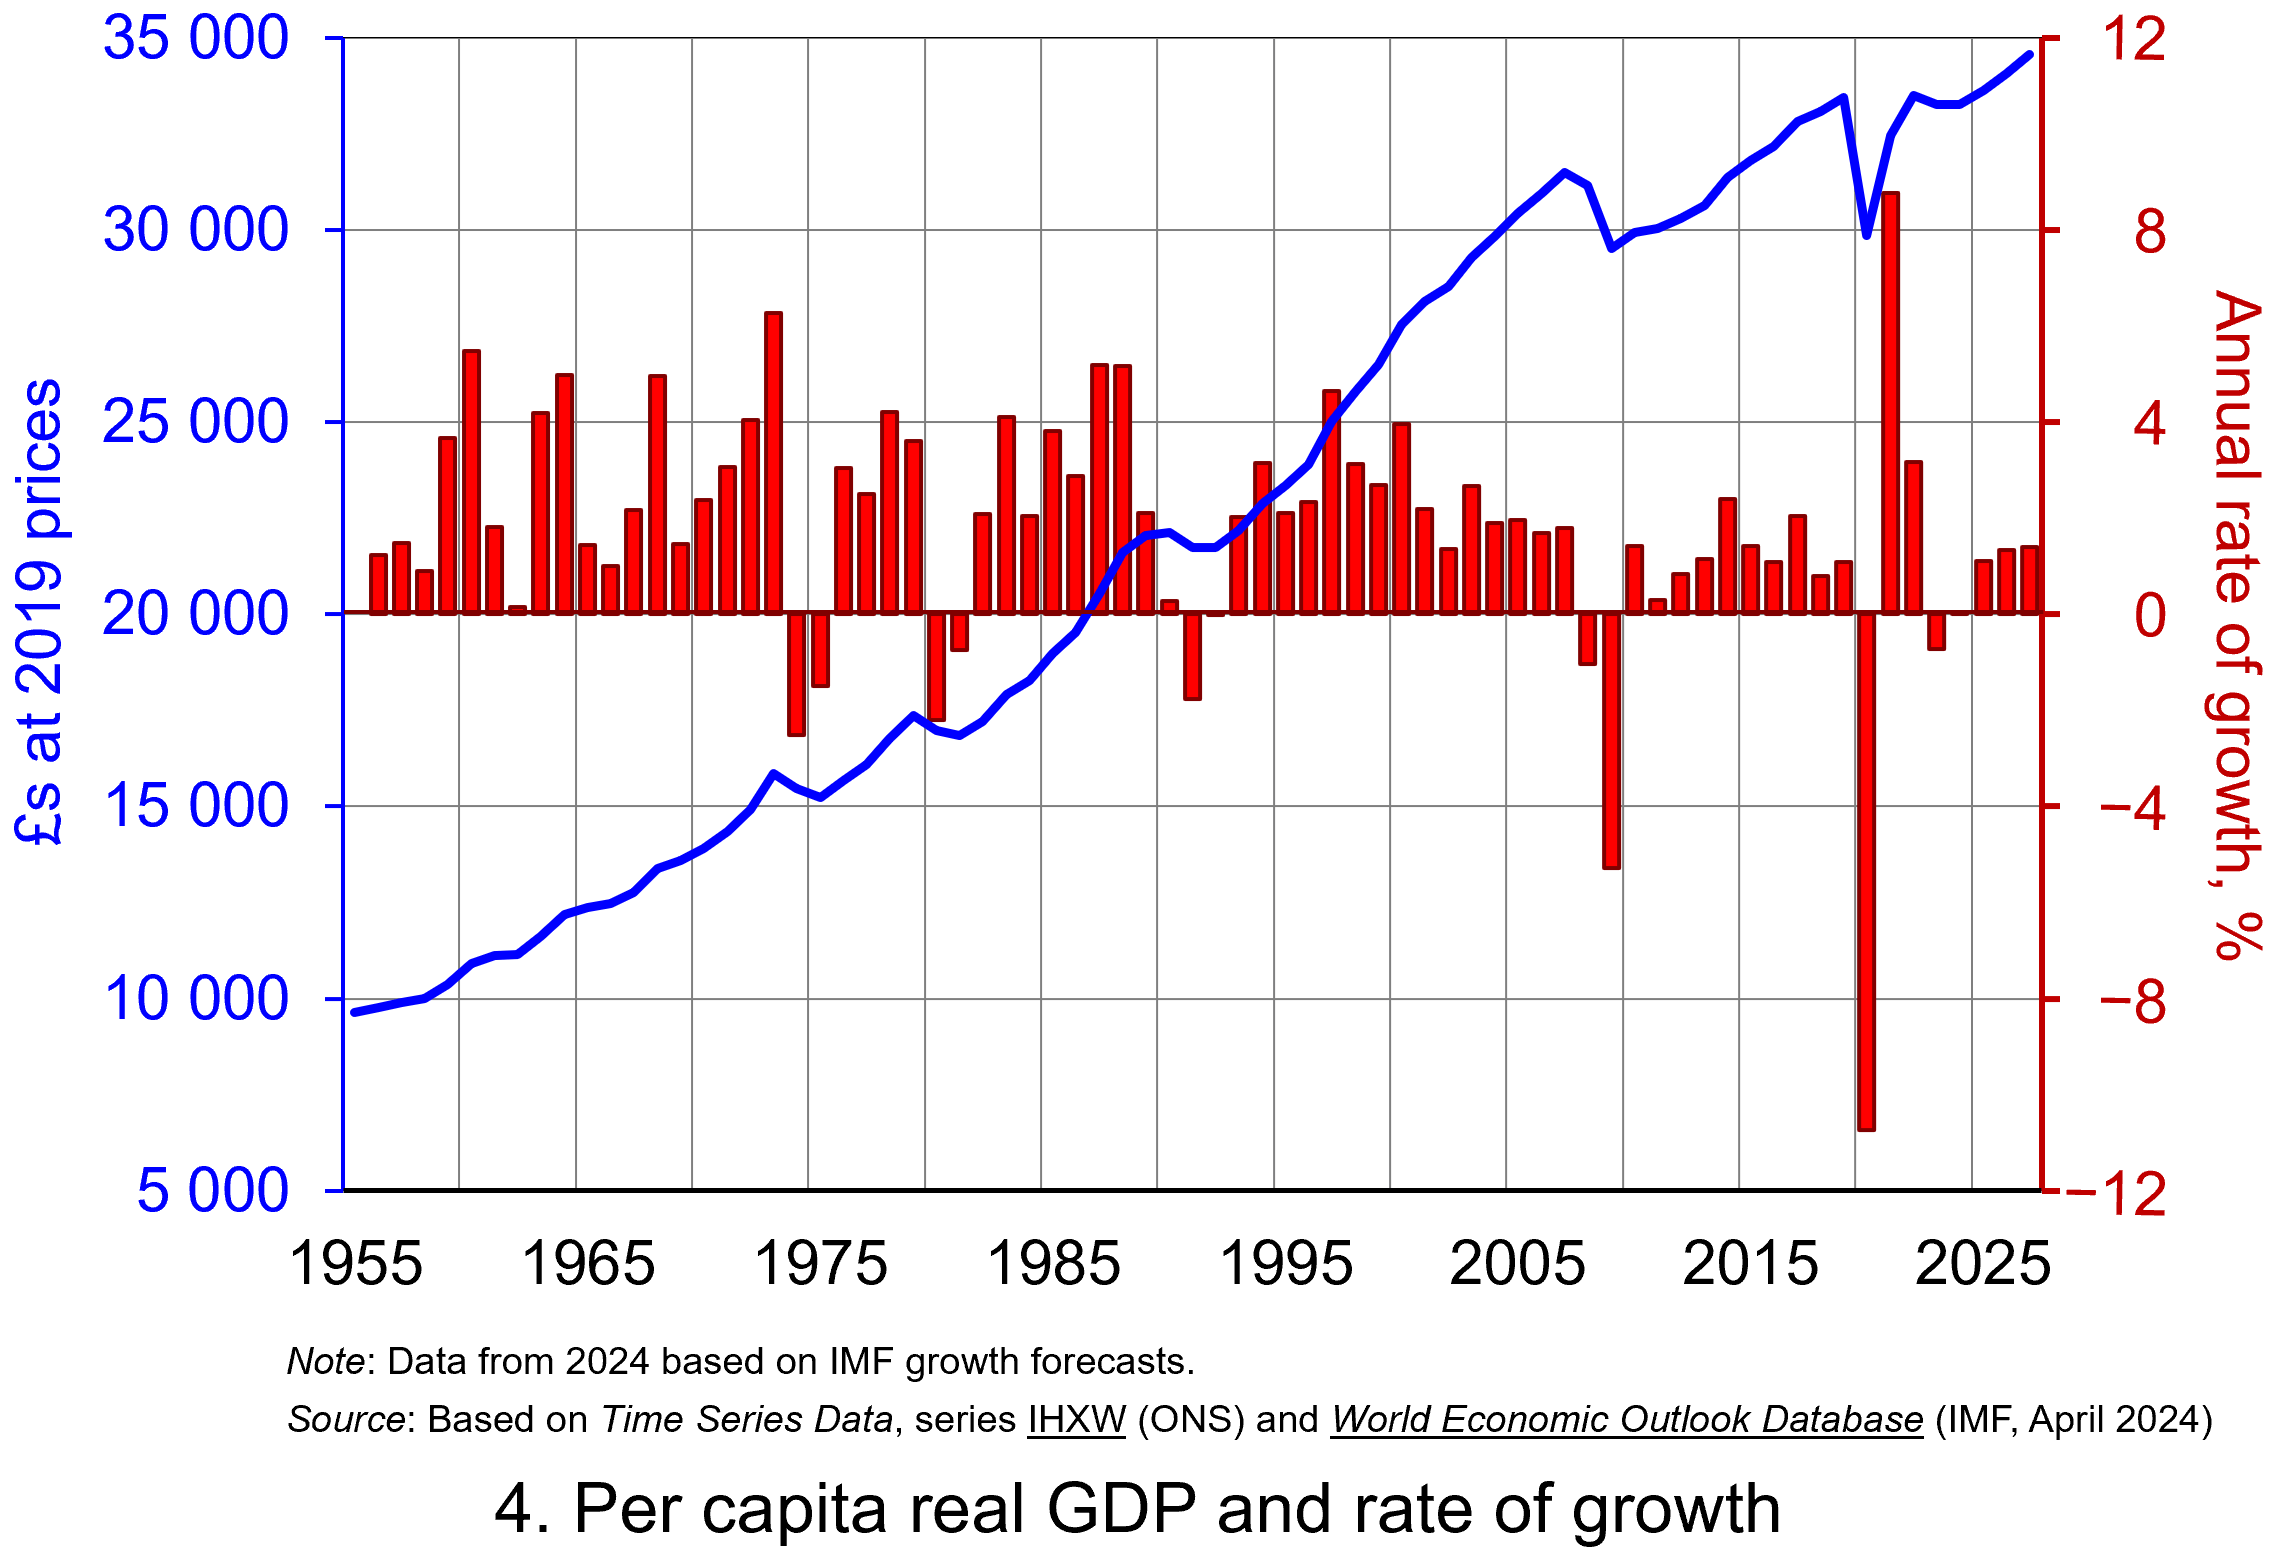 Our final chart therefore replicates Chart 3 but for real GDP per capita. Between 1955 and 2023 real GDP per capita grew by a factor of 3.45, which increases to 3.6 when we consider the period up to 2027. The average rate of growth of real GDP per capita up to 2023 was 1.87 per cent (lower than the 2.34 per cent increase in real GDP).
But the rate of increase in real GDP per capita was much higher before 2007 than it has been since. If we look at the period up to 2007 and, hence, before the global financial crisis, the figure is 2.32 per cent (2.7 per cent for real GDP), whereas from 2008 to 2023 the average rate of growth of real GDP per capita was a mere 0.42 per cent (1.1 per cent for real GDP). (Click here to download a PowerPoint copy of the chart.)
The final chart therefore reiterates the messages from recent blogs, such as Getting Real with Pay and The Productivity Puzzle, that long-term economic growth and the growth of real wages have slowed dramatically since the financial crisis. This has had important implications for the wellbeing of all sectors of the economy. The stagnation of living standards is therefore one of the most important economic issues of our time. It is one that the incoming Labour government will be keen to address.
Data and Reports
Articles
Questions
- What do you understand by the term ‘macroeconomic environment’? What data could be used to describe the macroeconomic environment?
- When a country experiences positive rates of inflation, which is higher: nominal economic growth or real economic growth?
- Does an increase in nominal GDP mean a country’s production has increased? Explain your answer.
- Does a decrease in nominal GDP mean a country’s production has decreased? Explain your answer.
- Why does a change in the growth of real GDP allow us to focus on what has happened to the volume of production?
- What does the concept of the ‘business cycle’ have to do with real rates of economic growth?
- When would falls in real GDP be classified as a recession?
- Distinguish between the concepts of ‘short-term growth’ and ‘longer-term growth’.
- What do you understand by the term ‘persistence’ in macroeconomics? Given examples of persistence effects and the means by which they can be generated?
- Discuss the proposition that the pandemic could have a positive effect on longer-term growth rates because of the ways that people and business have had to adapt.