As we saw in a recent post, Why have diesel prices risen more than petrol prices?, diesel prices have soared since the outbreak of the Iran war at the end of February this year. In the UK, they rose from around 142p just before the US/Israeli attack on Iran to over 200p by the start of October – a rise of around 42%. The rise has been aggravated by threats of Houthi attacks on oil tankers in the Red Sea, Ukrainian attacks on Russian refineries leading to a Russian diesel export ban, a Chinese diesel export ban, refinery shortages in several countries and buoyant industrial, transport and agricultural demand.
 The hope was that the gradual reopening of the Strait of Hormuz would ease oil prices. But despite oil flows increasing from the Gulf, prices have not eased. And with the November mid-term elections approaching in the USA, the Trump administration has been threatening to cut off US diesel exports and divert diesel supplies to the domestic market, thereby reducing diesel prices in the USA. The threats were to put pressure on European countries to tap into their own emergency stocks to ease global diesel prices. By the beginning of October, diesel futures were at record prices.
Then on Friday 2 October, the Group of Seven (G7) nations gave in to pressure from the USA (one of the G7). Co-ordinated by the International Energy Agency (IEA), the G7 announced the release over the next four months of 100 million barrels from reserves, partly of diesel and partly of crude oil. The release would be front loaded to put immediate downward pressure on diesel prices. President Trump stated that a major proportion would be from European stockpiles.
 The IEA had already organised the release of 400 million barrels from stockpiles back in March. However, not all were released because, at the time, the USA was flooding the market with its own diesel to keep the market price down. By the beginning of October, 75 million barrels had yet to be released, but were still considered ‘available’. The new G7 announcement did not make clear whether the 100 million barrels would be in addition to the March agreement or would involve only an additional 25 million barrels.
This promise of an increase in supply had an immediate effect, with US diesel futures falling by around 4.5% and European diesel futures by around 6.5%. But, within a week futures prices were rising again. The extra diesel promised was seen as too little.
Then, on Friday 9 October, in an attempt to drive down diesel prices in the USA, President Trump announced a deal with President Putin. Russia would immediately supply 300,000 tonnes of diesel to the American and global markets, followed by 500,000 tonnes by the end of the month, followed by 1 million and then 3 million more tonnes shortly thereafter. To achieve this, US sanctions against Russian oil exports would be suspended until 7 April 2027.
 This was widely condemned by US Democrats and US allies as providing financial support to Russia for its war against Ukraine. But it was also criticised for being unlikely to bring diesel prices down.
First, there were the logistical difficulties of shipping the Russian oil, let alone Russia’s depleted stocks. In fact, Russia had already instituted a total domestic export ban on diesel to protect its own supplies. There are serious doubts, therefore, as to whether Russia can deliver these additional volumes.
Then there was the size of the deal. The world consumes roughly 840 million to 900 million barrels of diesel per month. In the US context, the initial 300,000 tonnes represents just three-quarters of a single day’s US consumption.
Unless the conflicts and other causes of the underlying shortage of diesel are resolved, the extra diesel will provide only a temporary relief from high prices. Indeed, when markets opened on Monday 12 October, diesel futures prices did not fall but edged upwards and then rose more rapidly the next day.
Articles
 UK diesel prices top £2 a litre for first time, RAC says
BBC News, Lucy Hooker and Archie Mitchell (2/10/26)
- G7 to release millions of barrels of oil and diesel after Trump threat
BBC News, Archie Mitchell and Lucy Hooker (3/10/26)
- Will diesel prices go down? Trump says Europe to draw on reserves
USA Today, Miles J Herszenhorn (2/10/26)
- G7 countries agree on release of diesel and oil stocks after US pressure
Reuters, Kate Abnett and Jarrett Renshaw (2/10/26)
- IEA says 325 million barrels of emergency oil released, with 75 million still to come
Euronews, Simon Ormiston (3/10/26)
- Europe to release ‘massive amount of diesel’ after Trump’s supply threat
Independent, Athena Stavrou (3/10/26)
- Diesel price set to fall after Europe releases supplies
Daily Business, Terry Murden (3/10/26)
- Exclusive: Trump’s Diesel Price Dilemma Isn’t About Supply — Expert Says It’s Because ‘Fuel is in the Wrong Place’
Trading View (3/10/26)
- Trump-Putin Diesel Deal Unlikely To Reduce Prices
Forbes, Ariel Cohen (12/10/26)
- Trump turns to Russian diesel ahead of midterms, but analysts see little price relief
CNBC, Mike Sheen (12/10/26)
- Diesel futures jump, signaling higher prices to come despite Trump’s Russia deal
NBC News, Steve Kopack (13/10/26)
Videos
Data
Questions
- What will determine the size of the effect of the G7’s decision to release stocks of diesel and crude oil?
- How do expectations affect diesel prices – both spot and future prices?
- Why would a diesel export ban by the Trump administration have only a minimal effect on diesel prices in much of the USA?
- Why is lifting sanctions against Russian diesel exports likely to have only a minimal effect on diesel prices?
- What determines the price elasticity of demand for diesel in (a) the short run; (b) over a few years?
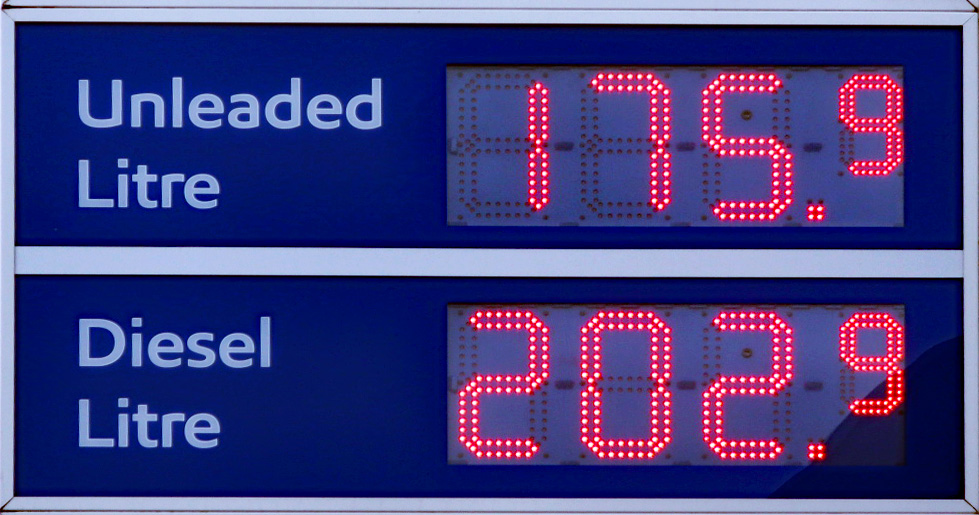
From the start of the American and Israeli war with Iran on 28 February 2026 to 30 September – a period of just seven months – the retail price of petrol in the UK has risen by approximately 43p, from around 132p to 175p per litre – a rise of 33%. In contrast, the price of diesel has risen by approximately 59p, from around 142p to 201p per litre – a rise of 42%. (See also the October 12 post, Diesel prices: an update)
In several other countries the percentage difference is greater still, particularly in countries where fuel taxes are lower and thus the wholesale cost of the fuel is a larger percentage of the pump price. In the USA, for example, petrol (gasoline) prices have risen by around 38%, whereas diesel prices have risen by around 73%.
But why have diesel prices risen by more than petrol prices? The answer has to do with supply and demand.
Supply
 Greater effect of the Iran war on diesel supplies. The closing of the Strait of Hormuz has drastically cut the supply of oil from the Gulf states. This is being compounded by the Houthi attacks on Saudi shipping in the Red Sea. This has forced Saudi oil that is transported by pipeline to the Red Sea and destined for countries east of Saudi Arabia to be transported north via the Suez canal rather than south through the Bab al-Mandab Strait. This has been made worse by attacks launched from Iraq on the Saudi oil pipeline.
Middle Eastern crude oil’s composition is the most efficient for refining high-quality diesel. The restriction on exports, both of crude oil and of diesel from Gulf refineries, has thus affected diesel supplies more than petrol supplies.
Effect of Ukraine war. Ukraine has been launching drone attacks on Russian refineries, mainly producing diesel. The resulting shortage of diesel within Russia has led it to impose a ban on diesel exports, extended at least to the end of 2026, to limit the effects on supplies for the military and for domestic users. Russia has historically been the world’s second-largest diesel exporter and the ban has reduced the world’s supply of seaborne diesel by around 12%.
Low diesel stocks. Stocks of diesel have been run down and this has meant that there is little flexibility to draw them down further.
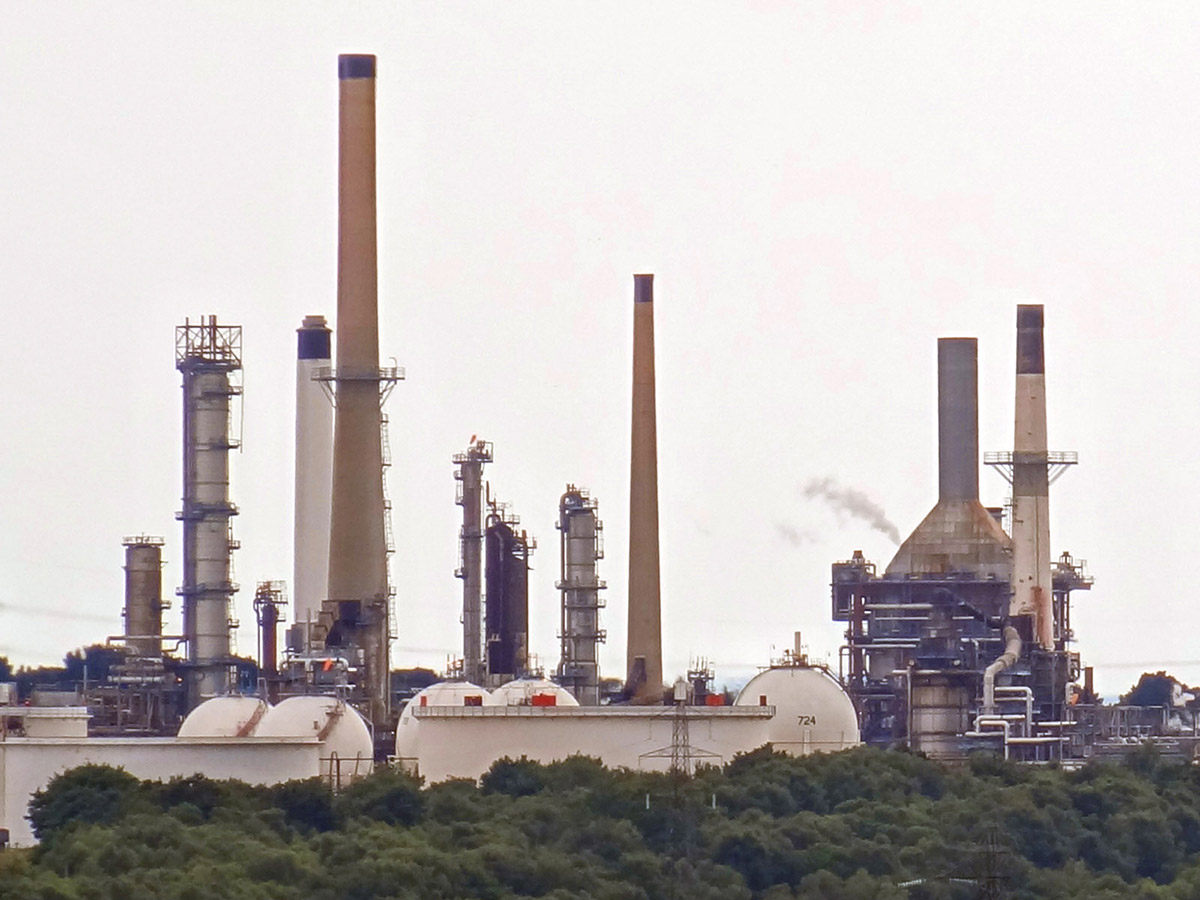 Refinery constraints. Refineries cannot instantly alter their output to produce more diesel. Furthermore, diesel has become more expensive to produce in recent years due to the transition to ultra-low sulphur diesel to meet stricter environmental standards. This makes the supply of diesel relatively price inelastic, exaggerating the effect on price.
UK refineries produce more petrol than the domestic market requires, making the UK a net exporter of petrol. This higher self-sufficiency partially shields domestic petrol prices from global shocks. However, the UK does not refine enough diesel to meet domestic demand. It relies heavily on foreign imports to cover the shortfall. Thus diesel prices in the UK are more subject to global price increases.
Demand
Seasonal demand spikes. The demand for diesel tends to rise in late summer due to extra agricultural demand for autumn crop harvests.
 Low price elasticity of demand. Unlike petrol, which is primarily consumed by individuals who can choose to drive less when prices rise, diesel is essential to industrial economies. It powers lorries, ships, buses, trains, agricultural machinery, mining equipment and many industrial machines. Because businesses must keep moving goods, farming crops and running machines, global demand for diesel is little affected by rising prices. This low price elasticity of demand results in a bigger price rise for every reduction in supply than is the case for petrol.
What is more, the transition to EVs has been greater for cars than for lorries, although many buses and vans are now electric. The electrification of the railways, however, is too long-term a project to affect short-term diesel prices and electric lorries are still in their infancy. But with rapid development of electric alternatives underway in the haulage and industrial machinery sectors, they may become less reliant on diesel in the relatively near future.
Articles
- Petrol and diesel prices hit highest since 2022
BBC News (14/9/26)
- Diesel prices hit new record in September 2026: What that means for inflation, shipping costs and your portfolio
J.P.Morgan, Sergei Klebnikov (15/9/26)
- Iran war pushes diesel – the economy’s lifeblood – to record high prices, with no relief on the horizon
The Conversation, Morgan Bazilian and Jamie Webster (18/9/26)
- Diesel costs more than $6 a gallon for the first time. Here’s how that affects you
CNN, Chris Isidore and Matt Egan (12/9/26)
- Why is diesel more expensive than petrol in Australia?
NRMA, Sam Charlwood (9/4/26)
- Diesel Prices Surge as Global Supplies Tighten
Farm Bureau Intel, Faith Parum (17/9/26)
- Why has diesel increased so much more than unleaded?
PetrolPrices (11/3/26)
- Disparity between diesel and petrol prices reaches record-breaking levels
FleetNews, Gareth Roberts (30/3/26)
- Diesel and petrol hit four-year high fuelling inflation concerns
FleetNews, Gareth Roberts (15/9/26)
- EU says Trump plan to ban US diesel exports would ‘negatively impact both sides’
The Guardian, Jillian Ambrose (25/9/26)
Videos
Questions
- Draw a demand and supply diagram for diesel and petrol to illustrate the effects discussed in this blog.
- Is the demand for diesel likely to be more elastic over the longer term? Explain.
- Compare the effects on diesel prices in the UK with one other country of your choice. How similar are the factors affecting the relative price increases in diesel and petrol in the two countries?
- Would cutting taxes on diesel solve the problem of higher prices for diesel users?
- How has the cost of heating oil and aircraft fuel changed compared to that of petrol and diesel? Explain.
- What would be the effects on diesel prices in the UK and the USA if Donald Trump carried out his potential plan to ban US exports of diesel?

The prices of many species of fish have risen in recent months. Coastal pelagic fish, such as mackerel, herring and sardines have risen especially rapidly. Mackerel, once seen as a cheap source of protein, is no longer quite such a ‘bargain’.
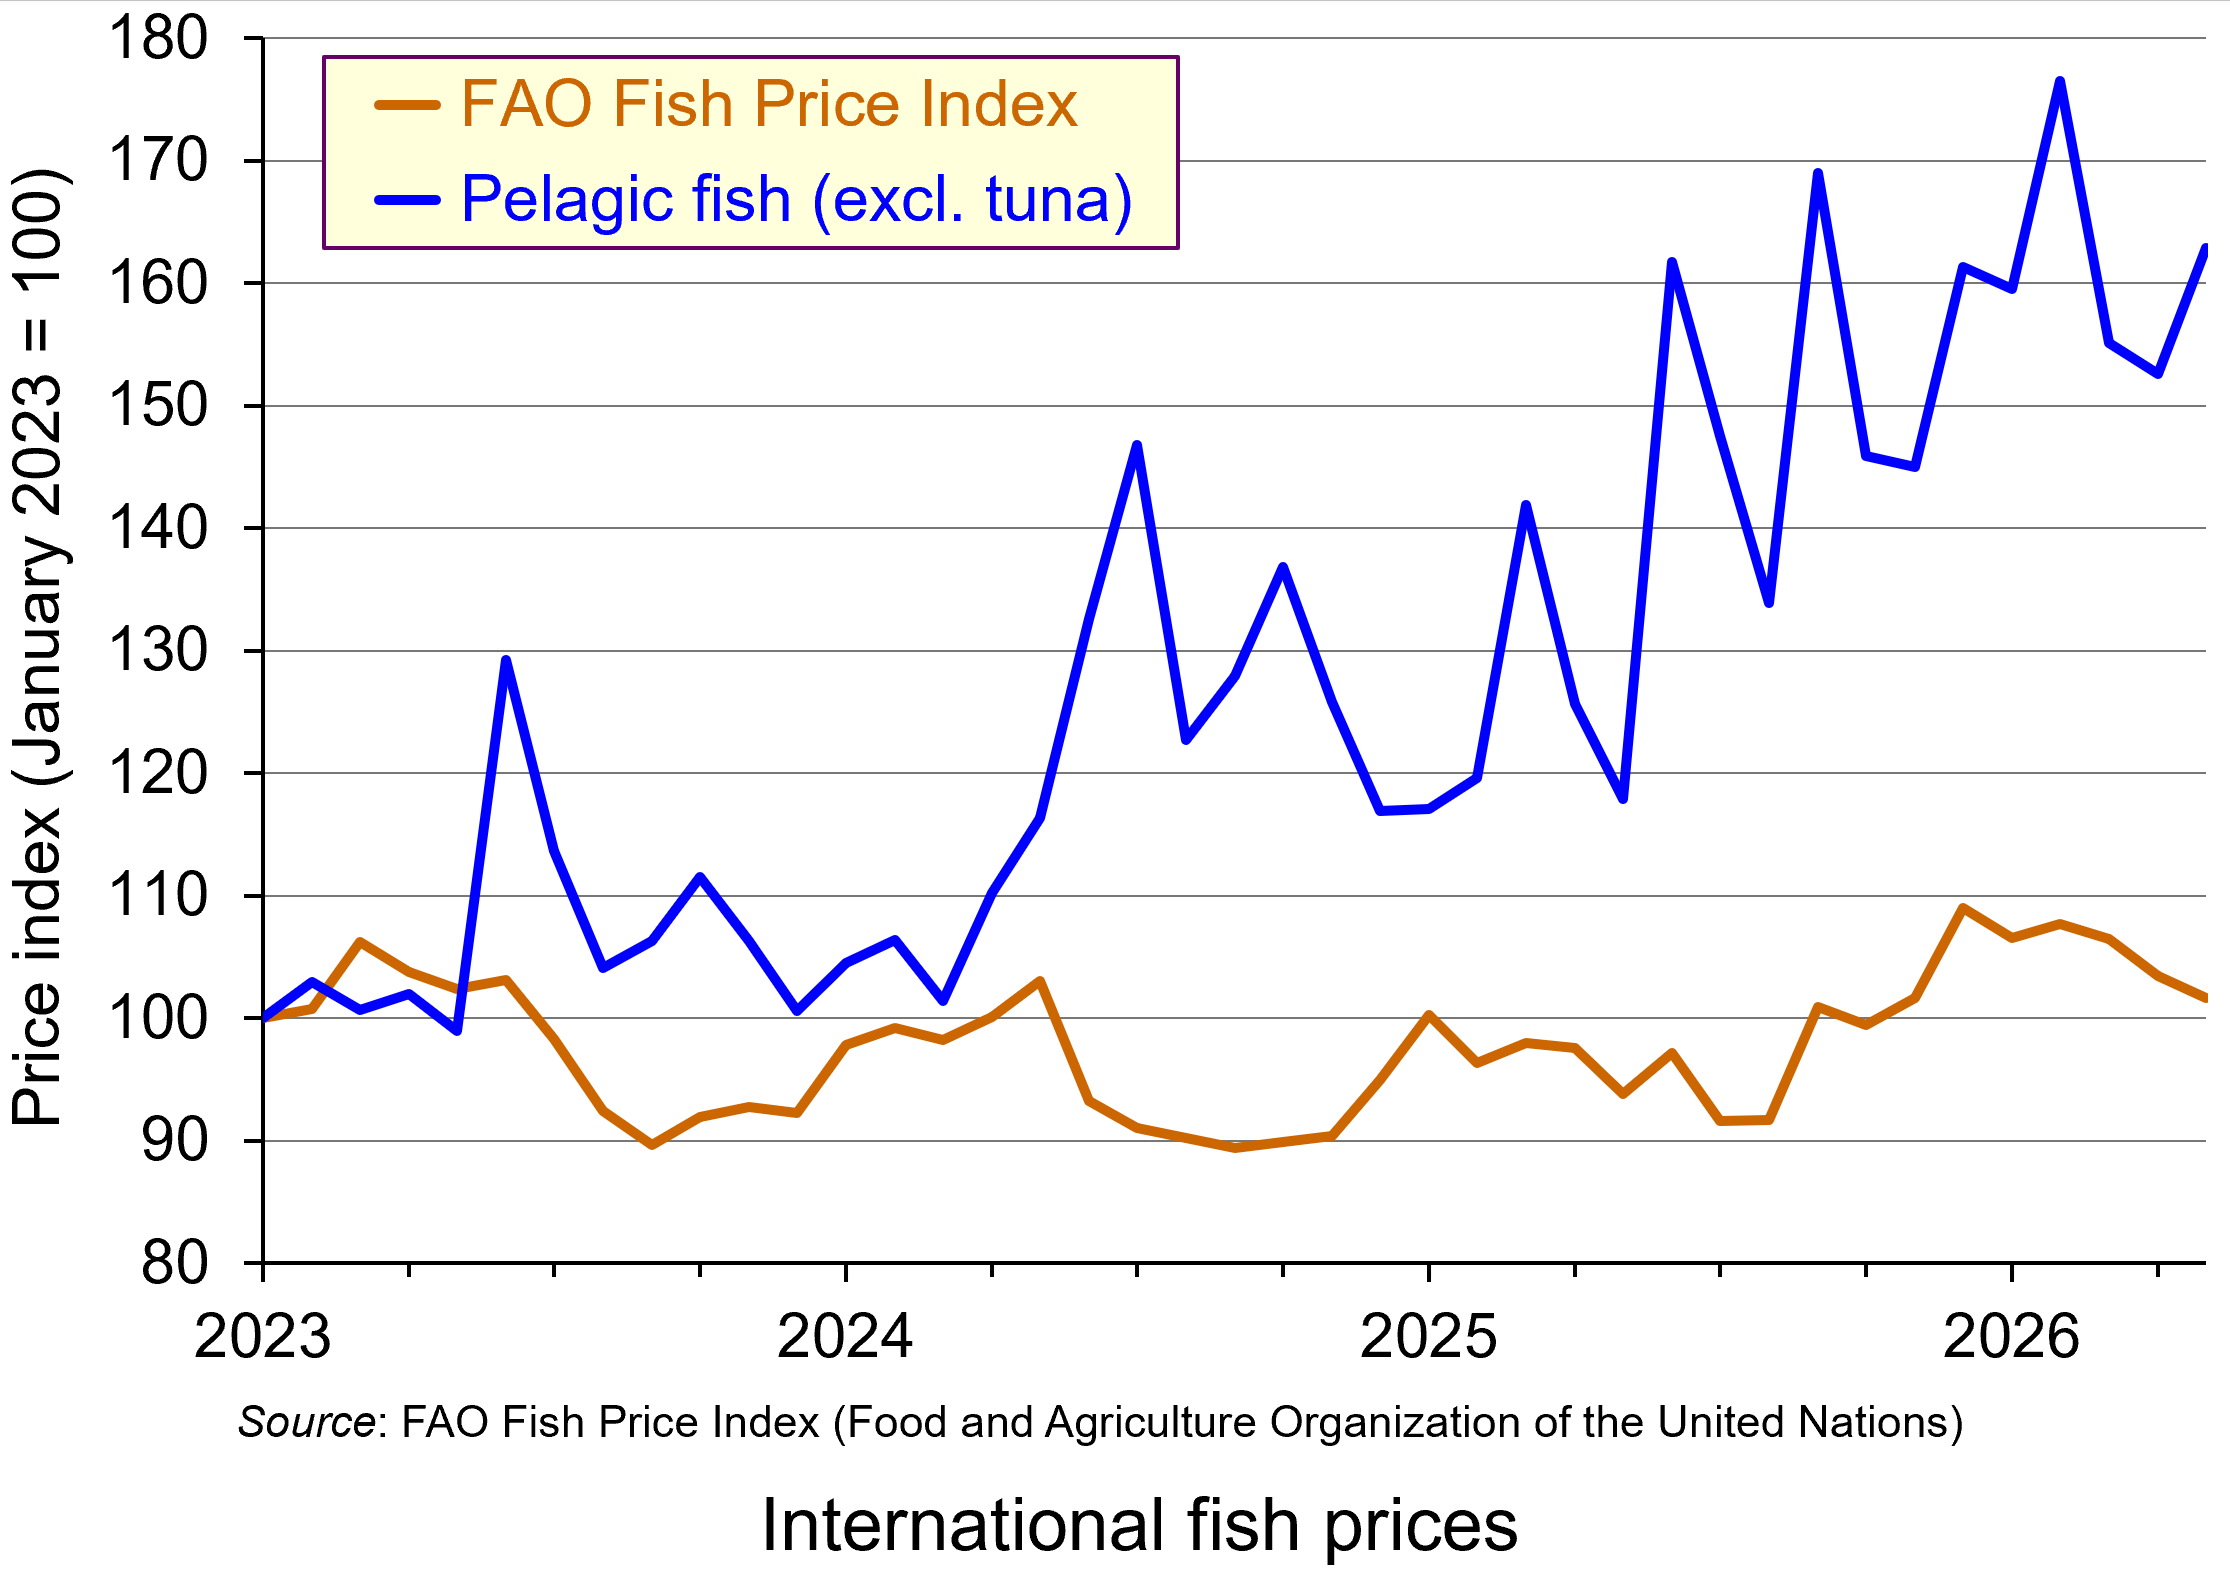 From January 2023 to May 2026, the international price index of pelagic fish rose by 69%. In 2025, UK supermarket fresh, chilled smoked and tinned mackerel prices rose by an average of 25%; and over the first part of 2026, some tinned mackerel product lines have increased by as much 55%. In February 2026, Waitrose announced that it would suspend sales of fresh and chilled mackerel and tinned mackerel once current stocks had been cleared. It cited overfishing and sustainability concerns.
Supply and demand
But why have mackerel prices risen so much? The price of fish is determined by demand and supply. So what has changed? The main changes have been on the supply side.
Supply. Most of the world’s supply of mackerel comes from the Northeast Atlantic. These waters have been overfished for many years, thereby depleting the stock of the fish and reducing the amount of mackerel caught.
 To arrest the decline and allow stocks to rebuild, the International Council for the Exploration of the Sea (ICES) recommended a quota of 174,357 tonnes for 2026. This would represent a 70% cut from 2025. The main fishing countries – Norway, the UK, the Faroe Islands and Iceland – eventually agreed to a quota of 299,010 tonnes: a cut of 48%. After a series of bilateral agreements between the four countries over access to each other’s waters, this resulted in the following quota shares: UK 30.55%, Norway 26.4%, Faroes 12% and Iceland 10.5%. The remaining 20.55% would be for the EU, Greenland and Russia.
Despite these other countries not being part of the deal, in May 2026 the EU agreed to reduce its catch by 48% too. Russia, however, set its own quota of 67,548 tonnes, which is 22.6% of the total 299,010 quota, above the 20.55% set aside for the EU, Russia and Greenland combined and almost almost five times Russia’s historic quota share! The UK, EU and Iceland responded by agreeing to bar Russian vessels carrying mackerel from entering their ports.
The quotas have added to the decline in supply, even though the aim is to increase supply in the future as stocks are rebuilt. In May this year, the Norwegian catch was down nearly 85% – well below the 48% reduction in the quota.
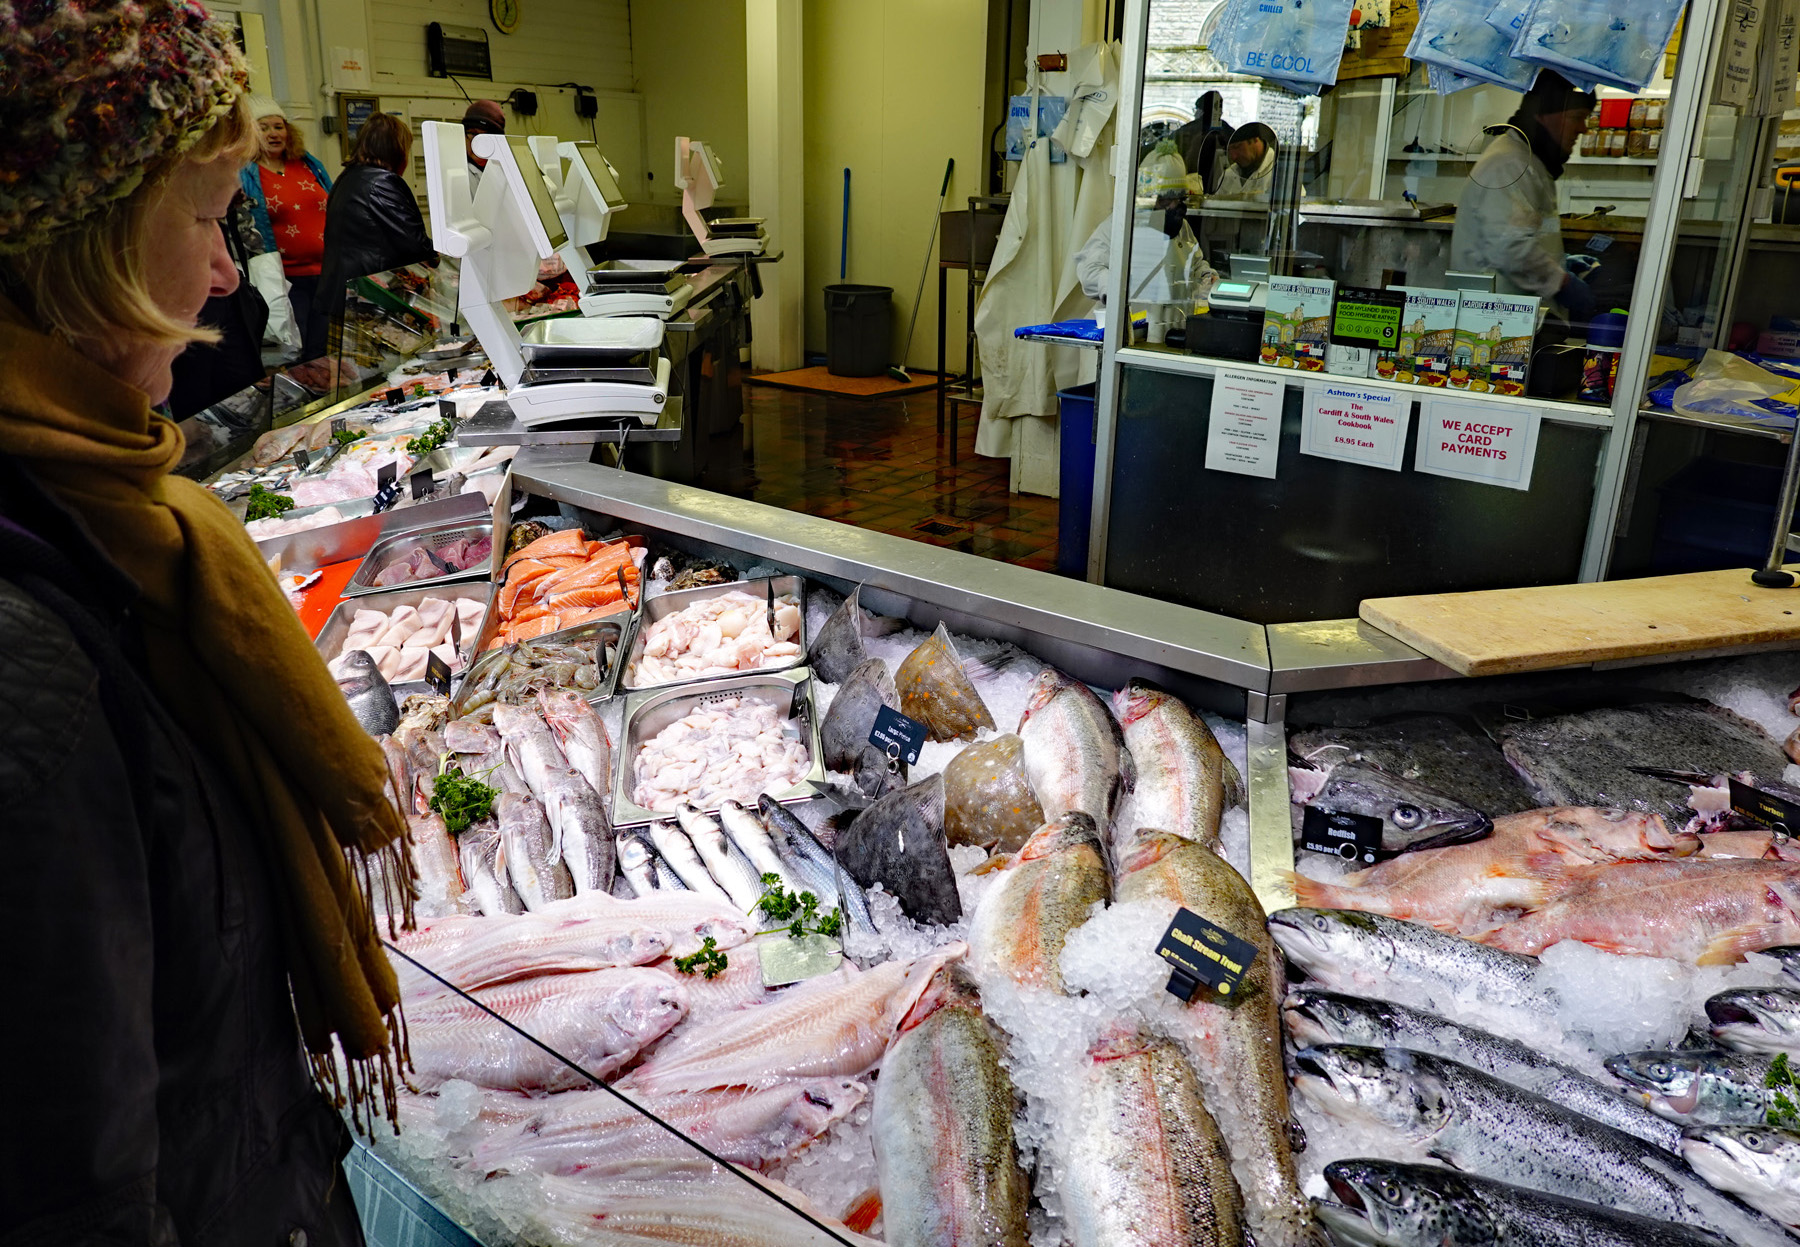 Demand. Despite higher prices, demand has remained strong. Part of the reason is that demand is relatively inelastic. This is because, despite its increase in price, mackerel remains a relatively cheap fish and thus there is little option to switch to cheaper alternative fish. Indeed, with other fish going up in price, and meat too, some people may even switch to mackerel.
Another reason for strong demand is the growing market outside Europe, especially in southeast Asia, China, South Korea and Japan. In some of these countries, mackerel is seen as a luxury fish and people are prepared to pay higher prices, making demand relatively inelastic but at the other end of the market. In 2025, imports of frozen whole mackerel into the region rose by nearly 9%, despite rising prices.
However, Norwegian exports to the region have been falling, reflecting lower quotas in 2025 and lower still in 2026. This has further exacerbated the rise in price and intensified competition between Asian importers. For example, in July 2026, Korea sent a ‘mackerel envoy’ to Norway and other major exporters to seek to secure additional supplies.
The future
With supply restricted by declining stocks and tighter quotas, and with a price inelastic and growing demand, the high prices of mackerel in all forms look set to last – at least until stocks rebuild and quotas can be relaxed. But, with total quotas well above the level suggested by the ICES, rebuilding could take a long time.
Articles
- Norwegian Mackerel Prices Drive Record Pelagic Values in 2025
The Fishing Daily, Oliver McBride (25/5/26)
- Mackerel prices soar as demand and supply pressures take hold
The Grocer, Charles Elliman (23/1/26)
- Mackerel Prices Have Broken Historical Highs And May See Another Surge in 2026
Caharbor Import and Export Co., Ltd, China (12/1/26)
- Waitrose to suspend mackerel sales due to overfishing concerns
BBC News, Emer Moreau (27/2/26)
- Holy mackerel! The fish Waitrose removed from its shelves
Epigram (University of Bristol student newspaper), Grace Golby (6/6/26)
- Four Northeast Atlantic coastal parties agree on 2026 mackerel quotas, shares; EU left out again
SeafoodSource, Regin Winther Poulsen (17/12/25)
- EU Raises Mackerel Quotas despite Scientific Overfishing Warnings
The Fishing Daily, Oliver McBride (30/3/26)
- High Mackerel Prices Reshape Asian Small Pelagic Trade
The Fishing Daily, Oliver McBride (2/6/26)
- Korea dispatches ‘mackerel envoy’ to Norway as prices spike
Korea JoongAng Daily, Ahn Hyo-Seong (6/7/26)
- Norwegian Mackerel Supply Plunges, Korean Catch Regains Price Edge
Seoul Economic Daily, Nam Yoon-jung (28/6/26)
- Geopolitical unrest, currency effects and quota cuts led to a decline in the value of Norwegian seafood exports in the first half of the year
Norwegian Seafood Council, Press Release (3/7/26)
- Norwegian Seafood Exports: Frozen Mackerel and Herring Prices Surge in Week 26 of 2026
IndexBox (1/7/26)
- New sanctions on Russia following huge unilateral increase in mackerel quota
Fishing News, Steve Mackinson (9/7/26)
Data
Questions
- Draw a supply and demand diagram to illustrate what has happened to mackerel prices.
- What is the effective price elasticity of supply of mackerel?
- Why is demand for mackerel relatively price inelastic in the UK, except when prices rise above a certain level?
- Why is demand for mackerel relatively price inelastic in certain Asian countries, such as Japan and South Korea?
- In which country is demand for mackerel likely to be more income elastic: the UK or Japan?
- Under what circumstances might the price of mackerel in five years’ time be (a) higher than now; (b) lower than now? What will determine which is more likely?
- Should other supermarkets follow Waitrose’s lead in stopping the sale of mackerel?
- What is the ‘tragedy of the commons’? Why is a common resource such as fish in the open seas likely to result in the tragedy?
 With relentless bombing of Iran by Israel and the USA, and with Iranian counterattacks on Gulf states, the costs of the war are mounting. The most obvious are in terms of human lives, injuries and suffering. But there are significant economic costs too. Some of these are immediate, such as the rising price of oil and hence the costs of fuel, or the fall in stock market prices. Some will be longer term, depending on how the war develops. For example, prices could rise more generally as supply chains are disrupted.
 The impacts will vary across the world and across markets. The most obvious markets to be affected are those where significant supply comes from the Persian Gulf. Approximately 20% of total global oil consumption passes through the Strait of Hormuz, which connects the Persian Gulf with the Arabian Sea and the Indian Ocean.
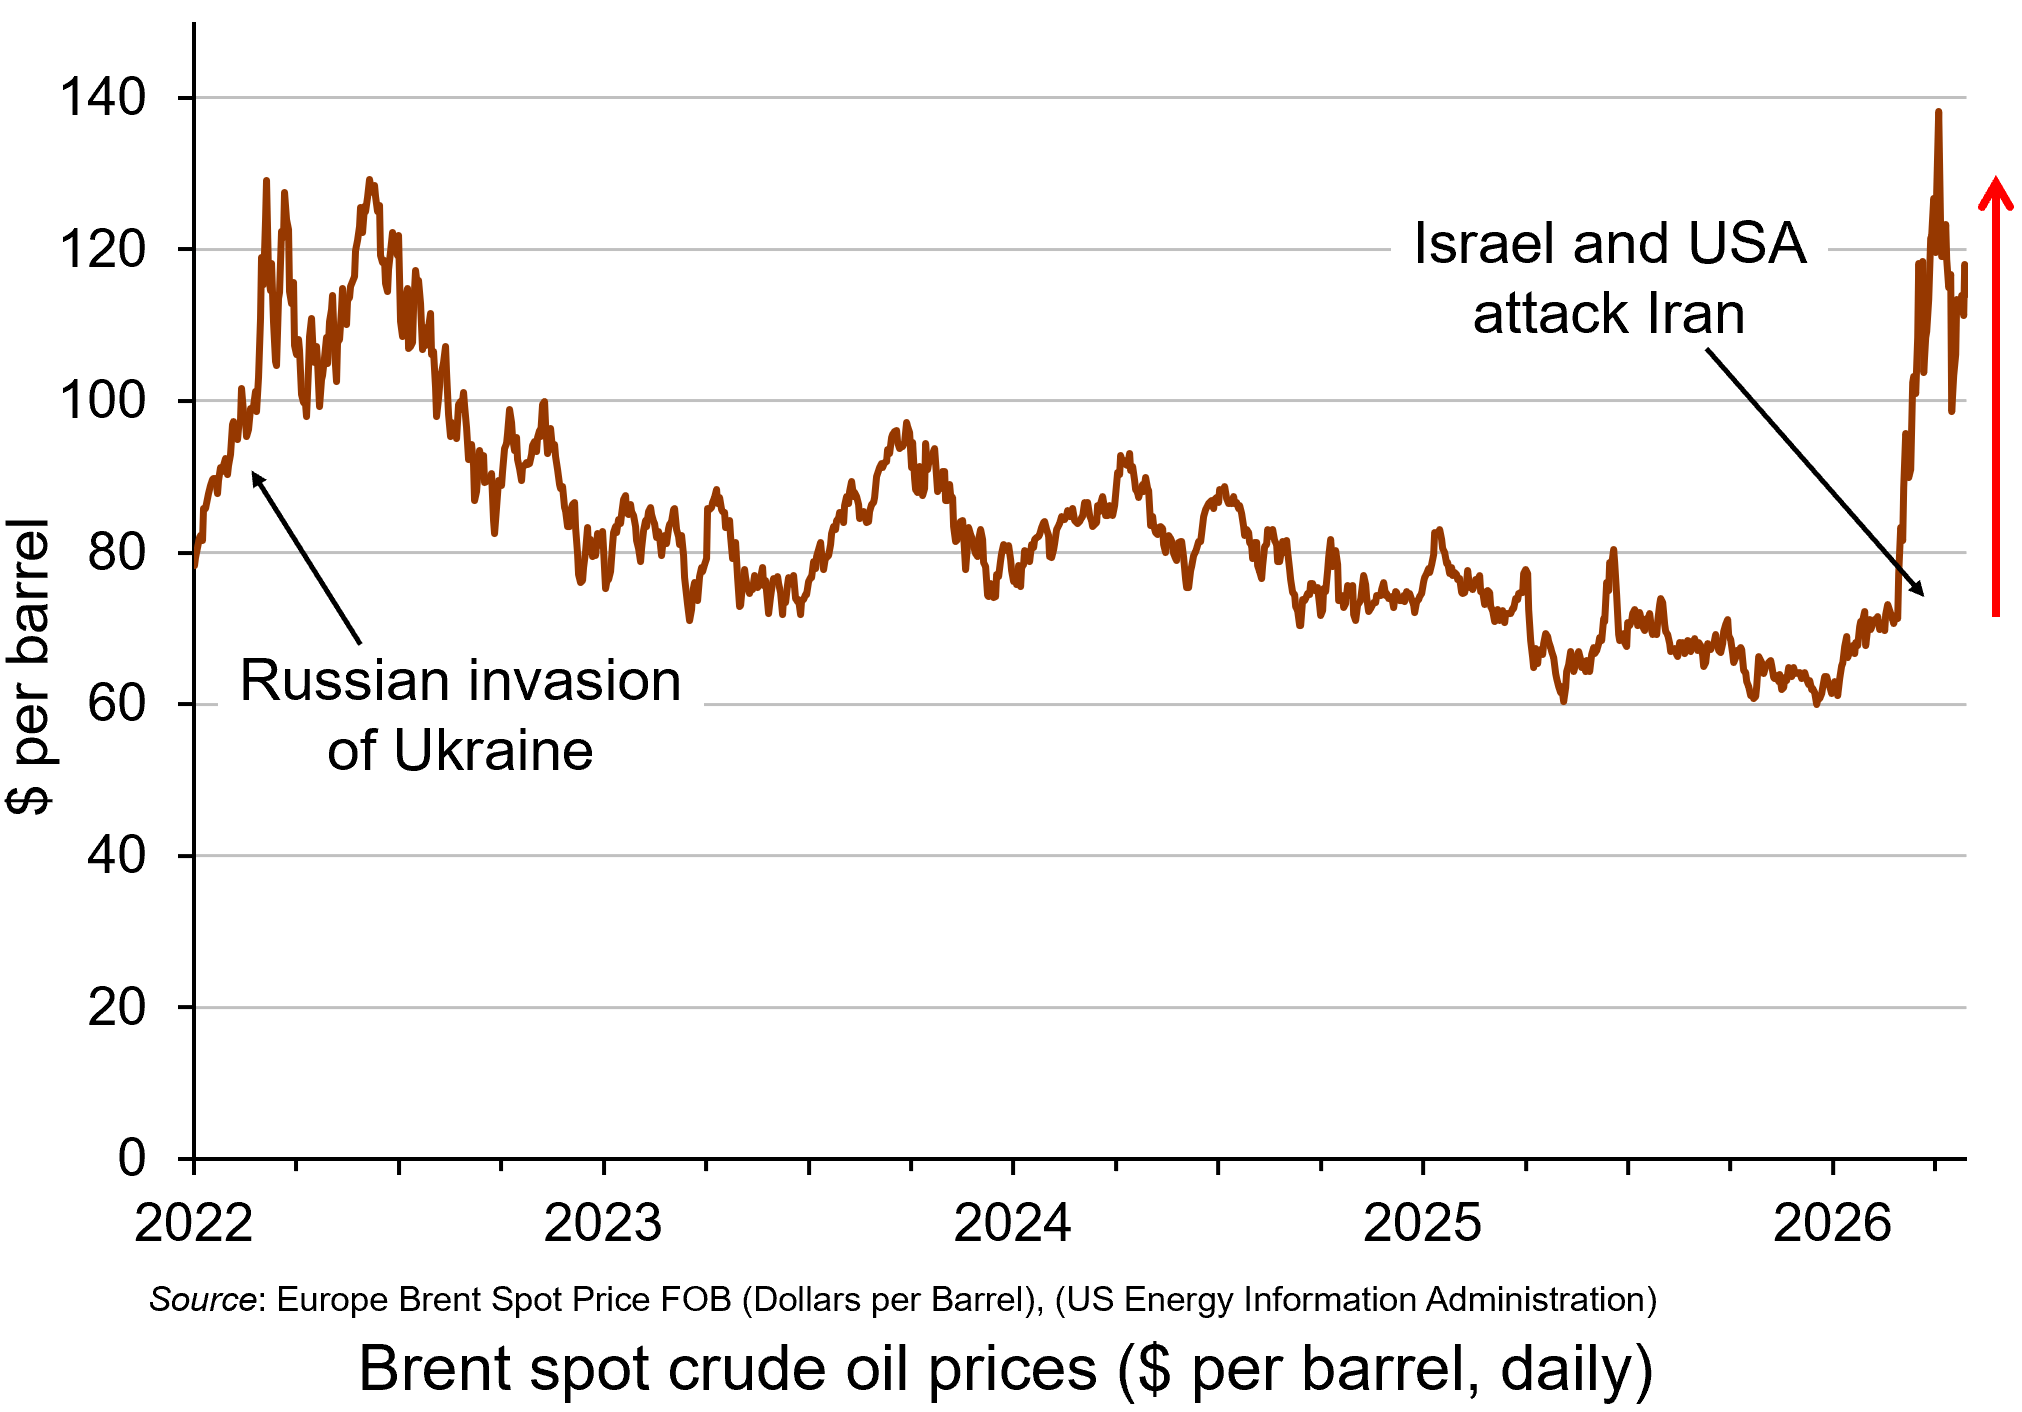
Oil prices rose considerably in the days following the start of the war on 28 February, with Brent crude, a key measure of international oil prices, rising from $71.3 on 27 February to a peak of $119.4 per barrel by the morning of 9 March – a rise of 67%. It was possible that they would rise even further in the short term. However, prices fell back substantially later on 9 March after G7 finance ministers declared that the group ‘stands ready’ to release oil from strategic reserves if needed. By late in the day, the price had fallen to below $85. (Click here for a PowerPoint of the chart.)
However, despite the announcement on 11 March that 32 countries had agreed to release 400m barrels of oil reserves, oil prices began rising again and reached $100 on 12 March after three tankers had been struck in the Gulf, two of them close to the Strait of Hormuz. With Iran pledging to keep the Strait closed, there were worries that the release of oil reserves would provide only temporary relief. Just over 20m barrels of oil normally pass through the Strait of Hormuz. The 400m barrels released from storage is the equivalent, therefore, of only 20 days’ worth of lost oil from the Gulf.
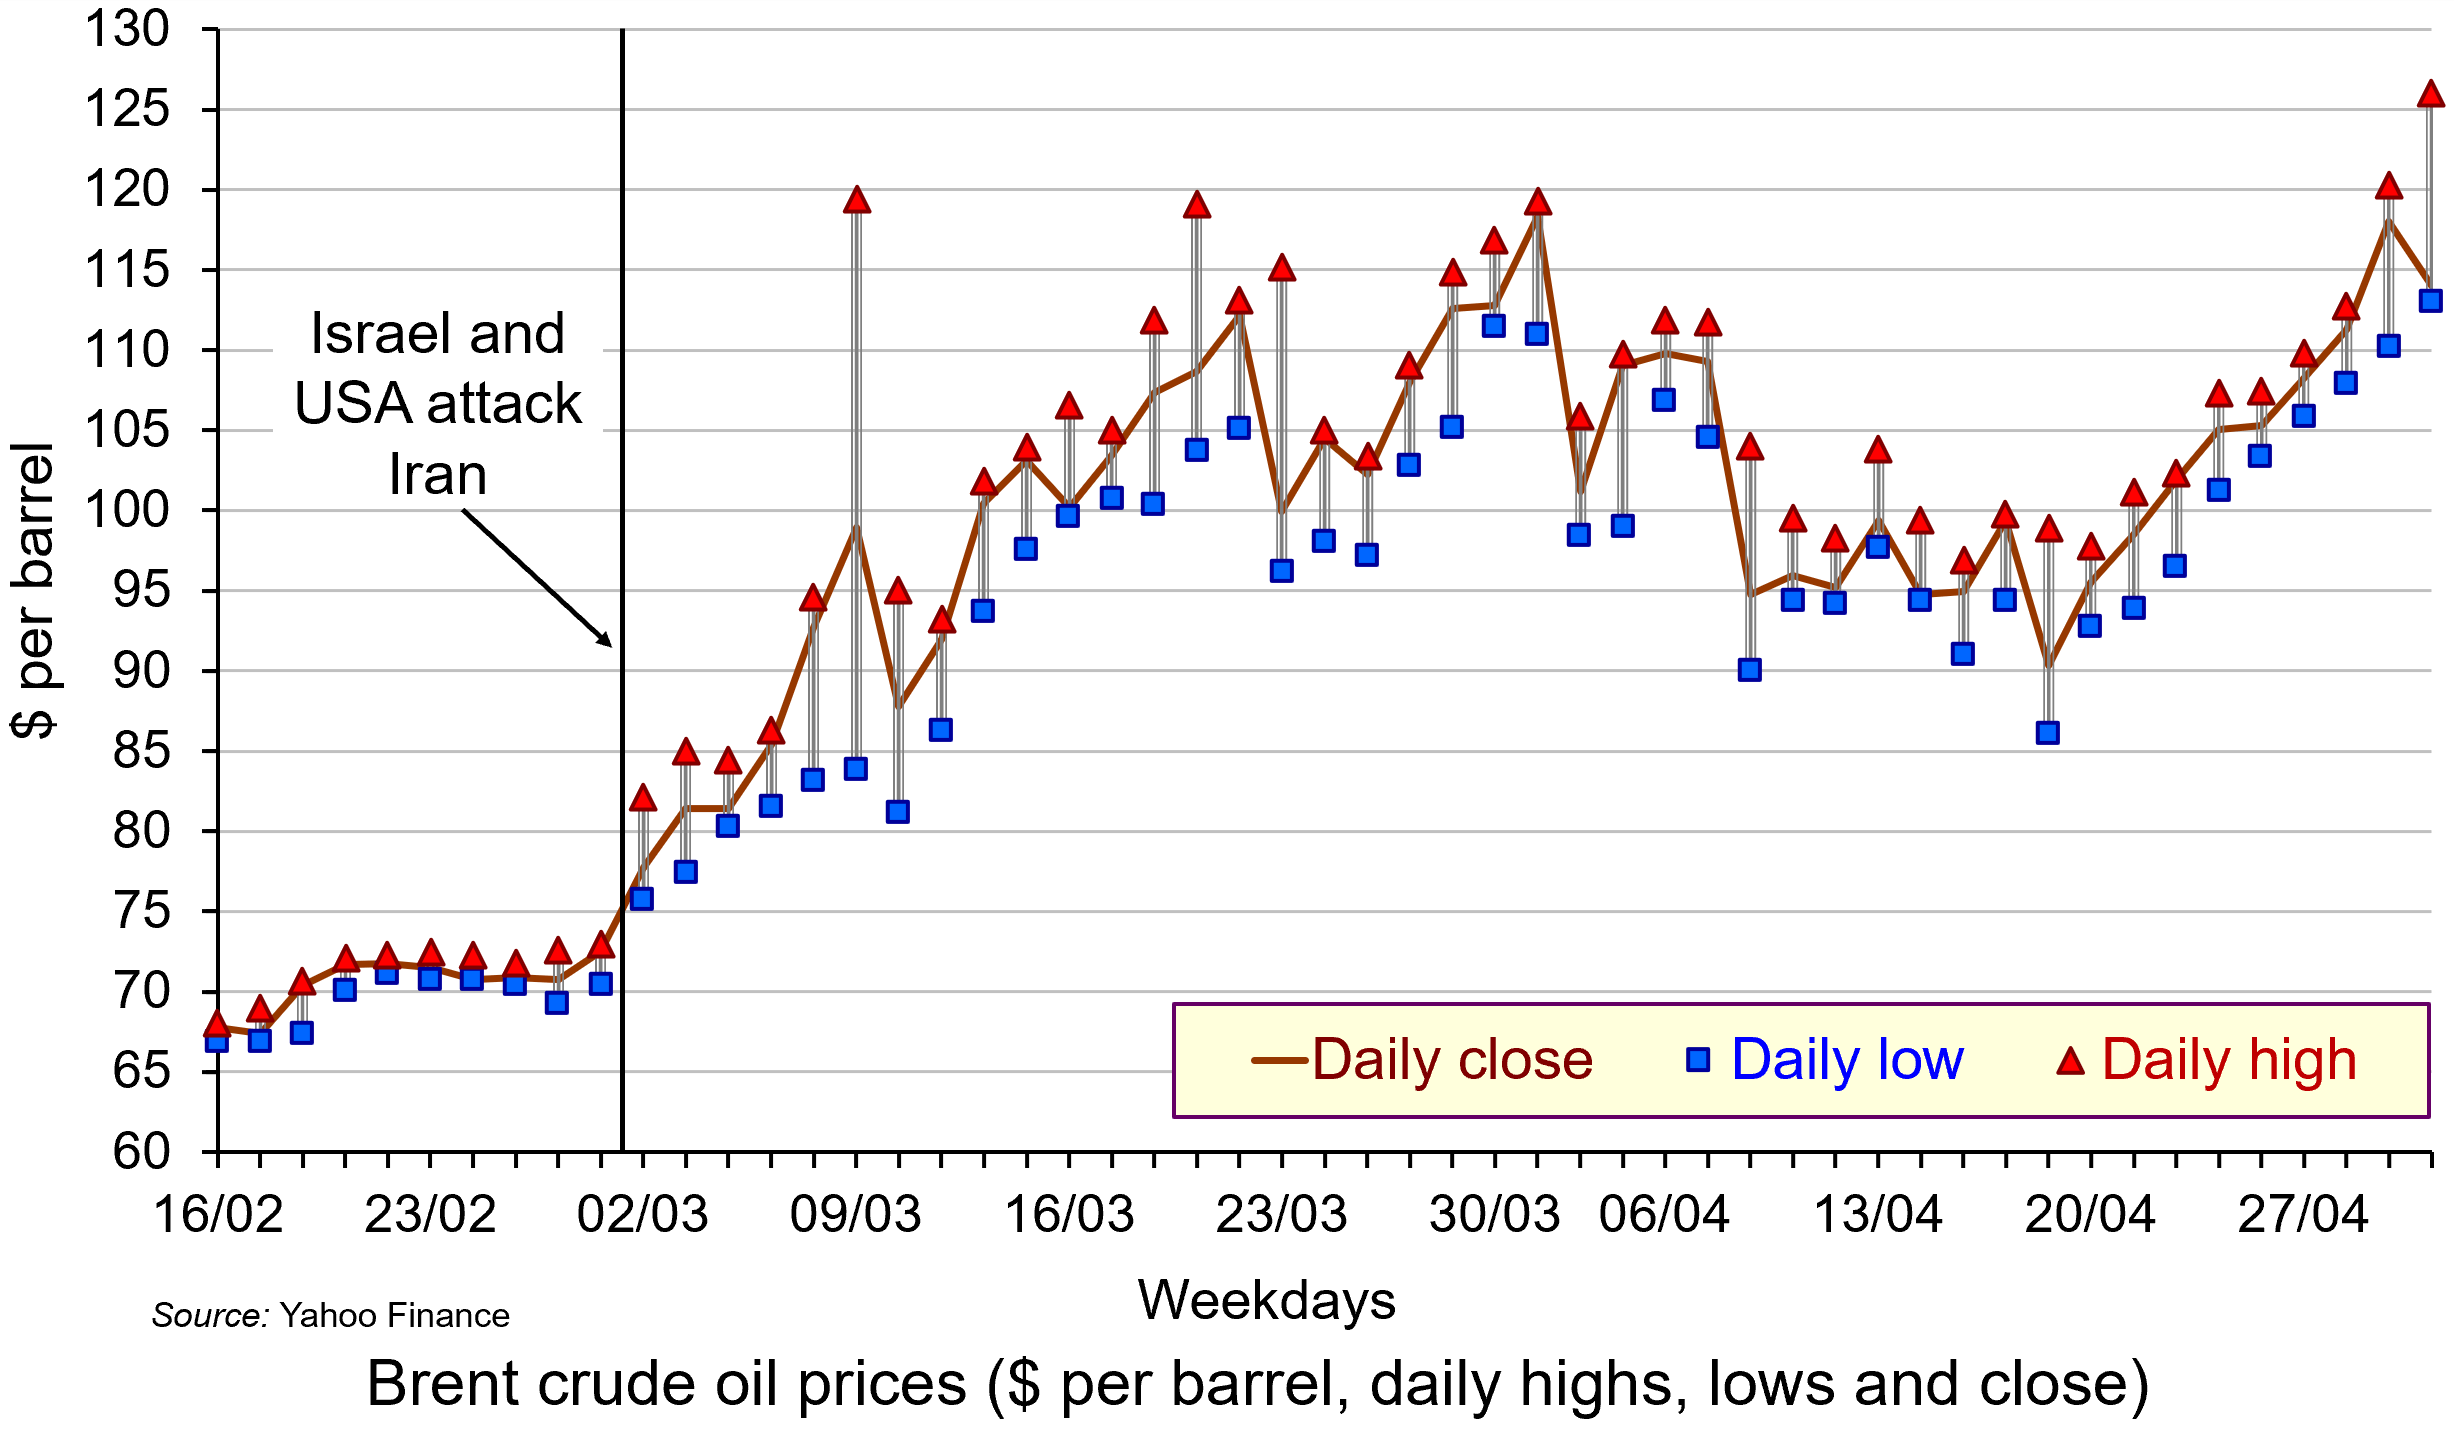
Not only did oil prices rise, but the price became much more volatile as markets reacted to the news on a continuous basis. Intra-day fluctuations in oil prices of several percentage points became typical, reflecting shifting expectations. The second chart shows daily fluctuations, with the highest and lowest prices for each day shown, along with the closing price. (Click here for a PowerPoint.)
The biggest fluctuation had been on 9 March when fears of the closing of the Strait of Hormuz saw the price of Brent crude rising to nearly $120 but falling to around $84 later in the day (a fall of around 30%) after the G7 announcement about releasing reserves.
There was another big fluctuation on 23 March. The previous day (Sunday), President Trump threatened to bomb Iran’s power plants if Iran did not allow free passage of ships through the Strait of Hormuz. Iran threatened to retaliate by striking Gulf countries’ energy and water systems. In early trading on Monday 23rd, Brent crude rose to over $115 per barrel. But later that day, Trump said that there had been constructive talks between the USA and Iran. The oil price immediately dropped to around $96 – a fall of 17% – before settling at around $100.
Rising oil prices will drive up inflation. For those countries with a heavy dependence on Gulf oil, particularly countries in Asia, there could be significant supply problems. For oil exporters in the Persian Gulf, with tankers unable to traverse the Strait of Hormuz, the economic impact is huge. Oil exporters outside the Gulf, such as Russia, Norway and Canada, however, will gain from the higher prices. Clearly the size of these effects will depend on how long the conflict continues and how long the Strait of Hormuz remains closed.
And it is not just oil that is affected. Other products, such as liquified natural gas (LNG), petrochemicals, industrial materials, fertilizers for food production, medicines, helium for microchip production, metals and minerals are transported through the Strait of Hormuz. Gulf countries import much of their food through the Strait. On 18 March, Israel struck Iran’s huge South Pars gas field off the Gulf coast. This is the largest gas field in the world and is a major source of export revenue for Iran. Iran responded by striking the Qatari gas hub in Ras Laffan. Donald Trump responded by threatening to ‘blow up’ the entire Iranian South Pars gas field if Iran made further strikes on Qatar. The effect of this escalation was to drive oil and gas prices up further. By the week ending 20 March, the oil price closed at just over $112 per barrel.
Cuts in supplies of oil and other products represent an adverse supply shock. Such shocks push up prices (cost-push inflation), while adversely affecting aggregate output. This can lead to stagflation – a combination of higher inflation and stagnation or even falling output. Central banks with a simple mandate to keep inflation to a target are likely to raise interest rates, or at least delay in reducing them. In the USA, with a dual mandate of controlling inflation but also maximising employment, the response may be less deflationary, depending on the judgement of the Federal Reserve.
Uncertainty
 There is great uncertainty about how long the conflict will last. There is also a lack of clarity and consistency from the US administration about its war aims. This uncertainty has affected financial markets, which have seen considerable volatility. Stock markets have seen widespread falls, with airline, travel and AI-heavy stocks being particularly vulnerable.
If the war is concluded relatively swiftly, the economic effects could be relatively small. If the war continues, and especially if the Gulf countries are drawn further into the conflict and if the conflict spreads to other countries, the economic effects could be much more substantial. A prolonged conflict could see oil prices remaining above $100 per barrel, potentially increasing global inflation by 1 percentage point or more. This would slow or halt the move by central banks to cut rates and thereby reduce global economic growth – potentially, as we have seen, leading to stagflation.
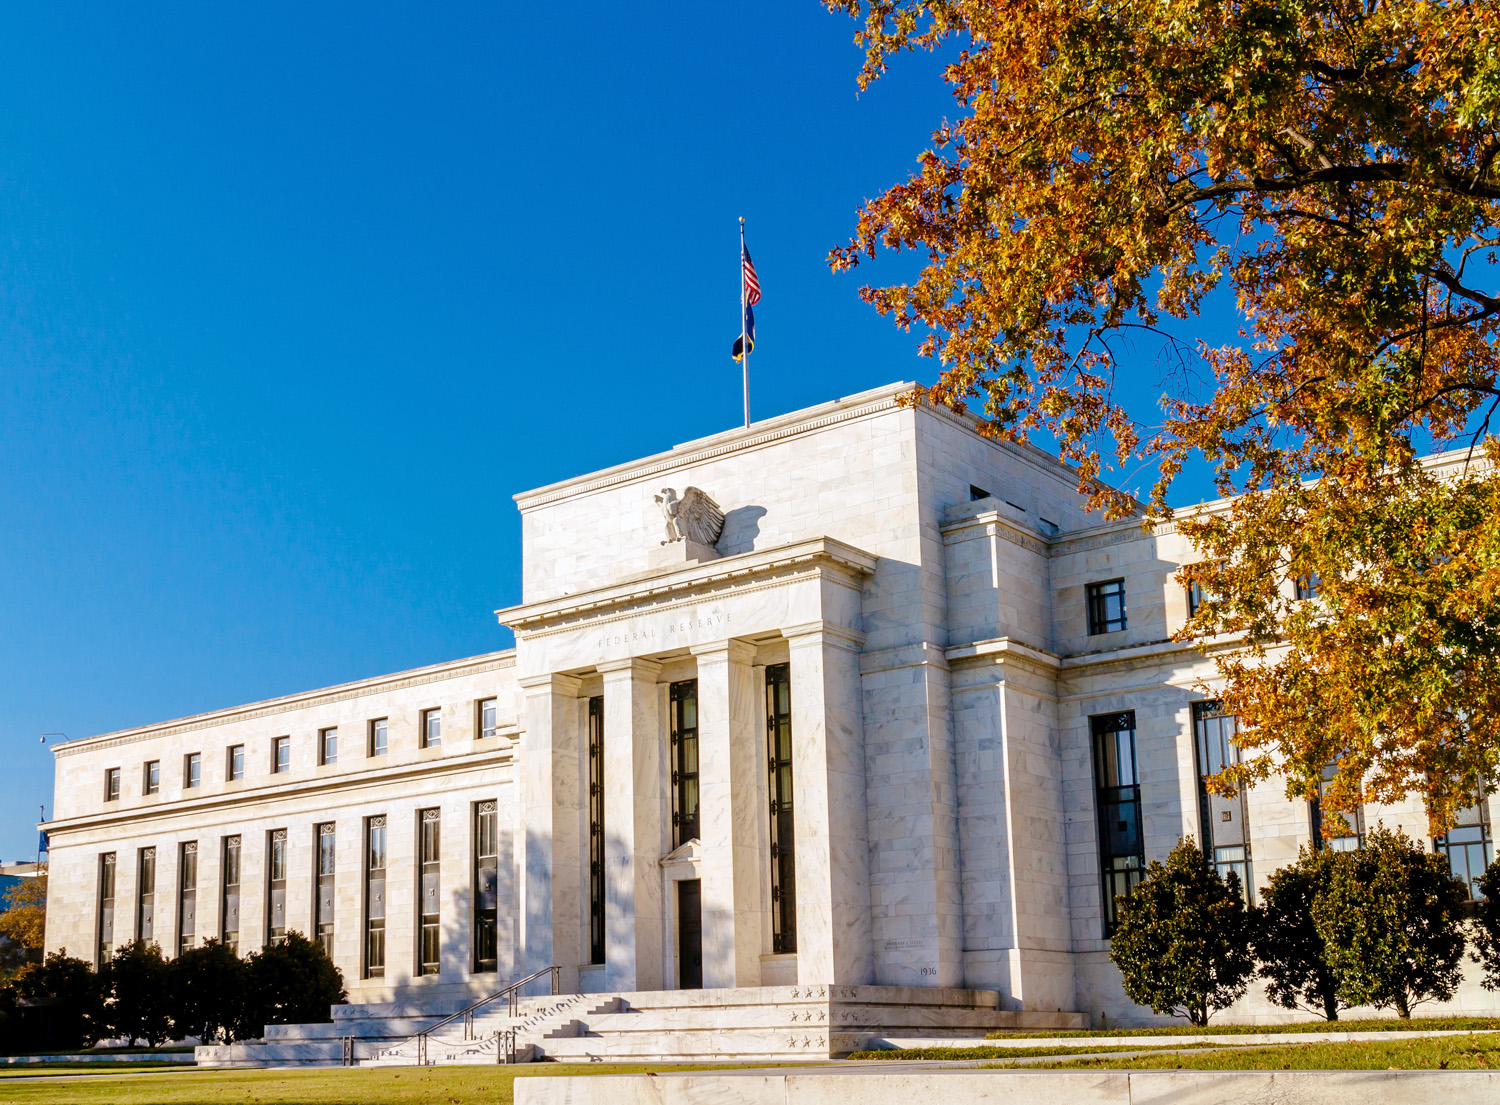 The uncertainty was reflected in the decision of the Fed to keep interest rates unchanged at its meeting on 17/18 March. The Fed has the twin targets of keeping inflation close to 2% and maximising employment. Fed Chair, Jay Powell, acknowledged the current tension between the two goals: ‘upward risks for inflation and downward risks for employment, and that puts us in a difficult situation’. He also recognised that the future for inflation and the economy was highly uncertain as the war developed. This made interest rate setting difficult.
Then there is the issue of a potential new international refugee crisis. If the economic and political system in Iran deteriorates rapidly, this could trigger a wave of migration to neighbouring countries, such as Turkey, already hosting large numbers of refugees. Many could seek sanctuary further afield in Europe, with several countries already facing a backlash against immigration. The political and economic effects of this on host countries could be significant – but as yet, highly uncertain.
Articles
- Assessing the global economic impact of the Middle East war
ING, Carsten Brzeski, Warren Patterson, James Knightley and Deepali Bhargava (5/3/26)
- How the Hormuz closure could affect food, medicines and smartphones
BBC News Verify, Ben Chu (27/3/26)
- How will the Iran war affect the global economy?
Chatham House, Neil Shearing (6/3/26)
- ‘The stakes are enormous’: how a prolonged Iran war could shock the global economy
The Guardian, Richard Partington (22/3/26)
- Iran war is latest threat to a global economy rattled by Trump
Aljazeera, John Power (7/3/26)
- Why an Iran war inflation shock could wreck global economic recovery
The Guardian, Phillip Inman and Kalyeena Makortoff (8/3/26)
- Why has the Iran war sparked fears of stagflation for the global economy?
The Guardian, Luca Ittimani (9/2/26)
- Why the price of oil matters more than you might think
BBC News, Natalie Sherman and Mitchell Labiak (10/3/26)
- Strait of Hormuz: Factsheet
IEA (February 2026)
- Could this energy crisis be worse for the global economy than COVID?
The Conversation, Adi Imsirovic (26/3/26)
- Faisal Islam: Oil price spiral may be slowed but not stopped by G7 emergency move
BBC News, Faisal Islam (9/3/26)
- What on earth is going on with the oil price?
BBC News, Jemma Crew (12/3/26)
- Asia scrambles to confront energy crisis unleashed by Iran war – with no end in sight
The Guardian, Callum Jones (12/3/26)
- The grim choice facing the Trump administration: Economic or naval collapse?
CNN, Phil Mattingly and Zachary Cohen (9/3/26)
- Israel strikes Iran’s South Pars gasfield hours after forces kill intelligence minister
The Guardian, Lorenzo Tondo and William Christou (18/3/26)
- What Fed Chair Jerome Powell said — and didn’t say — about the oil crisis
Yahoo Finance, Jake Conley (19/3/26)
- What strikes on the world’s largest natural gas sites could do to the global economy
CNN, Hanna Ziady (19/3/26)
- How the Iran Conflict May Fuel a New International Refugee Crisis
Forbes, Andy J Semotiuk (5/3/26)
- Iran’s neighbours brace for fallout as war threatens new refugee crisis
Aljazeera, Abid Hussain (17/3/26)
- Two months into the Iran war, almost everybody is a loser
CNN, Ivana Kottasová (2/5/26)
Data
Report
Questions
- Who are the biggest gainers and losers from disruption to oil supplies from the Persian Gulf?
- Illustrate the effect of the current oil price shock on an aggregate demand and supply diagram (either static or dynamic).
- Why is the Iranian war likely to be less damaging to the European economy than the Ukrainian war has been?
- Why have AI-related stock prices been vulnerable to the uncertainty caused by the Iranian war?
- How have the Bank of England and the Federal Reserve Bank responded to higher oil prices and the broader economic effects of the war? Why might their responses be different in the coming months?
- What is the likely impact of the Iranian war on global economic recovery?
- How might the Iranian war affect global economic alliances?
- How is the current oil price shock likely to affect the eurozone? Will it be different from the oil price shock that followed the Russian invasion of Ukraine?
- What are the likely economic effects of large-scale migration caused by the war?
 Precious metals, such as gold, silver and platinum, are seen as safe havens by investors in uncertain times. With the on-off nature of Donald Trump’s tariffs, with ongoing wars, such as the war in Ukraine, and with threats of US action in Iran, with inflation slow to fall and pressure by the Trump administration on the Federal Reserve to make precipitant cuts in interest rates, investors have flocked to precious metals.
Precious metals peaked in late January 2026. Compared with just four months earlier, gold was up by 48%, platinum by 76% and silver by a massive 162%. Silver and platinum were also boosted by their industrial uses. Silver has excellent conductive properties and is used for electronics, AI, solar energy (photovoltaic cells), chemical catalysts and medical equipment. Over 50% of its consumption is for industrial purposes. Platinum is used as a catalyst in catalytic converters to reduce exhaust emissions, in medical devices, chemical processing, oil refining, electronics and glass manufacturing.
The rise was fuelled by speculation, which gathered momentum in December and January. But then the prices of all three metals fell dramatically on Friday 30 January and a bit more on 2 February. Despite a moderate bounce back on 3 February, the prices then fell again and by the end of 5 February, gold had fallen by 15%, platinum by 30% and silver by a massive 42% from the peak.
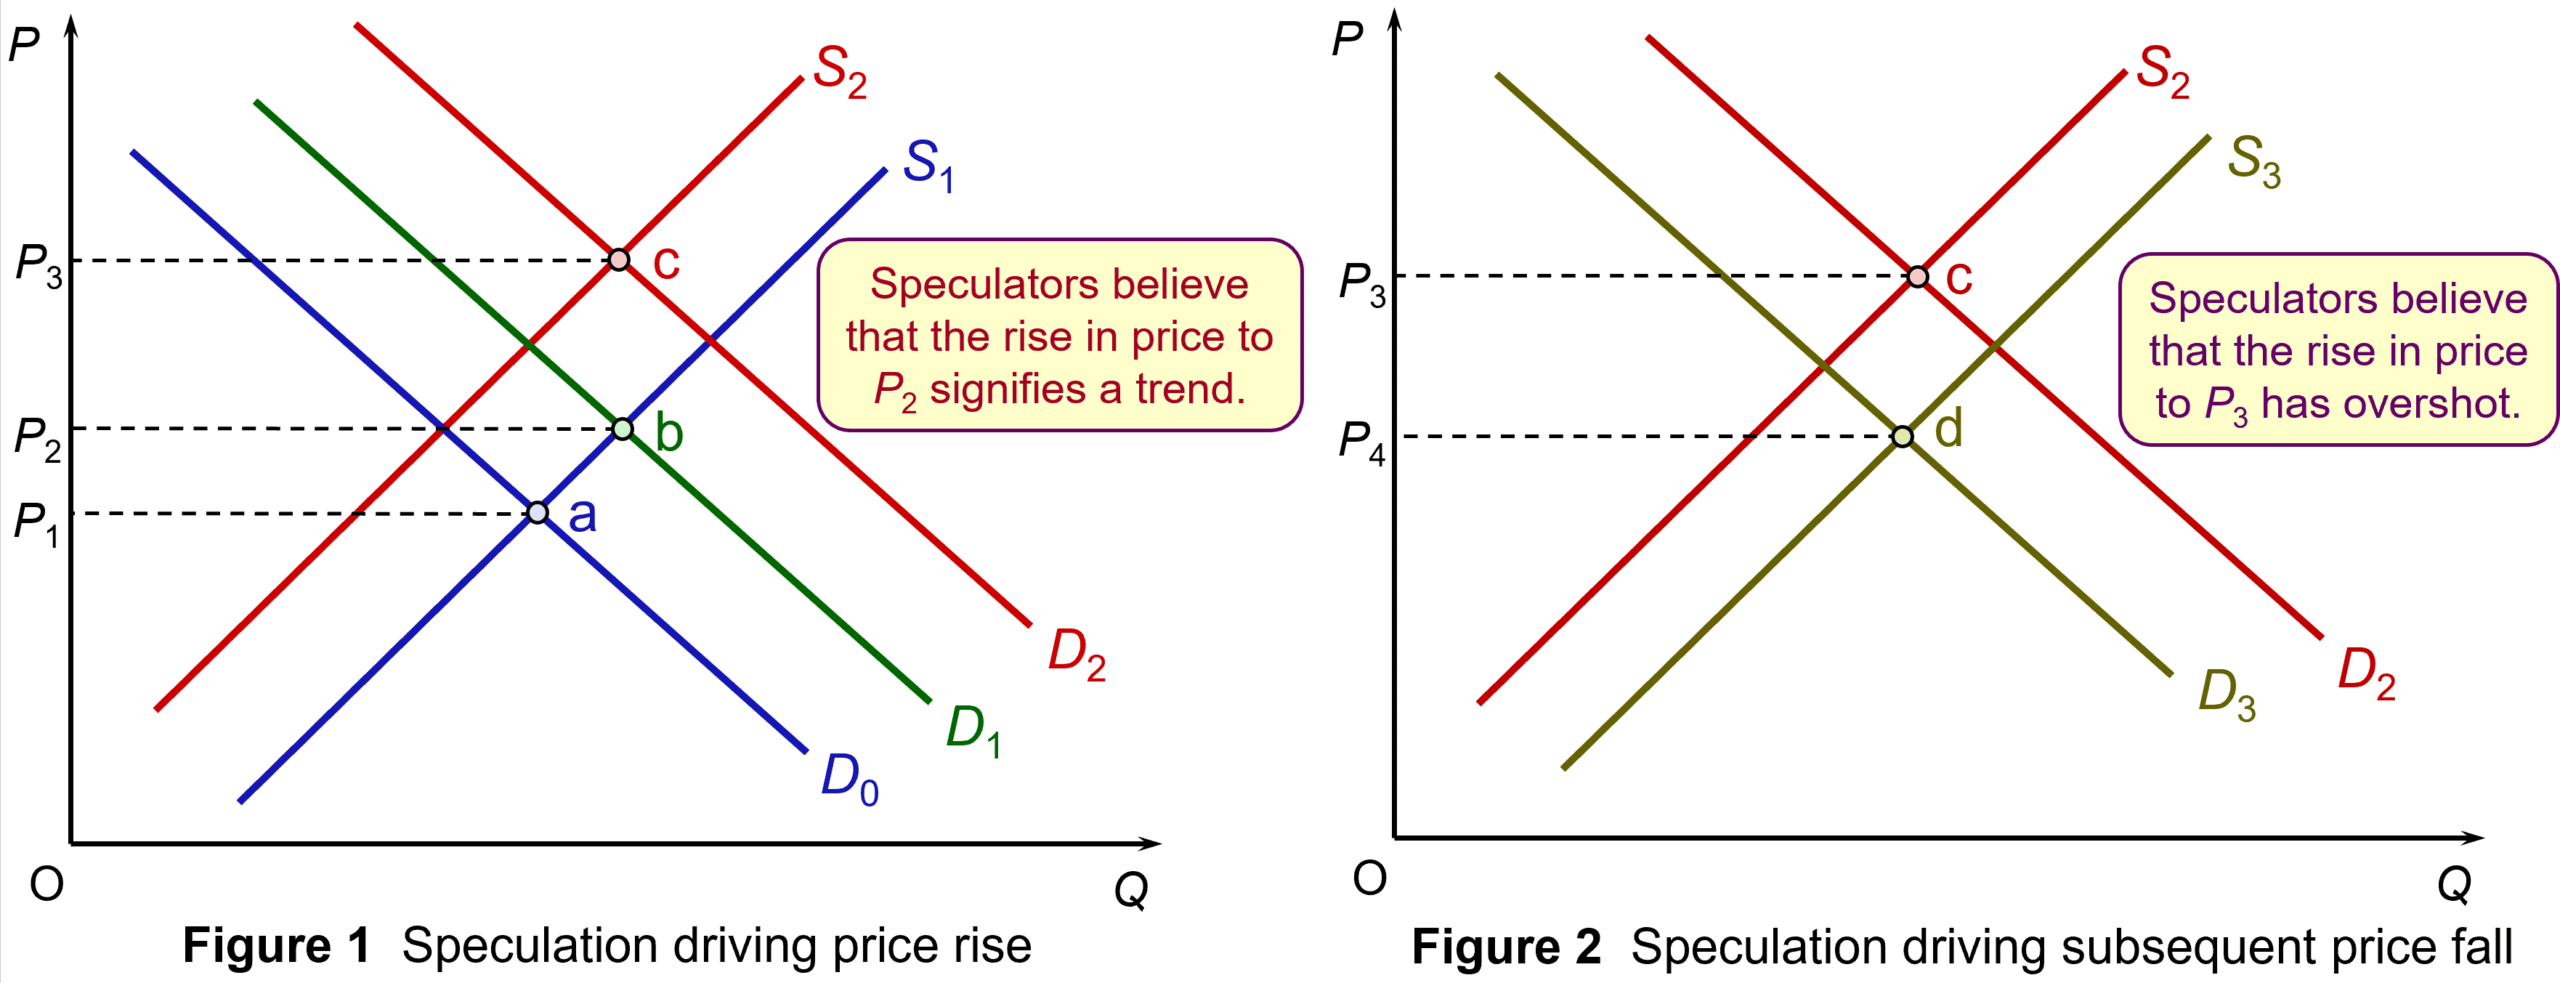
Figure 1 illustrates the effect of speculation on the rise in price of a precious metal, such as silver. Assume that demand rises from D0 to D1 for the reasons given above. Equilibrium moves from point a to point b and the price rises from P1 to P2. Seeing the price rising, holders of the metal wait until the price rises further before selling. Supply shifts from S1 to S2. Potential purchasers of the metal, anticipating a further rise in price, buy now before the price does rise. Demand shifts from D1 to D2. As a result, equilibrium moves from point b to point c and price rises to P3.
Figure 2 illustrates the effect of speculation on the subsequent fall in prices triggered by a belief that price will fall. Speculative selling shifts the supply curve from S2 to S3. Potential demanders hold back and the demand curve shifts from D2 to D3. Equilibrium moves to point d and price falls from P3 to P4. (Click here for a PowerPoint of the two figures.)
But why did prices fall so dramatically? The first reason was that analysts were beginning to argue that the exuberance of investors had led the price of all three metals to overshoot the fundamental balance of supply and demand. Once a tipping point arrived, people sold quickly to lock in the gains they had made over previous weeks. This profit taking caused prices to plummet as speculation of further falls drove prices lower.
 So what was the tipping point? This was the appointment by Donald Trump of Kevin Warsh as the new Chair of the Federal Reserve to take over from Jerome Powell when his tenure comes to an end in May this year.
It was expected that Trump would appoint someone much more willing to cut interest rates and this worried investors, who feared that inflation would rise again. This uncertainty drove demand for precious metals, which are seen as a safe haven. But Kevin Walsh is viewed as hawkish on monetary policy and less likely to slash interest rates than other possible choices for Chair. This triggered the fall in precious metal prices.
But the main factors that drove the demand for the metals still exist. There is still uncertainty, still an increased demand from central banks for gold, still a growing demand for silver and platinum for industrial uses. The next day, 3 February, it seemed that the prices of all three metals had over-corrected. Investors started buying again at the lower prices and consequently prices rose again – once more fuelled by speculation. Gold rose by 6.1%, platinum by 7.9% and silver by 11.6%.
Articles
Data
Questions
- What has happened to the price of silver since this blog was written? Use a demand and supply diagram to illustrate this.
- Identify the factors that affect the demand for and supply of (a) silver; (b) gold.
- What determines the elasticity of supply of silver (a) in total; (b) to the market?
- Choose another commodity other than the three metals considered in this blog. Find out what has happened to their prices over the past 12 months and explain why these price movements have occurred.
