 Is there a ‘magic money tree’? Is it desirable for central banks to create money to finance government deficits?
The standard thinking of conservative governments around the world is that creating money to finance deficits will be inflationary. Rather, governments should attempt to reduce deficits. This will reduce the problem of government expenditure crowding out private expenditure and reduce the burden placed on future generations of having to finance higher government debt.
If deficits rise because of government response to an emergency, such as supporting people and businesses during the Covid-19 pandemic, then, as soon as the problem begins to wane, governments should attempt to reduce the higher deficits by raising taxes or cutting government expenditure. This was the approach of many governments, including the Coalition and Conservative governments in the UK from 2010, as econommies began to recover from the 2007/8 financial crisis.
 ‘Modern Monetary Theory‘ challenges these arguments. Advocates of the theory support the use of higher deficits financed by monetary expansion if the money is spent on things that increase potential output as well as actual output. Examples include spending on R&D, education, infrastructure, health and housing.
Modern monetary theorists still accept that excess demand will lead to inflation. Governments should therefore avoid excessive deficits and central banks should avoid creating excessive amounts of money. But, they argue that inflation caused by excess demand has not been a problem for many years in most countries. Instead, we have a problem of too little investment and too little spending generally. There is plenty of scope, they maintain, for expanding demand. This, if carefully directed, can lead to productivity growth and an expansion of aggregate supply to match the rise in aggregate demand.
Government deficits, they argue, are not intrinsically bad. Government debt is someone else’s assets, whether in the form of government bonds, savings certificates, Treasury bills or other instruments. Provided the debt can be serviced at low interest rates, there is no problem for the government and the spending it generates can be managed to allow economies to function at near full capacity.
The following videos and articles look at modern monetary theory and assess its relevance. Not surprisingly, they differ in their support of the theory!
Videos
Articles
- Modern monetary theory: the rise of economists who say huge government debt is not a problem
The Conversation, John Whittaker (7/7/20)
- Modern Monetary Theory: How MMT is challenging the economic establishment
ABC News, Gareth Hutchens (20/7/20)
- What is Modern Monetary Theory and is it THE answer?
Sydney Morning Herald, Jessica Irvine (2/7/20)
- MMT: what is modern monetary theory and will it work?
MoneyWeek, Stuart Watkins (14/7/20)
- MMT: the magic money tree bears fruit
MoneyWeek, Stuart Watkins (17/7/20)
- Modern Monetary Theory is no Magic Money Tree
Adam Smith Institute, Matt Kilcoyne (20/5/20)
- “Modern Monetary Theory” Goes Mainstream
Forbes, Nathan Lewis (10/7/20)
- How Boris Johnson’s Conservatives have become Magic Money Tree huggers
The Scotsman, Bill Jamieson (16/7/20)
- Ignore the impacts of debt-fuelled stimulus at your peril
Livewire, David Rosenbloom (14/7/20)
- Modern Monetary Theory, explained
Vox.com, Dylan Matthews (16/4/19)
Questions
- Compare traditional Keynesian economics and modern monetary theory.
- Using the equation of exchange, MV = PY, what would a modern monetary theorist say about the effect of an expansion of M on the other variables?
- What is the role of fiscal policy in modern monetary theory?
- What evidence might suggest that money supply has been unduly restricted?
- When, according to modern monetary theory, is a rising government deficit (a) not a problem; (b) a problem?
- Is there any truth in the saying, ‘There’s no such thing as a magic money tree’?
- Provide a critique of modern monetary theory.
 Boris Johnson gave a speech on 30 June outlining his government’s approach to recovery from the sharpest recession on record. With the slogan ‘Build, build, build’, he said that infrastructure projects were the key to stimulating the economy. Infrastructure spending is a classic Keynesian response to recession as it stimulates aggregate demand allowing slack to be taken up, while also boosting aggregate supply, thereby allowing recovery in output while increasing potential national income.
A new ‘New deal’
He likened his approach to that of President Franklin D Roosevelt’s New Deal. This was a huge stimulus between 1933 and 1939 in an attempt to lift the US economy out of the Great Depression. There was a massive programme of government spending on construction projects, such as hospitals, schools, roads, bridges and dams, including the Hoover Dam and completing the 113-mile Overseas Highway connecting mainland Florida to the Florida Keys. Altogether, there were 34 599 projects, many large-scale. In addition, support was provided for people on low incomes, the unemployed, the elderly and farmers. Money supply was expanded, made possible by leaving the Gold Standard in 1934.
 There was some debate as to whether the New Deal could be classed as ‘Keynesian’. Officially, the administration was concerned to achieve a balanced budget. However, it had a separate ’emergency budget’, from which New Deal spending was financed. According to estimates by the Federal Reserve Bank of St Louis, the total extra spending amounted to nearly 40% of US GDP as it was in 1929.
By comparison with the New Deal, the proposals of the Johnson government are extremely modest. Mostly it amounts to bringing forward spending already committed. The total of £5 billion is just 0.2% of current UK GDP.
Focusing on jobs
A recent report published by the Resolution Foundation, titled ‘The Full Monty‘, argues that as the Job Retention Scheme, under which people have been furloughed on 80% pay, is withdrawn, so unemployment is set to rise dramatically. The claimant count has already risen from 1.2m to 2.8m between March and May with the furlough scheme in place.
 Policy should thus focus on job creation, especially in those sectors likely to experience the largest rise in unemployment. Such sectors include non-food retail, hospitality (pubs, restaurants, hotels, etc.), public transport, the arts, entertainment and leisure and a range of industries servicing these sectors. What is more, many of the people working in these sectors are young and low paid. Many will find it difficult to move to jobs elsewhere – partly because of a lack of qualifications and partly because of a lack of alternative jobs. The rising unemployment will raise inequality.
The Resolution Foundation report argues that policy should be focused specifically on job creation.
Policy makers should act now to minimise outflows from the hard-hit sectors – a wage subsidy scheme or a National Insurance cut in those sectors would reduce labour costs and discourage redundancies. Alongside this, the Government must pursue radical action to create jobs across the country, such as in social care and housing retrofitting, and ramp up support for the unemployed.
Dealing with hyteresis
The economy is set to recover somewhat as the lockdown is eased, but it is not expected to return to the situation before the pandemic. Many jobs will be lost permanently unless government support continues.
Even then, many firms will have closed and others will have reassessed how many workers they need to employ and whether less labour-intensive methods would be more profitable. They may take the opportunity to consider whether technology, such as AI, can replace labour; or they may prefer to employ cheap telecommuters from India or the Philippines rather than workers coming into the office.
Policies to stimulate recovery will need to take these hysteresis effects into account if unemployment is to fall back to pre-Covid rates.
Videos
Articles
- Coronavirus: Boris Johnson pledges ‘new deal’ to build post-virus
BBC News (30/6/20)
- Boris Johnson hails his economic plan as a new ‘New Deal.’ Try ‘small deal’ instead
MarketWatch, Pierre Briançon (30/6/20)
- Boris Johnson announces state-led post-coronavirus relaunch
Financial Times, George Parker, Jim Pickard and Chris Giles (30/6/20)
- How does Boris Johnson’s ‘new deal’ compare with Franklin D Roosevelt’s?
The Guardian, Richard Partington (30/6/20)
- Coronavirus: Ministers urged to stave off ‘second wave’ of unemployment with major job creation plan
PoliticsHome, Matt Honeycombe-Foster (29/6/20)
- Biggest job creation package in peacetime needed to deflect increase in UK unemployment, think tank reports
Independent, Alan Jones (29/6/20)
- UK needs ‘biggest-ever peacetime job creation plan’ to stop mass unemployment
The Guardian, Richard Partington (29/6/20)
- The International Labour Organization was founded after the Spanish flu – its past lights the path to a better future of work
The Conversation, Huw Thomas, Frederick Harry Pitts and Peter Turnbull (17/6/20)
- Seven charts on the coronavirus jobs market
BBC News, By Lora Jones and Daniele Palumbo (16/6/20)
- Covid, hysteresis, and the future of work
Vox, Richard Baldwin (29/5/20)
- The economy won’t snap back after Covid-19
Financial Times, Tim Harford (5/6/20)
- Addressing The Covid-19 Shock -Keeping People In Work And Businesses Afloat
Forbes, Linda Yueh (20/3/20)
- Cutting labour taxes brings back the jobs lost to COVID-19
Vox, Christian Bredemeier, Falko Juessen and Roland Winkler (28/6/20)
Report
Questions
- What are the arguments for and against substantial increased government expenditure on infrastructure projects?
- Should the UK government spend more or less on such projects than the amount already pledged? Justify your answer.
- What are the arguments for and against directing all extra government expenditure towards green projects?
- Look through the Resolution Foundation report and summarise the findings of each of its sections.
- What are the arguments for and against directing all extra government expenditure towards those sectors where there is the highest rate of job losses?
- What form could policies to protect employment take?
- How should the success of policies to generate employment be measured?
- What form does hysteresis play on the post-Covid-19 labour market? What four shocks mean that employment will not simply return to the pre-Covid situation?
 Three international agencies, the IMF, the European Commission and the OECD, all publish six-monthly forecasts for a range of countries. As each agency’s forecasts have been published this year, so the forecasts for economic growth and other macroeconomic indicators, such as unemployment, have got more dire.
The IMF was the first to report. Its World Economic Outlook, published on 14 April, forecast that in the UK real GDP would fall by 6.5% in 2020 and rise by 4% in 2021 (not enough to restore GDP to 2019 levels); in the USA it would fall by 5.9% this year and rise by 4.7% next year; in the eurozone it would fall by 7.5% this year and rise by 4.7% next.
The European Commission was next to report. Its AMECO database was published on 6 May. This forecast that UK real GDP would fall by 8.3% this year and rise by 6% next; in the USA it would fall by 6.5% this year and rise by 4.9% next; in the eurozone it would fall by 7.7% this year and rise by 6.3% next.
The latest to report was the OECD on 10 June. The OECD Economic Outlook was the most gloomy. In fact, it produced two sets of forecasts.
The first, more optimistic one (but still more gloomy than the forecasts of the other two agencies) was based on the assumption that lockdowns would continue to be lifted and that there would be no second outbreak later in the year. This ‘single-hit scenario’ forecast that UK real GDP would fall by 11.5% this year and rise by 9% next (a similar picture to France and Italy); in the USA it would fall by 7.3% this year and rise by 4.1% next; in the eurozone it would fall by 9.1% this year and rise by 6.5% next.
The second set of OECD forecasts was based on the assumption that there would be a second wave of the virus and that lockdowns would have to be reinstated. Under this ‘double-hit scenario’, the UK’s GDP is forecast to fall by 14.0% this year and rise by 5.0 per cent next; in the USA it would fall by 8.5% this year and rise by 1.9% next; in the eurozone it would fall by 11.5% this year and rise by 3.5% next.
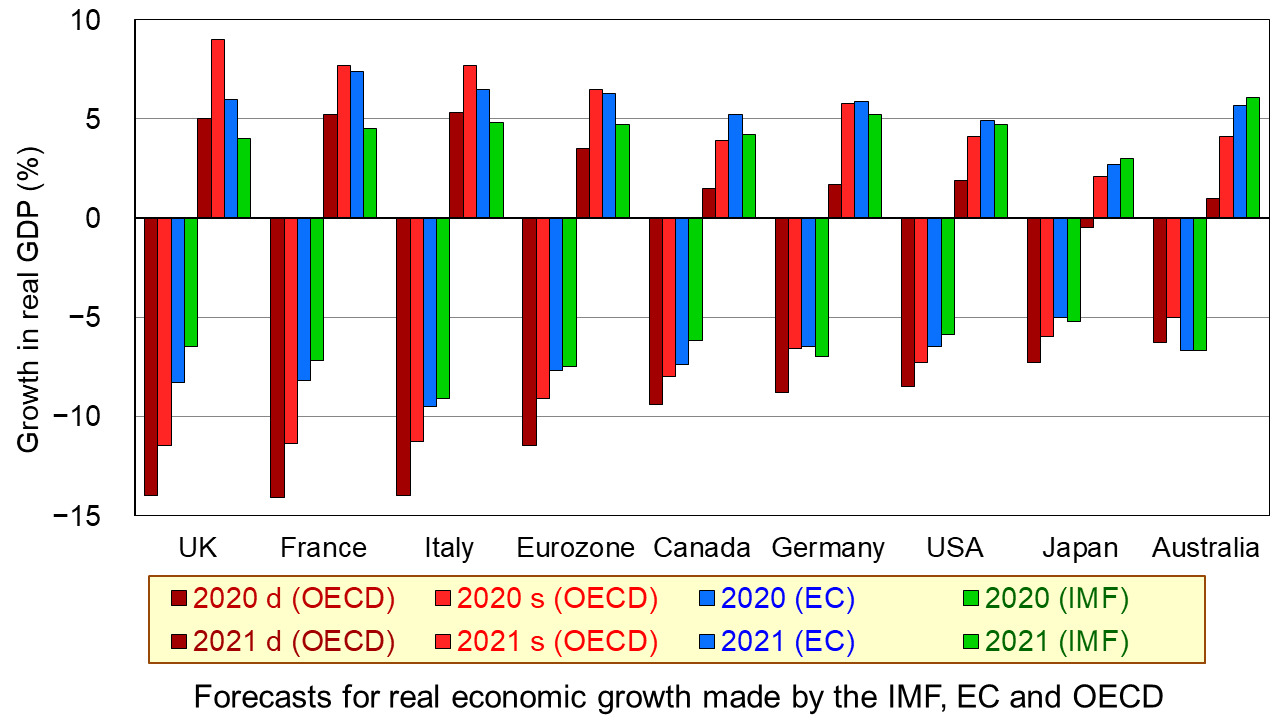
The first chart shows the four sets of forecasts (including two from the OECD) for a range of countries. The first four bars for each country are the forecasts for 2020; the other four bars for each country are for 2021. (Click here for a PowerPoint of the chart.)
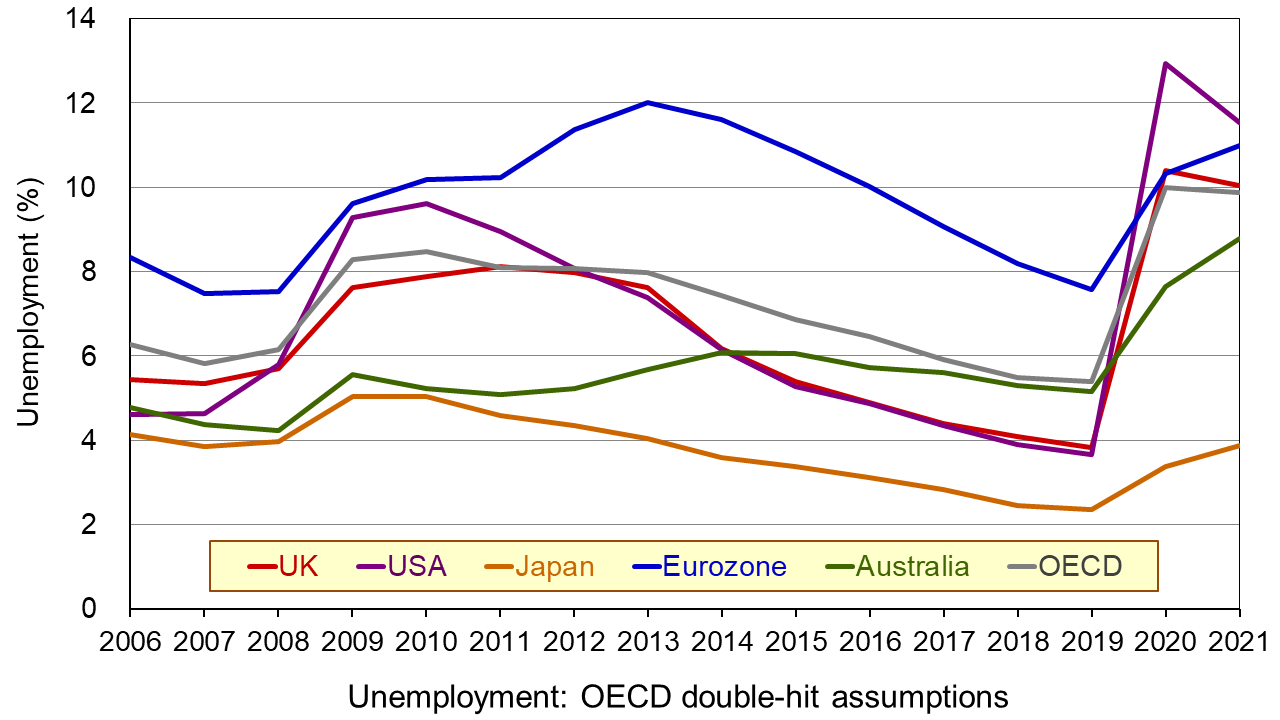
The second chart shows unemployment rates from 2006. The figures for 2020 and 2021 are OECD forecasts based on the double-hit assumption. You can clearly see the dramatic rise in unemployment in all the countries in 2020. In some cases it is forecast that there will be a further rise in 2021. (Click here for a PowerPoint of the chart.)
As the OECD states:
In both scenarios, the recovery, after an initial, rapid resumption of activity, will take a long time to bring output back to pre-pandemic levels, and the crisis will leave long-lasting scars – a fall in living standards, high unemployment and weak investment. Job losses in the most affected sectors, such as tourism, hospitality and entertainment, will particularly hit low-skilled, young, and informal workers.
But why have the forecasts got gloomier? There are both demand- and supply-side reasons.
Aggregate demand has fallen more dramatically than originally anticipated. Lockdowns have lasted longer in many countries than governments had initially thought, with partial lockdowns, which replace them, taking a long time to lift. With less opportunity for people to go out and spend, consumption has fallen and saving has risen. Businesses that have shut, some permanently, have laid off workers or they have been furloughed on reduced incomes. This too has reduced spending. Even when travel restrictions are lifted, many people are reluctant to take holidays at home and abroad and to use public transport for fear of catching the virus. This reluctance has been higher than originally anticipated. Again, spending is lower than before. Even when restaurants, bars and other public venues are reopened, most operate at less than full capacity to allow for social distancing. Uncertainty about the future has discouraged firms from investing, adding to the fall in demand.
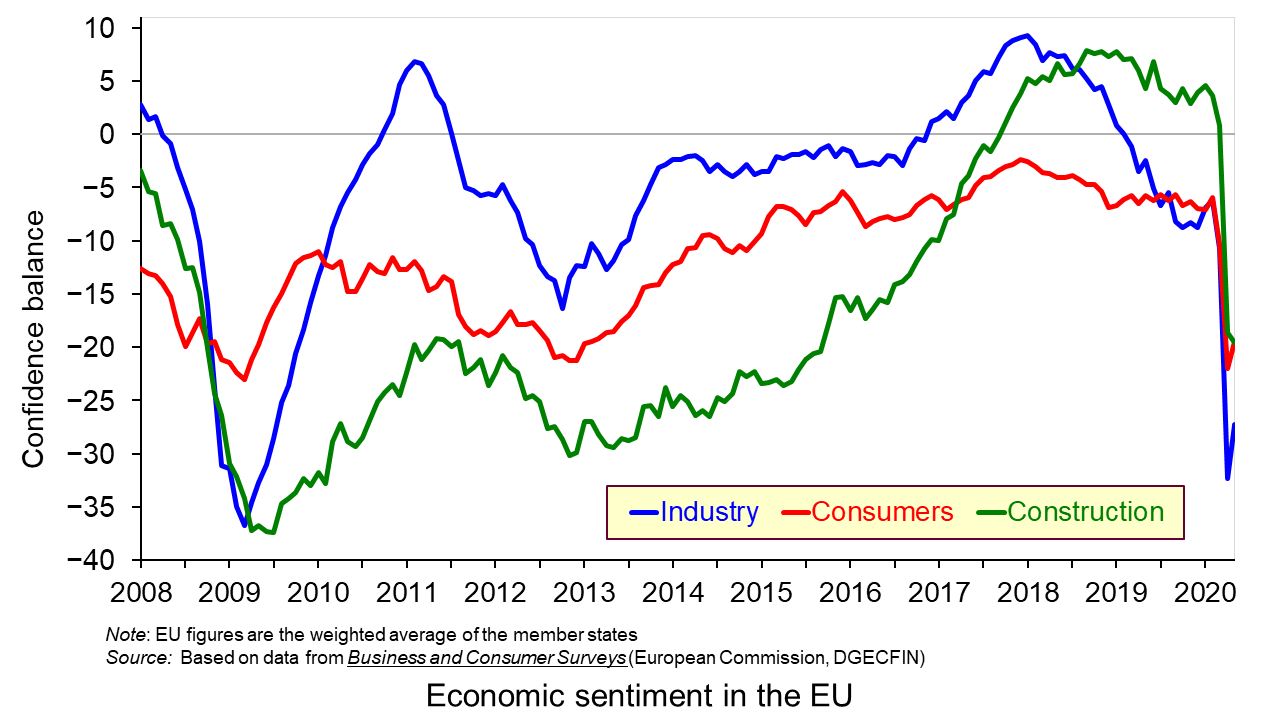
On the supply side, there has been considerable damage to capacity, with firms closing and both new and replacement investment being put on hold. Confidence in many sectors has plummeted as shown in the third chart which looks at business and consumer confidence in the EU. (Click here for a PowerPoint of the above chart.) Lack of confidence directly affects investment with both supply- and demand-side consequences.
Achieving a sustained recovery will require deft political and economic judgements by policymakers. What is more, people are increasingly calling for a different type of economy – one where growth is sustainable with less pollution and degradation of the environment and one where growth is more inclusive, where the benefits are shared more equally. As Angel Gurría, OECD Secretary-General, states in his speech launching the latest OECD Economic Outlook:
The aim should not be to go back to normal – normal was what got us where we are now.
Articles
OECD publications
Questions
- Why has the UK economy been particularly badly it by the Covid-19 pandemic?
- What will determine the size and timing of the ‘bounce back’?
- Why will the pandemic have “dire and long-lasting consequences for people, firms and governments”?
- Why have many people on low incomes faced harsher consequences than those on higher incomes?
- What are the likely environmental impacts of the pandemic and government measures to mitigate the effects?
 Like most other sectors of the economy, private schools have been significantly affected by the coronavirus pandemic. As with all schools, they have been restricted to providing their pupils with online instruction. In addition, some parents are likely to have seen their ability to pay the high fees private schools charge restricted. As a result of both of these factors, private schools have been forced to look into providing discounts or refunds on their fees. However, the UK competition authority have received evidence that these schools may have been communicating with each other over how they will set these fee reductions. The authority is concerned that this will allow the schools to restrict the discounts and keep their fees higher.
In other markets (see here and here) the competition authorities have been prepared to relax certain elements of competition law in light of the coronavirus situation. However, price fixing is the severest breach of competition law and the Competition and Markets Authority (CMA) has been clear that this continues to be the case in the current climate. A CMA spokesperson said:
Where cooperation amongst businesses or other organisations is necessary to protect consumers in the coronavirus outbreak, the CMA will not take enforcement action. But we will not tolerate organisations agreeing prices or exchanging commercially sensitive information on future pricing or business strategies with their competitors, where this is not necessary to meet the needs of the current situation.
Therefore, the CMA has written to the Independent Schools Council and other bodies representing the private school sector. This letter made clear that communicating over the fee reductions would be very likely to breach competition law and could result in fines being imposed.

This warning is important since the sector has a history of illegal communication between schools. In 2006 the Office of Fair Trading (OFT) (one of the predecessors to the CMA) imposed fines when it discovered that 50 of them, including Eton and Harrow, had for a number of years shared information on the fees they intended to charge. The OFT discovered that this had taken place following evidence obtained by a student who hacked into their school’s computer system. Here the student found information on the intended fees of competitor schools and leaked this information to the press. It is clear that the CMA will keep a close eye on private schools as they react to the ongoing pandemic.
Articles
Questions
- What are the key features of the private school sector? Is this a market where you would expect competition to be intense?
- Why is price fixing the severest breach of competition law?
- Assuming communication between the private schools is eradicated, how would you expect the sector to be affected by the coronavirus pandemic?
 The issue of inequality has come into increasing focus over recent years. The impact of the COVID-19 pandemic raises further concerns that these inequalities may be exacerbated further. Here we provide an overview of some of the key patterns in current levels of wealth and income inequality in Britain. They show, for example, the markedly higher degree of inequality in wealth relative to income, the importance of property wealth and private pension wealth in determining levels of wealth, and the considerable variation in average wealth levels of households by age and location.
According to the 6th round of the Wealth and Assets Survey the aggregate wealth of British households was £14.63 trillion in April 2016 to March 2018. This compares with £12.57 trillion in the previous survey which ran from April 2014 to March 2016. This amounts to a 16.3 per cent nominal increase. In real terms, after adjusting for consumer price inflation, the increase was 13.1 per cent. Furthermore, when compared with the first round of the survey in July 2006 to June 2008, there has been a nominal increase in the aggregate wealth of British households of 74 per cent and a real increase of 41 per cent.
What is wealth?
An important question to ask when reflecting on the growth and distribution of wealth across households is what wealth comprises. In fact, it comprises one of four components:
- Net Financial wealth – the value of financial assets (savings and financial investments) less any financial liabilities (loans and arrears)
- Physical wealth – the value of household contents, possessions, valuables and vehicles
- Private pension wealth – the value of private pensions, such as occupational pensions and personal pensions
- Net property wealth – the value of any property owned (including other land/properties owned abroad) less the value of any loans or mortgages secured on these properties.
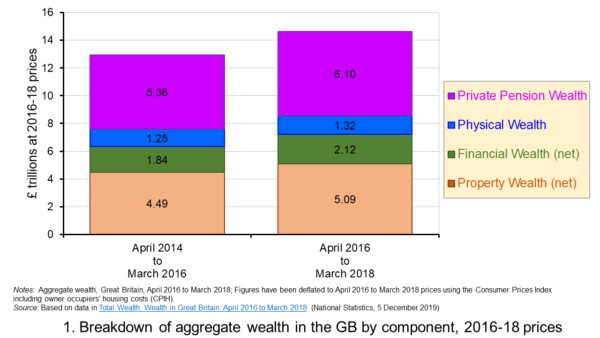 Figure 1 shows the evolution of aggregate wealth over the last two surveys (at constant 2016-18 prices) by the four component parts. Two components dominate the aggregate wealth of British households: property wealth (35 per cent) and private pension wealth (41-42 per cent). Financial wealth is the third largest component (14 per cent), while property wealth is the smallest component (9 to 10 per cent). (Click here for a PowerPoint of the chart.)
Trends in the average wealth of households
To help contextualise the size of wealth and begin to think about its distribution, rather than look at aggregate household wealth we can instead look at the average wealth of British households.
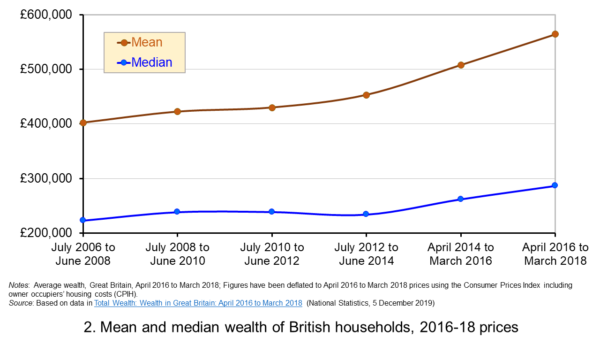 Figure 2 shows the average wealth (at constant 2016-18 prices) as measured by the mean (aggregate divided by the number of households) and the median (the middle household). The mean wealth of households is seen to be greater than their median wealth. In April 2016 to March 2018, average wealth as measured by the mean was £564,300 (an increase of 40.3 per cent over July 2006 to June 2008), whilst the average wealth of each household as measured by the median was £286,600 (an increase of 28.5 per cent over July 2006 to June 2008). (Click here for a PowerPoint of the chart.)
The higher mean value of wealth relative to the median value shows that the distribution of wealth is unequal. Therefore, the mean-to-median ratio is an indicator of inequality. In April 2016 to March 2018 the mean-to-median ratio was 1.97, up from 1.94 in April 2014 to March 2016 and 1.77 in July 2008 to June 2010, and 1.8 in the first survey in July 2006 to June 2008. This metric is therefore consistent with a more unequal distribution of wealth having arisen since the second survey in July 2008 to June 2010, a period during which the UK and global economy was been buffeted by the effects of the financial crisis and the associated economic downturn.
Trends in the average income of households
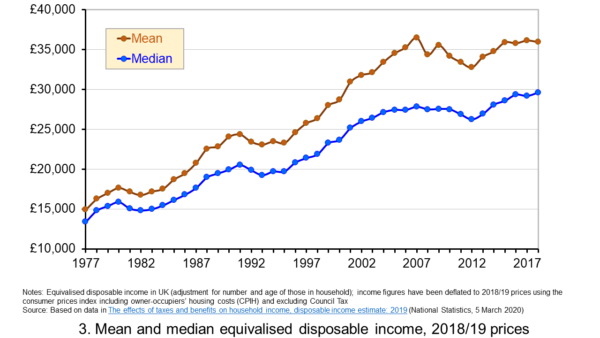 Figure 3 shows the mean and median values of disposable income (adjusted for the number and age of individuals comprising each household). Mean disposable income of UK households in financial year ending (FYE) 2018 was £35,928, a 0.5 per cent real decrease over FYE 2017, whilst median wealth (middle household) was £29,598 in FYE 2018, a 1.5 per cent real increase over FYE 2017. (Click here for a PowerPoint of the chart.)
The higher mean value of disposable income relative to the median value is indicative of inequality in disposable income. In FYE 2018 the mean-to-median ratio for disposable income was 1.21, down from 1.24 in FYE 2017 and a peak of 1.27 in FYE 2014, but higher than the 1.10 in 1978. The longer-term growth in the inequality of income helps to exacerbate existing wealth inequalities.
Comparing the inequality of income and wealth
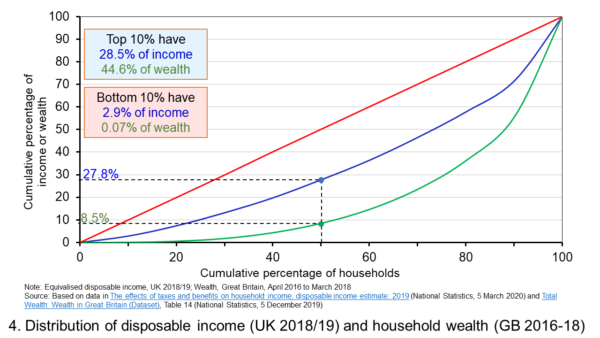 Figure 4 shows starkly the current inequality in wealth as compared to that in income. It does so by plotting their respective Lorenz curves. The curves show the proportion of overall wealth or income attributable to a given proportion of households. For example, 50 per cent of households have close to 28 per cent of total disposable income and a mere 8.5 per cent of aggregate wealth. (Click here for a PowerPoint of the chart.)
The inequality shown by the Lorenz curves is especially startling when we look at the top and bottom deciles. The bottom decile has just 2.9 per cent of income and only 0.07 per cent of wealth. Meanwhile the top 10 per cent of households have 28.5 per cent of income, almost the same as the first 50 percent of households, and some 44.6 per cent of wealth, with the previous 90 per cent of households having 55.4 per cent of wealth.
The Lorenz curves allow for the calculation of the Gini coefficient. It measures the area between the Lorenz curve and the 45 degree line consistent with zero inequality relative to the total area below the 45 degree line. Therefore, the Gini coefficient can take a value of between 0% (no inequality) and 100% (total inequality – where one person has all the wealth). Unsurprisingly whilst the Gini coefficient for disposable income in the UK in FYE 2018 was 34.7 per cent, that for aggregate wealth in Great Britain in April 2016 to March 2018 was significantly higher at 63.3 per cent.
The Gini coefficient for disposable income has risen from 25.5 per cent in 1977 to a peak in FYE 2008 of 38.6 per cent. It has therefore eased during the 2010s, but is nonetheless 13 percentage points higher today than it was four decades ago. Meanwhile, the Gini coefficient for wealth at the time of the first survey from July 2006 to June 2008 was 61 per cent. It has been unchanged at 63 percent over the last three surveys.
Inequality in wealth by component, location and age
It is important to recognise the inequalities in the components of wealth. This has particular importance when we are trying to understand how wealth varies by household characteristics, such as age and location.
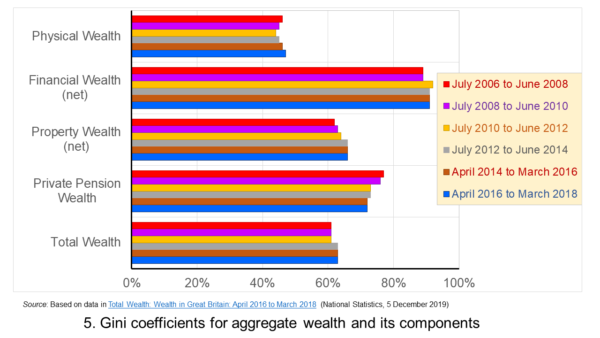 Figure 5 shows that the highest Gini coefficient is for net financial wealth. This stood at 91 per cent in April 2016 to March 2018. This extremely high figure shows the very high levels of inequatity in net financial wealth. This reflects the fact that some households find themselves with negative net financial wealth, such that their debts exceed their assets, whilst, on the other hand, some households can have large sums in financial investments. (Click here for a PowerPoint of the chart.)
We saw at the outset that the largest two components of wealth are property wealth and private pension wealth. The Gini coefficients of these two have in recent times moved in opposite directions by roughly similar magnitudes. This means that their effects on the overall Gini coefficient have offset one another. Perhaps for many people the rise in Gini coeffcient for property from 62 per cent in July 2006 to June 2008 to 66 per cent in April 2016 to March 2018 is the inequality measure that resonates most. This is reflected in regional disparities in wealth.
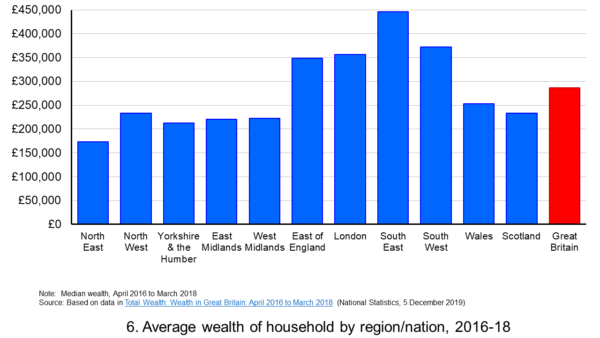 Figure 6 shows the geographical disparity of median household wealth across Britain. The regions with the highest median wealth are the South East, South West, London and the East of England. They have the highest contributions from net property wealth (40.4 per cent, 35.6 per cent, 41.7 per cent and 37.2 per cent respectively). The region with the lowest median total wealth, the North East, has the least total wealth in net property wealth (24.8 per cent). (Click here for a PowerPoint of the chart.)
Property wealth and private pension wealth also contribute to disparities in wealth by the age of the head of the household, also known as the household reference person or HRP. In April 2016 to March 2018 the mean wealth where the HRP is 25-34 was £125,700, rising to £859,200 where the HRP is 55-64 and then falling to £692,300 when the HRP is 65 or over. This is consistent with households accruing wealth over time and the using wealth to help fund retirement.
Where the age of the HRP is 55-64, mean property wealth in April 2016 to March 2018 was £255,800 compared to £53,700 where the HRP is 25-34. Meanwhile, where the age of the HRP is 55-64, mean private pension wealth was £449,100 compared to just £32,300 where the HRP is 25-34. In respect of property wealth, the deterioration in the affordability of owner-occupied housing over many years will impact especially hard on younger households. This will therefore tend to exacerbate inter-generational wealth inequality.
Whilst this briefing provides an overview of recent patterns in income and wealth inequality in Britain, the articles and press releases below consider the impact that the COVID-19 pandemic may have on inequalities.
Articles and Press Releases
- Many better-off households may increase savings as spending on ‘banned’ activities falls. Poorer households spend much more of their income on necessities and will be less resilient to any falls in income
IFS Press Release, Rowena Crawford, Alex Davenport, Robert Joyce and Peter Levell (08/04/20)
- Sector shut-downs during the coronavirus crisis affect the youngest and lowest paid workers, and women, the most
IFS Press Release, Robert Joyce and Xiaowei Xu (06/04/20)
- Coronavirus downturn ‘will exacerbate UK health inequality’
City A.M., James Warrington (09/04/20)
- Coronavirus pandemic exacerbates inequalities for women, UN warns
Guardian, Alexandra Villarreal (11/04/20)
- Inequality doesn’t just make pandemics worse – it could cause them
Guardian, Laura Spinney (12/04/20)
- The Coronavirus Will Be a Catastrophe for the Poor
The Atlantic, Derek Thompson (20/03/20)
- EU-wide inequality is back to pre-crisis levels
Social Europe, Michael Dauderstädt (15/04/20)
- Coronavirus makes inequality a public health issue
World Economic Forum, Alexandre Kalache (President, International Longevity Centre-Brazil) (13/04/20)
- Economist Joseph Stiglitz says coronavirus is ‘exposing’ health inequality in US
- CNBC, Jesse Pound (14/04/20)
ONS Bulletins
Questions
- In what ways can we use statistics to help measure and inform our analysis of inequality?
- In what ways can income inequality impact on wealth inequality?
- How can wealth inequality impact on income inequality?
- What might explain why wealth inequality is greater than income inequality?
- Explain how Lorenz curves help to generate Gini coefficients.
- Why would we expect the wealth of households with a younger household reference person (HRP) to be lower than that of a household with an older HRP? Would we expect this average to rise over all age ranges?
- If you were advising a government on policies to reduce income and wealth inequalities what sort of measures might you suggest?
- What is the difference between original income and disposable income?
- What is the difference between disposable income and equivalised disposable income?
- What role does the housing market play in affecting wealth inequality?
- Why is net financial wealth so unequally distributed?
- What is meant by health inequality? Of what significance is this for income and wealth inequality?
- What is meant by social mobility? Of what significance is this for income and wealth inequality?
 Modern Monetary Theory explained by Stephanie Kelton