 It’s two years since Russia invaded Ukraine. Western countries responded by imposing large-scale sanctions. These targeted a range of businesses, banks and other financial institutions, payments systems and Russian exports and imports. Some $1 trillion of Russian assets were frozen. Many Western businesses withdrew from Russia or cut off commercial ties. In addition, oil and gas imports from Russia have been banned by most developed countries and some developing countries, and a price cap of $60 per barrel has been imposed on Russian oil. What is more, sanctions have been progressively tightened over the past two years. For example, on the second anniversary of the invasion, President Biden announced more than 500 new sanctions against individuals and companies involved in military production and supply chains and in financing Russia’s war effort.
The economy in Russia has also been affected by large-scale emigration of skilled workers, the diversion of workers to the armed forces and the diversion of capital and workers to the armaments industry.
So has the economy of Russia been badly affected by sanctions and these other factors? The IMF in its World Economic Forecast of April 2022 predicted that the Russian economy would experience a steep, two-year recession. But, the Russian economy has fared much better than first predicted and the steep recession never materialised.
In this blog we look at Russia’s economic performance. First, we examine why the Russian economy seems stronger today than forecast two years ago. Then we look at its economic weaknesses directly attributable to the war.
Apparent resilience of the Russian economy
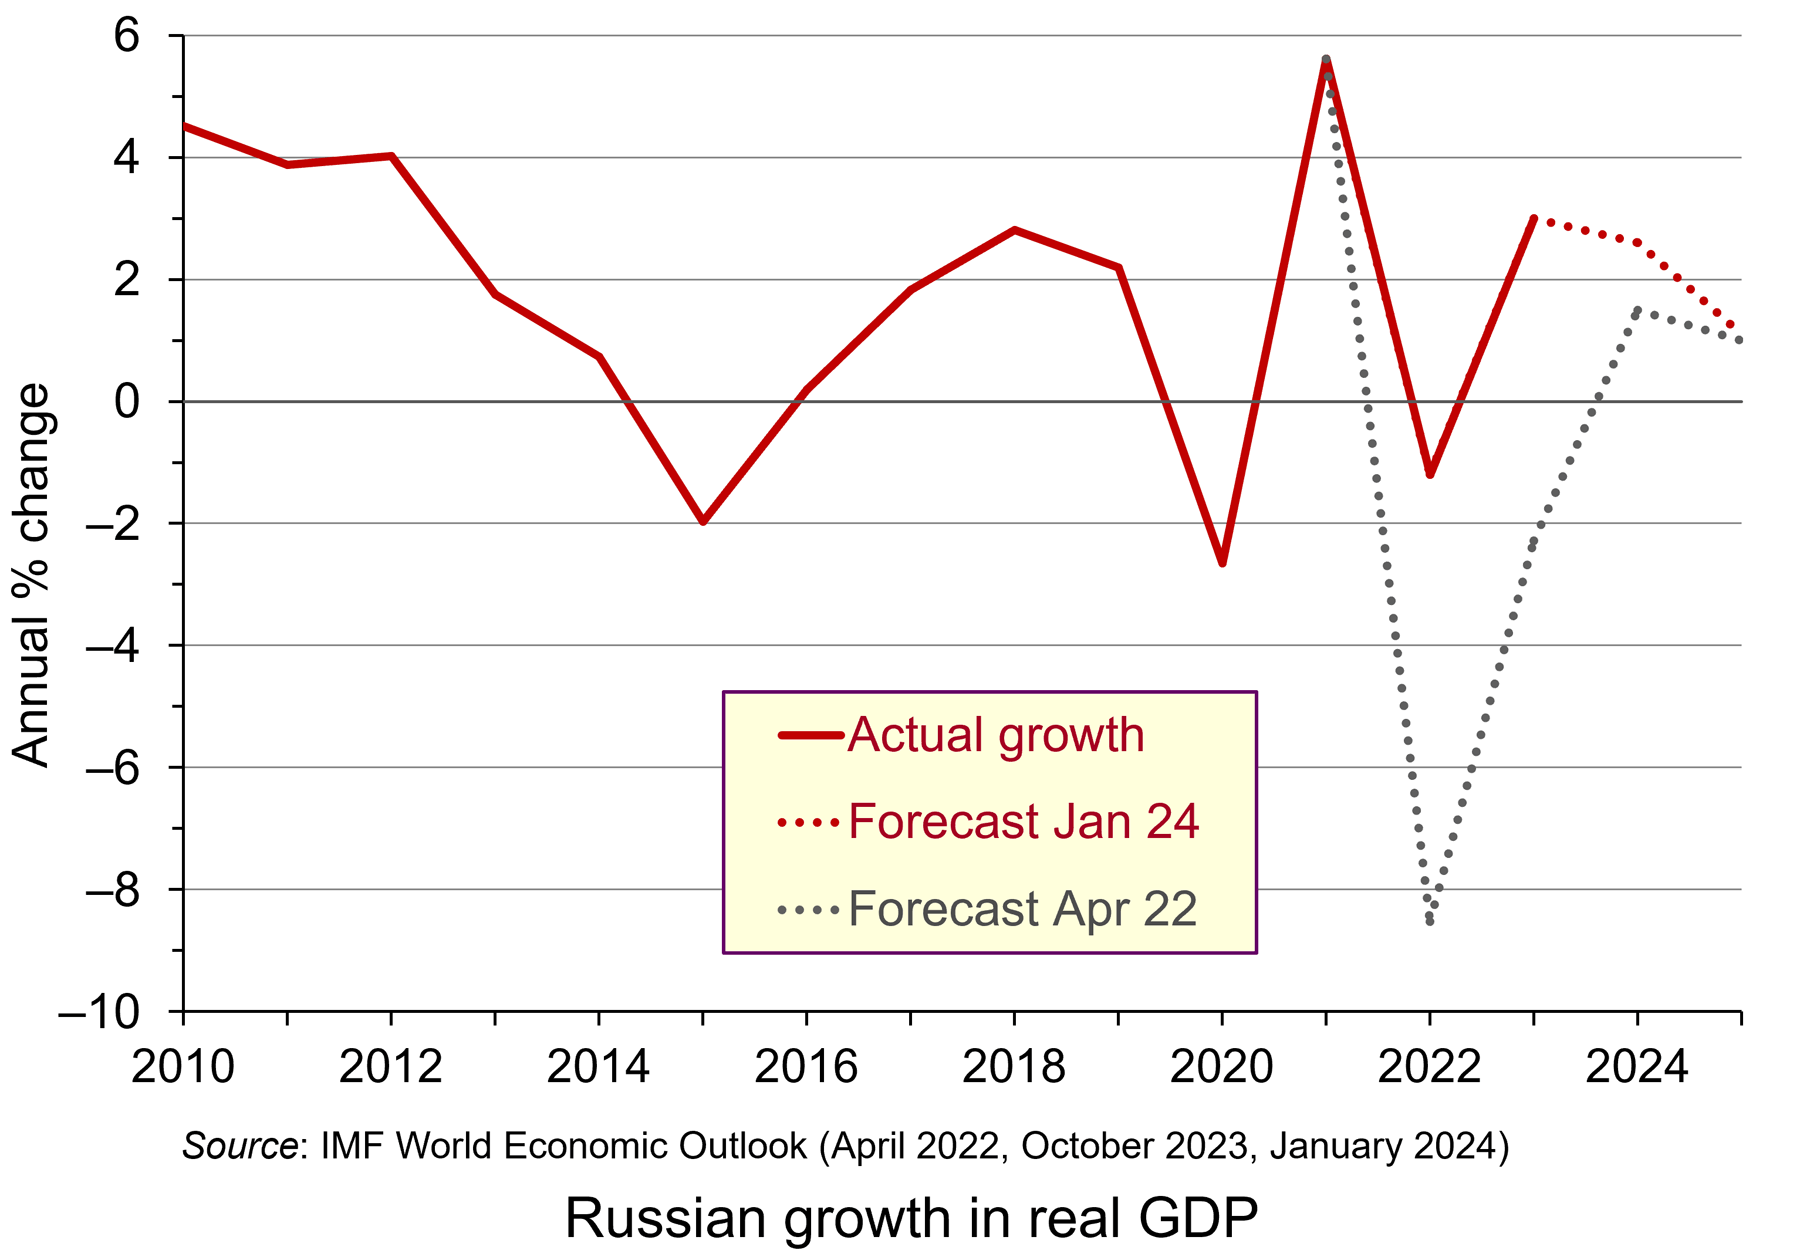 GDP forecasts have proved wrong. In April 2022, just after the start of the war, the IMF was forecasting that the Russian economy would decline by 8.5% in 2022 and by 2.3% in 2023 and grow by just 1.5% in 2024. In practice, the economy declined by only 1.2% in 2022 and grew by 3.0% in 2023. It is forecast by the IMF to grow by 2.6% in 2024. This is illustrated in the chart (click here for a PowerPoint).
Similarly, inflation forecasts have proved wrong. In April 2022, Russian consumer price inflation was forecast to be 21.3% in 2022 and 14.3% in 2023. In practice, inflation was 13.8% in 2022 and 7.4% in 2023. What is more, consumer spending in Russia has remained buoyant. In 2023, retail sales rose by 10.2% in nominal terms – a real rise of 2.8%. Wage growth has been strong and unemployment has remained low, falling from just over 4% in February 2022 to just under 3% today.
So why has the Russian economy seemingly weathered the war so successfully?
 The first reason is that, unlike Ukraine, very little of its infrastructure has been destroyed. Even though it has lost a lot of its military capital, including 1120 main battle tanks and some 2000 other armoured vehicles, virtually all of its production capacity remains intact. What is more, military production is replacing much of the destroyed vehicles and equipment.
The second is that its economy started the war in a strong position economically. In 2021, it had a surplus on the current account of its balance of payments of 6.7% of GDP, reflecting large revenues from oil, gas and mineral exports. This compares with a G7 average deficit of 0.7%. It had fiscal surplus (net general government lending) of 0.8% of GDP. The G7 countries had an average deficit of 9.1% of GDP. Its gross general government debt was 16% of GDP. The G7’s was an average of 134%. This put Russia in a position to finance the war and gave it a considerable buffer against economic sanctions.
 The third reason is that Russia has been effective in switching the destinations of exports and sources of imports. Trade with the West, Japan and South Korea has declined, but trade with China and various neutral countries, such as India have rapidly increased. Take the case of oil: in 2021, Russia exported 4.4 billion barrels of oil per day to the USA, the EU, the UK, Japan and South Korea. By 2023, this had fallen to just 0.6 billion barrels. By contrast, in 2021, it exported 1.9 billion barrels per day to China, India and Turkey. By 2023, this had risen to 4.9 billion. Although exports of natural gas have fallen by around 42% since 2021, Russian oil exports have remained much the same at around 7.4 million barrels per day (until a voluntary cut of 0.5 billion barrels per day in 2024 Q1 as part of an OPEC+ agreement to prop up the price of oil).
China is now a major supplier to Russia of components (some with military uses), commercial vehicles and consumer products (such as cars and electrical goods). Total trade with China (both imports and exports) was worth $147 billion in 2021. By 2023, this had risen to $240 billion.
The use of both the Chinese yuan and the Russian rouble (or ruble) has risen dramatically as a means of payment for Russian imports. Their share has risen from around 5% in 2021 (mainly roubles) to nearly 75% in 2023 (just over 37% in each currency). Switching trade and payment methods has helped Russia to circumvent many of the sanctions.
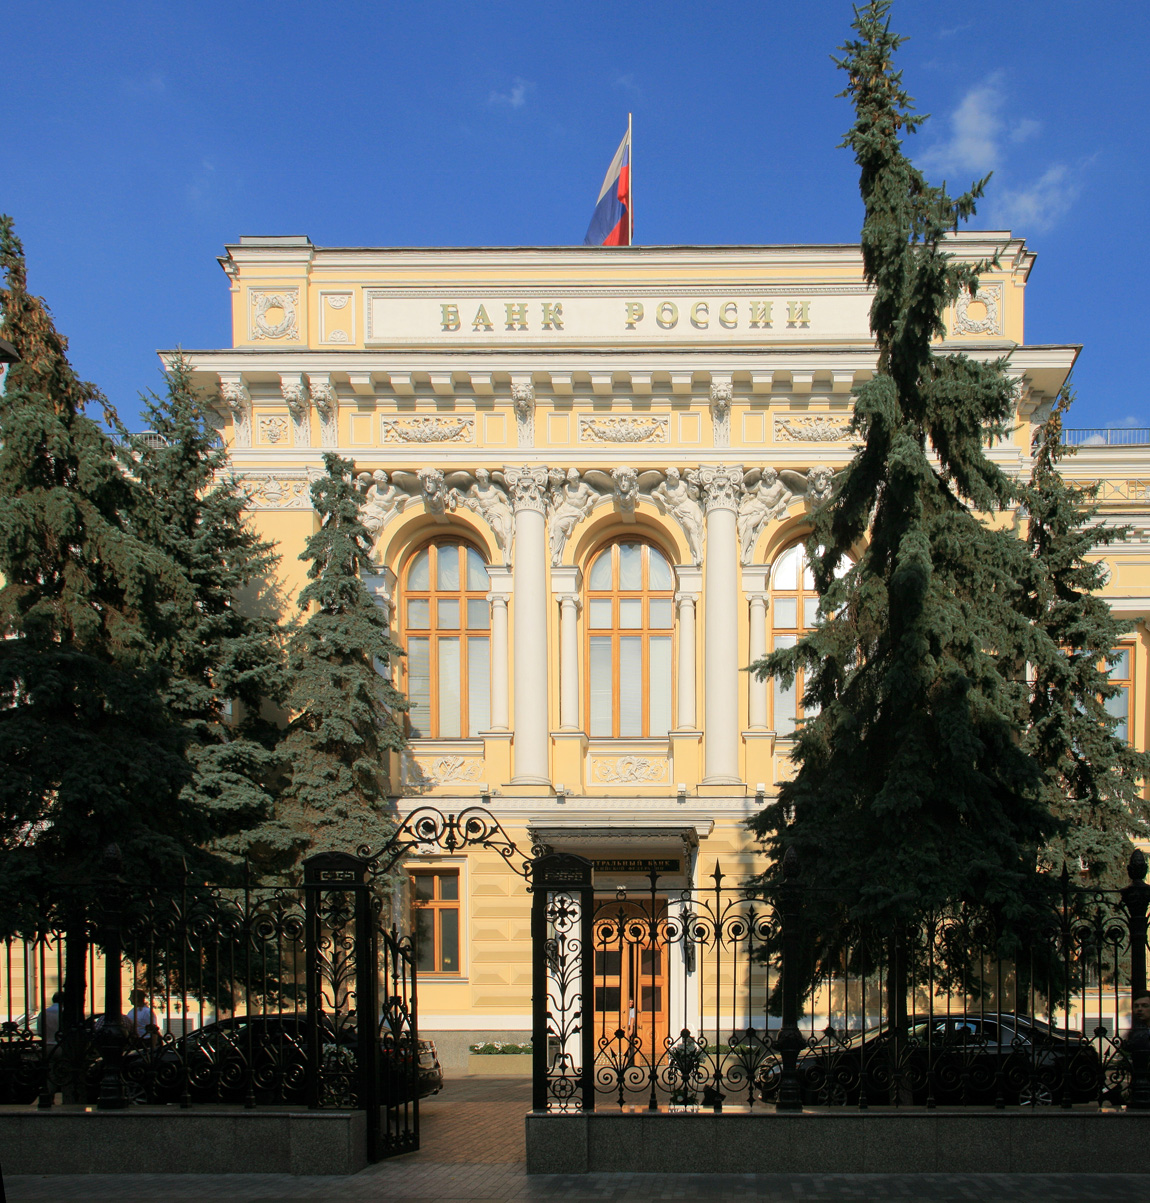 The fourth reason is that Russia has a strong and effective central bank. It has successfully used interest rates to control inflation, which is expected to fall from 7.4% in 2023 to under 5% this year and then to its target of 4% in subsequent years. The central bank policy rate was raised from 8.5% to 20% in February 2022. It then fell in steps to 7.5% in September 2022, where it remained until August 2023. It was then raised in steps to peak at 16% in December 2023, where it remains. There is a high level of confidence that the Russian central bank will succeed in bringing inflation back to target.
The fifth reason is that the war has provided a Keynesian stimulus to the economy. Military expenditure has doubled as a share of GDP – from 3.7% of GDP in 2021 to 7.5% in 2024. It now accounts for around 40% of government expenditure. The boost that this has given to production and employment has helped achieve the 3% growth rate in 2023, despite the dampening effect of a tight monetary policy.
Longer-term weaknesses
Despite the apparent resilience of the economy, there are serious weaknesses that are likely to have serious long-term effects.
There has been a huge decline in the labour supply as many skilled and professional workers have move abroad to escape the draft and as many people have been killed in battle. The shortage of workers has led to a rise in wages. This has been accompanied by a decline in labour productivity, which is estimated to have been around 3.6% in 2023.
 Higher wages and lower productivity is putting a squeeze on firms’ profits. This is being exacerbated by higher taxes on firms to help fund the war. Lower profit reduces investment and is likely to have further detrimental effects on labour productivity.
Although Russia has managed to circumvent many of the sanctions, they have still had a significant effect on the supply of goods and components from the West. As sanctions are tightened further, so this is likely to have a direct effect on production and living standards. Although GDP is growing, non-military production is declining.
The public finances at the start of the war, as we saw above, were strong. But the war effort has turned a budget surplus of 0.8% of GDP in 2021 to a deficit of 3.7% in 2023 – a deficit that will be difficult to fund with limited access to foreign finance and with domestic interest rates at 16%. As public expenditure on the military has increased, civilian expenditure has decreased. Benefits and expenditure on infrastructure are being squeezed. For example, public utilities and apartment blocks are deteriorating badly. This has a direct on living standards.
In terms of exports, although by diverting oil exports to China, India and other neutral countries Russia has manage to maintain the volume of its oil exports, revenue from them is declining. Oil prices have fallen from a peak of $125 per barrel in June 2022 to around $80 today. Production from the Arabian Gulf is likely to increase over the coming months, which will further depress oil prices.
Conclusions
With the war sustaining the Russian economy, it would be a problem for Russia if the war ended. If Russia won by taking more territory in Ukraine and forcing Ukraine to accept Russia’s terms for peace, the cost to Russia of rebuilding the occupied territories would be huge. If Russia lost territory and negotiated a settlement on Ukraine’s terms, the political cost would be huge, with a disillusioned Russian people facing reduced living standards that could lead to the overthrow of Putin. As The Conversation article linked below states:
A protracted stalemate might be the only solution for Russia to avoid total economic collapse. Having transformed the little industry it had to focus on the war effort, and with a labour shortage problem worsened by hundreds of thousands of war casualties and a massive brain drain, the country would struggle to find a new direction.
Articles
- How Russia’s economy survived two years of war
The Bell (23/2/24)
- How Russia uses China to get round sanctions
The Bell, Denis Kasyanchuk (20/2/24)
- As Ukraine’s economy burns, Russia clings to a semblance of prosperity
The Observer, Larry Elliott and Phillip Inman (24/2/24)
- ‘A lot higher than we expected’: Russian arms production worries Europe’s war planners
The Guardian, Andrew Roth (15/2/24)
- There are lessons from Russia’s GDP growth — but not the ones Putin thinks
Financial Times, Martin Sandbu (11/2/24)
 Russia’s economy going strong
DW, Miltiades Schmidt (21/2/24)
- The West tried to crush Russia’s economy. Why hasn’t it worked?
Politico, Nahal Toosi, Ari Hawkins, Koen Verhelst, Gabriel Gavin and Kyle Duggan (24/2/24)
- Don’t Buy Putin’s Bluff. The West Can Outspend Him.
Bloomberg UK, Editorial (23/2/24)
- Russia’s war economy cannot last but has bought time
BBC News, Faisal Islam (11/2/24)
- US targets Russia with more than 500 new sanctions
BBC News, George Wright and Will Vernon (24/2/24)
- Russia’s economy is now completely driven by the war in Ukraine – it cannot afford to lose, but nor can it afford to win
The Conversation, Renaud Foucart (22/2/24)
Questions
- Argue the case for and against including military production in GDP.
- How successful has the freezing of Russian assets been?
- How could Western sanctions against Russia be made more effective?
- What are the dangers to Western economies of further tightening financial sanctions against Russia?
- Would it be a desirable policy for a Western economy to divert large amounts of resources to building public infrastructure?
- Has the Ukraine war hastened the rise of the Chinese yuan as a reserve currency?
- How would you summarise Russia’s current public finances?
- How would you set about estimating the cost to Russia of its war with Ukraine?
 According to the IMF, Chinese GDP grew by 5.2% in 2023 and is predicted to grow by 4.6% this year. Such growth rates would be extremely welcome to most developed countries. UK growth in 2023 was a mere 0.5% and is forecast to be only 0.6% in 2024. Advanced economies as a whole only grew by 1.6% in 2023 and are forecast to grow by only 1.5% this year. Also, with the exception of India, the Philippines and Indonesia, which grew by 6.7%, 5.3% and 5.0% respectively in 2023 and are forecast to grow by 6.5%, 6.0% and 5.0% this year, Chinese growth also compares very favourably with other developing countries, which as a weighted average grew by 4.1% last year and are forecast to grow at the same rate this year.
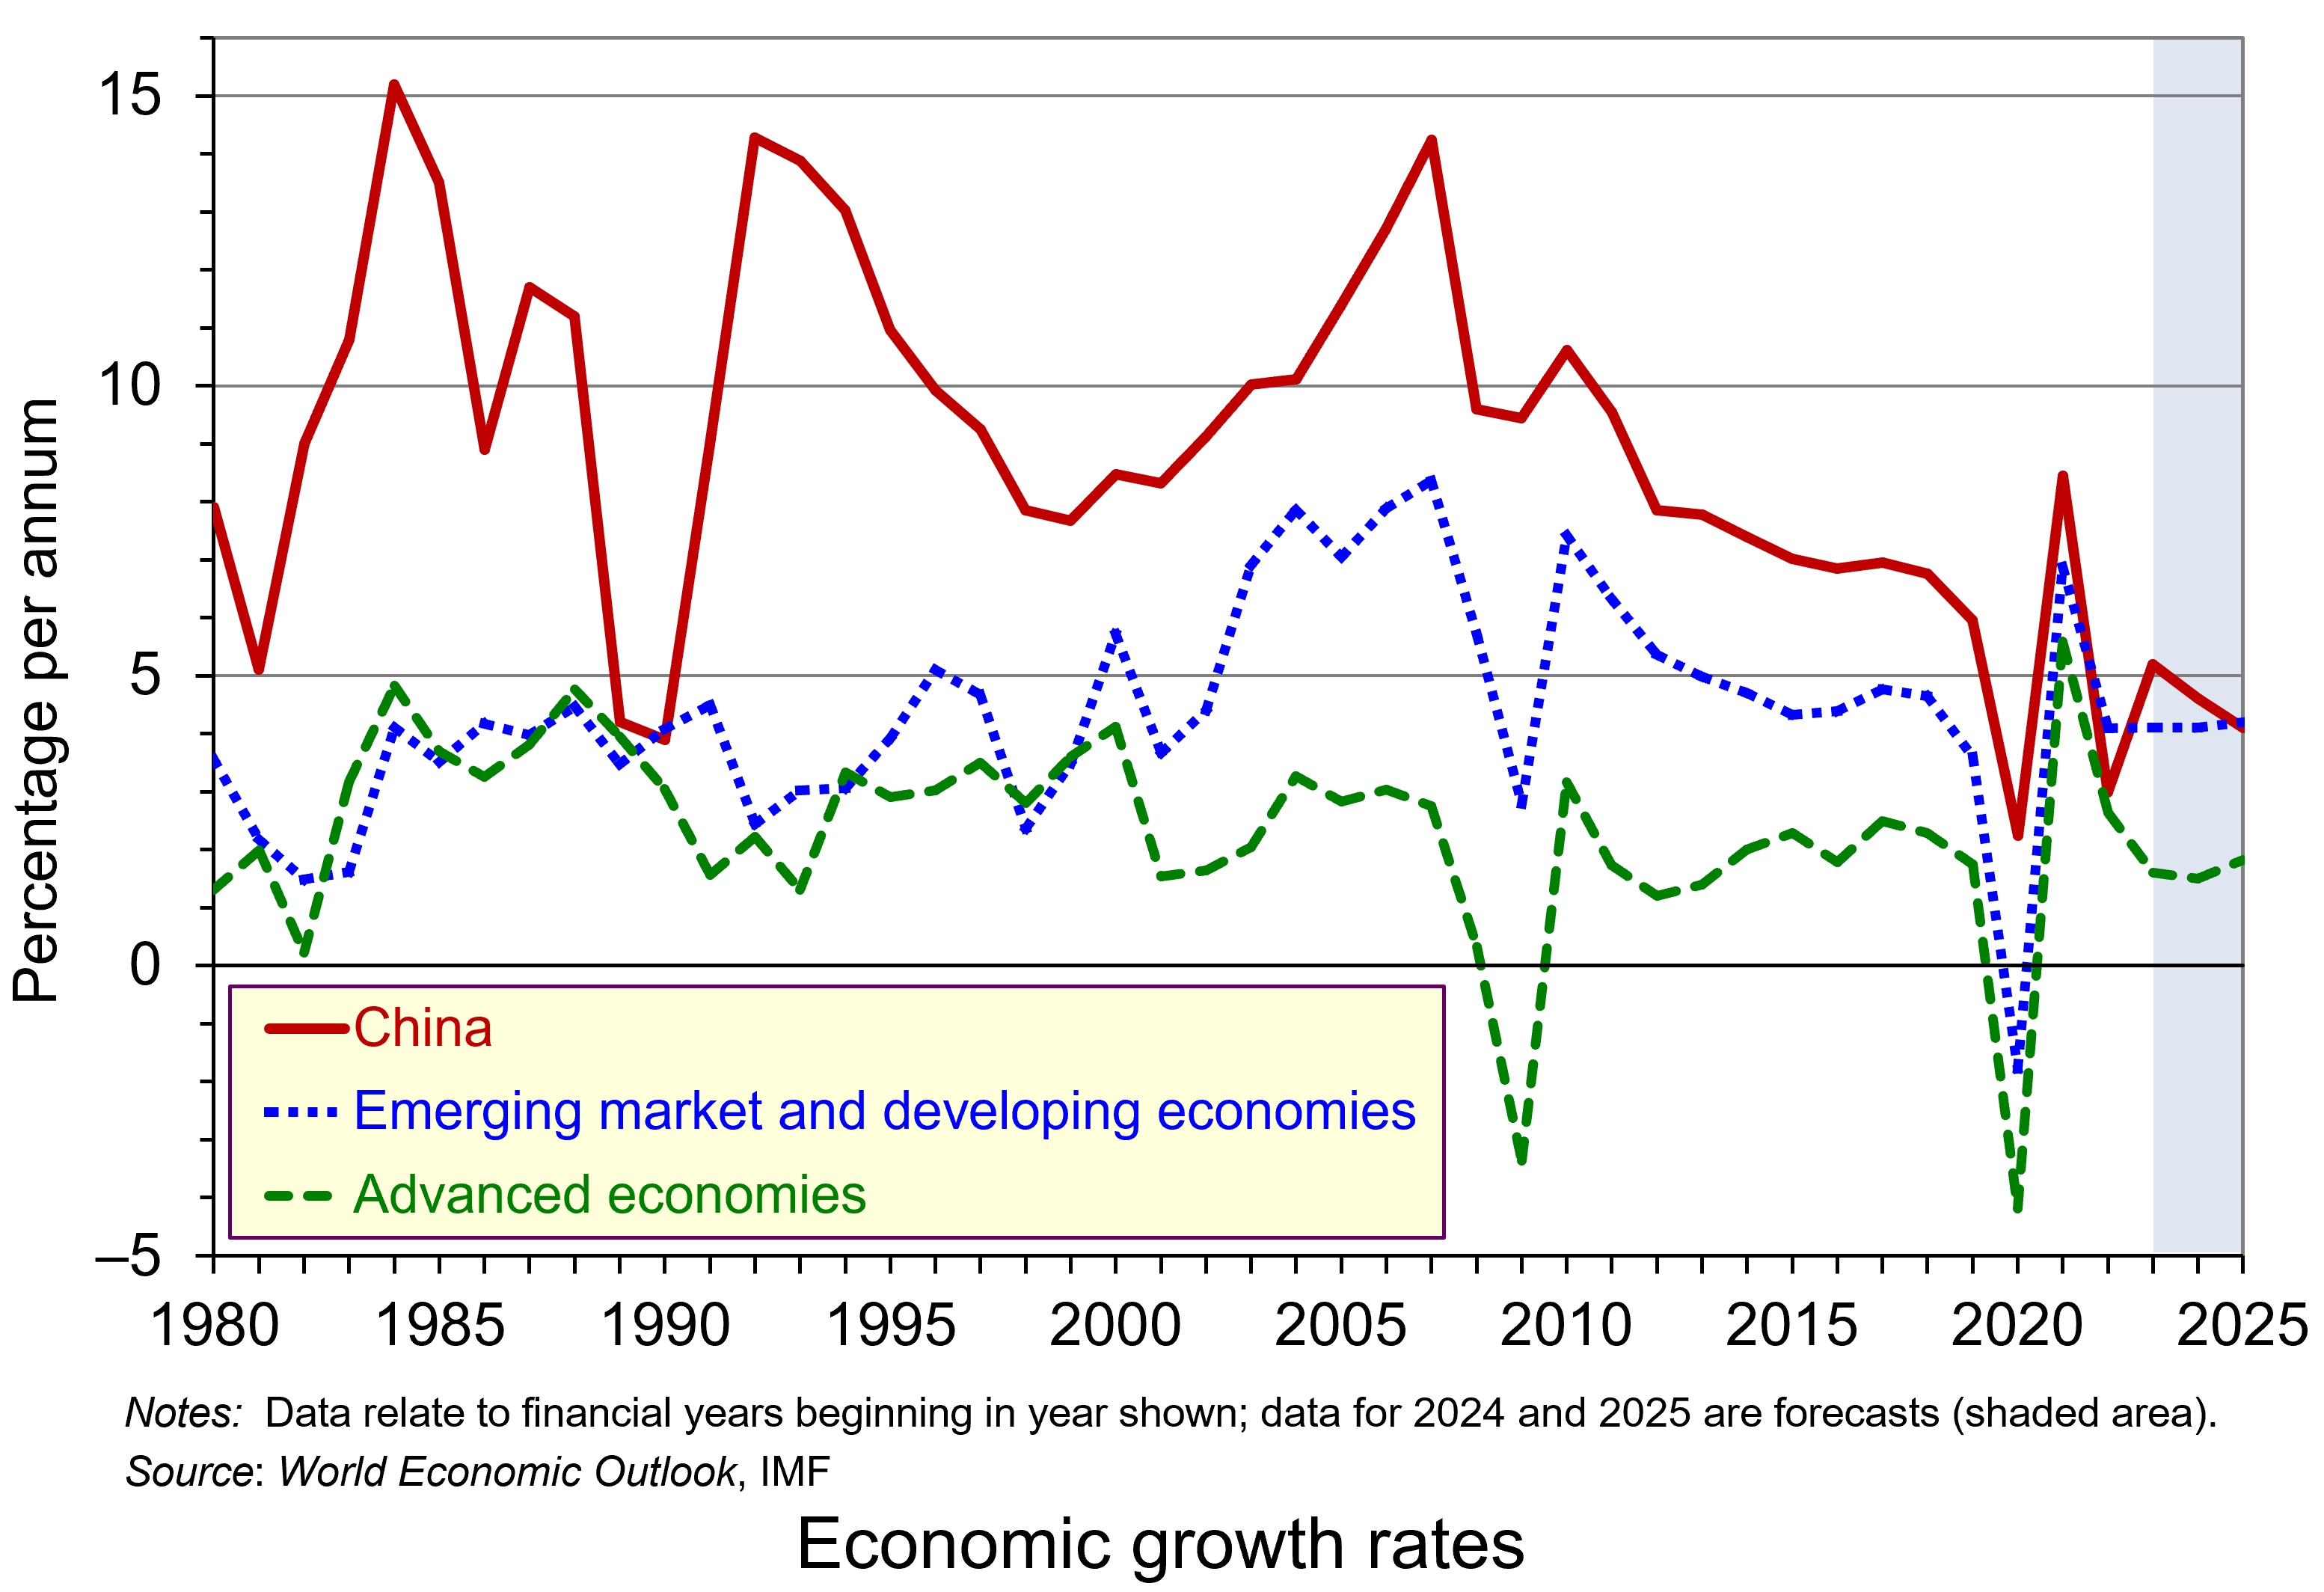 But in the past, Chinese growth was much higher and was a major driver of global growth. Over the period 1980 to 2018, Chinese economic growth averaged 9.5% – more than twice the average rate of developing countries (4.5%) and nearly four times the average rate of advanced countries (2.4%) (see chart – click here for a PowerPoint of the chart).
Not only is Chinese growth now much lower, but it is set to decline further. The IMF forecasts that in 2025, Chinese growth will have fallen to 4.1% – below the forecast developing-country average of 4.2% and well below that of India (6.5%).
Causes of slowing Chinese growth
There are a number of factors that have come together to contribute to falling economic growth rates – growth rates that otherwise would have been expected to be considerably higher as the Chinese economy reopened after severe Covid lockdowns.
 Property market
China has experienced a property boom over the past 20 years years as the government has encouraged construction in residential blocks and in factories and offices. The sector has accounted for some 20% of economic activity. But for many years, demand outstripped supply as consumers chose to invest in property, partly because of a lack of attractive alternatives for their considerable savings and partly because property prices were expected to go on rising. This lead to speculation on the part of both buyers and property developers. Consumers rushed to buy property before prices rose further and property developers borrowed considerably to buy land, which local authorities encouraged, as it provided a valuable source of revenue.
But now there is considerable overcapacity in the sector and new building has declined over the past three years. According to the IMF:
Housing starts have fallen by more than 60 per cent relative to pre-pandemic levels, a historically rapid pace only seen in the largest housing busts in cross-country experience in the last three decades. Sales have fallen amid homebuyer concerns that developers lack sufficient financing to complete projects and that prices will decline in the future.
As a result, many property developers have become unviable. At the end of January, the Chinese property giant, Evergrande, was ordered to liquidate by a Hong Kong court, after the judge ruled that the company did not have a workable plan to restructure around $300bn of debt. Over 50 Chinese property developers have defaulted or missed payments since 2020. The liquidation of Evergrande and worries about the viability of other Chinese property developers is likely to send shockwaves around the Chinese property market and more widely around Chinese investment markets.
Overcapacity
Rapid investment over many years has led to a large rise in industrial capacity. This has outstripped demand. The problem could get worse as investment, including state investment, is diverted from the property sector to manufacturing, especially electric vehicles. But with domestic demand dampened, this could lead to increased dumping on international markets – something that could spark trade wars with the USA and other trading partners (see below). Worries about this in China are increasing as the possibility of a second Trump presidency looks more possible. The Chinese authorities are keen to expand aggregate demand to tackle this overcapacity.
Uncertainty
Consumer and investor confidence are low. This is leading to severe deflationary pressures. If consumers face a decline in the value of their property, this wealth effect could further constrain their spending. This will, in turn, dampen industrial investment.
Uncertainty is beginning to affect foreign companies based in China. Many foreign companies are now making a loss in China or are at best breaking even. This could lead to disinvestment and add to deflationary pressures.
The Chinese stock market and policy responses
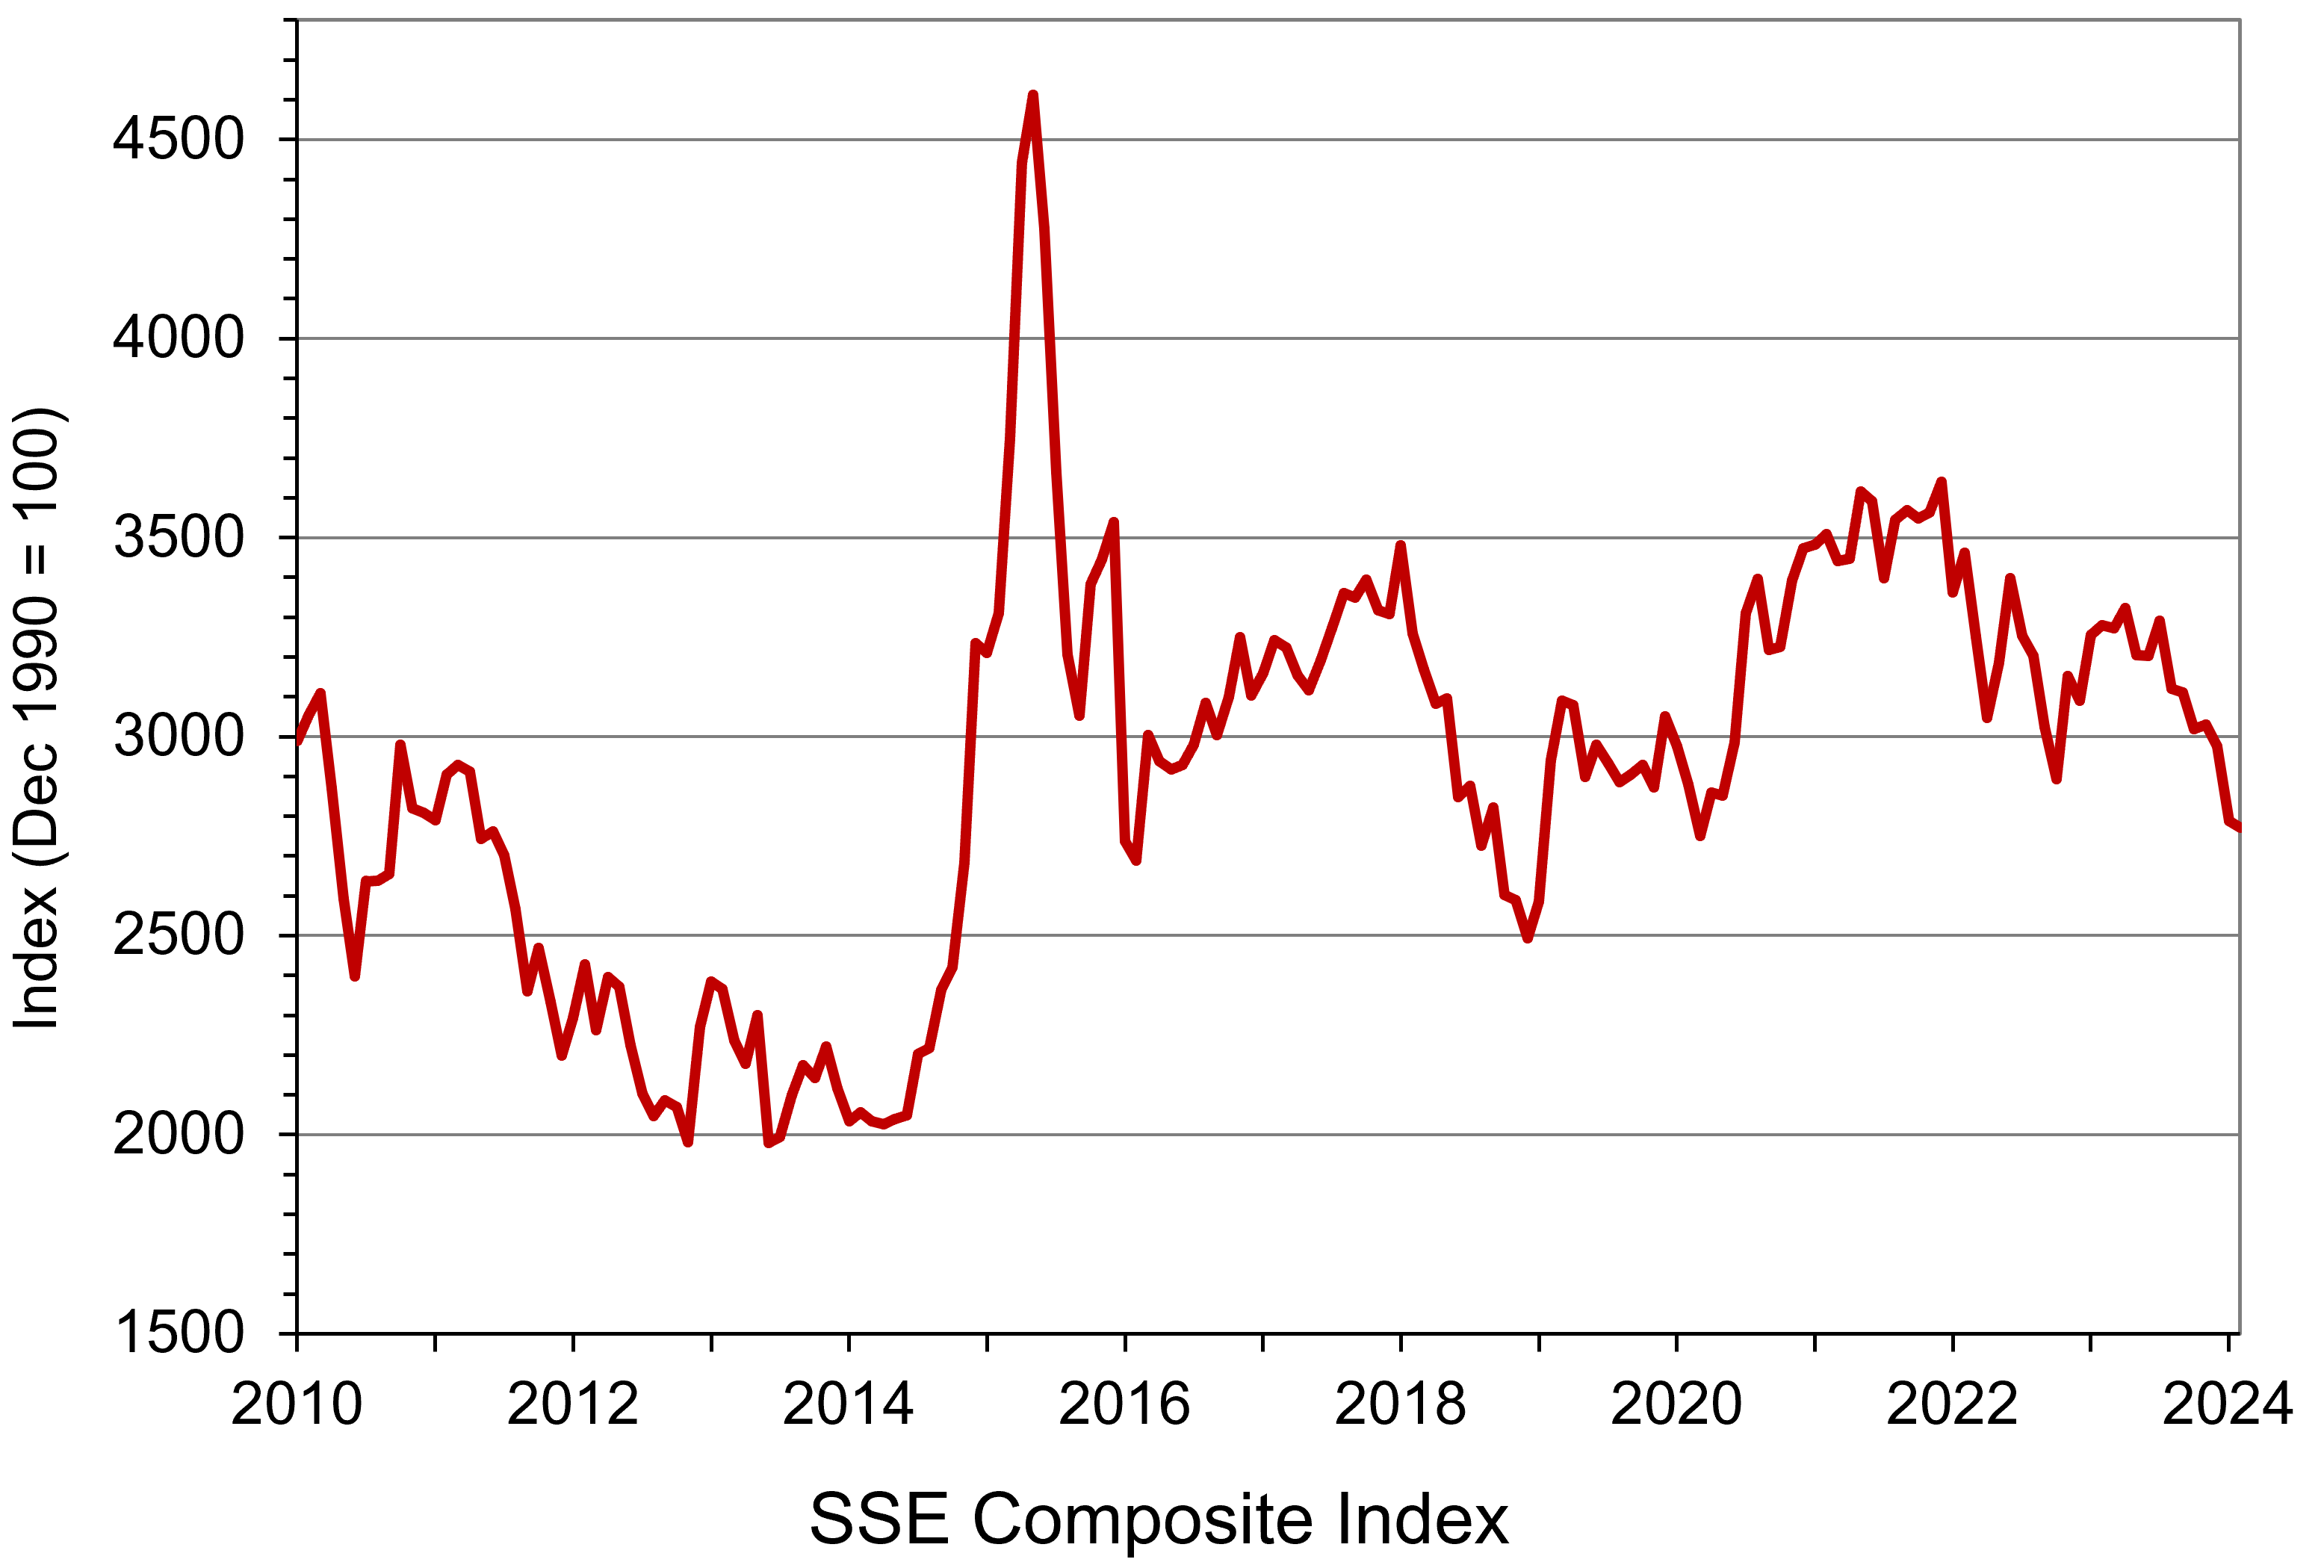 Lack of confidence in the Chinese economy is reflected in falling share prices. The Shanghai SSE Composite Index (an index of all stocks traded on the Shanghai Stock Exchange) has fallen dramatically in recent months. From a high of 3703 in September 2021, it had fallen to 2702 on 5 Feb 2024 – a fall of 27%. It is now below the level at the beginning of 2010 (see chart: click here for a PowerPoint). On 5 February alone, some 1800 stocks fell by over 10% in Shanghai and Shenzhen. People were sensing a rout and investors expressed their frustration and anger on social media, including the social media account of the US Embassy. The next day, the authorities intervened and bought large quantities of key stocks. China’s sovereign wealth fund announced that it would increase its purchase of shares to support the country’s stock markets. The SSE Composite rose 4.1% on 6 February and the Shenzhen Component Index rose 6.2%.
However, the rally eased as investors waited to see what more fundamental measures the authorities would take to support the stock markets and the economy more generally. Policies are needed to boost the wider economy and encourage a growth in consumer and business confidence.
Interest rates have been cut four times since the beginning of 2022, when the prime loan rate was cut from 3.85% to 3.7%. The last cut was from 3.55% to 3.45% in August 2023. But this has been insufficient to provide the necessary boost to aggregate demand. Further cuts in interest rates are possible and the government has said that it will use proactive fiscal and effective monetary policy in response to the languishing economy. However, government debt is already high, which limits the room for expansionary fiscal policy, and consumers are highly risk averse and have a high propensity to save.
Graduate unemployment
 China has seen investment in education as an important means of increasing human capital and growth. But with a slowing economy, there are are more young people graduating each year than there are graduate jobs available. Official data show that for the group aged 16–24, the unemployment rate was 14.9% in December. This compares with an overall urban unemployment rate of 5.1%. Many graduates are forced to take non-graduate jobs and graduate jobs are being offered at reduced salaries. This will have a further dampening effect on aggregate demand.
Demographics
China’s one-child policy, which it pursued from 1980 to 2016, plus improved health and social care leading to greater longevity, has led to an ageing population and a shrinking workforce. This is despite recent increases in unemployment in the 16–24 age group. The greater the ratio of dependants to workers, the greater the brake on growth as taxes and savings are increasingly used to provide various forms of support.
Effects on the rest of the world
China has been a major driver of world economic growth. With a slowing Chinese economy, this will provide less stimulus to growth in other countries. Many multinational companies, including chip makers, cosmetics companies and chemical companies, earn considerable revenue from China. For example, the USA exports over $190 billion of goods and services to China and these support over 1 million jobs in the USA. A slowdown in China will have repercussions for many companies around the world.
There is also the concern that Chinese manufacturers may dump products on world markets at less than average (total) cost to shift stock and keep production up. This could undermine industry in many countries and could initiate a protectionist response. Already Donald Trump is talking about imposing a 10% tariff on most imported goods if he is elected again in November. Such tariffs could be considerably higher on imports from China. If Joe Biden is re-elected, he too may impose tariffs on Chinese goods if they are thought to be unfairly subsidised. US (and possibly EU) tariffs on Chinese goods could lead to a similar response from China, resulting in a trade war – a negative sum game.
Videos
Articles
- IMF Predicts China Economy Slowing Over Next Four Years
Voice of America, Evie Steele (2/2/24)
- China’s Real Estate Sector: Managing the Medium-Term Slowdown
IMF News, Henry Hoyle and Sonali Jain-Chandra (2/2/24)
- China braced for largest human migration on earth amid bleak economic backdrop
ITV News, Debi Edward (4/2/24)
- China’s property giant Evergrande ordered to liquidate as debt talks fail
Aljazeera (29/1/24)
- China’s overcapacity a challenge that is ‘here to stay’, says US chamber
Financial Times, Joe Leahy (1/2/24)
- China needs to learn lessons from 1990s Japan
Financial Times, Gillian Tett (1/2/24)
- The Trump factor is looming over China’s markets
Financial Times, Katie Martin (2/2/24)
- China’s many systemic problems dominate its outlook for 2024
The Guardian, George Magnus (1/1/24)
- China youth unemployment will stay elevated in 2024, but EIU warns economic impact will linger
CNBC, Clement Tan (25/1/24)
- Don’t count on a soft landing for the world economy – turbulence is ahead
The Guardian, Kenneth Rogoff (2/2/24)
- As falling stocks draw criticism in China, censors struggle to keep up
Washington Post, Lily Kuo (6/2/24)
- China’s doom loop: a dramatically smaller (and older) population could create a devastating global slowdown
The Conversation, Jose Caballero (12/2/24)
- China: why the country’s economy has hit a wall – and what it plans to do about it
The Conversation, Hong Bo (19/3/24)
- Confronting inflation and low growth
OECD Economic Outlook Interim Report (September 2023) (see especially Box 1)
Questions
- Why is China experiencing slowing growth and is growth likely to pick up over the next five years?
- How does the situation in China today compare with that in Japan 30 years ago?
- What policies could the Chinese government pursue to stimulate economic growth?
- What policies were enacted towards China during the Trump presidency from 2017 to 2020?
- Would you advise the Chinese central bank to cut interest rates further? Explain.
- Should China introduce generous child support for families, no matter the number of children?
 To finance budget deficits, governments have to borrow. They can borrow short-term by issuing Treasury bills, typically for 1, 3 or 6 months. These do not earn interest and hence are sold at a discount below the face value. The rate of discount depends on supply and demand and will reflect short-term market rates of interest. Alternatively, governments can borrow long-term by issuing bonds. In the UK, these government securities are known as ‘gilts’ or ‘gilt-edged securities’. In the USA they are known as ‘treasury bonds’, ‘T-bonds’ or simply ‘treasuries’. In the EU, countries separately issue bonds but the European Commission also issues bonds.
In the UK, gilts are issued by the Debt Management Office on behalf of the Treasury. Although there are index-linked gilts, the largest proportion of gilts are conventional gilts. These pay a fixed sum of money per annum per £100 of face value. This is known as the ‘coupon payment’ and the rate is set at the time of issue. The ‘coupon rate’ is the payment per annum as a percentage of the bond’s face value:

Payments are made six-monthly. Each issue also has a maturity date, at which point the bonds will be redeemed at face value. For example, a 4½% Treasury Gilt 2028 bond has a coupon rate of 4½% and thus pays £4.50 per annum (£2.25 every six months) for each £100 of face value. The issue will be redeemed in June 2028 at face value. The issue was made in June 2023 and thus represented a 5-year bond. Gilts are issued for varying lengths of time from 2 to 55 years. At present, there are 61 different conventional issues of bonds, with maturity dates varying from January 2024 to October 2073.
Bond prices
 Bonds can be sold on the secondary market (i.e. the stock market) before maturity. The market price, however, is unlikely to be the coupon price (i.e. the face value). The lower the coupon rate relative to current interest rates, the less valuable the bond will be. For example, if interest rates rise, and hence new bonds pay a higher coupon rate, the market price of existing bonds paying a lower coupon rate must fall. Thus bond prices vary inversely with interest rates.
The market price also depends on how close the bonds are to maturity. The closer the maturity date, the closer the market price of the bond will be to the face value.
Bond yields: current yield
A bond’s yield is the percentage return that a person buying the bond receives. If a newly issued bond is bought at the coupon price, its yield is the coupon rate.
However, if an existing bond is bought on the secondary market (the stock market), the yield must reflect the coupon payments relative to the purchase price, not the coupon price. We can distinguish between the ‘current yield’ and the ‘yield to maturity’.
The current yield is the coupon payment as a percentage of the current market price of the bond:

Assume a bond were originally issued at 2% (its coupon rate) and thus pays £2 per annum. In the meantime, however, assume that interest rates have risen and new bonds now have a coupon rate of 4%, paying £4 per annum for each £100 invested. To persuade people to buy old bonds with a coupon rate of 2%, their market prices must fall below their face value (their coupon price). If their price halved, then they would pay £2 for every £50 of their market price and hence their current yield would be 4% (£2/£50 × 100).
Bond yields: yield to maturity (YTM)
But the current yield does not give the true yield – it is only an approximation. The true yield must take into account not just the market price but also the maturity value and the length of time to maturity (and the frequency of payments too, which we will ignore here). The closer a bond is to its maturity date, the higher/lower will be the true yield if the price is below/above the coupon price: in other words, the closer will the market price be to the coupon price for any given market rate of interest.
A more accurate measure of a bond’s yield is thus the ‘yield to maturity’ (YTM). This is the interest rate which makes the present value of all a bond’s future cash flows equal to its current price. These cash flows include all coupon payments and the payment of the face value on maturity. But future cash flows must be discounted to take into account the fact that money received in the future is worth less than money received now, since money received now could then earn interest.
The yield to maturity is the internal rate of return (IRR) of the bond. This is the discount rate which makes the present value (PV) of all the bond’s future cash flows (including the maturity payment of the coupon price) equal to its current market price. For simplicity, we assume that coupon payments are made annually. The formula is the one where the bond’s current market price is given by:
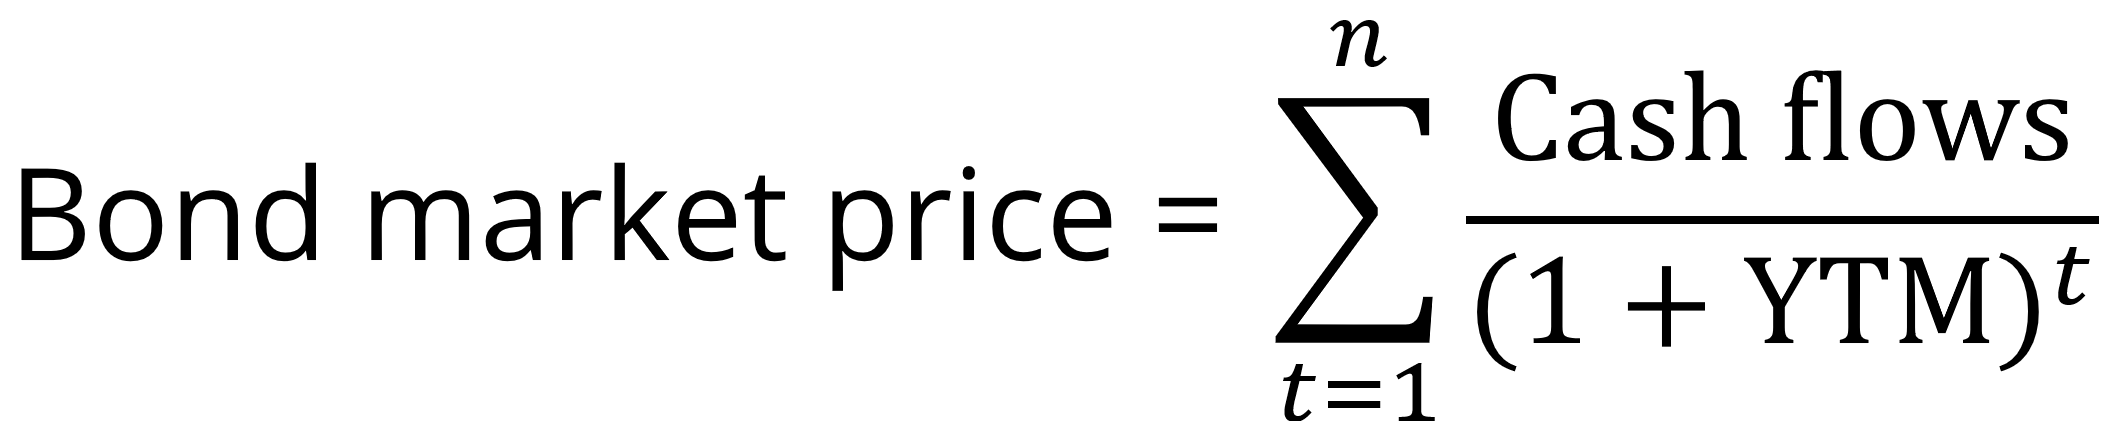
Where: t is the year; n is the number of years to maturity; YTM is the yield to maturity.
Thus if a bond paid £5 each year and had a maturity value of £100 and if current interest rates were higher than 5%, giving a yield to maturity of 8%, then the bond price would be:
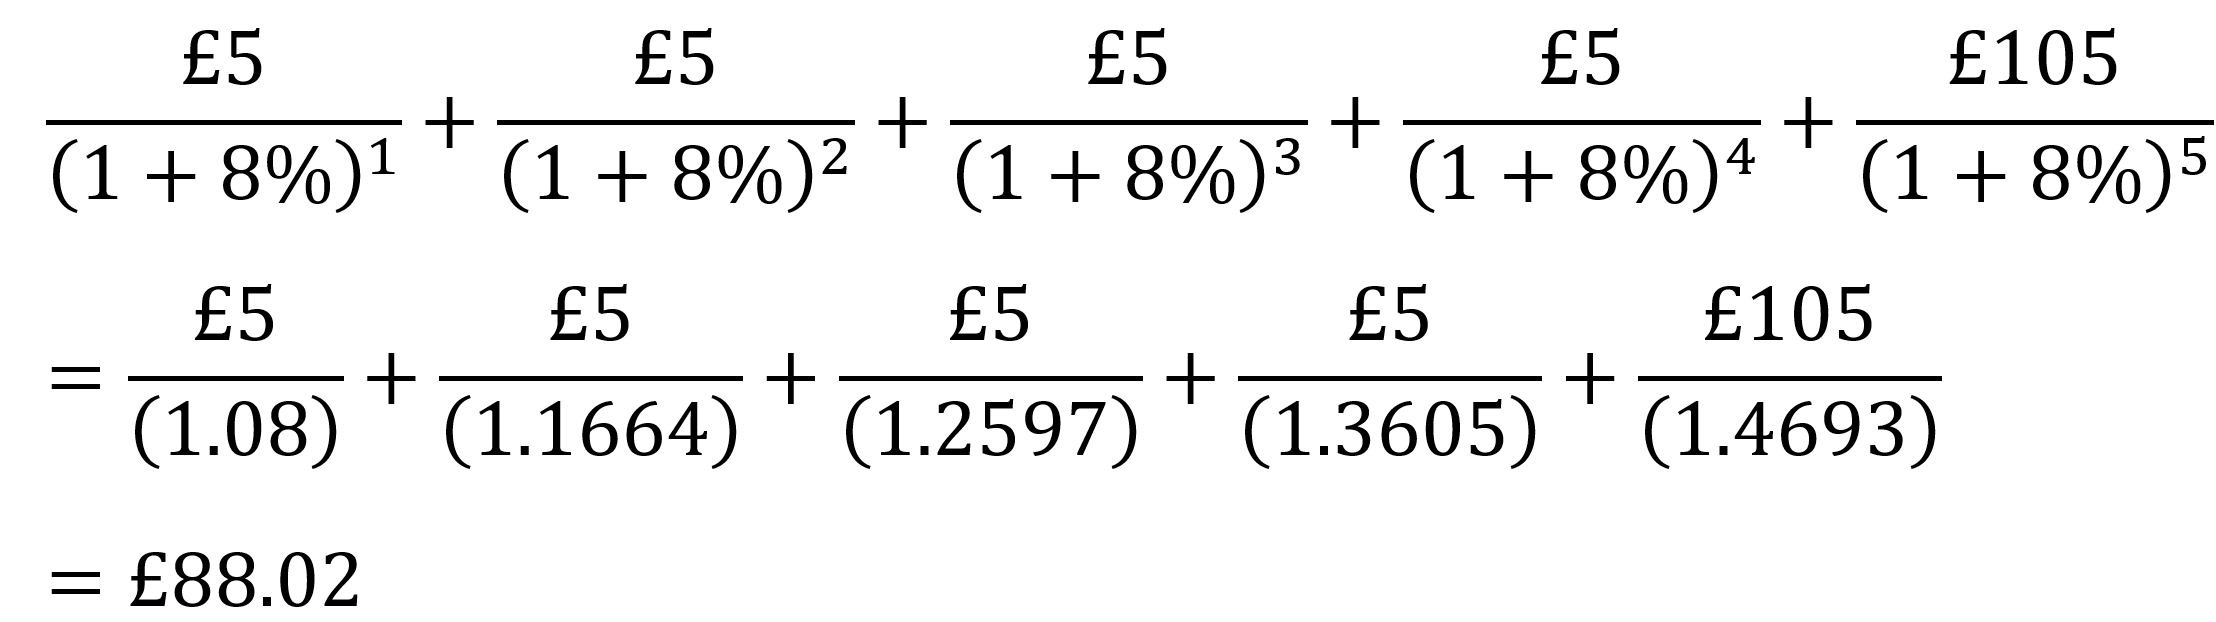
In other words, with a coupon rate of 5% and a higher YTM of 8%, the bond with a face value of £100 and five years to maturity would be worth only £88.02 today.
If you know the market price of a given bond, you can work out its YTM by substituting in the above formula. The following table gives examples.
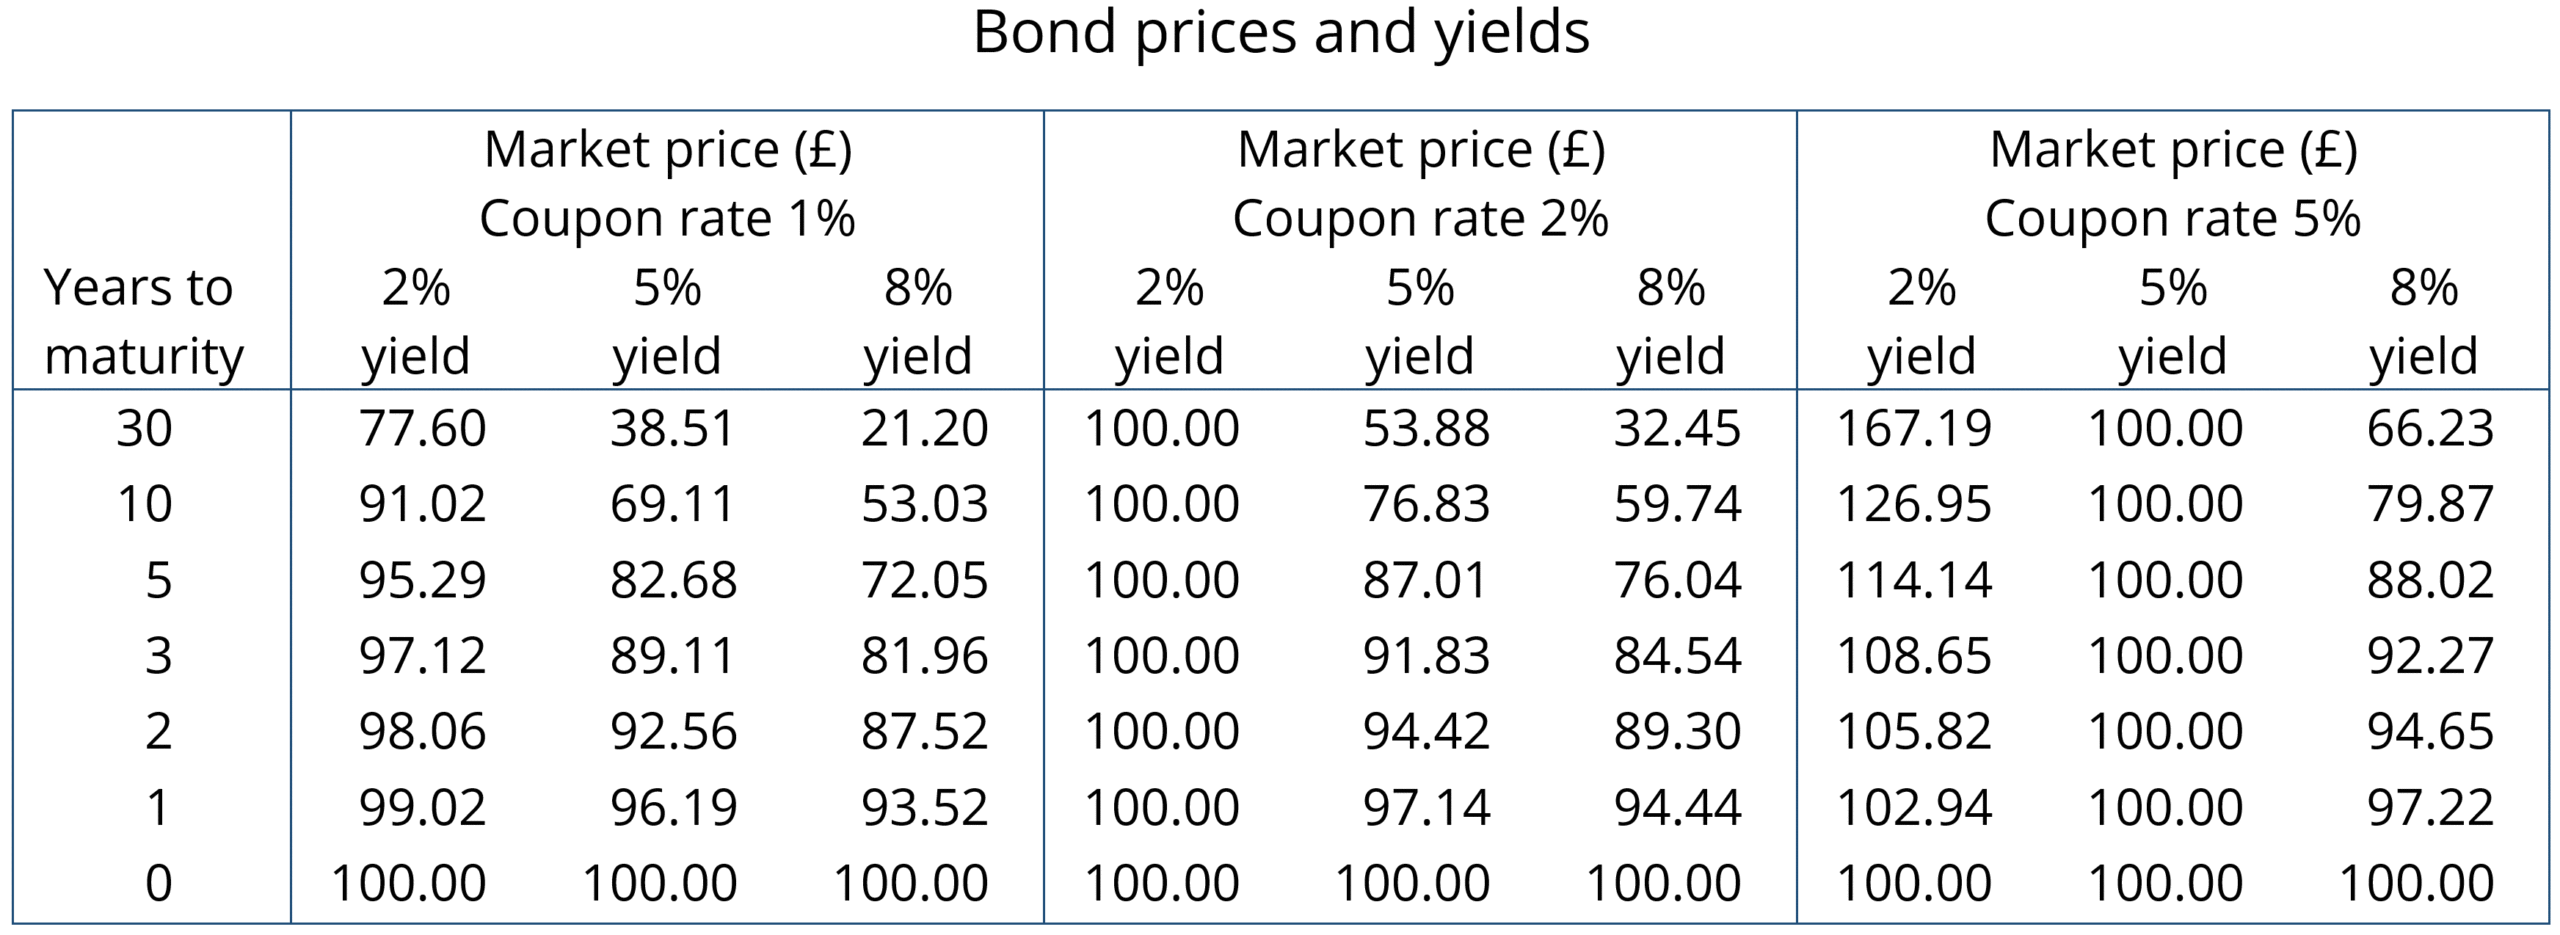
The higher the YTM, the lower the market price of a bond. Since the YTM reflects in part current rates of interest, so the higher the rate of interest, the lower the market price of any given bond. Thus bond yields vary directly with interest rates and bond prices vary inversely. You can see this clearly from the table. You can also see that market bond prices converge on the face value as the maturity date approaches.
Recent activity in bond markets
Investing in government bonds is regarded as very safe. Coupon payments are guaranteed, as is repayment of the face value on the maturity date. For this reason, many pension funds hold a lot of government bonds issued by financially trustworthy governments. But in recent months, bond prices in the secondary market have fallen substantially as interest rates have risen. For those holding existing bonds, this means that their value has fallen. For governments wishing to borrow by issuing new bonds, the cost has risen as they have to offer a higher coupon rate to attract buyers. This make it more expensive to finance government debt.
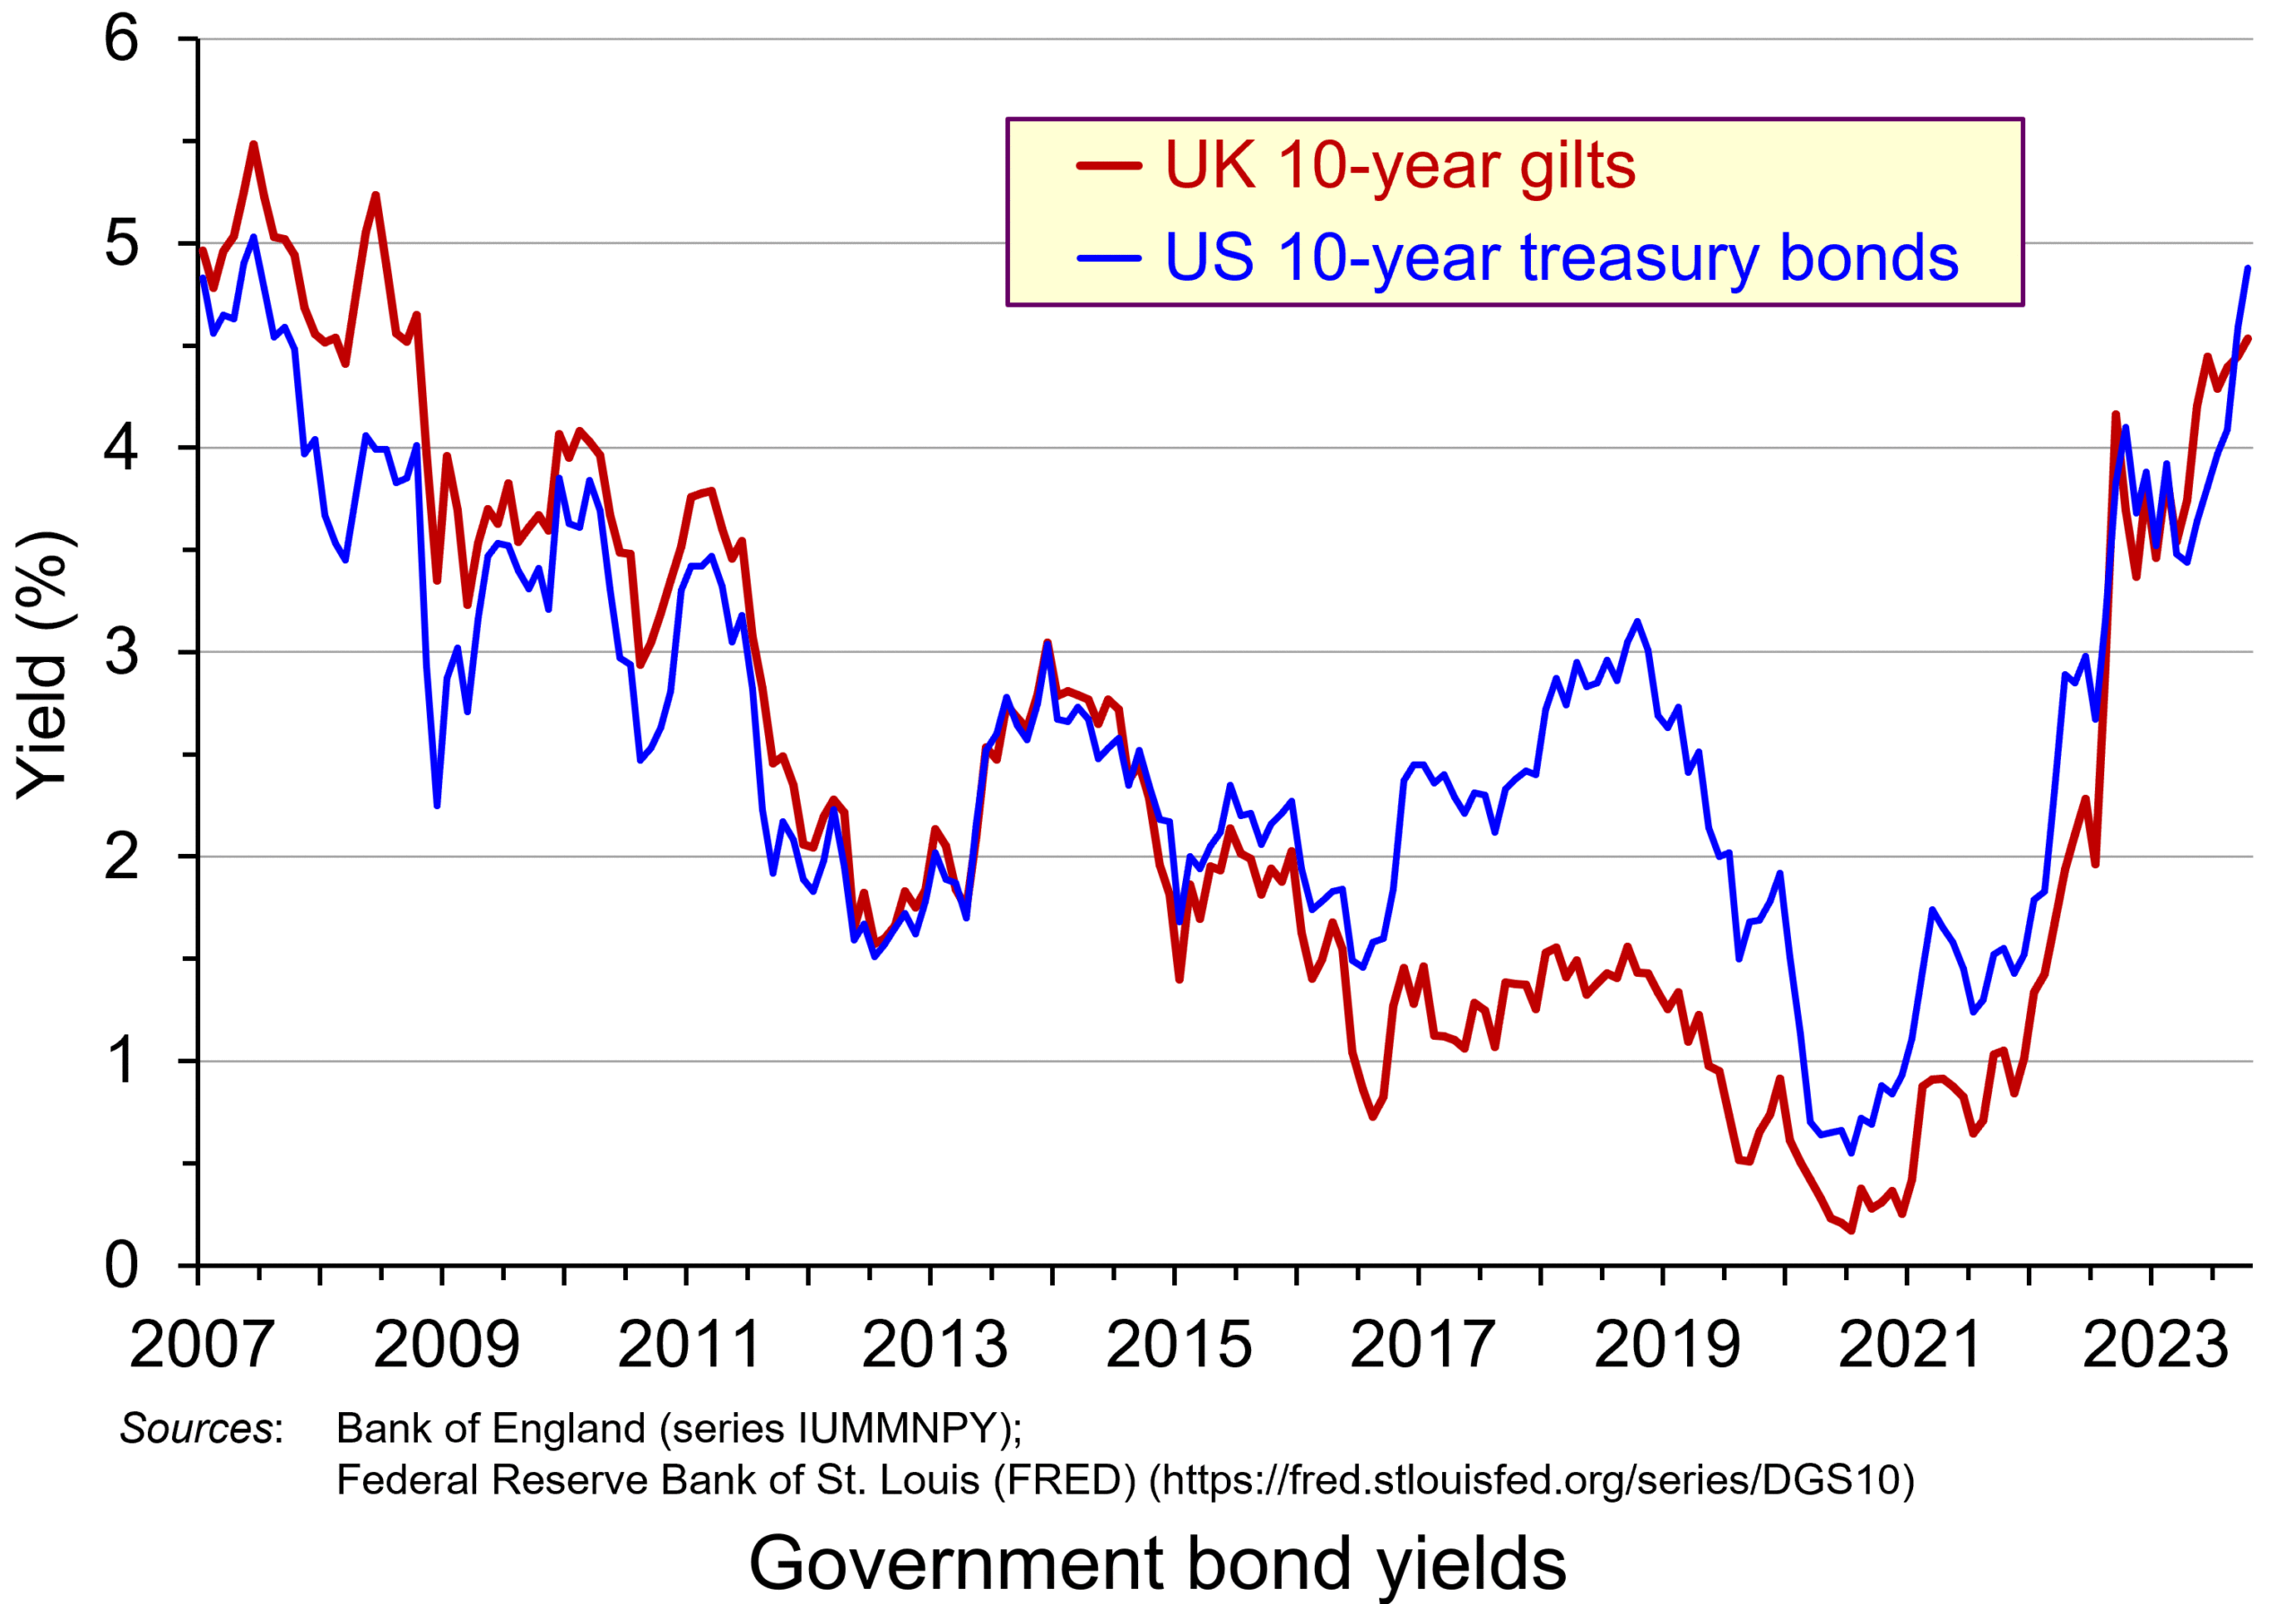 The chart shows the yield on 10-year government bonds. It is calculated using the ‘par value’ approach. This gives the coupon rate that would have to be paid for the market price of a bond to equal its face value. Clearly, as interest rates rise, a bond would have to pay a higher coupon rate for this to happen. (This, of course, is only hypothetical to give an estimate of market rates, as coupon rates are fixed at the time of a bond’s issue.)
Par values reflect both yield to maturity and also expectations of future interest rates. The higher people expect future interest rates to be, the higher must par values be to reflect this.
 In the years following the financial crisis of 2007–8 and the subsequent recession, and again during the COVID pandemic, central banks cut interest rates and supported this by quantitative easing. This involved central banks buying existing bonds on the secondary market and paying for them with newly created (electronic) money. This drove up bond prices and drove down yields (as the chart shows). This helped support the policy of low interest rates. This was a boon to governments, which were able to borrow cheaply.
This has all changed. With quantitative tightening replacing quantitative easing, central banks have been engaging in asset sales, thereby driving down bond prices and driving up yields. Again, this can be seen in the chart. This has helped to support a policy of higher interest rates.
Problems of higher bond yields/lower bond prices
Although lower bond prices and higher yields have supported a tighter monetary policy, which has been used to fight inflation, this has created problems.
First, it has increased the cost of financing government debt. In 2007/8, UK public-sector net debt was £567bn (35.6% of GDP). The Office for Budget Responsibility forecasts that it will be £2702bn (103.1% of GDP in the current financial year – 2023/24). Not only, therefore, are coupon rates higher for new government borrowing, but the level of borrowing is now a much higher proportion of GDP. In 2020/21, central government debt interest payments were 1.2% of GDP; by 2022/23, they were 4.4% (excluding interest on gilts held in the Bank of England, under the Asset Purchase Facility (quantitative easing)).
 In the USA, there have been similar increases in government debt and debt interest payments. Debt has increased from $9tn in 2007 to $33.6tn today. Again, with higher interest rates, debt interest as a percentage of GDP has risen: from 1.5% of GDP in 2021 to a forecast 2.5% in 2023 and 3% in 2024. What is more, 31 per cent of US government bonds will mature next year and will need refinancing – at higher coupon rates.
There is a similar picture in other developed countries. Clearly, higher interest payments leave less government revenue for other purposes, such as health and education.
Second, many pension funds, banks and other investment companies hold large quantities of bonds. As their price falls, so this reduces the value of these companies’ assets and makes it harder to finance new purchases, or payments or loans to customers. However, the fact that new bonds pay higher interest rates means that when existing bond holdings mature, the money can be reinvested at higher rates.
Third, bonds are often used by companies as collateral against which to borrow and invest in new capital. As bond prices fall, this can hamper companies’ ability to invest, which will lead to lower economic growth.
Fourth, higher bond yields divert demand away from equities (shares). With equity markets falling back or at best ceasing to rise, this erodes the value of savings in equities and may make it harder for firms to finance investment through new issues.
At the core of all these problems is inflation and budget deficits. Central banks have responded by raising interest rates. This drives up bond yields and drives down bond prices. But bond prices and yields depend not just on current interest rates, but also on expectations about future interest rates. Expectations currently are that budget deficits will be slow to fall as governments seek to support their economies post-COVID. Also expectations are that inflation, even though it is falling, is not falling as fast as originally expected – a problem that could be exacerbated if global tensions increase as a result of the ongoing war in Ukraine, the Israel/Gaza war and possible increased tensions with China concerning disputes in the China Sea and over Taiwan. Greater risks drive up bond yields as investors demand a higher interest premium.
Articles
Information and data
Questions
- Why do bond prices and bond yields vary inversely?
- How are bond yields and prices affected by expectations?
- Why are ‘current yield’ and ‘yield to maturity’ different?
- What is likely to happen to bond prices and yields in the coming months? Explain your reasoning.
- What constraints do bond markets place on fiscal policy?
- Would it be desirable for central banks to pause their policy of quantitative tightening?
 We have examined inflation in several blogs in recent months. With inflation at levels not seen for 40 years, this is hardly surprising. One question we’ve examined is whether the policy response has been correct. For example, in July, we asked whether the Bank of England had raised interest rates too much, too late. In judging policy, one useful distinction is between demand-pull inflation and cost-push inflation. Do they require the same policy response? Is raising interest rates to get inflation down to the target rate equally applicable to inflation caused by excessive demand and inflation caused by rising costs, where those rising costs are not caused by rising demand?
In terms of aggregate demand and supply, demand-pull inflation is shown by continuing rightward shifts in aggregate demand (AD); cost-push inflation is shown by continuing leftward/upward shifts in short-run aggregate supply (SRAS). This is illustrated in the following diagram, which shows a single shift in aggregate demand or short-run aggregate supply. For inflation to continue, rather than being a single rise in prices, the curves must continue to shift.
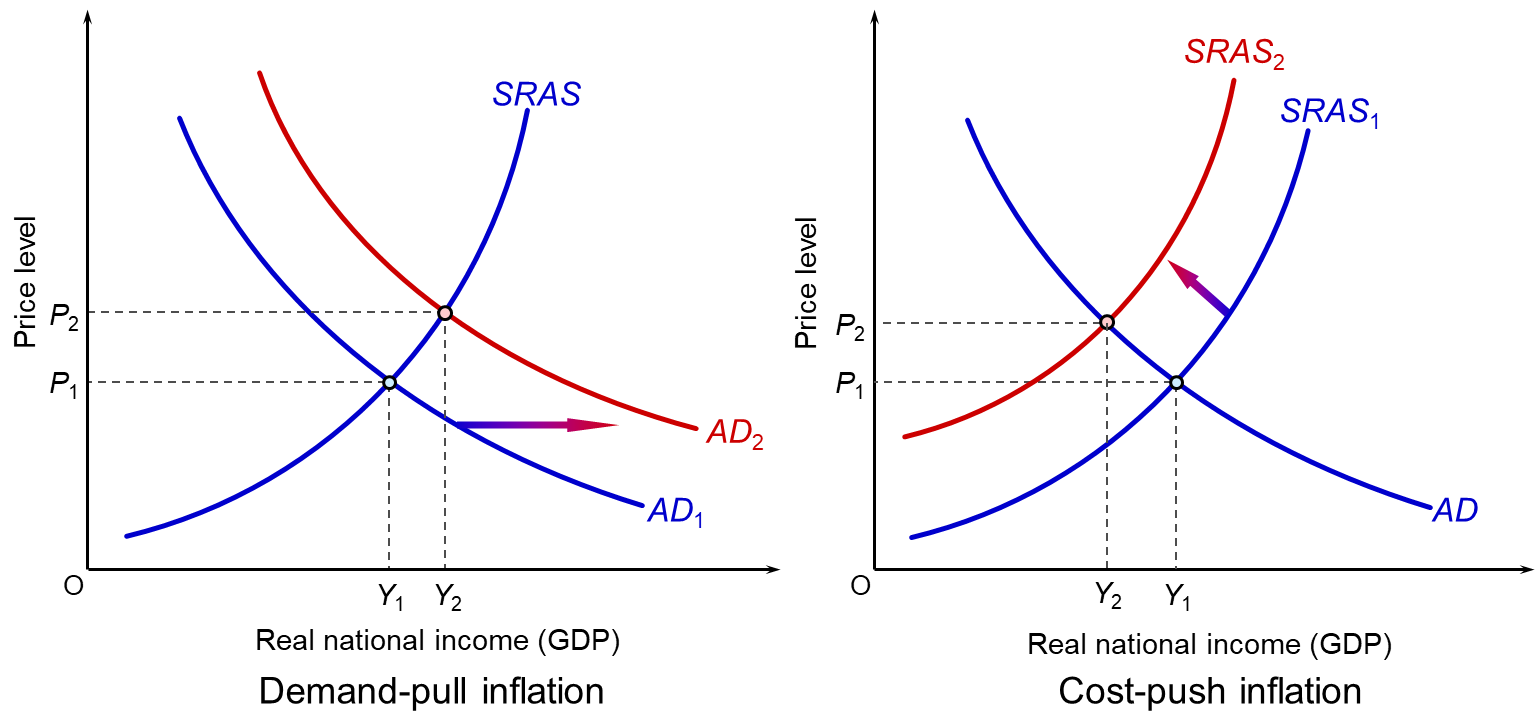
As you can see, the effects on real GDP (Y) are quite different. A rise in aggregate demand will tend to increase GDP (as long as capacity constraints allow). A rise in costs, and hence an upward shift in short-run aggregate supply, will lead to a fall in GDP as firms cut output in the face of rising costs and as consumers consume less as the cost of living rises.
The inflation experienced by the UK and other countries in recent months has been largely of the cost-push variety. Causes include: supply-chain bottlenecks as economies opened up after COVID-19; the war in Ukraine and its effects on oil and gas supplies and various grains; and avian flu and poor harvests from droughts and floods associated with global warming resulting in a fall in food supplies. These all led to a rise in prices. In the UK’s case, this was compounded by Brexit, which added to firms’ administrative costs and, according to the Bank of England, was estimated to cause a long-term fall in productivity of around 3 to 4 per cent.
The rise in costs had the effect of shifting short-run aggregate supply upwards to the left. As well as leading to a rise in prices and a cost-of-living squeeze, the rising costs dampened expenditure.
This was compounded by a tightening of fiscal policy as governments attempted to tackle public-sector deficits and debt, which had soared with the support measures during the pandemic. It was also compounded by rising interest rates as central banks attempted to bring inflation back to target.
Monetary policy response
 Central banks are generally charged with keeping inflation in the medium term at a target rate set by the government or the central bank itself. For most developed countries, this is 2% (see table in the blog, Should central bank targets be changed?). So is raising interest rates the correct policy response to cost-push inflation?
One argument is that monetary policy is inappropriate in the face of supply shocks. The supply shocks themselves have the effect of dampening demand. Raising interest rates will compound this effect, resulting in lower growth or even a recession. If the supply shocks are temporary, such as supply-chain disruptions caused by lockdowns during the pandemic, then it might be better to ride out the problem and not raise interest rates or raise them by only a small amount. Already cost pressures are easing in some areas as supplies have risen.
If, however, the fall in aggregate supply is more persistent, such as from climate-related declines in harvests or the Ukraine war dragging on, or new disruptions to supply associated with the Israel–Gaza war, or, in the UK’s case, with Brexit, then real aggregate demand may need to be reduced in order to match the lower aggregate supply. Or, at the very least, the growth in aggregate demand may need to be slowed to match the slower growth in aggregate supply.
Huw Pill, the Chief Economist at the Bank of England, in a podcast from the Columbia Law School (see links below), argued that people should recognise that the rise in costs has made them poorer. If they respond to the rising costs by seeking higher wages, or in the case of businesses, by putting up prices, this will simply stoke inflation. In these circumstances, raising interest rates to cool aggregate demand may reduce people’s ability to gain higher wages or put up prices.
 Another argument for raising interest rates in the face of cost-push inflation is when those cost increases are felt more than in other countries. The USA has suffered less from cost pressures than the UK. On the other hand, its growth rate is higher, suggesting that its inflation, albeit lower than in the UK, is more of the demand-pull variety. Despite its inflation rate being lower than in the UK, the problem of excess demand has led the Fed to adopt an aggressive interest rate policy. Its target rate is 5.25% to 5.50%, while the Bank of England’s is 5.25%. In order to prevent short-term capital outflows and a resulting depreciation in the pound, further stoking inflation, the Bank of England has been under pressure to mirror interest rate rises in the USA, the eurozone and elsewhere.
Articles
Blogs on this site
Information and data
Questions
- How may monetary policy affect inflationary expectations?
- If cost-push inflation makes people generally poorer, what role does the government have in making the distribution of a cut in real income a fair one?
- In the context of cost-push inflation, how might the authorities prevent a wage–price spiral?
- With reference to the second article above, explain the ‘monetary policy conundrum’ faced by the Bank of Japan.
- If central banks have a single policy instrument, namely changes in interest rates, how may conflicts arise when there is more than one macroeconomic objective?
- Is Russia’s rise in inflation the result of cost or demand pressures, or a mixture of the two (see articles above)?
 Central bankers, policymakers, academics and economists met at the Economic Symposium at Jackson Hole, Wyoming from August 24–26. This annual conference, hosted by Kansas City Fed, gives them a chance to discuss current economic issues and the best policy responses. The theme this year was ‘Structural Shifts in the Global Economy’ and one of the issues discussed was whether, in the light of such shifts, central banks’ 2 per cent inflation targets are still appropriate.
Inflation has been slowing in most countries, but is still above the 2 peer cent target. In the USA, CPI inflation came down from a peak of 9.1% in June 2022 to 3.2% in July 2023. Core inflation, however, which excludes food and energy was 4.7%. At the symposium, in his keynote address the Fed Chair, Jay Powell, warned that despite 11 rises in interest rates since April 2022 (from 0%–0.25% to 5%–5.25%) having helped to bring inflation down, inflation was still too high and that further rises in interest rates could not be ruled out.
We are prepared to raise rates further if appropriate, and intend to hold policy at a restrictive level until we are confident that inflation is moving sustainably down toward our objective.
However, he did recognise the need to move cautiously in terms of any further rises in interest rates as “Doing too much could also do unnecessary harm to the economy.” But, despite the rises in interest rates, growth has remained strong in the USA. The annual growth rate in real GDP was 2.4% in the second quarter of 2023. Unemployment, at 3.5%, is low by historical standards and similar to the rate before the Fed began raising interest rates.
Raising the target rate of inflation?
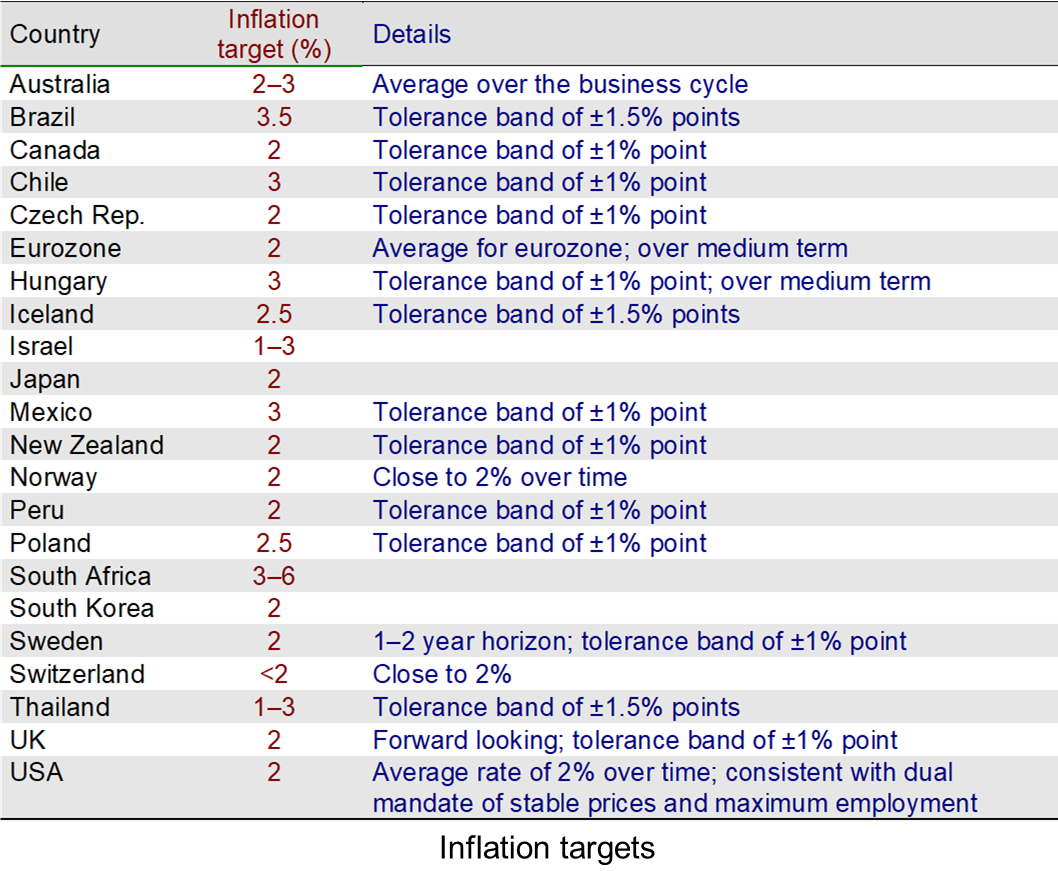 Some economists and politicians have advocated raising the target rate of inflation from 2 per cent to, perhaps, 3 per cent. Jason Furman, an economic policy professor at Harvard and formerly chief economic advisor to President Barack Obama, argues that a higher target has the benefit of helping cushion the economy against severe recessions, especially important when such there have been adverse supply shocks, such as the supply-chain issues following the COVID lockdowns and then the war in Ukraine. A higher inflation rate may encourage more borrowing for investment as the real capital sum will be eroded more quickly. Some countries do indeed have higher inflation targets, as the table shows.
Powell emphatically ruled out any adjustment to the target rate. His views were expanded upon by Christine Lagarde, the head of the European Central Bank. She argued that in a world of greater supply shocks (such as from climate change), greater frictions in markets and greater inelasticity in supply, and hence greater price fluctuations, it is important for wage increases not to chase price increases. Increasing the target rate of inflation would anchor inflationary expectations at a higher level and hence would be self-defeating. Inflation in the eurozone, as in the USA, is falling – it halved from a peak of 10.6% in 2022 to 5.3% in July this year. Given this and worries about recession, the ECB may not raise interest rates at its September meeting. However, Lagarde argued that interest rates needed to remain high enough to bring inflation back to target.
The UK position
 The Bank of England, too, is committed to a 2 per cent inflation target, even though the inflationary problems for the UK economy are greater that for many other countries. Greater shortfalls in wage growth have been more concentrated amongst lower-paid workers and especially in the public health, safety and transport sectors. Making up these shortfalls will slow the rate of inflationary decline; resisting doing so could lead to protracted industrial action with adverse effects on aggregate supply.
Then there is Brexit, which has added costs and bureaucratic procedures to many businesses. As Adam Posen (former member of the MPC) points out in the article linked below:
Even if this government continues to move towards more pragmatic relations with the EU, divergences in standards and regulation will increase costs and decrease availability of various imports, as will the end of various temporary exemptions. The base run rate of inflation will remain higher for some time as a result.
Then there is a persistent problem of low investment and productivity growth in the UK. This restriction on the supply side will make it difficult to bring inflation down, especially if workers attempt to achieve pay increases that match cost-of-living increases.
Sticking to the status quo
There seems little appetite among central bankers to adjust inflation targets. Squeezing inflation out of their respective economies is painful when inflation originates largely on the supply side and hence the problem is how to reduce demand and real incomes below what they would otherwise have been.
Raising inflation targets, they argue, would not address this fundamental problem and would probably simply anchor inflationary expectations at the higher level, leaving real incomes unchanged. Only if such policies led to a rise in investment would a higher target be justified and central bankers do not believe that it would.
Articles
- What happens in Jackson Hole doesn’t stay in Jackson Hole
CNN, Elisabeth Buchwald (26/8/23)
- Fed Chair Powell calls inflation ‘too high’ and warns that ‘we are prepared to raise rates further’
CNBC, Jeff Cox (25/8/23)
- Inflation? This man holds the key
Politico, Geoffrey Smith and Carlo Boffa (24/8/23)
- Global inflation pressures could become harder to manage in coming years, research suggests
Independent, Christopher Rugaber (27/8/23)
- Christine Lagarde warns of long-term inflation risks after global economic upheaval
Financial Times, Martin Arnold and Colby Smith (25/8/23)
- No appetite at Fed, ECB for changing inflation goal
Reuters, Ann Saphir, Howard Schneider and Balazs Koryani (25/8/23)
- Is it time for Fed to raise interest rate target to 3%? Experts weigh in
mint, Nishant Kumar (22/8/23)
- What is the UK inflation rate and why is it so high?
BBC News (16/8/23)
- If you think the UK’s high-inflation cycle has run its course, think again
The Observer, Adam Posen (26/8/23)
Data
Questions
- Use an aggregate demand and supply diagram (AD/AS or DAD/DAS) to illustrate inflation since the opening up of economies after the COVID lockdowns. Use another one to illustrate the the effects of central banks raising interest rates?
- Why is the world likely to continue experiencing bigger supply shocks and greater price volatility than before the pandemic?
- With hindsight, was increasing narrow money after the financial crisis and then during the pandemic excessive? Would it have been better to have used the extra money to fund government spending on infrastructure rather than purchasing assets such as bonds in the secondary market?
- What are the arguments for and against increasing the target rate of inflation?
- How do inflationary expectations influence the actual rate of inflation?
- Consider the arguments for and against the government matching pay increases for public-sector workers to the cost of living.