 In the third of our series on the distinction between nominal and real values we show its importance when analysing retail sales data. In the UK, such data are available from the Office for National Statistics. This blog revisits an earlier one, Nominal and real retail sales figures: interpreting the data, written in October 2023. We find that inflation-adjusted retail sales data reveal some stark patterns in the sector. They help contextualise some of the challenges faced by high streets up and down the UK.
The Retail Sales Index
Retail sales relate to spending on items such as food, clothing, footwear and household goods. They involve sales by retailers directly to final consumers, whether in store or online. Spending on services such as holidays, air fares and train tickets, insurance, banking, hotels and restaurants are not included, as are sales of motor vehicles. The Retail Sales Index for Great Britain is based on a monthly survey of around 5000 retailers across England, Scotland and Wales and is thought to capture around three-quarters of turnover in the retail industry.
Estimates of retail sales are published in index form. There are two indices published by the ONS: a value and volume measure. The value index reflects the total turnover of business, while the volume index adjusts the value index for price changes. Hence, the value estimates are nominal, while the volume estimates are real. The key point here is that the nominal estimates reflect both price and volume changes, whereas the real estimates adjust for price movements to capture only volume changes.
The headline ONS figures for May 2024 showed a rise by 2.9 per cent in the volume of retail sales, following a 1.8 per cent fall in April. In value terms, May saw a 3.3 per cent rise in retail sales following a 2.3 fall in March. Monthly changes can be quite volatile, even after seasonal adjustment, and sensitive to peculiar factors. For example, the poor weather in April 2024 helped to depress retail spending. It is, therefore, sensible to take a longer-term view when looking for clearer patterns in spending behaviour.
Growth of retail sales
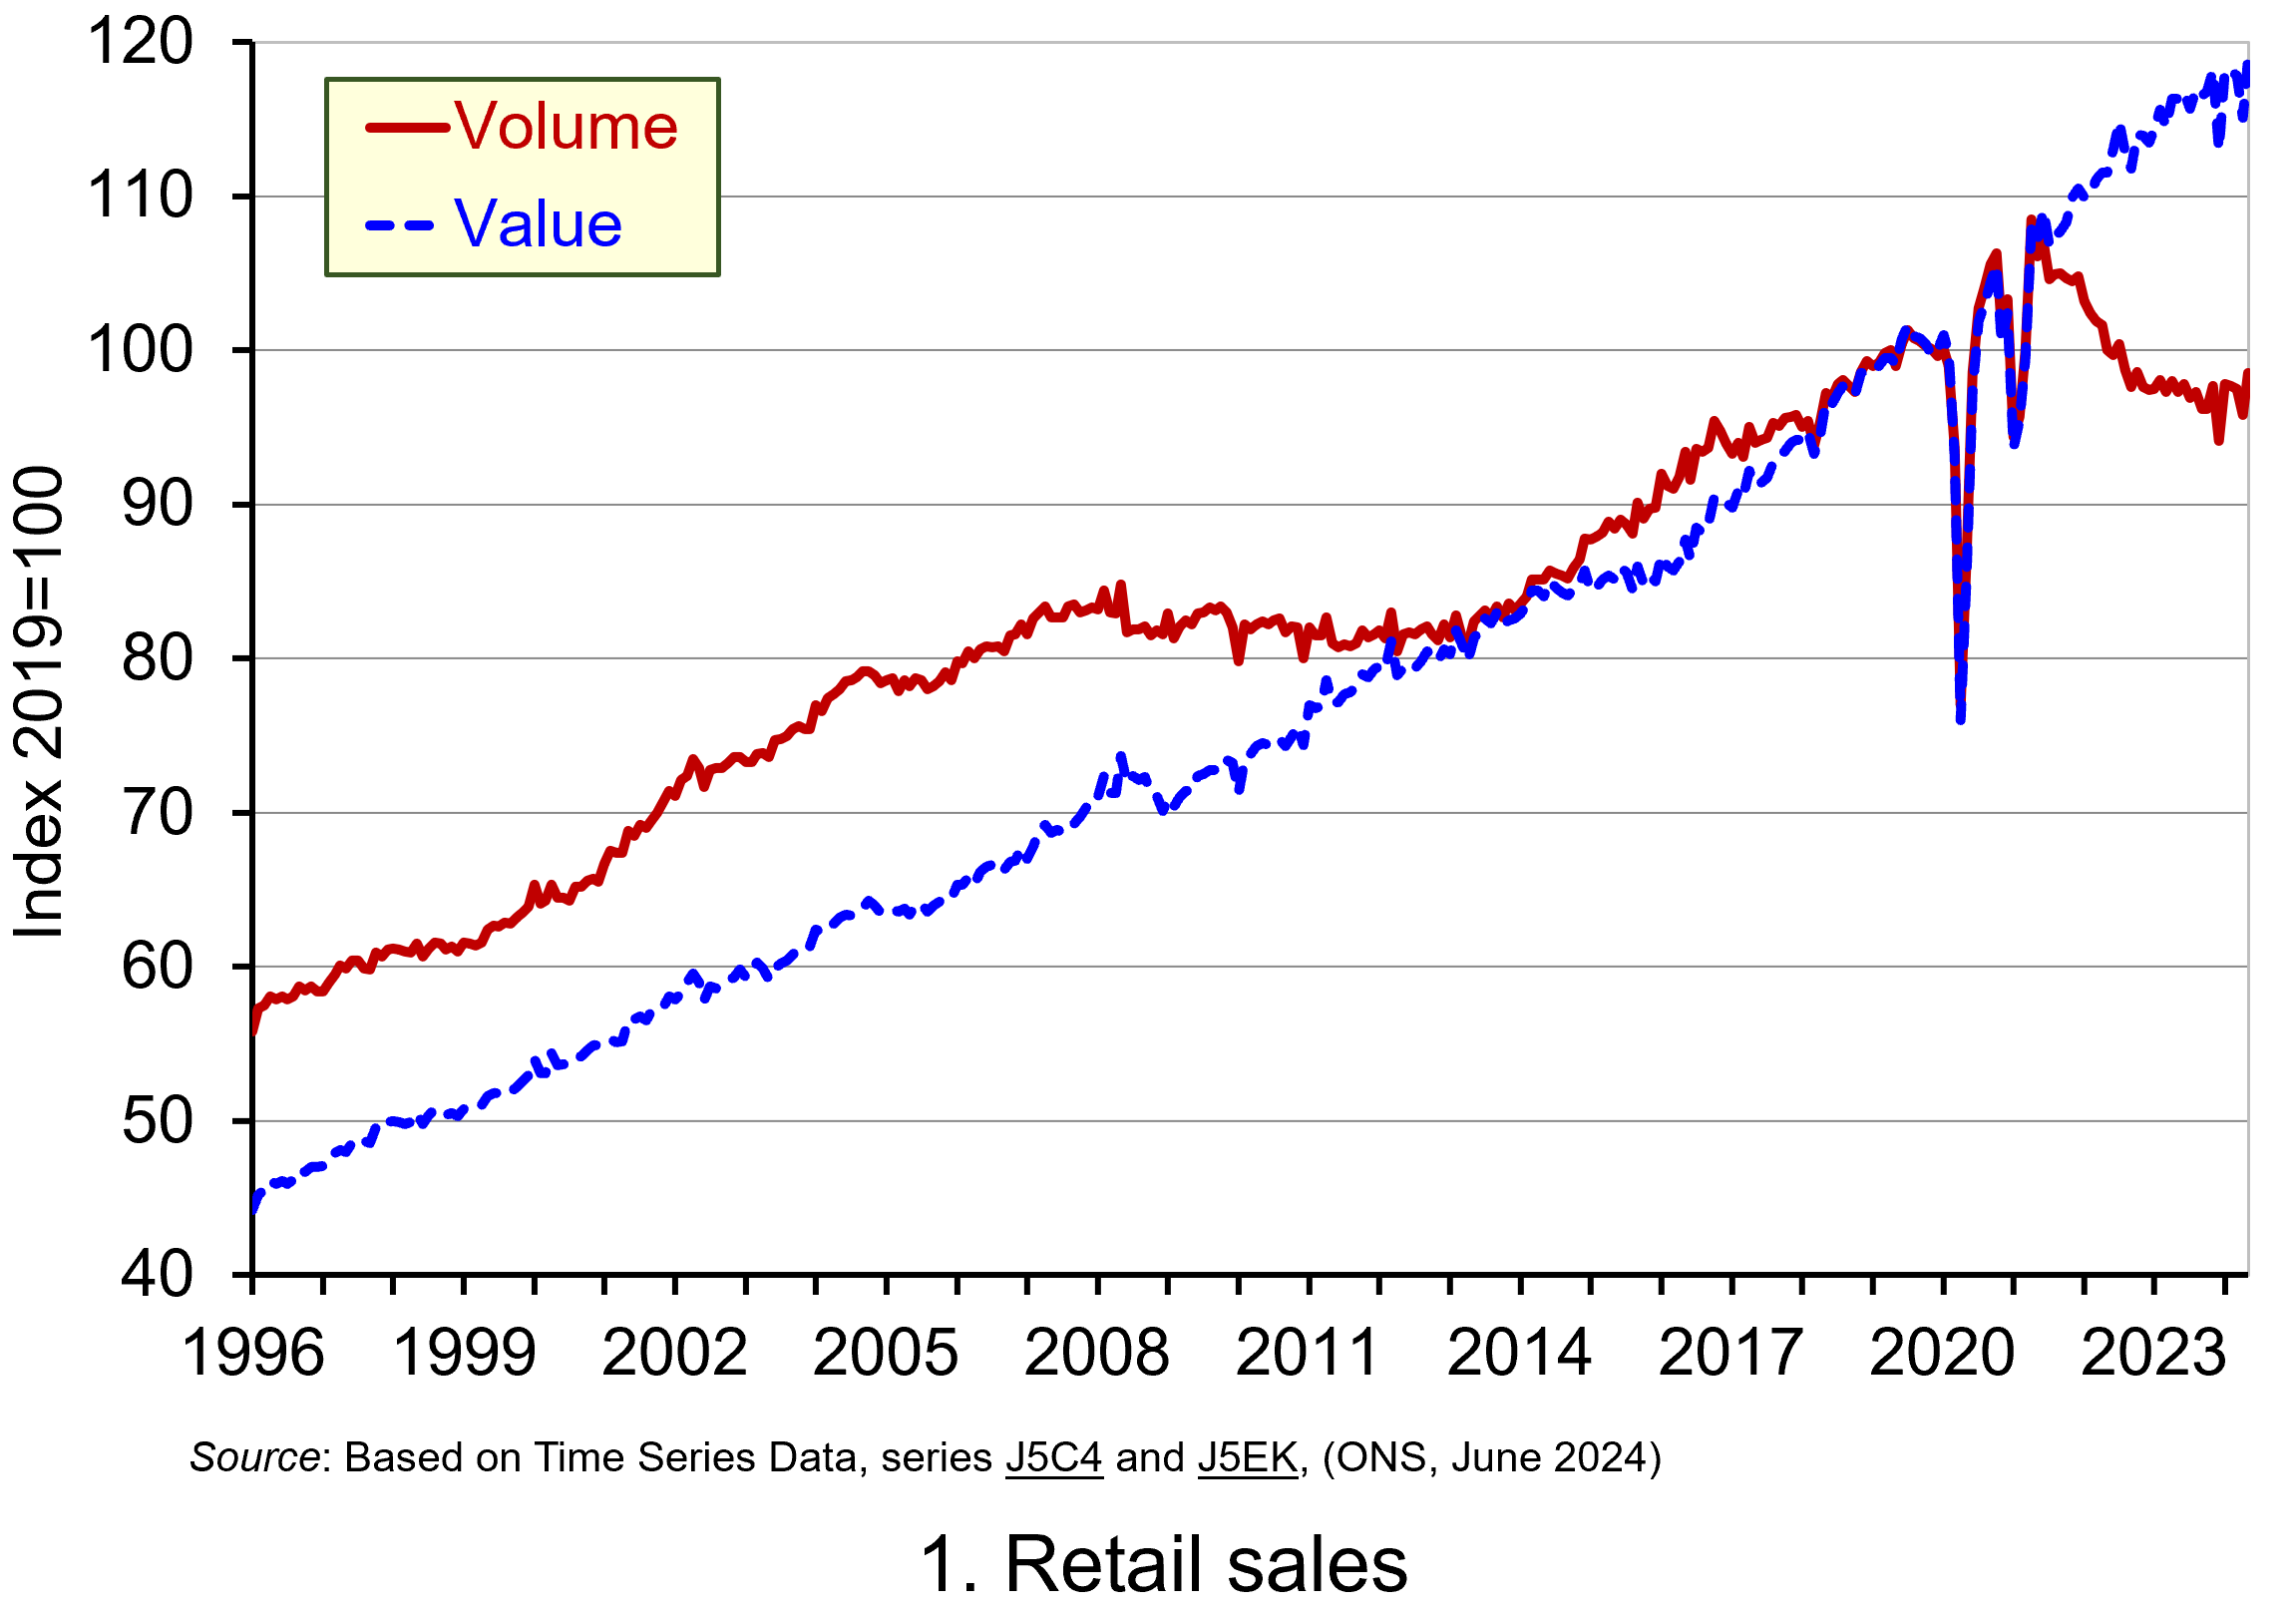 Chart 1 plots the monthly value and volume of retail sales in Great Britain since 1996. (Click here to download a PowerPoint of the chart). In value terms, monthly spending in the retail sector has increased by 169 per cent since January 1996, whereas in volume terms, spending has increased by 77 per cent. Another way of thinking about this is in terms of the average annual rate of increase. This shows that the value of spending has risen at an annual rate of 3.5 per cent while the volume of spending has risen at an annual rate of 2.0 per cent. This difference is to be expected in the presence of rising prices, since nominal growth, as we have just noted, reflects both price and volume changes.
Chart 1 helps to identify two periods where the volume of retail spending ceased to grow. The first of these is following the global financial crisis of the late 2000s. The period from 2008 to 2013 saw the volume of retail sales stagnate and flatline, with a recovery in volumes only really starting to take hold in 2014. Yet in nominal terms retail sales grew by around 14 per cent.
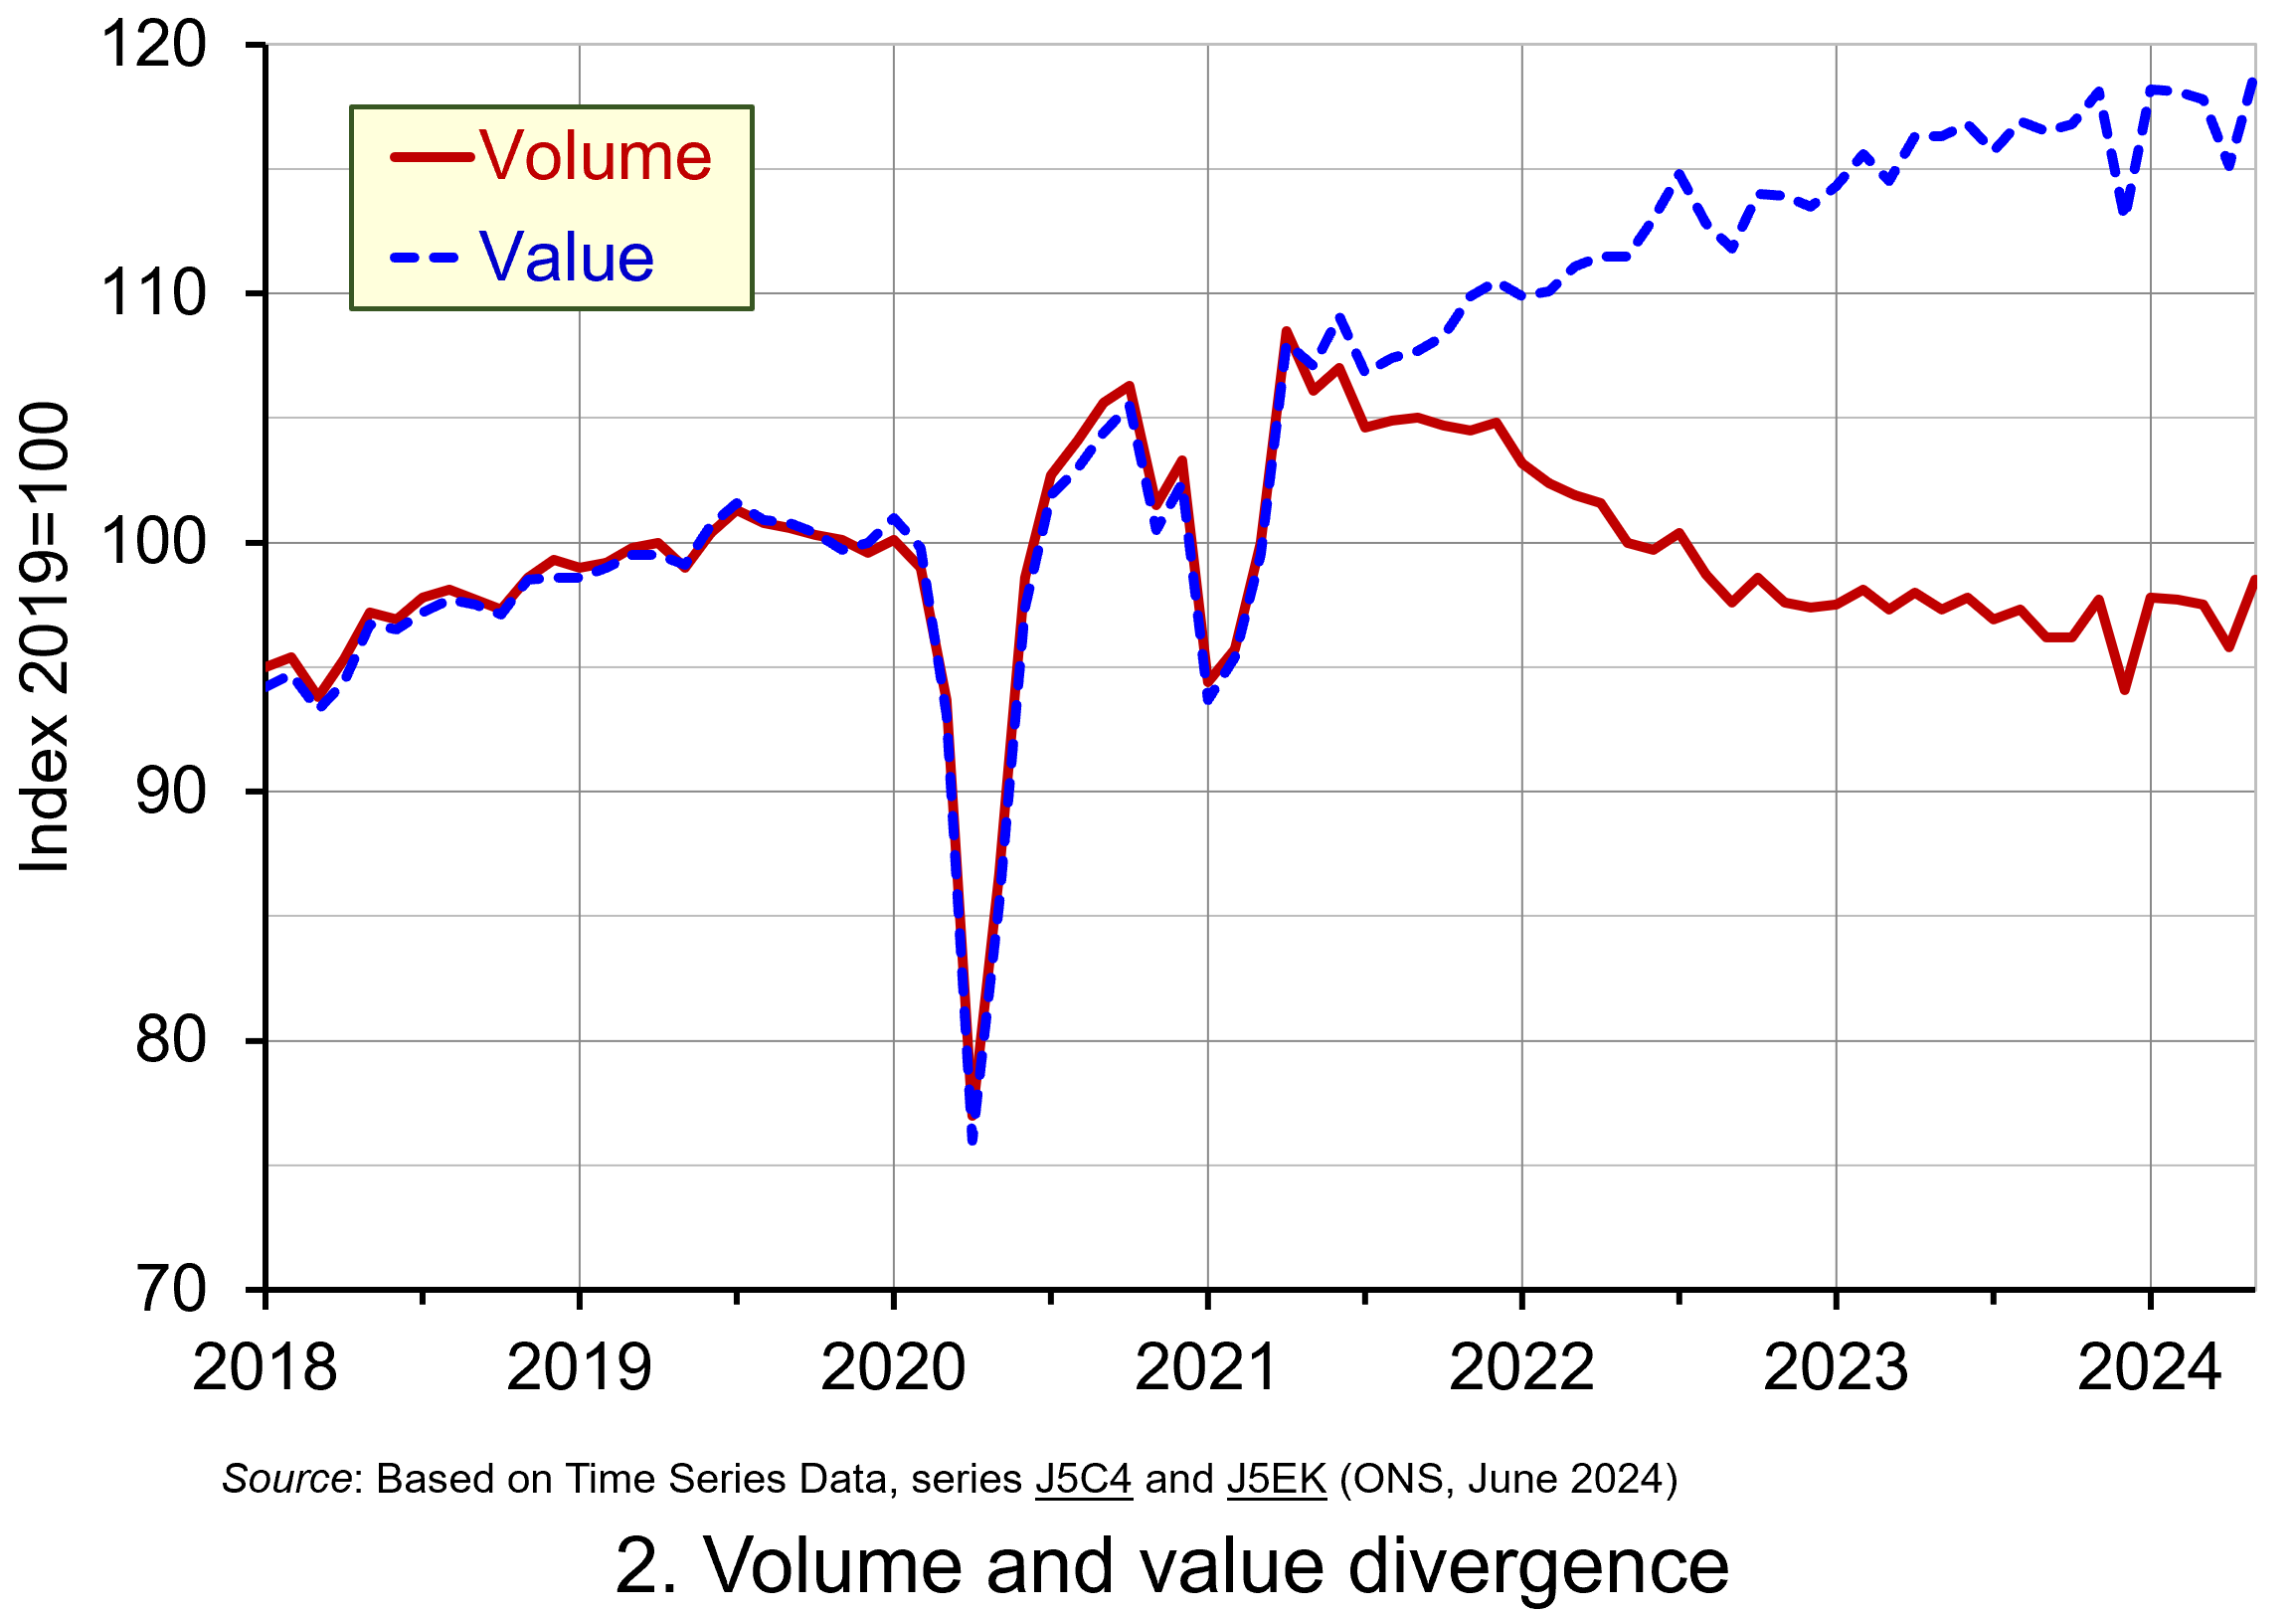 The second of the two periods is from 2021. Chart 2 helps to demonstrates the extent of the struggles of the retail sector in this period. It shows a significant divergence between the volume and value of retail sales. Indeed, between April 2021 and October 2023, while the value of retail sales increased by 8.0 per cent the volume of retail sales fell by 11.0 per cent.
The recent value-volume divergence reflects the inflation shock that began to emerge in 2021. This saw consumer prices, as measured by the Consumer Prices Index (CPI), rise across 2022 and 2023 by 9.1 per cent and 7.3 per cent respectively, with the annual rate of CPI inflation hitting 11.1 per cent in October 2022. Hence, while inflation was a drag on the volume of spending it nonetheless meant that the value of spending continued to rise. Once more this demonstrates why understanding the distinction between nominal and real is important. (Click here to download a PowerPoint of the chart).
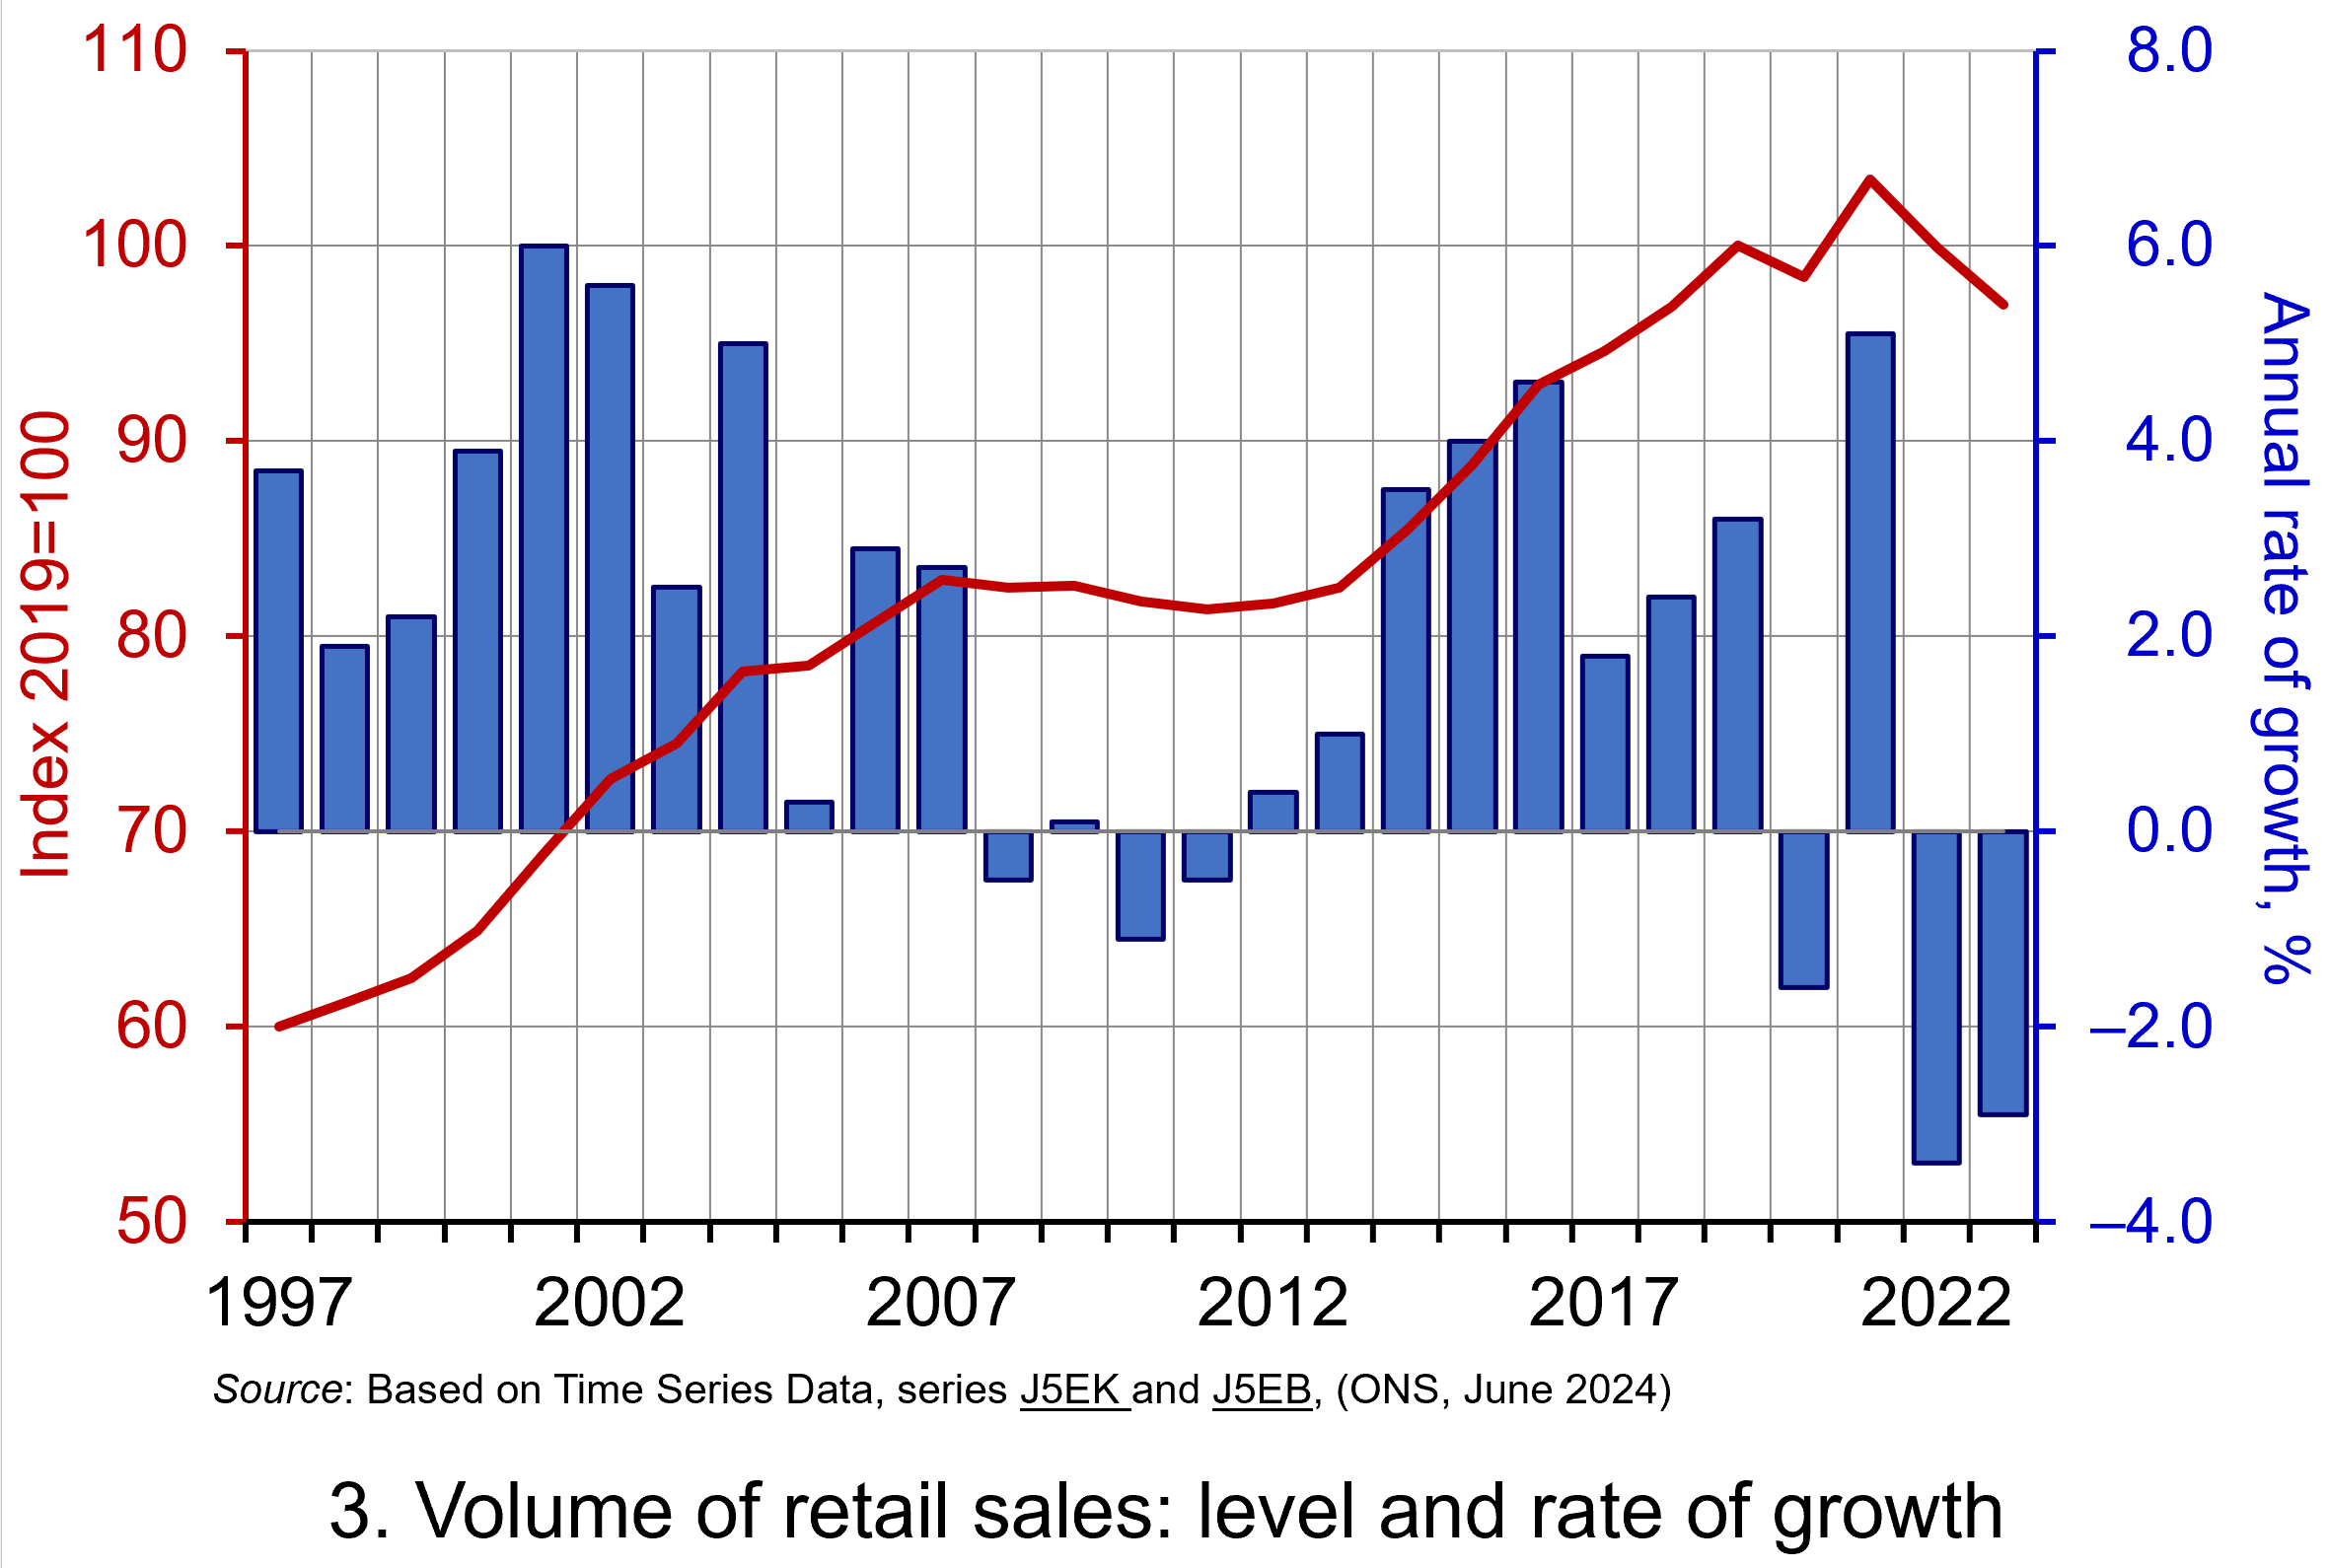 To illustrate the longer-term trend in the volume of retail spending alongside its volatility, Chart 3 plots yearly retail sales volumes and also their percentage change on the previous year.
The chart nicely captures the prolonged halt to retail sales growth following the global financial crisis, the fluctuations caused by COVID and then the sharp falls in the volume of retail spending in 2022 and 2023 as the effects of the inflationary shock on peoples’ finances bit sharply. This cost-of-living crisis significantly affected many people’s disposable income. (Click here to download a PowerPoint of the chart).
Categories of retail sales
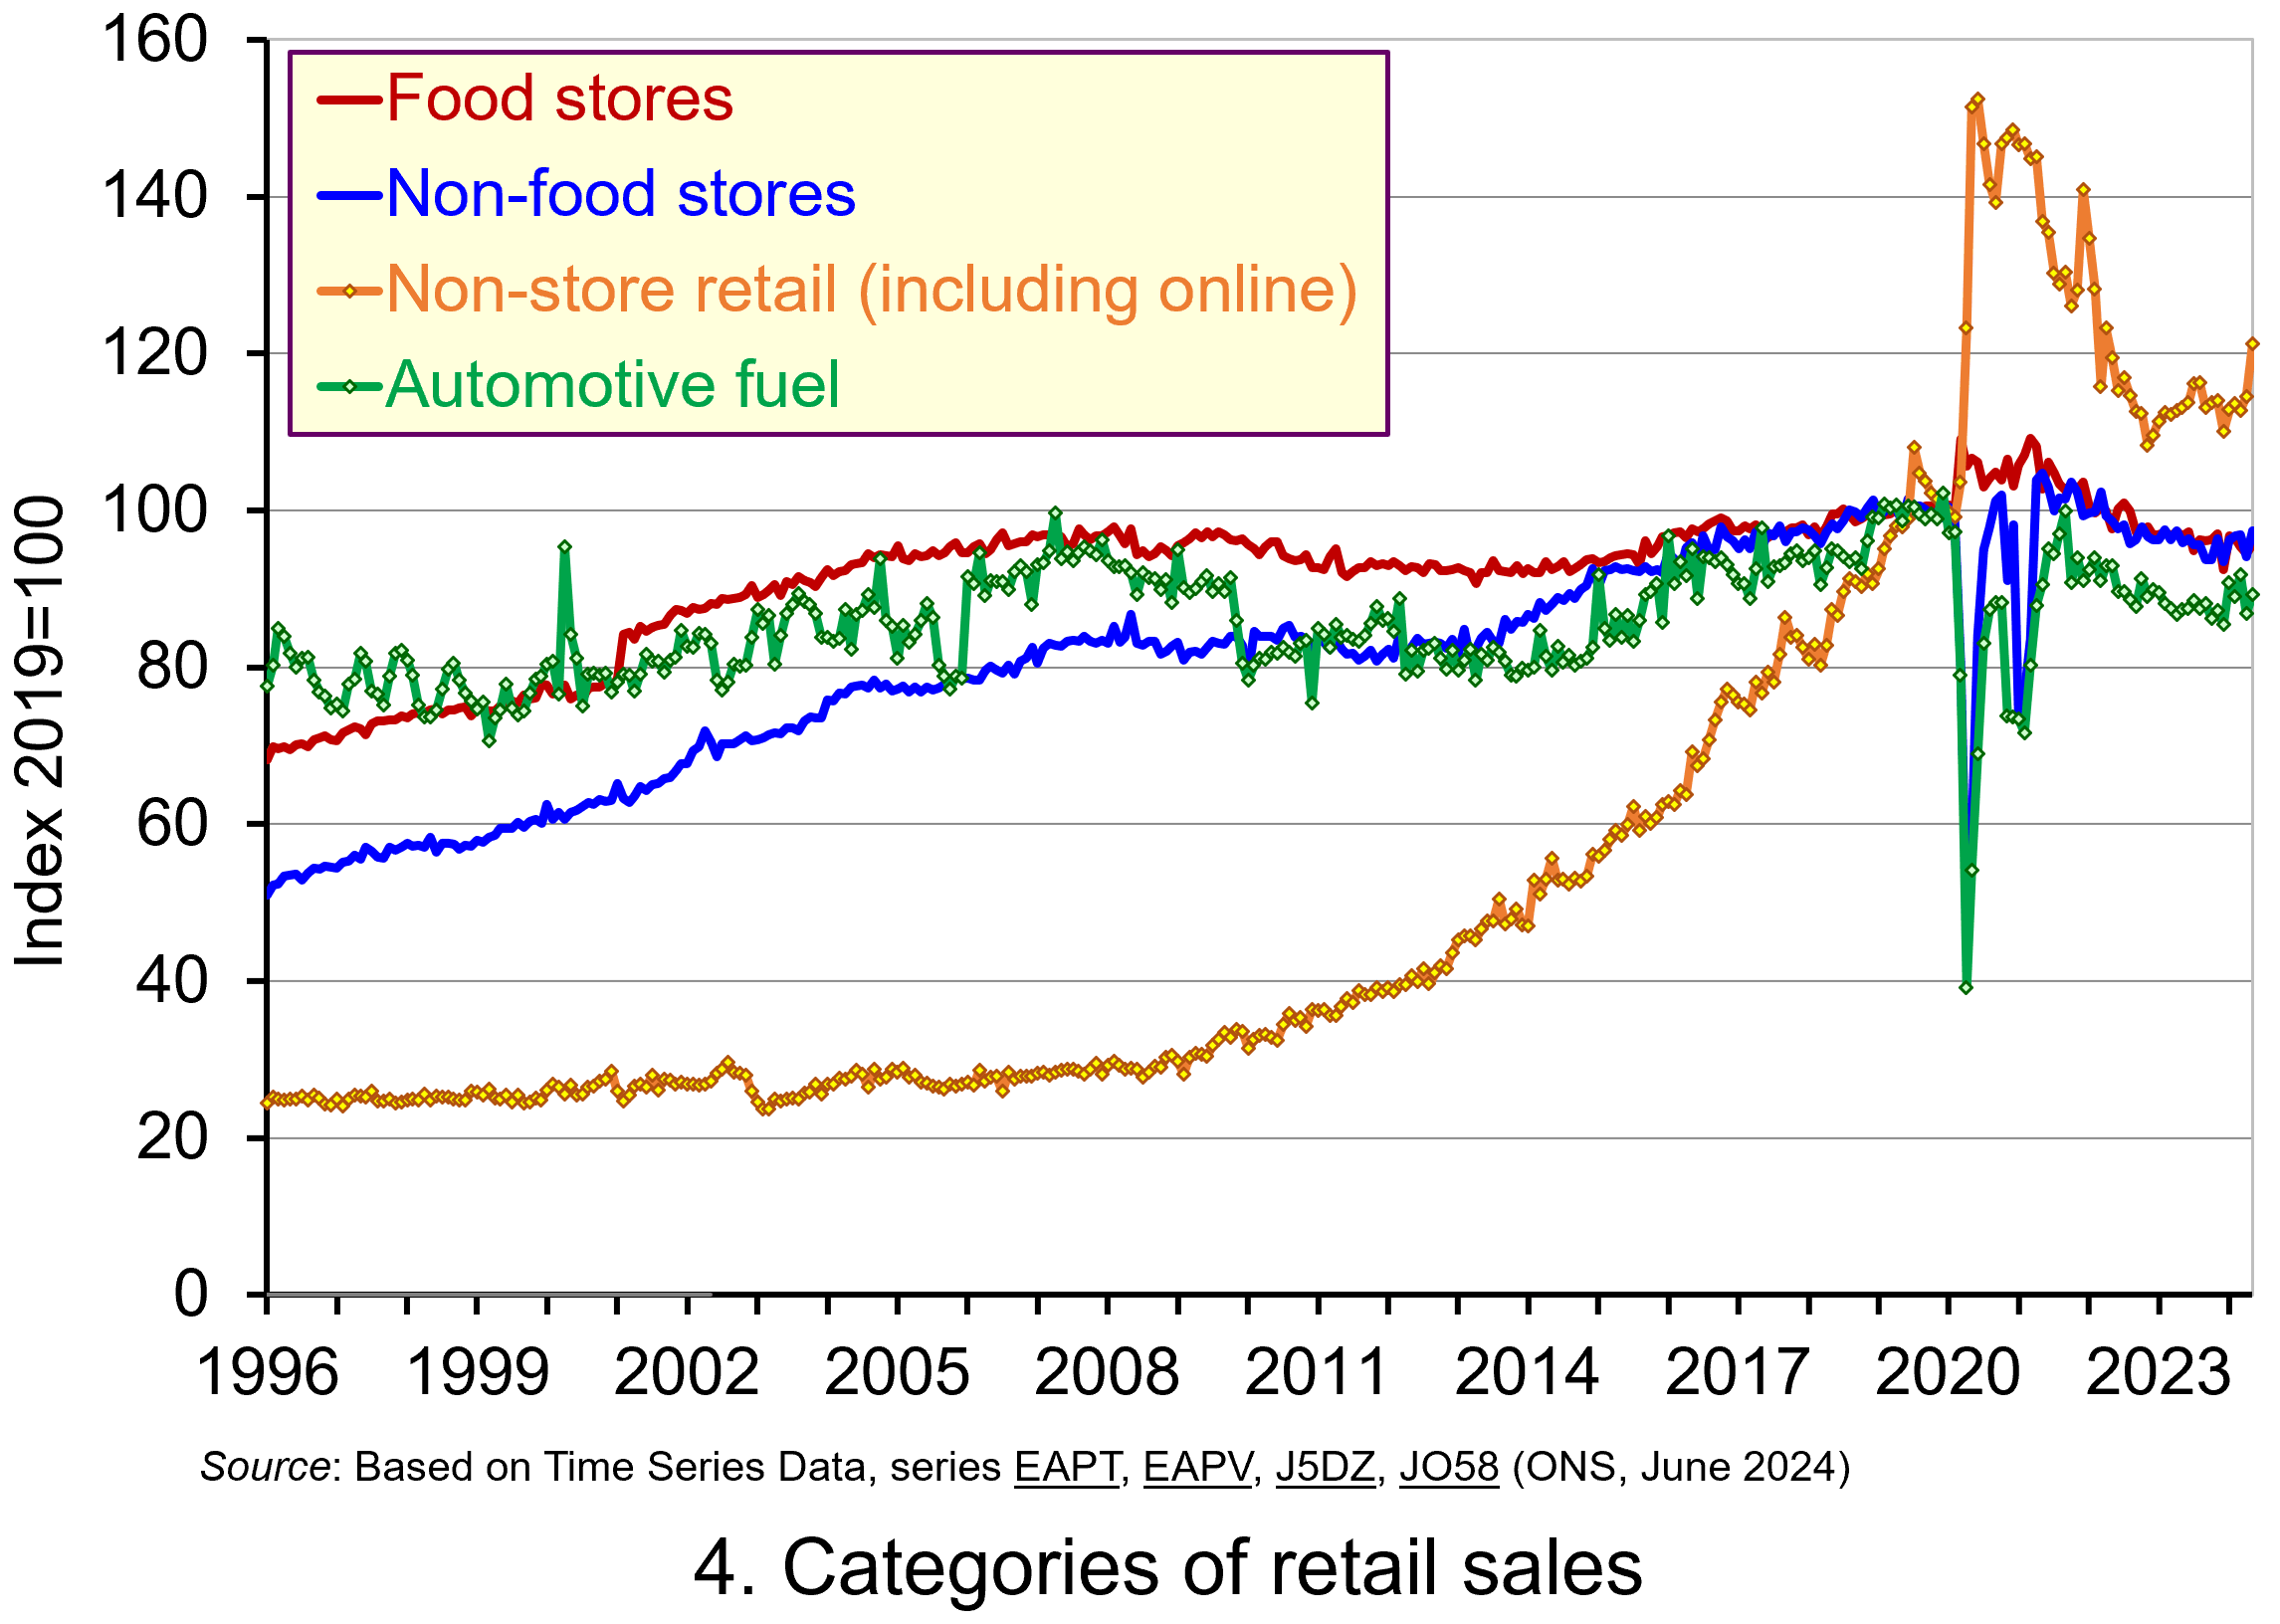 We conclude by considering categories of retail spending. Chart 4 shows volumes of retail sales by four broad categories since 1996. (Click here to download a PowerPoint of the chart). These are food stores, predominantly non-food stores, non-store retail and automotive fuel (i.e. sales of petrol and diesel “at the pumps”).
Whilst all categories have seen an increase in their spending volumes over the period as a whole, there are stark differences in this rate of growth. Perhaps not surprisingly, the most rapid growth is in non-store retail. This includes online retailing, as well as market stalls and catalogues.
The volume of retail spending in the non-store sector has grown at an average annual rate over this period of 6.3 per cent, compared with 2.6 per cent for non-food stores, 1.2 per cent for predominantly food stores and 1.0 per cent for automotive fuels. The growth of non-store retail has been even more rapid since 2010, when the average annual rate of growth in the volume of purchases has been 10.2 per cent, compared to 1.8 per cent for non-food stores, 1.0 per cent for automotive fuels and zero growth for food stores.
If we focus on the most recent patterns in the categories of retail sales, we see that the monthly volume of spending in all categories except non-store retail is now lower than the average in 2019. Specifically, when compared to 2019 levels, the volume of spending in non-food stores in May 2024 was 2.6 per cent lower, while that in food stores was 4.4 per cent lower, and the volume of spending on automotive fuels was 10.8 per cent lower. In contrast, spending in non-store retail was 21.2 per cent higher. Yet this is not to imply that this sector has been immune to the pressures faced by their high-street counterparts. Although it is difficult to disentangle fully the effects of the pandemic and lockdowns on non-store retail sales data, the downward trajectory in the volume of retail sales in the sector that occurred as the economy ‘reopened’ in 2021 and 2022 continued into 2023 when purchases fell by 3.5 per cent.
Final thoughts
The retail sector is an incredibly important part of the economy. A recent research briefing from the House of Commons Library reports that there were 2.7 million jobs in the UK retail sector in 2022, equivalent to 8.6 per cent of the country’s jobs with 314 040 retail businesses as of January 2023. Yet the importance of the retail sector cannot be captured by these statistics alone. Some would argue that the very fabric and wellbeing of our towns and cities is affected by the wellbeing of the sector and, importantly, by structural changes that affect how people interact with retail.
Articles
Research Briefing
Statistical bulletin
Data
Questions
- Which of the following is/are not counted in the UK retail sales data: (i) purchase of furniture from a department store; (ii) weekly grocery shop online; (iii) a stay at a hotel on holiday; (iv) a meal at your favourite café or restaurant?
- Why does an increase in the value of retail sales not necessarily mean that their volume has increased?
- In the presence of deflation, which will be higher: nominal or real growth rates?
- Discuss the factors that could explain the patterns in the volume of spending observed in the different categories of retail sales in Chart 4.
- Discuss what types of retail products might be more or less sensitive to changes in the macroeconomic environment.
- Conduct a survey of recent media reports to prepare a briefing discussing examples of retailers who have struggled or thrived in the recent economic environment.
- What do you understand by the concepts of ‘consumer confidence’ and ‘economic uncertainty’? How might these affect the volume of retail spending?
- Discuss the proposition that the retail sales data cast doubt on whether people are ‘forward-looking consumption smoothers’.
The distinction between nominal and real values in one of the ‘threshold concepts’ in economics. These are concepts that are fundamental to a discipline and which occur again and again. The distinction between nominal and real values is particularly important when interpreting and analysing data. We show its importance here when analysing the latest retail sales data from the Office for National Statistics.
Retail sales relate to spending on items such as food, clothing, footwear, and household goods (see). They involve sales by retailers directly to end consumers whether in store or online. The retail sales index for Great Britain is based on a monthly survey of around 5000 retailers across England, Scotland and Wales and is thought to capture around 75 per cent of turnover in the sector.
Estimates of retail sales are published in index form. There are two indices published by the ONS: a value and volume measure. The value index reflects the total turnover of business, while the volume index adjusts the value index for price changes. Hence, the value estimates are nominal, while the volume estimates are real. The key point here is that the nominal estimates reflect both price and volume changes, whereas the real estimates adjust for price movements to capture only volume changes.
The headline ONS figures for September 2023 showed a 0.9 per cent volume fall in the volume of retail sales, following a 0.4 per cent rise in August. In value terms, September saw a 0.2 per cent fall in retail sales following a 0.9 per cent rise in August. Monthly changes can be quite volatile, even after seasonal adjustment, and sensitive to peculiar factors. For example, the unusually warm weather this September helped to depress expenditure on clothes. It is, therefore, sensible to take a longer-term view when looking for clearer patterns in spending behaviour.
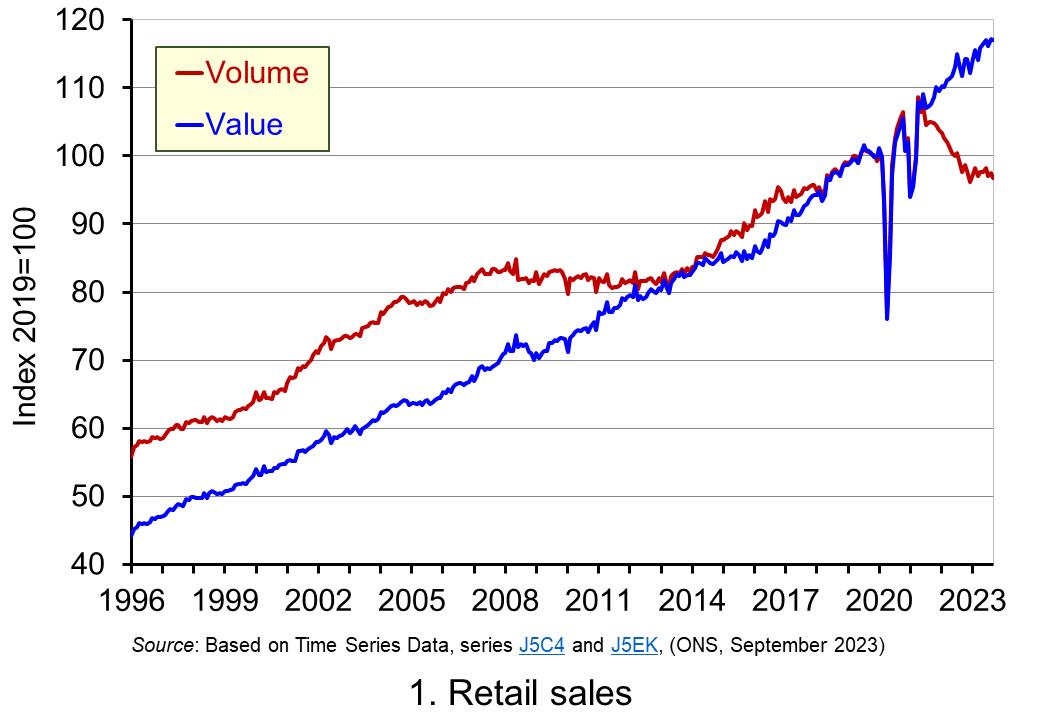 Chart 1 plots the value and volume of retail sales in Great Britain since 1996. (Click here for a PowerPoint of this and the other two charts). In value terms, retail sales spending increased by 165 per cent, whereas in volume terms, spending increased by 73 per cent. This difference is expected in the presence of rising prices, since nominal growth, as we have just noted, reflects both price and volume changes. The chart is notable for capturing two periods where the volume of retail spending ceased to grow. The first of these is following the global financial crisis of the late 2000s. The period from 2008 to 2013 saw the volume of retail sales stagnate and flatline with a recovery in volumes only really starting to take hold in 2014. Yet in nominal terms retail sales grew by around 16 per cent.
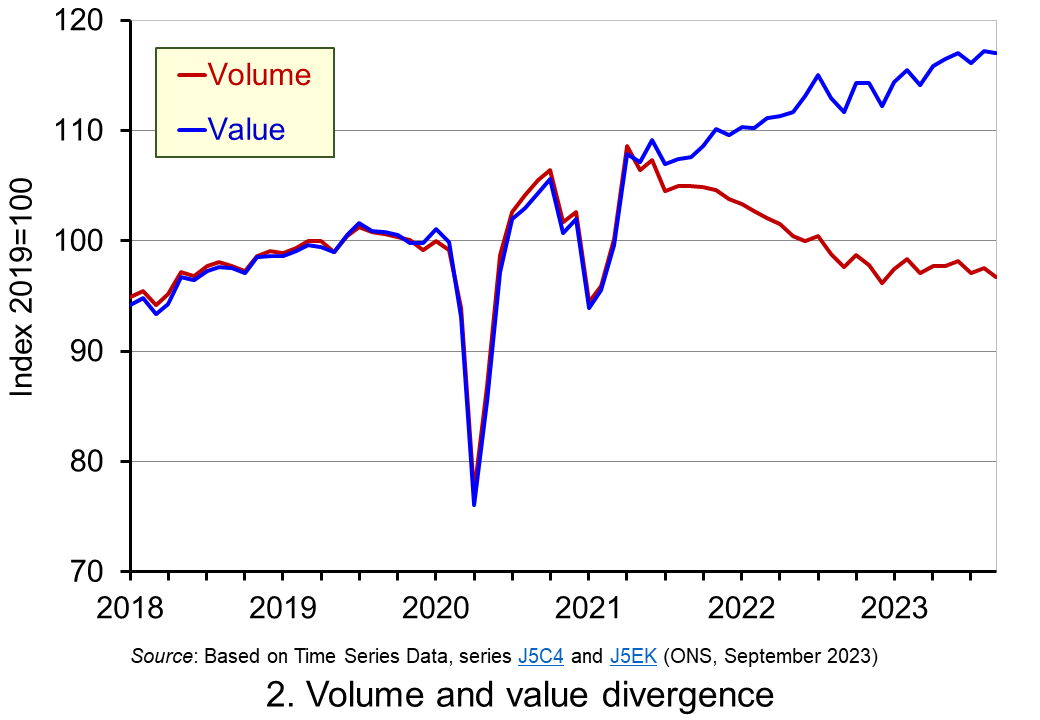 The second of the two periods is the decline in the volume of retail sales from 2021. To help illustrate this more clearly, Chart 2 zooms in on retail sales over the past five years or so. We can see a significant divergence between the volume and value of retail sales. Between April 2021 and September 2023, the volume of retail sales fell by 11%. In contrast, the value of retail sales increased by 8.4%. The impact of the inflationary shock and the consequent cost-of-living crisis that emerged from 2021 is therefore demonstrated starkly by the chart, not least the severe drag that it has had on the volume of retail spending. This has meant that the aggregate volume of retail sales in September 2023 was only back to the levels of mid-2018.
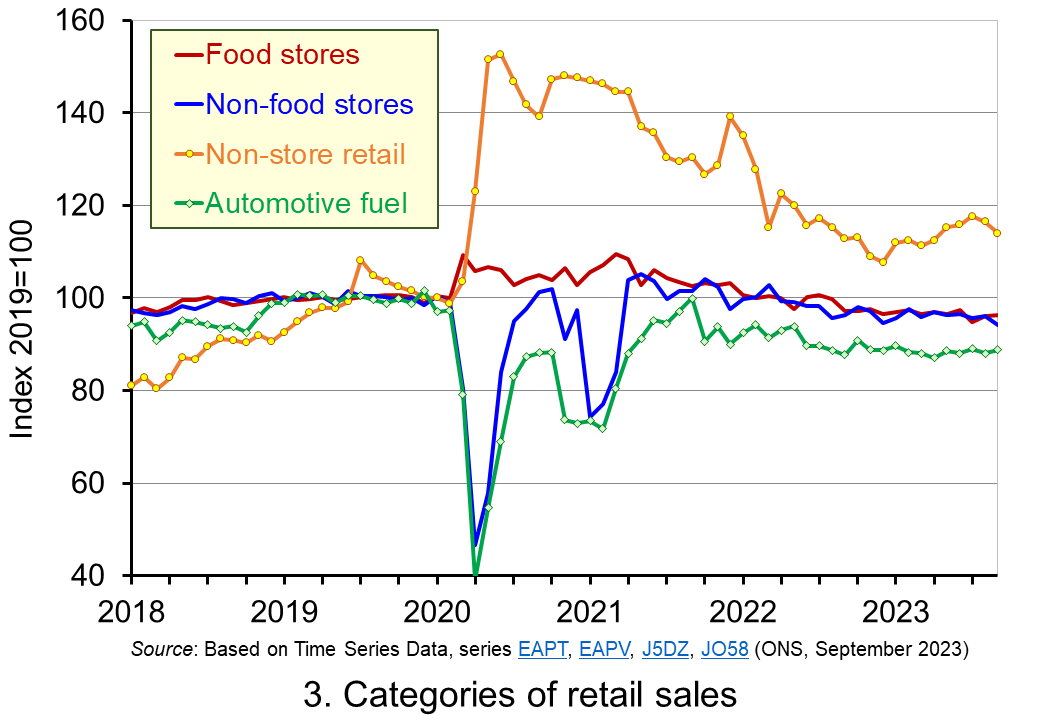 Finally, Chart 3 shows the patterns in the volumes of retailing by four categories since 2018: specifically, food stores, predominantly non-food stores, non-store retail, and automotive fuel. The largest fall in the volume of retail sales has been experienced by non-store retailing – largely online retailing. From its peak in December 2020, non-store retail sales decreased by almost 20 per cent up to September 2023. While this needs to be set in the context of the volume of non-store retail purchases being 14% higher than in February 2020 before the pandemic lockdowns were introduced, it is nonetheless indicative of the pressures facing online retailers.
Importantly, the final chart shows that the pressures in retailing are widespread. Spending volumes on automotive fuels, and in food and non-food stores are all below 2019 levels. The likelihood is that these pressures will persist for some time to come. This inevitably has potential implications for retailers and, of course, for those that work in the sector.
Articles
Statistical bulletin
Data
Questions
- Why does an increase in the value of retail sales not necessarily mean that their volume has increased?
- In the presence of deflation, which will be higher: nominal or real growth rates?
- Discuss the factors that could explain the patterns in the volume of spending observed in the different categories of retail sales in Chart 3.
- Discuss what types of retail products might be more or less sensitive to the macroeconomic environment.
- Conduct a survey of recent media reports to prepare a briefing discussing examples of retailers who have struggled or thrived in the recent economic environment.
- What do you understand by the concepts of ‘consumer confidence’ and ‘economic uncertainty’? How might these affect the volume of retail spending?
- Discuss the proposition that the retail sales data cast doubt on whether people are ‘forward-looking consumption smoothers’.
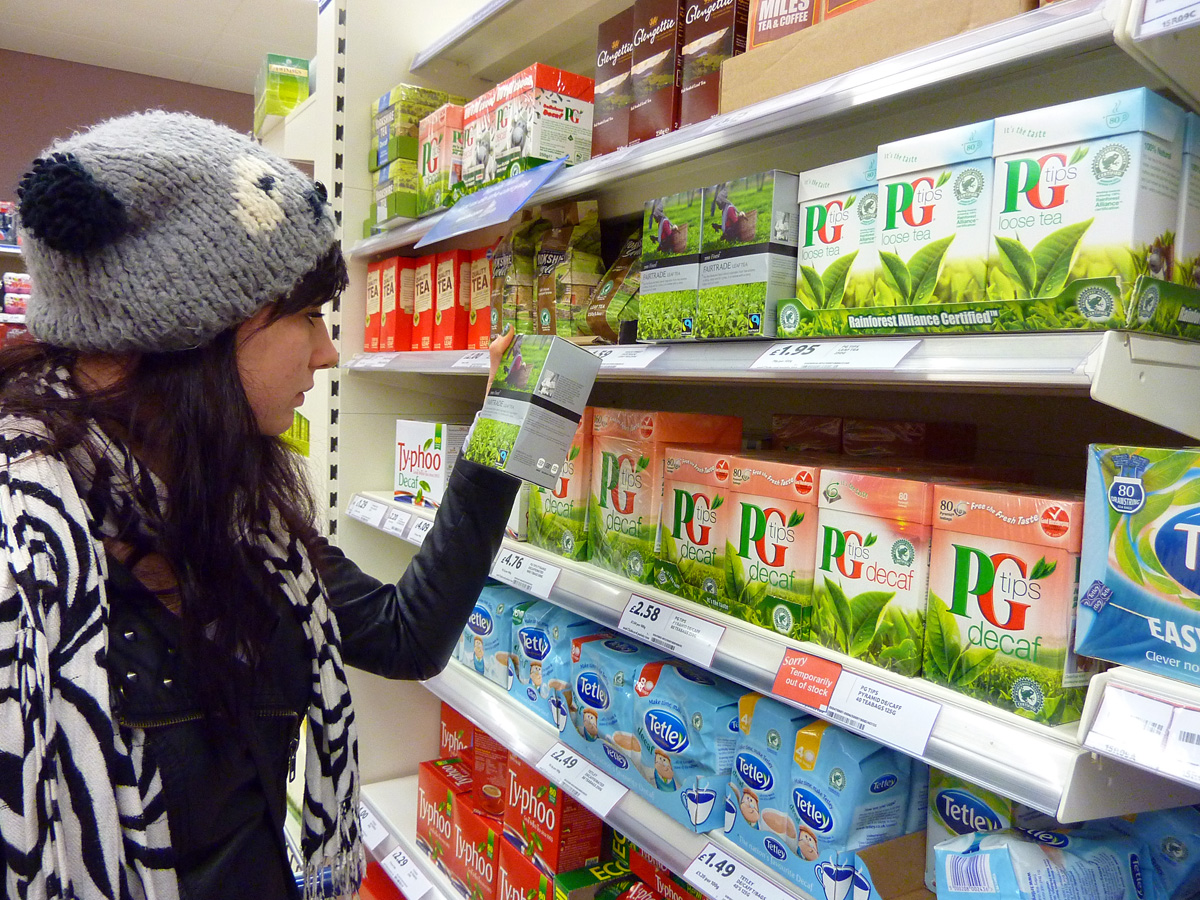 For those of you embarking on a course in economics, one of the first things you’ll come across is the distinction between microeconomics and macroeconomics. The news is full of both microeconomic and macroeconomic issues and you’ll quickly see how relevant both branches of economics are to analysing real-world events, problems and policies.
As we state in Economics (updated 10th edition), ‘microeconomics is concerned with the individual parts of the economy. It is concerned with the demand and supply of particular goods, services and resources such as cars, butter, clothes, haircuts, plumbers, accountants, blast furnaces, computers and oil.’ In particular, it is concerned with the buying, selling, production and employment decisions of individuals and firms. When you go shopping and make choices of what to buy you are making microeconomic decisions. When firms choose how much of particular products to produce, what techniques of production to use and how many people to employ, these choices are microeconomic ones.
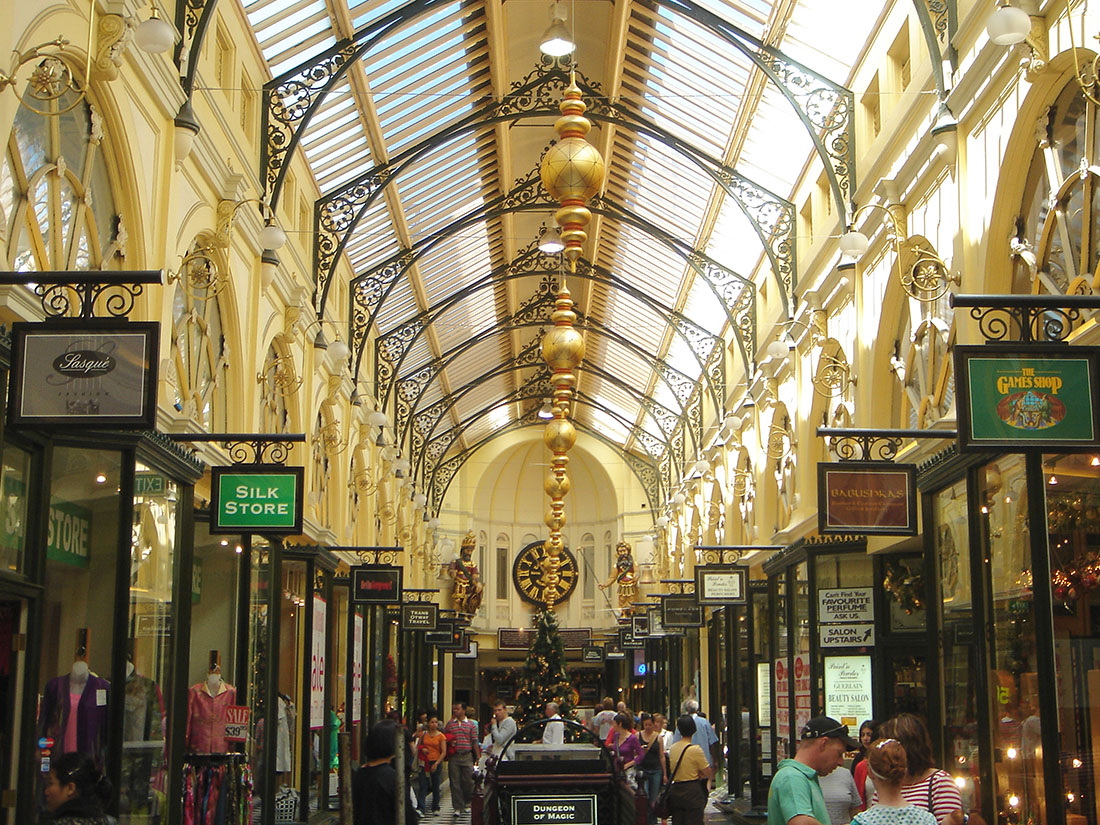 Microeconomics examines people’s behaviour when they make choices. In fact many of the recent developments in microeconomics involve analysing the behaviour of individuals and firms and the factors that influence this behaviour.
Open any newspaper, turn on the TV news or access any news site and you will see various microeconomic issues covered. Why are rents soaring? How is AI affecting various businesses’ productivity? How rapidly is the switch taking place to green energy? How do supermarkets influence spending patterns? Why are wages so low in the social care sector? Why are private PCR tests so expensive for holidaymakers retuning from abroad?
Many of the blogs on this news site will examine microeconomic issues. We hope that they provide useful case studies for your course.
Articles
Questions
- Look through news sites and identify five current microeconomic issues. What makes them ‘micro’ issues?
- If world oil and gas prices rise, why is this a microeconomic issue?
- What do you understand by ‘scarcity’? How is microeconomics related to scarcity?
- Are all goods scarce?
- What is meant by ‘opportunity cost’? Give some examples of how opportunity cost has affected recent decisions you have made.
 The coronavirus pandemic and the climate emergency have highlighted the weaknesses of free-market capitalism.
Governments around the world have intervened massively to provide economic support to people and businesses affected by the pandemic through grants and furlough schemes. They have also stressed the importance of collective responsibility in abiding by lockdowns, social distancing and receiving vaccinations.
The pandemic has also highlighted the huge inequalities around the world. The rich countries have been able to offer much more support to their people than poor countries and they have had much greater access to vaccines. Inequality has also been growing within many countries as rich people have gained from rising asset prices, while many people find themselves stuck in low-paid jobs, suffering from poor educational opportunities and low economic and social mobility.
The increased use of working from home and online shopping has accelerated the rise of big tech companies, such as Amazon and Google. Their command of the market makes it difficult for small companies to compete – and competition is vital if capitalism is to benefit societies. There have been growing calls for increased regulation of powerful companies and measures to stimulate competition. The problem has been recognised by governments, central banks and international agencies, such as the IMF and the OECD.
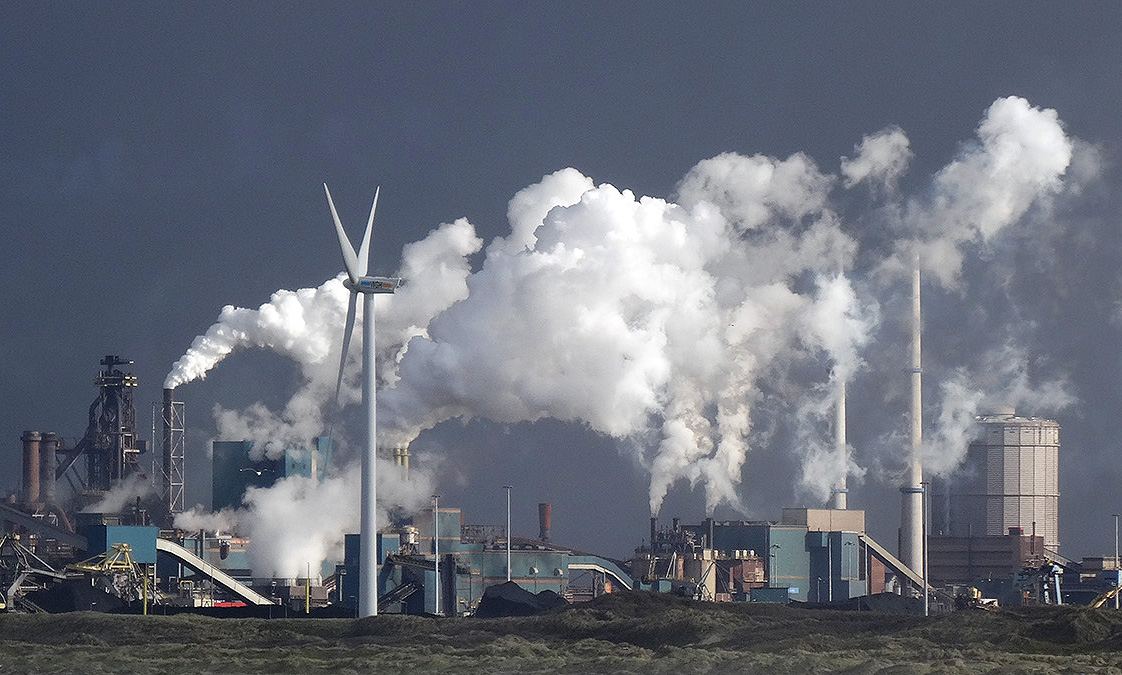 At the same time as the world has been grappling with the pandemic, global warming has contributed to extreme heat and wildfires in various parts of the world, such as western North America, the eastern Mediterranean and Siberia, and major flooding in areas such as western Europe and China. Governments again have intervened by providing support to people whose property and livelihoods have been affected. Also there is a growing urgency to tackle global warming, with some movement, albeit often limited, in implementing policies to achieve net zero carbon emissions by some specified point in the future. Expectations are rising for concerted action to be agreed at the international COP26 climate meeting in Glasgow in November this year.
An evolving capitalism
So are we seeing a new variant of capitalism, with a greater recognition of social responsibility and greater government intervention?
 Western governments seem more committed to spending on socially desirable projects, such as transport, communications and green energy infrastructure, education, science and health. They are beginning to pursue more active industrial and regional policies. They are also taking measures to tax multinationals (see the blog The G7 agrees on measures to stop corporate tax avoidance). Many governments are publicly recognising the need to tackle inequality and to ‘level up’ society. Active fiscal policy, a central plank of Keynesian economics, has now come back into fashion, with a greater willingness to fund expenditure by borrowing and, over the longer term, to use higher taxes to fund increased government expenditure.
But there is also a growing movement among capitalists themselves to move away from profits being their sole objective. A more inclusive ‘stakeholder capitalism’ is being advocated by many companies, where they take into account the interests of a range of stakeholders, from customers, to workers, to local communities, to society in general and to the environment. For example, the Council for Inclusive Capitalism, which is a joint initiative of the Vatican and several world business and public-sector leaders, seeks to make ‘the world fairer, more inclusive, and sustainable’.
If there is to be a true transformation of capitalism from the low-tax free-market capitalism of neoclassical economists and libertarian policymakers to a more interventionist mixed market capitalism, where capitalists pursue a broader set of objectives, then words have to be matched by action. Talk is easy; long-term plans are easy; taking action now is what matters.
Articles and videos
- Why the next stage of capitalism is coming
BBC Future, Matthew Wilburn King (27/5/21)
- During the pandemic, a new variant of capitalism has emerged
The Guardian, Larry Elliott (30/7/21)
- When it comes to social and environmental justice, words don’t cut it
GreenBiz, C J Clouse (28/4/21)
 Introducing the Council for Inclusive Capitalism with the Vatican
Inclusive Capitalism (7/12/20)
- The State and Direction of Inclusive Capitalism
Saïd Business School, Ford Foundation and Deloitte Social Impact practice, Richard Barker, Mary Johnstone-Louis, Colin Mayer, Pradeep Prabhala, Noah Rimland Flower, Theodore Roosevelt Malloch, Tony Siesfeld and Peter Tufano (2018)
- Rising Market Power—A Threat to the Recovery?
IMF Blog, Kristalina Georgieva, Federico J Díez, Romain Duval and Daniel Schwarz (15/3/21)
- The Pandemic Alone Can’t Transform Capitalism
Jacobin, Ramaa Vasudevan (30/7/21)
- Down to earth: How entrepreneurs can collaborate to rejuvenate capitalism
EU-Startups, Luca Sabia (4/8/21)
Questions
- How similar is the economic response of Western governments to the pandemic to their response to the financial crisis of 2007–8?
- What do you understand by ‘inclusive capitalism’? How can stakeholders hold companies to account?
- What indicators are there of market power? Why have these been on the rise?
- How can entrepreneurs contribute to ‘closing the inequality gap for a more sustainable and inclusive form of society’?
- What can be done to hold governments to account for meeting various social and environmental objectives? How successful is this likely to be?
- Can inequality be tackled without redistributing income and wealth from the rich to the poor?
 The OECD has recently published its six-monthly Economic Outlook. This assesses the global economic situation and the prospects for the 38 members of the OECD.
It forecasts that the UK economy will bounce back strongly from the deep recession of 2020, when the economy contracted by 9.8 per cent. This contraction was deeper than in most countries, with the USA contracting by 3.5 per cent, Germany by 5.1 per cent, France by 8.2 per cent, Japan by 4.7 per cent and the OECD as a whole by 4.8 per cent. But, with the success of the vaccine roll-out, UK growth in 2021 is forecast by the OECD to be 7.2 per cent, which is higher than in most other countries. The USA is forecast to grow by 6.8 per cent, Germany by 3.3 per cent, France by 5.8 per cent, Japan by 2.6 per cent and the OECD as a whole by 5.3 per cent. Table 1 in the Statistical Annex gives the figures.
This good news for the UK, however, is tempered by some worrying features.
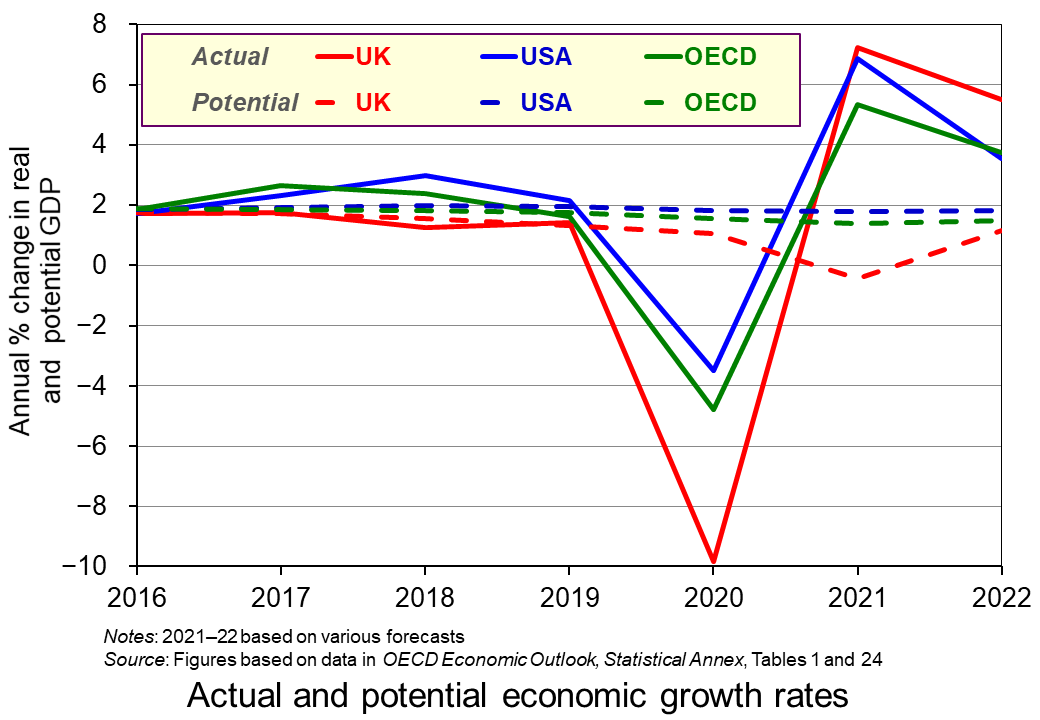 The OECD forecasts that potential economic growth will be negative in 2021, with capacity declining by 0.4 per cent. Only two other OECD countries, Italy and Greece, are forecast to have negative potential economic growth (see Table 24 in the Statistical Annex). A rapid increase in aggregate demand, accompanied by a decline in aggregate supply, could result in inflationary pressures, even if initially there is considerable slack in some parts of the economy.
Part of the reason for the supply constraints are the additional barriers to trade with the EU resulting from Brexit. The extra paperwork for exporters has added to export costs, and rules-of-origin regulations add tariffs to many exports to the EU (see the blog A free-trade deal? Not really). Another supply constraint linked to Brexit is the shortage of labour in certain sectors, such as hospitality, construction and transport. With many EU citizens having left the UK and not being replaced by equivalent numbers of new immigrants, the problem is likely to persist.
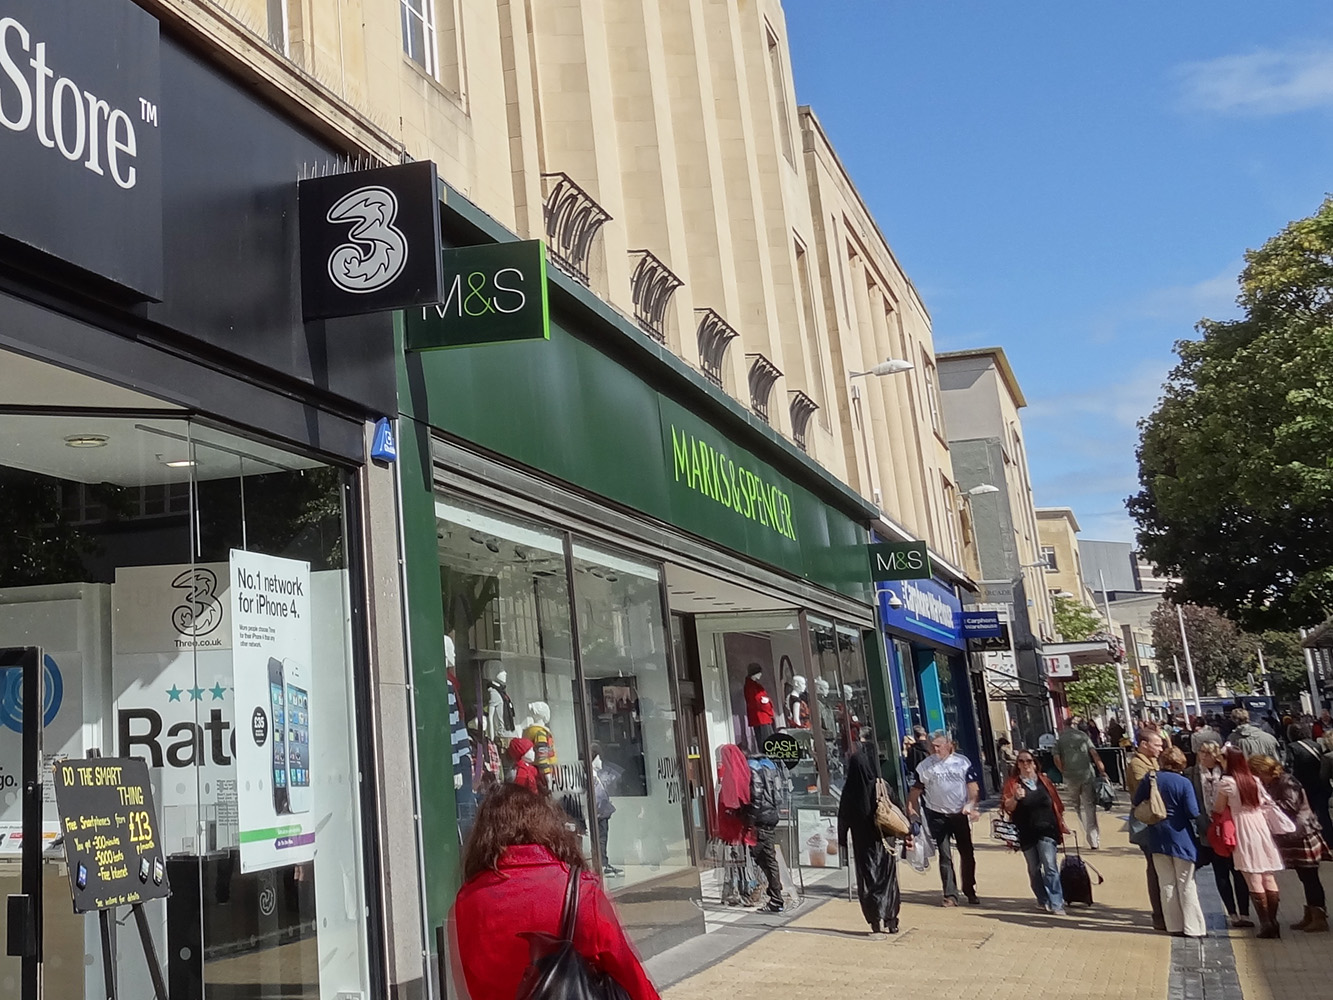 The scarring effects of the pandemic present another problem. There has been a decline in investment. Even if this is only temporary, it will have a long-term impact on capacity, unless there is a compensating rise in investment in the future. Many businesses have closed and will not re-open, including many High Street stores. Moves to working from home, even if partially reversed as the economy unlocks, will have effects on the public transport industry. Also, people may have found new patterns of consumption, such as making more things for themselves rather than buying them, which could affect many industries. It is too early to predict the extent of these scarring effects and how permanent they will be, but they could have a dampening effect on certain sectors.
Inflation
So will inflation take off, or will it remain subdued? At first sight it would seem that inflation is set to rise significantly. Annual CPI inflation rose from 0.7 per cent in March 2021 to 1.5 per cent in April, with the CPI rising by 0.6 per cent in April alone. What is more, the housing market has seen a large rise in demand, with annual house price inflation reaching 10.2 per cent in March.
But these rises have been driven by some one-off events. As the economy began unlocking, so spending rose dramatically. While this may continue for a few months, it may not persist, as an initial rise in household spending may reflect pent-up demand and as the furlough scheme comes to an end in September.
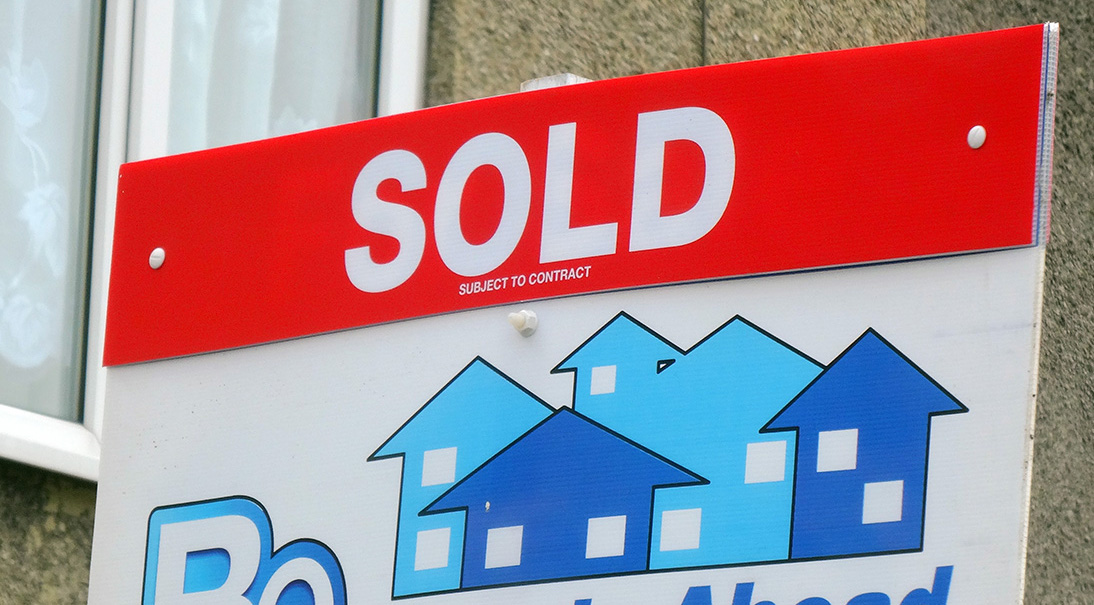 As far as as the housing market is concerned, the rise in demand has been fuelled by the stamp duty ‘holiday’ which exempts residential property purchase from Stamp Duty Land Tax for properties under £500 000 in England and Northern Ireland and £250 000 in Scotland and Wales (rather than the original £125 000 in England and Northern Ireland, £145 000 in Scotland and £180 000 in Wales). In England and Northern Ireland, this limit is due to reduce to £250 000 on 30 June and back to £125 000 on 30 September. In Scotland the holiday ended on 31 March and in Wales is due to end on 30 June. As these deadlines are passed, this should see a significant cooling of demand.
Finally, although the gap between potential and actual output is narrowing, there is still a gap. According to the OECD (Table 12) the output gap in 2021 is forecast to be −4.6 per cent. Although it was −11.4 per cent in 2020, a gap of −4.6 per cent still represents a significant degree of slack in the economy.
At the current point in time, therefore, the Bank of England does not expect to have to raise interest rates in the immediate future. But it stands ready to do so if inflation does show signs of taking off.
Articles
- United Kingdom Economic Snapshot
OECD Economic Outlook (May 2021)
- UK growth forecast upgraded but pandemic economic ‘scar’ will be worst of all G7 nations, says OECD
Sky News, Ed Conway (31/5/21)
- OECD Predicts UK Economic Growth Amid Vaccine Success And Lockdown Easing
Minutehack Emma Bowden (1/6/21)
- UK growth upgraded, but OECD warns of deepest economic scar in G7
The Guardian, Graeme Wearden (31/5/21)
- UK set for stronger post-Covid recovery, says OECD
BBC News (31/5/21)
- British exports worth billions have faced EU tariffs since Brexit
BBC News, Faisal Islam (28/5/21)
- Post-Brexit: Businesses hit by labour shortages call for Brexit rules to be relaxed
Channel 4 News, Paul McNamara (2/6/21)
- Bank of England monitors UK housing boom as it weighs inflation risk
The Guardian, Larry Elliott (1/6/21)
- House prices jump 10.9% as ‘race for space’ intensifies
BBC News (1/6/21)
- Global food prices post biggest jump in decade
Financial Times, Emiko Terazono and Judith Evans (3/6/21)
- Why house prices are rising so fast in a pandemic
BBC News, Kevin Peachey and Daniele Palumbo (2/6/21)
- Inflation: why it could surge after the pandemic
The Conversation, Ian Crowther (23/4/21)
- Inflation might well keep rising in 2021 – but what happens after that?
The Conversation, Brigitte Granville (31/5/21)
- Slack in the Economy, Not Inflation, Should Be Bigger Worry
Institute for New Economic Thinking, Claudia Fontanari, Antonella Palumbo, and Chiara Salvatori (19/5/21)
Data, Forecasts and Analysis
Questions
- What determines the rate of (a) actual economic growth; (b) potential economic growth?
- What is meant by an output gap? What would be the implications of a positive output gap?
- Why are scarring effects of the pandemic likely to be greater in the UK than in most other countries?
- If people believed that inflation was likely to continue rising, how would this affect their behaviour and how would it affect the economy?
- What are the arguments for and against having a stamp duty holiday when the economy is in recession?