 It is impossible to make both precise and accurate forecasts of a country’s rate of economic growth, even a year ahead. And the same goes for other macroeconomic variables, such as the rate of unemployment or the balance of trade. The reason is that there are so many determinants of these variables, such as political decisions or events, which themselves are unpredictable. Economics examines the effects of human interactions – it is a social science, not a natural science. And human behaviour is hard to forecast.
Leading indicators
Nevertheless, economists do make forecasts. These are best estimates, taking into account a number of determinants that can be currently measured, such as tax or interest rate changes. These determinants, or ‘leading indicators’, have been found to be related to future outcomes. For example, surveys of consumer and business confidence give a good indication of future consumer expenditure and investment – key components of GDP.
Leading indicators do not have to be directly causal. They could, instead, be a symptom of underlying changes that are themselves likely to affect the economy in the future. For example, changes in stock market prices may reflect changes in confidence or changes in liquidity. It is these changes that are likely to have a direct or indirect causal effect on future output, employment, prices, etc.
Macroeconomic models show the relationships between variables. They show how changes in one variable (e.g. increased investment) affect other variables (e.g. real GDP or productivity). So when an indicator changes, such as a rise in interest rates, economists use these models to estimate the likely effect, assuming other things remain constant (ceteris paribus). The problem is that other things don’t remain constant. The economy is buffeted around by a huge range of events that can affect the outcome of the change in the indicator or the variable(s) it reflects.
Forecasting can never therefore be 100% accurate (except by chance). Nevertheless, by carefully studying leading indicators, economists can get a good idea of the likely course of the economy.
Leading indicators of the US economy
At the start of 2019, several leading indicators are suggesting the US economy is likely to slow and might even go into recession. The following are some of the main examples.
Political events. This is the most obvious leading indicator. If decisions are made that are likely to have an adverse effect on growth, a recession may follow. For example, decisions in the UK Parliament over Brexit will directly impact on UK growth.
 As far as the USA is concerned, President Trump’s decision to put tariffs on steel and aluminium imports from a range of countries, including China, the EU and Canada, led these countries to retaliate with tariffs on US imports. A tariff war has a negative effect on growth. It is a negative sum game. Of course, there may be a settlement, with countries agreeing to reduce or eliminate these new tariffs, but the danger is that the trade war may continue long enough to do serious damage to global economic growth.
But just how damaging it is likely to be is impossible to predict. That depends on future political decisions, not just those of the recent past. Will there be a global rise in protectionism or will countries pull back from such a destructive scenario? On 29 December, President Trump tweeted, ‘Just had a long and very good call with President Xi of China. Deal is moving along very well. If made, it will be very comprehensive, covering all subjects, areas and points of dispute. Big progress being made!’ China said that it was willing to work with the USA over reaching a consensus on trade.
Rises in interest rates. If these are in response to a situation of excess demand, they can be seen as a means of bringing inflation down to the target level or of closing a positive output gap, where real national income is above its potential level. They would not signify an impending recession. But many commentators have interpreted rises in interest rates in the USA as being different from this.
The Fed is keen to raise interest rates above the historic low rates that were seen as an ’emergency’ response to the financial crisis of 2007–8. It is also keen to reverse the policy of quantitative easing and has begun what might be described as ‘quantitative tightening’: not buying new bonds when existing ones that it purchased during rounds of QE mature. It refers to this interest rate and money supply policy as ‘policy normalization‘. The Fed maintains that such policy is ‘consistent with sustained expansion of economic activity, strong labor market conditions, and inflation near the Committee’s symmetric 2 percent objective over the medium term’.
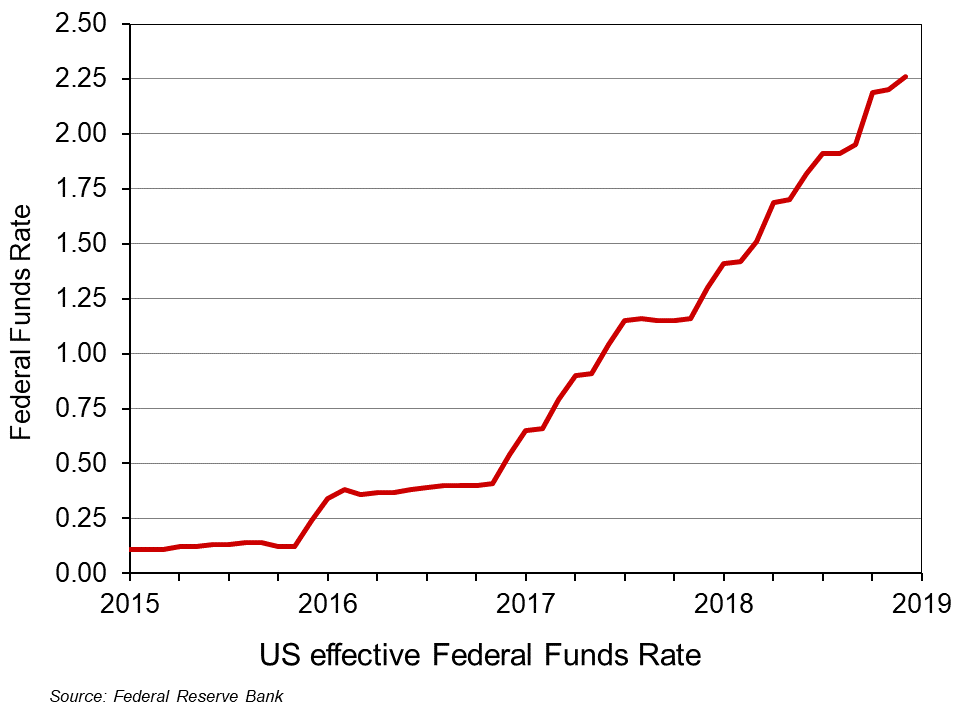 However, many commentators, including President Trump, have accused the Fed of going too fast in this process and of excessively dampening the economy. It has already raised the Federal Funds Rate nine times by 0.25 percentage points each time since December 2015 (click here for a PowerPoint file of the chart). What is more, announcing that the policy will continue makes such announcements themselves a leading indicator of future rises in interest rates, which are a leading indicator of subsequent effects on aggregate demand. The Fed has stated that it expects to make two more 0.25 percentage point rises during 2019.
 Surveys of consumer and business confidence. These are some of the most significant leading indicators as consumer confidence affects consumer spending and business confidence affects investment. According to the Duke CFO Global Business Outlook, an influential survey of Chief Financial Officers, ‘Nearly half (48.6 per cent) of US CFOs believe that the US will be in recession by the end of 2019, and 82 per cent believe that a recession will have begun by the end of 2020’. Such surveys can become self-fulfilling, as a reported decline in confidence can itself undermine confidence as both firms and consumers ‘catch’ the mood of pessimism.
Stock market volatility. When stock markets exhibit large falls and rises, this is often a symptom of uncertainty; and uncertainty can undermine investment. Stock market volatility can thus be a leading indicator of an impending recession. One indicator of such volatility is the VIX index. This is a measure of ’30-day expected volatility of the US stock market, derived from real-time, mid-quote prices of S&P 500® Index (SPXSM) call and put options. On a global basis, it is one of the most recognized measures of volatility – widely reported by financial media and closely followed by a variety of market participants as a daily market indicator.’ The higher the index, the greater the volatility. Since 2004, it has averaged 18.4; from 17 to 28 December 2018, it averaged 28.8. From 13 to 24 December, the DOW Jones Industrial Average share index fell by 11.4 per cent, only to rise by 6.2 per cent by 27 December. On 26 December, the S&P 500 index rallied 5 per cent, its best gain since March 2009.
Not all cases of market volatility, however, signify an impending recession, but high levels of volatility are one more sign of investor nervousness.
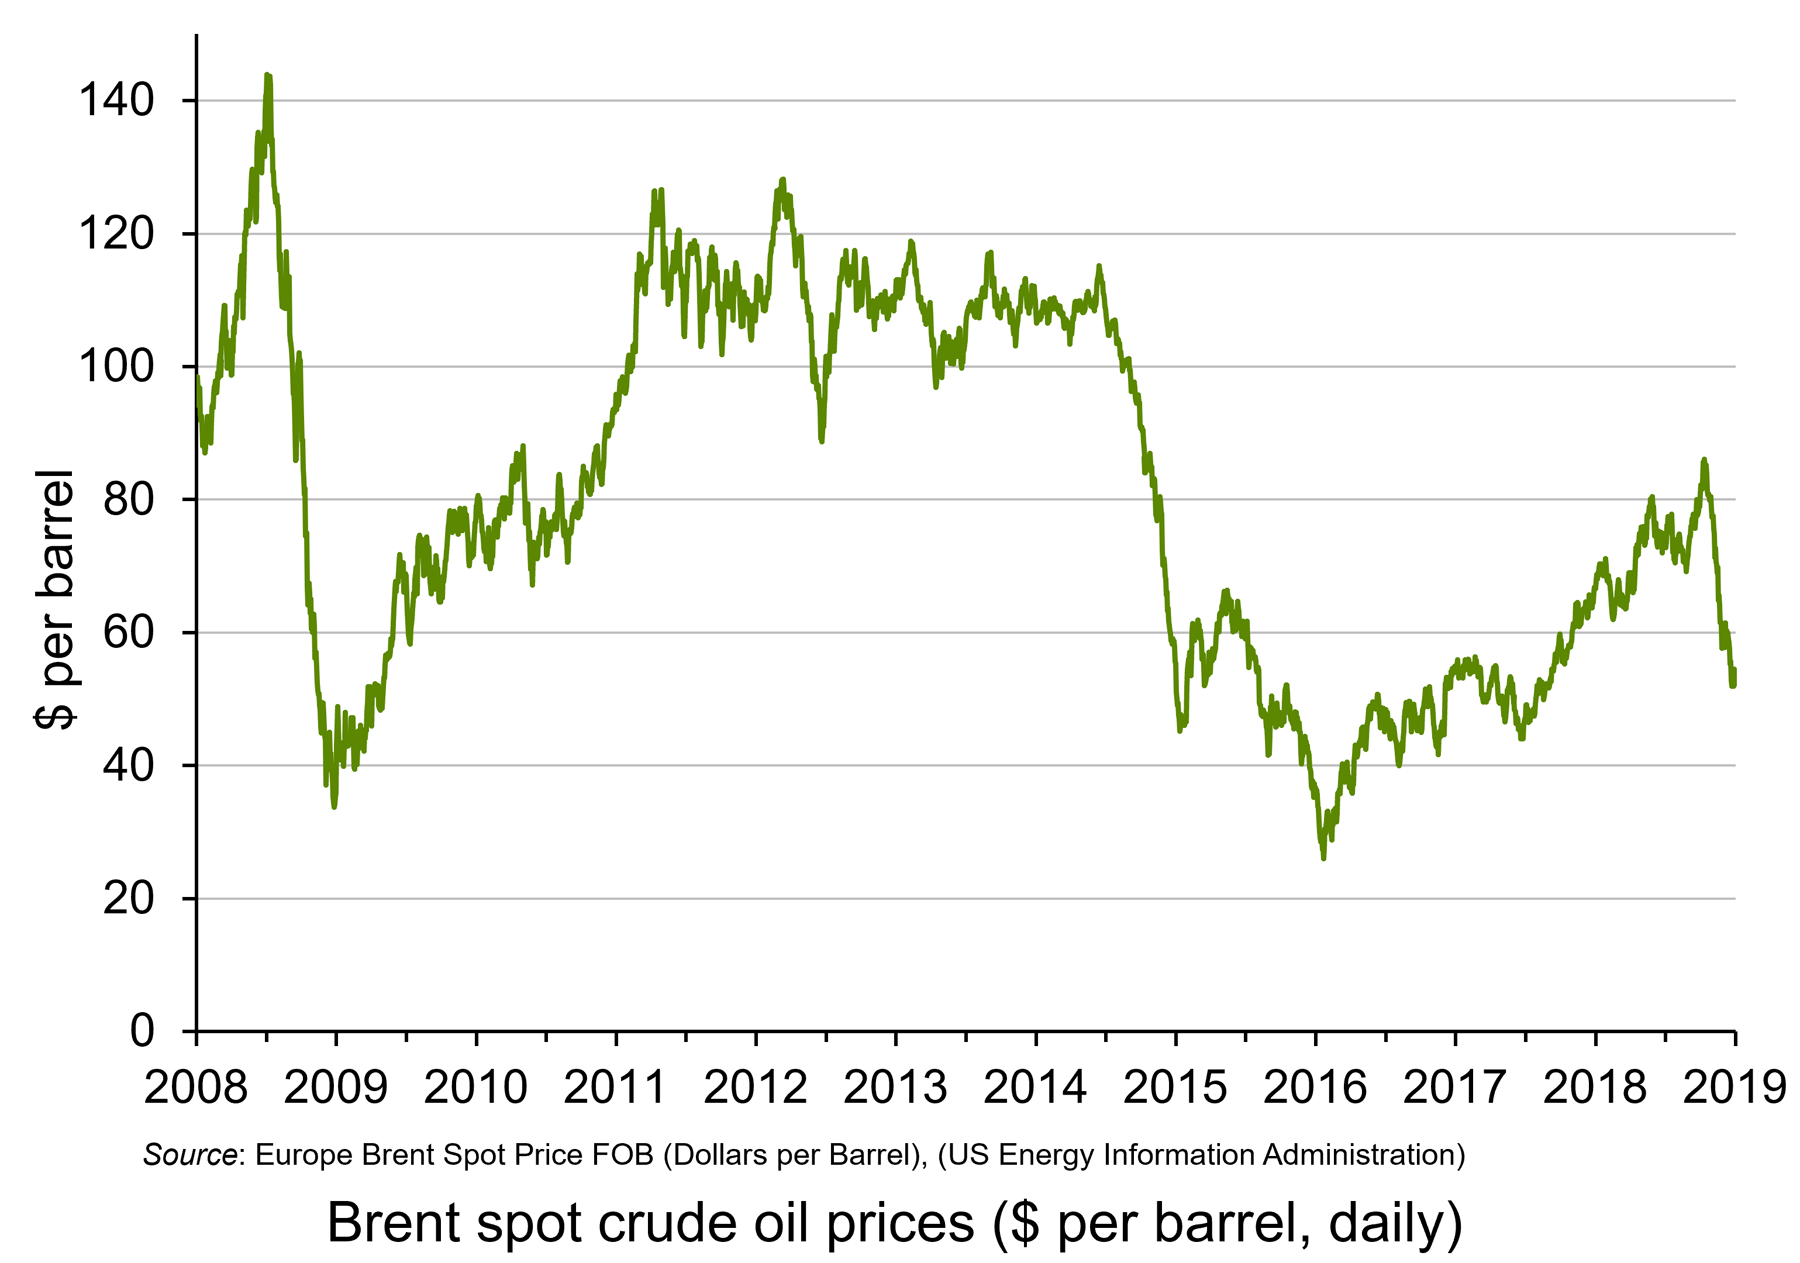 Oil prices. When oil prices fall, this can be explained by changes on the demand and/or supply side of the oil market. Oil prices have fallen significantly over the past two months. Until October 2018, oil prices had been rising, with Brent Crude reaching $86 per barrel by early October. By the end of the year the price had fallen to just over $50 per barrel – a fall of 41 per cent. (Click here for a PowerPoint file of the chart.) Part of the explanation is a rise in supply, with shale oil production increasing and also increased output from Russia and Saudi Arabia, despite a commitment by the two countries to reduce supply. But the main reason is a fall in demand. This reflects both a fall in current demand and in anticipated future demand, with fears of oversupply causing oil companies to run down stocks.
Falling oil prices resulting from falling demand are thus an indicator of lack of confidence in the growth of future demand – a leading indicator of a slowing economy.
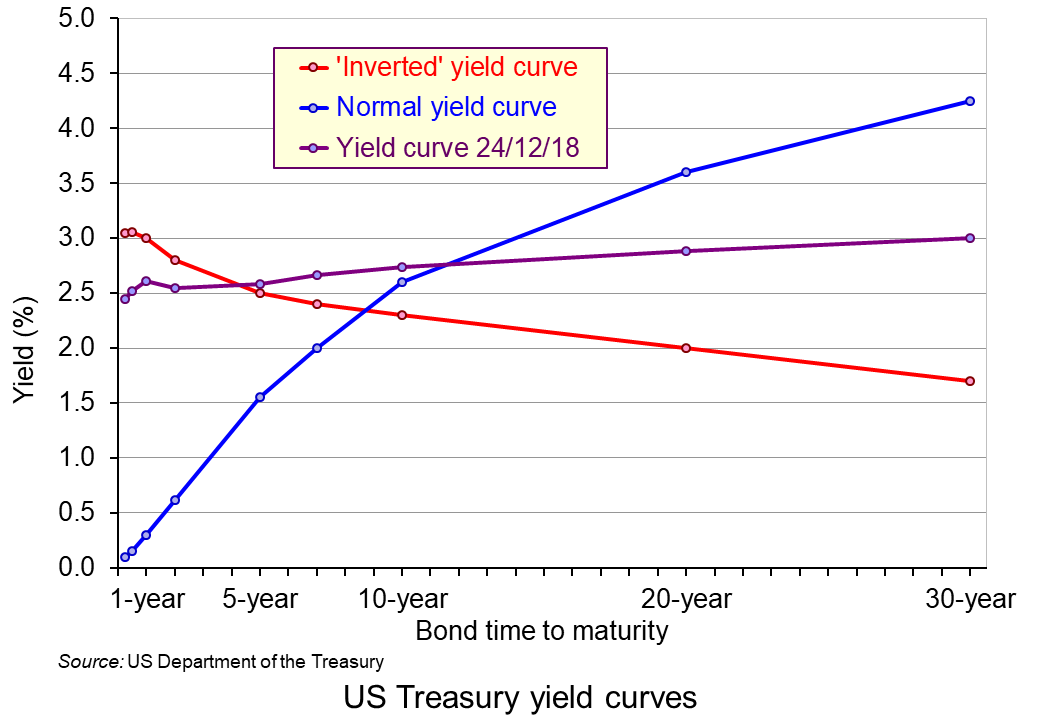 The yield curve. This depicts the yields on government debt with different lengths to maturity at a given point in time. Generally, the curve slopes upwards, showing higher rates of return on bonds with longer to maturity. This is illustrated by the blue line in the chart. (Click here for a PowerPoint file of the chart.) This is as you would expect, with people requiring a higher rate of return on long-term lending, where there is normally greater uncertainty. But, as the Bloomberg article, ‘Don’t take your eyes off the yield curve‘ states:
Occasionally, the curve flips, with yields on short-term debt exceeding those on longer bonds. That’s normally a sign investors believe economic growth will slow and interest rates will eventually fall. Research by the Federal Reserve Bank of San Francisco has shown that an inversion has preceded every US recession for the past 60 years.
The US economy is 37 quarters into what may prove to be its longest expansion on record. Analysts surveyed by Bloomberg expect gross domestic product growth to come in at 2.9 percent this year, up from 2.2 percent last year. Wages are rising as unfilled vacancies hover near all-time highs.
With times this good, the biggest betting game on Wall Street is when they’ll go bad. Barclays Plc, Goldman Sachs Group Inc., and other banks are predicting inversion will happen sometime in 2019. The conventional wisdom: Afterward it’s only a matter of time – anywhere from 6 to 24 months – before a recession starts.
As you can see from the chart, the yield curve on 24 December 2018 was still slightly upward sloping (expect between 6-month and 1-year bonds) – but possibly ready to ‘flip’.
However, despite the power of an ‘inverted’ yield in predicting previous recessions, it may be less reliable now. The Fed, as we saw above, has already signalled that it expects to increase short-term rates in 2019, probably at least twice. That alone could make the yield curve flatter or even downward sloping. Nevertheless, it is still generally thought that a downward sloping yield curve would signal belief in a likely slowdown, if not outright recession.
So, is the USA heading for recession?
The trouble with indicators is that they suggest what is likely – not what will definitely happen. Governments and central banks are powerful agents. If they believed that a recession was likely, then fiscal and monetary policy could be adjusted. For example, the Fed could halt its interest rate rises and quantitative tightening, or even reverse them. Also, worries about protectionism may subside if the USA strikes new trade deals with various countries, as it did with Canada and Mexico in USMCA.
Articles
- A jarring new survey shows CEOs think a recession could strike as soon as year-end 2019
Business Insider, Joe Ciolli (17/12/18)
- 4 Recession Indicators to Watch Now
Barron’s, Campbell Harvey (20/12/18)
- 9 Reasons the US Will Have a Recession Next Year
24/7 Wall St, Douglas A. McIntyre (26/12/18)
- The global economy is living dangerously – but don’t expect superpowers to follow the 2008 script
Independent, Ben Chu (3/1/19)
- Could a recession be just around the corner?
The Conversation, Amitrajeet A Batabyal (6/12/18)
- The US is on the edge of the economic precipice – Trump may push it over
The Guardian, Robert Reich (23/12/18)
- US prepares to hit the wall as reckless Trump undoes years of hard work
The Guardian, (Business Leader) (23/12/18)
- The first signs of the next recession
New Statesman, Helen Thompson (23/11/18)
- Is a Recession Coming? CFOs Predict 2019 Recession, Majority Expect Pre-2020 Market Crash
Newsweek, Benjamin Fearnow (12/12/18)
- Trade slowdown coming at worst time for world economy, markets
Reuters, Jamie McGeever (19/12/18)
- How to spot the next recession
The Week, Jeff Spross (27/11/18)
- What Is a Recession, and Why Are People Talking About the Next One?
New York Times, Niraj Chokshi (17/12/180
- For the American Economy, Storm Clouds on the Horizon
New York Times, Binyamin Appelbaum (28/11/18)
- Don’t Take Your Eyes Off the Yield Curve
Bloomberg Businessweek, Liz McCormick and Jeanna Smialek (16/11/18)
- What to expect from 2019’s ‘post-peak’ economy
CNN, Larry Hatheway (19/12/18)
- Worried about the next recession? Here’s what to watch instead of the yield curve
Quartz, Gwynn Guilford (17/12/18)
- Leading Economic Indicators and How to Use Them
The Balance, Kimberly Amadeo (10/9/18)
Surveys and Data
Questions
- Define the term ‘recession’.
- Are periods of above-trend expansion necessarily followed by a recession?
- Give some examples of leading indicators other than those given above and discuss their likely reliability in predicting a recession.
- Find out what has been happening to confidence levels in the EU over the past 12 months. Does this provide evidence of an impending recession in the EU?
- For what reasons may there be lags between a change in an indicator and a change in the variables for which it is an indicator?
- Why has the shape of the yield curve previously been a good predictor of the future course of the economy? Is it likely to be at present?
- What is the relationship between interest rates, government bond prices (‘Treasuries’ in the USA) and the yield on such bonds?
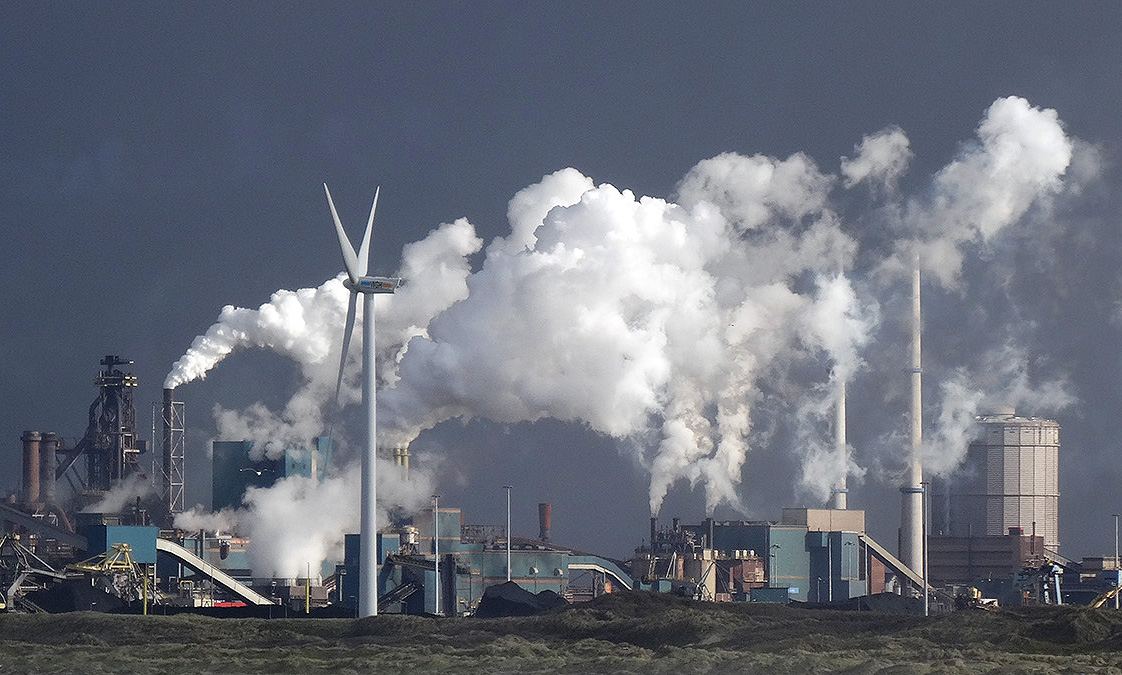 In 2015, at the COP21 climate change conference in Paris, an agreement was reached between the 195 countries present. The Paris agreement committed countries to limiting global warming to ‘well below’ 2°C and preferably to no more than 1.5°C. above pre-industrial levels. To do this, a ‘cap-and-trade’ system would be adopted, with countries agreeing to limits to their emissions and then being able to buy emissions credits to exceed these limits from countries which had managed to emit below their limits. However, to implement the agreement, countries would need to adopt a ‘rulebook’ about how the permitted limits would be applied, how governments would measure and report emissions cuts, how the figures would be verified and just how a cap-and-trade system would work.
At the COP24 meeting from 2 to 15 December 2018 in Katowice, Poland, nearly 14 000 delegates from 196 countries discussed the details of a rulebook. Despite some 2800 points of contention and some difficult and heated negotiations, agreement was finally reached. Rules for targeting, measuring and verifying emissions have been accepted. If countries exceed their limits, they must explain why and also how they will meet them in future. Rich countries agreed to provide help to poor countries in curbing their emissions and adapting to rising sea levels, droughts, floods and other climate-induced problems.
 But no details have been agreed on the system of carbon trading, thanks to objections from the Brazilian delegates, who felt that insufficient account would be made of their country’s existing promises on not chopping down parts of the Amazon rainforest.
Most seriously, the measures already agreed which would be covered by the rulebook will be insufficient to meet the 2°C, let alone the 1.5°C, target. The majority of the measures are voluntary ‘nationally determined contributions’, which countries are required to submit under the Paris agreement. These, so far, would probably be sufficient to limit global warming to only around 3°C, at which level there would be massive environmental, economic and social consequences.
There was, however, a belief among delegates that further strong international action was required. Indeed, under the Paris agreement, emissions limits to keep global warming to the ‘well below 2°C’ level must be agreed by 2020.
Climate change is a case of severe market failure. A large proportion of the external costs of pollution are borne outside the countries where the emitters are based. This creates a disincentive for countries acting alone to internalise all these externalities through the tax system or charges, or to regulate them toughly. Only by countries taking an international perspective and by acting collectively can the externalities be seen as a fully internal problem.
Even though most governments recognise the nature and scale of the problem, one of the biggest problems they face is in persuading people that it is in their interests to cut carbon emissions – something that may become increasingly difficult with the rise in populism and the realisation that higher fuel and other prices will make people poorer in the short term.
Articles
Questions
- To what extent can the atmosphere been seen as a ‘global commons’?
- What incentives might be given for business to make ‘green investments’?
- To what extent might changes in technology help businesses and consumers to ‘go green’?
- Why might international negotiations over tackling climate change result in a prisoner’s dilemma problem? What steps could be taken to tackle the problem?
- How would an emissions cap-and-trade system work?
- Investigate the Brazilian objections to the proposals for emissions credits. Were the delegates justified in their objections?
- What types of initiative could businesses take to tackle ‘supply chain emissions’?
- How could countries, such as the USA, be persuaded to reduce their reliance on coal – an industry lauded by President Trump?
 The UK’s Low Pay Commission has just published its annual report. This shows that the lowest-paid 20% of workers aged 25 and over benefited from last April’s 4.4% rise in the ‘National Living Wage (NLW)’, the name the government gives to the statutory minimum wage for people in this age group. Although only around 6.5% of such workers are paid at the NLW, when it rises this tends to push up wage rates which are just above the NLW as employers seek to maintain the differential.
If the new NLW is above the equilibrium rate for those receiving it, it would be expected that firms would respond by employing fewer workers. However, the Low Pay Commission found no evidence that rises in the NLW caused unemployment. Instead, employers responded by combinations of increasing prices, accepting lower profit margins, restructuring their workforce and reducing the gaps between pay bands.
Over the longer term, employers often seek to increase labour productivity to offset the higher cost per worker of paying increased minimum wage rates. This, however, could lead to a reduction in employment if it involves substituting capital for labour or if greater labour efficiency does not result in a sufficient increase in total output to compensate for an increase in output per worker.
Articles
Report and data
Questions
- Demonstrate on a supply and demand diagram for a perfectly competitive labour market the impact of a rise in the minimum wage on employment and unemployment in that market. Assume that the market is initially in equilibrium at the previous minimum wage rate.
- For what reasons in such markets may a rise in the minimum wage not lead to a rise in unemployment?
- Now demonstrate the effect of a rise in the minimum wage in a monopsonistic market. Assume that the previous minimum wage was previously being paid by the employer.
- For what reasons may the employer in the previous question choose to retain employment at the current level?
- For what reasons may the effect of a rise in the minimum wage be different in the long run from the short run?
- How can employers avoid paying the minimum wage (a) when workers work in the ‘gig’ economy; (b) when workers have to travel as part of their job: e.g. care workers moving from house to house; (c) workers working from home producing items for an employer, such as clothing or jewelry, or providing a service such as telesales?
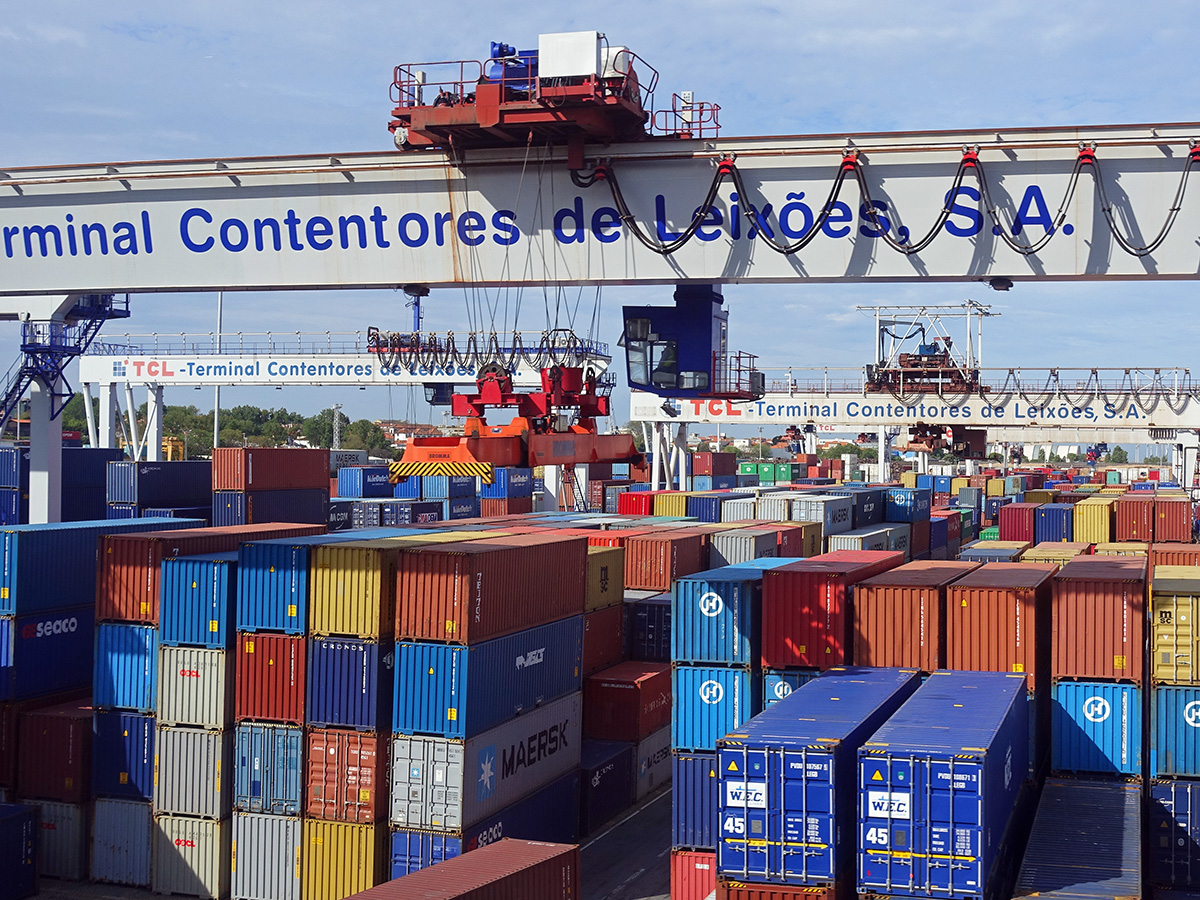 One of the key questions about Brexit is its effect on UK trade and cross-border investment. Once outside the customs union, will the freedom to negotiate trade deals lead to an increase in UK exports and GDP, as many who support Brexit claim; or will the increased frictions in trade with the EU, and the need to negotiate new trade deals with those non-EU countries which already have trade deals with the EU, lead to a fall in exports and in GDP?
Also, how will trade restrictions or new trade deals affect capital flows? Will there be an increase in inward investment or a flight of investment to the EU or elsewhere? Will many companies relocate away from the UK – or to it?
Although there has been a cost up to now from the Brexit vote, in terms of a depreciation in sterling and a fall in inward investment (see the first article below), the future effects have been hard to predict as the terms on which the UK will leave the EU have been unclear. However, with a draft withdrawal agreement between the EU and the UK government having been reached, the costs and benefits are becoming clearer. But there is still uncertainty about just what the effects on trade and investment will be.
- First, the 585-page draft withdrawal agreement is not a trade deal. It contains details of UK payments to the EU, commitments on the rights of EU and UK citizens and confirmation of the transition period – initially until 31 December 2020, but possibly extended with mutual agreement. During the transition agreement, the UK would remain a member of the customs union and single market and remain subject to rulings of the European Court of Justice. The withdrawal agreement also provides for a continuation of the customs union beyond the transition period, if no long-term trade agreement is in place. This is to prevent he need for a hard border between Ireland and Northern Ireland.
- Second, there is merely a 26-page ‘political declaration‘ about future trade relations. Negotiations on the details of these can only begin once the UK has left the EU, scheduled for 29 March 2019. So it’s still unclear about just how free trade in both goods and services will be between the UK and the EU and how freely capital and labour will move between them. But with the UK outside the single market, there will be some limitations on trade and factor movements – some frictions.
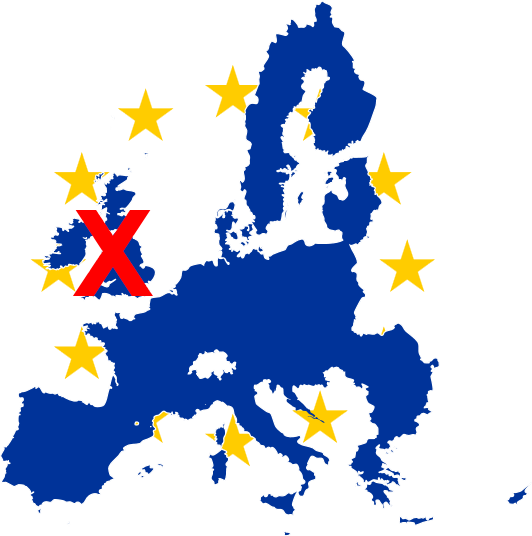 Third, it is not clear whether the UK Parliament will agree to the withdrawal agreement. Currently, it seems as if a majority of MPs is in favour of rejecting it. If this happens, will the UK leave without an agreement, with trade based on WTO terms? Or will the EU be prepared to renegotiate it – something it currently says it will not do? Or will the issue be put back to the electorate in the form of a People’s vote (see also), which might contain the option of seeking to remain in the EU?
So, without knowing just what the UK’s future trade relations will be with (a) the EU, (b) non-EU countries which have negotiated trade deals with the EU, (c) other countries without trade deals with the EU, it is impossible to quantify the costs and benefits from the effects on trade and investment. However, the consensus among economists is still that there will be a net cost in terms of lost trade and inward investment.
Such as view is backed by a government analysis of various Brexit scenarios, released in time for the House of Commons vote on 11 December. This concludes that the UK will be worse off under all Brexit alternatives compared with staying in the EU. The main brake on growth will be frictions in trade from tariff and non-tariff barriers.
This analysis was supported by a Bank of England paper which modelled various scenarios based on assumptions about different types of Brexit deal. While recognising the inherent uncertainty in some of the empirical relationships, it still concluded that Brexit would be likely to have a net negative effect. The size of this negative effect would depend on the closeness of the new relationship between the UK and EU, the degree of preparedness across firms and critical infrastructure, and how other policies respond.
Articles
Reports
Documents
Questions
- Identify the main economic advantages and disadvantages for the UK from leaving the EU?
- How does the law of comparative advantage relate to the question of the relative trade gains from leaving and remaining in the EU?
- What is the difference between the following models of relationship with the EU: the Switzerland model; the Norway model; the Turkey model; the Canada (plus or plus, plus) model; trading on WTO terms?
- Why is the consensus among economists that there will be a net economic cost from leaving the EU, no matter on what terms?
- Is the UK likely to achieve more favourable trade deals with non-EU countries as an independent country or as a member of the EU benefiting from EU-negotiated trade deals with such countries?
 One of the announcements in the recent UK Budget was the ending of the Private Finance Initiative (PFI), including its revised form, PF2. PFI was introduced by the Conservative government in 1992. Subsequently, it was to become central to the Labour government’s ‘Third-way’ approach of using the private sector to deliver public projects and services.
PFI involves a public–private partnership (PPP). The private sector builds and/or runs public projects, such as new schools, hospitals, roads, bridges, student accommodation, and so on. The public sector, in the form of government departments, NHS foundation trusts, local authorities, etc., then pays the private sector company a rent for the infrastructure or pays the company to provide services. The benefit of PFI is that it allows private-sector capital to be used for new projects and thus reduces the need for government to borrow; the disadvantage is that it commits the public-sector body to payments over the long-term to the company involved.
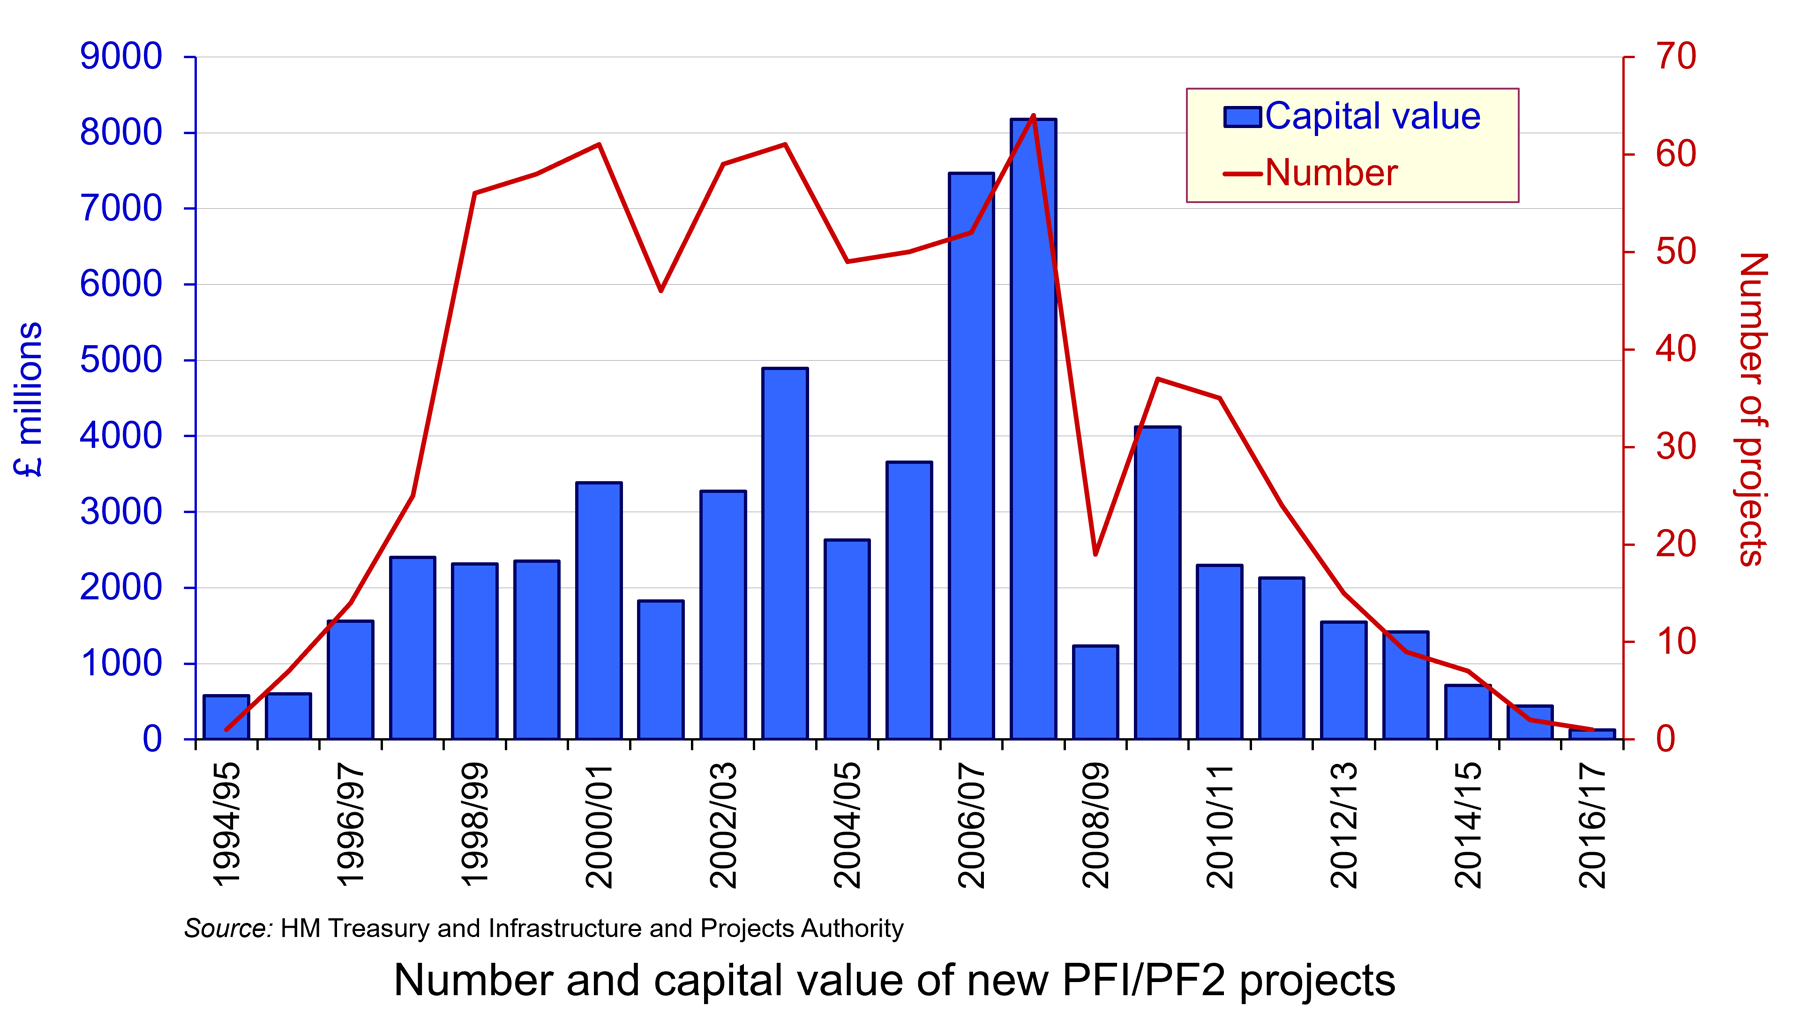
As the chart shows, PFI became an important means of funding public service provision during the 2000s. In the 10-year period up to financial year 2007/08, more than 50 new projects were being signed each year.
As the number of projects grew and with them the long-term financial commitments of the public sector, so criticisms mounted. These included:
- Quality and cost. It was claimed that PFI projects were resulting in poorer quality of provision and that cost control was often poor, resulting in a higher burden for the taxpayer in the long term.
- Credit availability. PFI projects are typically dependent on the private partner using debt finance to acquire the necessary funds. Therefore, credit conditions affect the ability of PFI to fund the delivery of public services. With the credit crunch of 2008/9, many firms operating PFI projects found it difficult to raise finance.
- The financial health of the private partner. What happens if the private company runs into financial difficulties. In 2005, the engineering company Jarvis only just managed to avoid bankruptcy by securing refinancing on all 14 of its PFI deals.
PF2
Recognising these problems, in 2011 the government set up a review of PFI. The result was a revised form of PFI, known as ‘PF2’. PF2 projects involved tighter financial control, with the government acting as a minority co-investor; more robust tendering processes, with bidders required to develop a long-term financing solution, where bank debt does not form the majority of the financing of the project; the removal of cleaning, catering and other ‘soft services’.
Despite the government’s intention that PPPs remain an important plank of its funding of public services, the number of new PFI/PF2 projects has nonetheless declined sharply during the 2010s as the chart shows. Of the 715 PPP projects as of 31 March 2017, 631 had been signed before May 2010. Indeed, in 2016/17 only 1 new project was signed.
The collapse of Carillion
 Concerns over PPPs remained despite the reforms under PF2. These were brought dramatically into focus with the collapse of Carillion plc (see the blog, Outsourcing, PFI and the demise of Carillion). Carillion was a British company focused on construction and facilities management (i.e. support services for organisations). It was a significant private-sector partner in PPP projects. By 2014 it had won 60 PPP projects in the UK and Canada, including hospitals, schools, university buildings, prisons, roads and railways.
However, Carillion had increasing burdens of debt, caused, in part, by various major acquisitions, including McAlpine in 2008. Events came to a head when, on 15 January 2018, an application was made to the High Court for a compulsory liquidation of the company.
A subsequent report for the House of Commons Public Administration and Constitutional Affairs Committee in light of the collapse of Carillion found that procurement procedures were fundamentally flawed. It found that contracts were awarded based on cost rather than quality. This meant that some contracts were not sustainable. Between 2016 and the collapse of Carillion the government had been forced to renegotiate more than £120m of contracts so that public services could continue.
The ending of PPPs?
On 18 January 2018, the National Audit Office published an assessment of PFI and PF2. The report stated that there were 716 PFI and PF2 projects at the time, either under construction or in operation, with a total capital value of £59.4 billion. In recent years, however, ‘the government’s use of the PFI and PF2 models had slowed significantly, reducing from, on average, 55 deals each year in the five years to 2007/8 to only one in 2016/17.’
At its conference in September 2018, the Labour shadow chancellor, John McDonnell, said that, if elected, a Labour government would not award any new PFI/PF2 contracts. He claimed that PFI/PF2 contracts were set to cost the taxpayer £200bn over the coming decade. Labour policy would be to review all existing PFI/PF2 contracts and bring the bulk of them fully back into the public sector.
Then in the Budget of 29 October 2018, the Chancellor announced that no further PFI/PF2 projects would be awarded, although existing ones would continue.
I have never signed off a PFI contract as chancellor, and I can confirm today that I never will. I can announce that the government will abolish the use of PFI and PF2 for future projects.
We will honour existing contracts. But the days of the public sector being a pushover, must end. We will establish a centre of excellence to actively manage these contracts in the taxpayers’ interest, starting in the health sector.
But does this mean that there will be no more public-private partnerships, of which PFI is just one example? The answer is no. As the Chancellor stated:
And in financing public infrastructure, I remain committed to the use of public-private partnership where it delivers value for the taxpayer and genuinely transfers risk to the private sector.
But just what form future PPPs will take is unclear. Clearly, the government will want to get value for money, but that depends on the mechanisms used to ensure efficient and high-quality projects. What is more, there is still the danger that the companies involved could end up with unsustainable levels of debt if economic circumstances change and it will still involve a burden on the taxpayer for the future.
Articles
Questions
- Find out how PF2 differs from PFI and assess the extent to which it overcame the problems identified with PFI.
- The government is not bringing back existing PFI contracts into the public sector, whereas the Labour Party would do so – at least with some of them. Assess the arguments for and against bringing PFI contracts ‘in-house’.
- Find out why Carillion collapsed. To what extent was this due to its taking on PFI contracts?
- What were the main findings of the National Audit Office’s assessment of PFI and PF2?
- The government still supports the use of public-private partnerships (PPPs). What form could these take other than as PFI/PF2 contracts? Would the problems associated with PFI/PF2 also apply to PPPs in general?