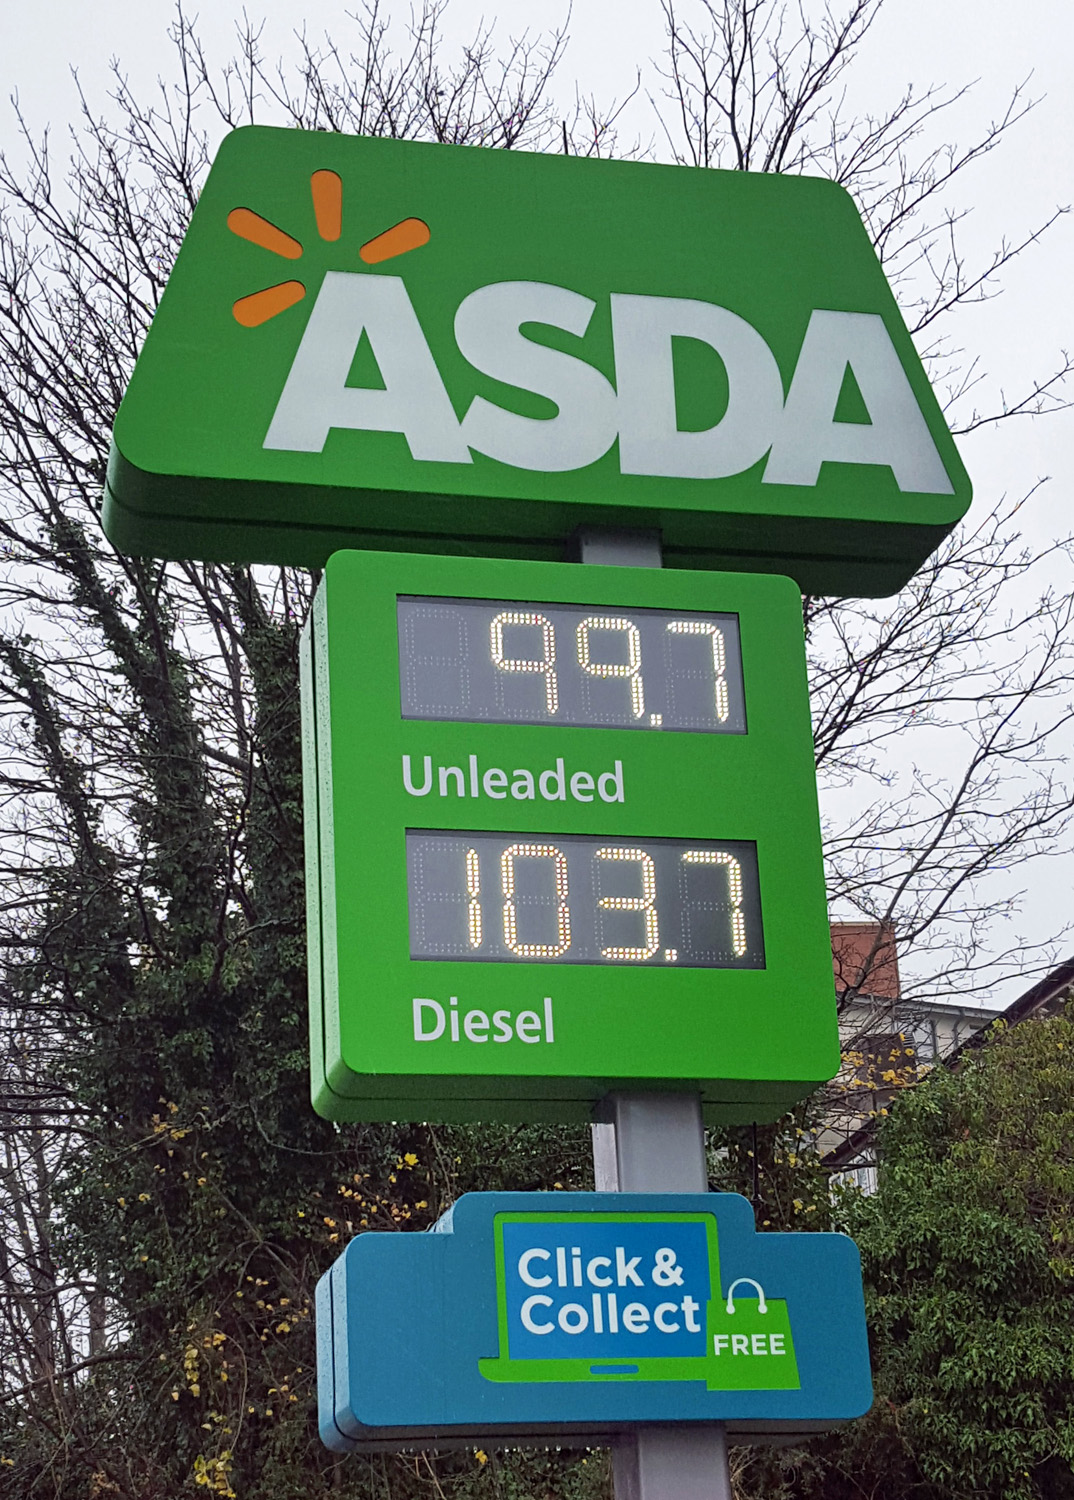
The ‘Big 4’ supermarkets in the UK – Tesco, Sainsbury’s, Asda and Morrisons – have a 69.5% share of the Great Britain grocery market (see data link below). The next four – Aldi, Co-op, Lidl and Waitrose – have a 23.8% share. If two of the Big 4 were to merge, would there be a significant decline in competition? This is a question the Competition and Markets Authority (CMA) has been considering in the light of Sainsbury’s planned £7.3 billion takeover of Asda (owned by the US retailing giant, Walmart).
In a recently published provisional report, the CMA argues that “the merger could lead to a substantial lessening of competition at both a national and local level.” The CMA has concerns that the merger:
…could lead to a worse experience for in-store and online shoppers across the UK through higher prices, a poorer shopping experience, and reductions in the range and quality of products offered. It also has concerns that prices could rise at a large number of Sainsbury’s and Asda petrol stations. …The combined impact means that people could lose out right across the UK and that the deal could also cost shoppers through reduced competition in particular areas where Sainsbury’s and Asda stores overlap.
Sainsbury’s and Asda currently have a combined market share of 31.2%. This is slightly larger than Tesco’s 27.7%. But would this give the merged companies too much market power? Would there not still be intense competition between the new Big 3? And, with the growth in the German discounters, Aldi and Lidl, as well as competition from Waitrose, the Co-op, Marks & Spencer and Iceland, would there be any significant decline in competition and choice and a rise in prices?
To answer this, it is crucial to define the grocery market. The CMA argues that the major competitors to any Big 4 company are the other Big 4 companies, rather than the German discounters or other supermarkets. Unlike Aldi and Lidl, the Big 4 have a range of facilities, such as fish and meat counters, delivery and a large range of branded products.
At a national level the CMA finds that the merger would reduce competitive pressure, so that a Big 3 would be less competitive than the Big 4, with higher prices and with reduced quality, range of products and in-store services.
At the local level the effects are likely to be serious. Often the consumer has very limited choice of supermarkets at a local level. If a particular area has just two supermarkets, Sainsbury’s and Asda, then the merger of the two could result in a substantial loss of competition. The only alternative for consumers in such areas would be to use small shops, which tend to be more highly priced anyway and do not compete head-to-head with the supermarkets, or to drive to another area or to shop online, depending on how far rival supermarkets are prepared to deliver. Similar arguments apply to supermarket petrol stations, where the only competition to supermarkets is from roadside petrol stations, often selling more highly priced petrol.
In response to the CMA’s findings, Sainsbury’s chief executive, Mike Coupe, claims that they focus too much on competition between the Big 4 and do not take into account competition from Lidl and Aldi, both of which are expending rapidly and now have a combined market share of 12.8% (compared with 10.7% two years ago).
Sainsbury’s and Asda also claim that there would be considerable scope for economies of scale, with lower costs being achieved through purchasing and logistics. In a joint statement they state that:
Combining Sainsbury’s and Asda would create significant cost savings, which would allow us to lower prices. Despite the savings being independently reviewed by two separate industry specialists, the CMA has chosen to discount them as benefits.
The two companies and other interested parties have until 13 March to respond to the provisional findings. The CMA will then issue its final report by 30 April 2019. If it sticks to its provisional findings, then either the merger will be blocked or the merging companies would have to ‘sell off a significant number of stores and other assets – potentially including one of the Sainsbury’s or Asda brands – to recreate the competitive rivalry lost through the merger.’ This might be very difficult to achieve as the new buyer would have to be big enough to provide effective competition to the remaining Big 3. Perhaps this could be an opportunity for Amazon to move into in-store grocery retailing. Or there may be some private equity company that would like to do the same.
It is likely that if the CMA sticks to its ruling, the two supermarkets will apply for a judicial review of the CMA’s decision.
In what market segments do the Big 4 supermarkets compete?
Research earlier investigations of the supermarket sector by the UK competition authorities. What were their findings?
In what ways might the proposed takeover of Asda by Sainsbury’s affect consumers’ interests (a) at a national level; (b) at the local level?
What is the ‘GUPPI index’? How is it calculated and how is it used in assessing the effects of the proposed takeover? (See pages 88–91 and 109–11 of the CMA’s Provisional Report and pages I5–I15 of the Appendices and Glossary.)
Distinguish between horizontal and vertical mergers. How is the distinction relevant in drawing lessons from the Tesco takeover of Booker for the Sainsbury’s takeover of Asda?
Rather than blocking the takeover, one alternative would be for the CMA to permit it, subject to the sale of specific stores where there are problems of the merger limiting competition in a particular locality. Do you think that this would be a better alternative than blocking the takeover? Explain.
Late January sees the annual global World Economic Forum meeting of politicians, businesspeople and the great and the good at Davos in Switzerland. Global economic, political, social and environmental issues are discussed and, sometimes, agreements are reached between world leaders. The 2019 meeting was somewhat subdued as worries persist about a global slowdown, Brexit and the trade war between the USA and China. Donald Trump, Xi Jinping, Vladimir Putin and Theresa May were all absent, each having more pressing issues to attend to at home.
There was, however, a feeling that the world economic order is changing, with the rise in populism and with less certainty about the continuance of the model of freer trade and a model of capitalism modified by market intervention. There was also concern about the roles of the three major international institutions set up at the end of World War II: the IMF, the World Bank and the WTO (formerly the GATT). In a key speech, Angela Merkel urged countries not to abandon the world economic order that such institutions help to maintain. The world can only resolve disputes and promote development, she argued, by co-operating and respecting the role of such institutions.
But the role of these institutions has been a topic of controversy for many years and their role has changed somewhat. Originally, the IMF’s role was to support an adjustable peg exchange rate system (the ‘Bretton Woods‘ system) with the US dollar as the international reserve currency. It would lend to countries in balance of payments deficit to allow them to maintain their rate pegged to the dollar unless it was perceived to be a fundamental deficit, in which case they were expected to devalue their currency. The system collapsed in 1971, but the IMF continued to provide short-term, and sometimes longer-term, finance to countries in balance of payments difficulties.
The World Bank was primarily set up to provide development finance to poorer countries. The General Agreement on Tariffs and Trade (GATT) and then the WTO were set up to encourage freer trade and to resolve trade disputes.
However, the institutions were perceived with suspicion by many developing countries and by more left-leaning developed countries, who saw them as part of the ‘Washington consensus’. Loans from the IMF and World Bank were normally contingent on countries pursuing policies of market liberalisation, financial deregulation and privatisation.
Although there has been some movement, especially by the IMF, towards acknowledging market failures and supporting a more broadly-based development, there are still many economists and commentators calling for more radical reform of these institutions. They advocate that the World Bank and IMF should directly support investment – public as well as private – and support the Green New Deal.
With the UK parliament in Brexit gridlock, the Labour opposition is calling for a general election. Although its policy over Brexit and a second referendum is causing splits in the party, the Labour party is generally agreed that pubic expenditure on health, education and transport infrastructure needs to increase – that there needs to be an end to fiscal austerity. However, to fund extra public expenditure would require an increase in taxes and/or an increase in government borrowing.
One of the arguments against increasing government borrowing is that it will increase public-sector debt. The desire to get public-sector debt down as a percentage of GDP has been central to both the Coalition and Conservative governments’ economic strategy. Austerity policies have been based on this desire.
But, in the annual presidential address to the American Economics Association, former chief economist at the IMF, Olivier Blanchard, criticised this position. He has argued for several years that cutting government deficits may weaken already weak economies and that this may significantly reduce tax revenues and potential national income, thereby harming recovery and doing long-term economic damage. Indeed, the IMF has criticised excessively tight fiscal policies for this reason.
In his presidential address, he expanded the argument to consider whether an increase in government borrowing will necessarily increase the cost of servicing government debt. When the (nominal) interest rate (r) on government borrowing is below the nominal rate of economic growth (gn), (r < gn), then even if total debt is not reduced, it is likely that the growth in tax revenues will exceed the growth in the cost of servicing the debt. Debt as a proportion of GDP will fall. The forecast nominal growth rate exceeds the 10-year nominal rate on government bonds by 1.3% in the USA, 2.2% in the UK and 1.8% in the eurozone. In fact, with the exception of a short period in the 1980s, nominal growth (gn) has typically exceeded the nominal interest rate on government borrowing (r) for decades.
When r < gn, this then gives scope for increasing government borrowing to fund additional government spending without increasing the debt/GDP ratio. Indeed, if that fiscal expansion increases both actual and potential income, then growth over time could increase, giving even more scope for public investment.
Peterson Institute on YouTube, Olivier Blanchard (4/1/19)
Questions
What do you understand by ‘fiscal illusion’?
What is the justification for reducing government debt as a proportion of GDP?
What are the arguments against reducing government debt as a proportion of GDP?
Explain the significance of the relationship between r and gn for fiscal policy and the levels of government debt, government borrowing and the government debt/GDP ratio.
Under what circumstances would a rise in the budget deficit not lead to a rise in government debt as a proportion of GDP?
Does Blanchard’s analysis suggest that a combination of both loose monetary policy and loose fiscal policy is desirable?
Under Blanchard’s analysis, what would limit the amount that governments should increase spending?
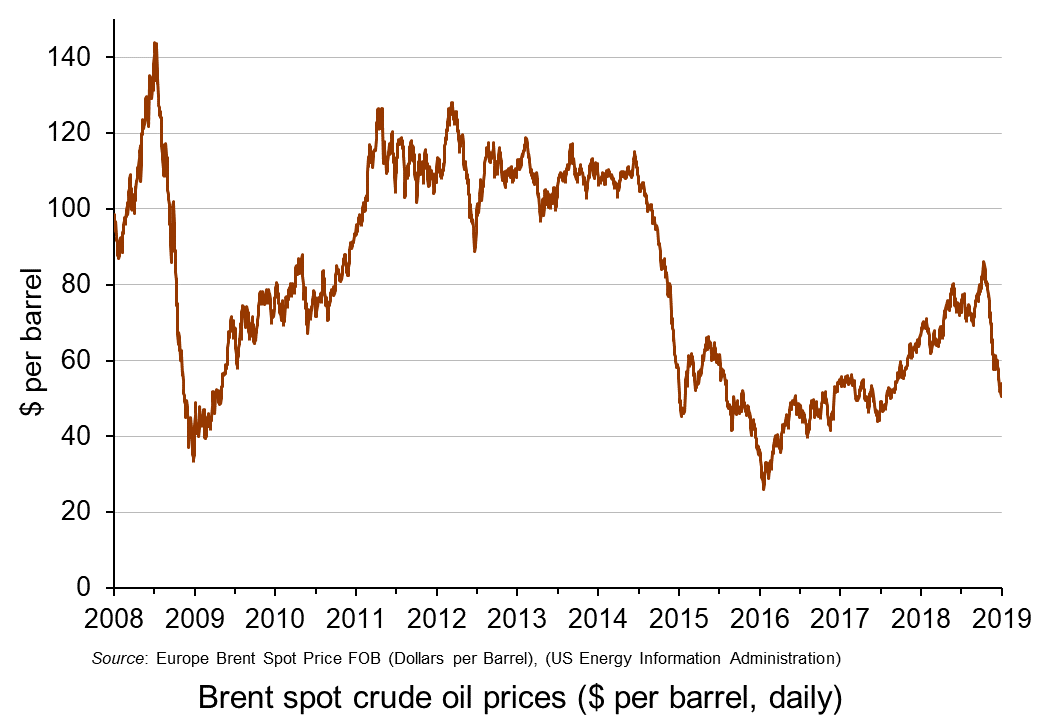
Back in October, we examined the rise in oil prices. We said that, ‘With Brent crude currently at around $85 per barrel, some commentators are predicting the price could reach $100. At the beginning of the year, the price was $67 per barrel; in June last year it was $44. In January 2016, it reached a low of $26.’ In that blog we looked at the causes on both the demand and supply sides of the oil market. On the demand side, the world economy had been growing relatively strongly. On the supply side there had been increasing constraints, such as sanctions on Iran, the turmoil in Venezuela and the failure of shale oil output to expand as much as had been anticipated.
But what a difference a few weeks can make!
Brent crude prices have fallen from $86 per barrel in early October to just over $50 by the end of the year – a fall of 41 per cent. (Click here for a PowerPoint of the chart.) Explanations can again be found on both the demand and supply sides.
On the demand side, global growth is falling and there is concern about a possible recession (see the blog: Is the USA heading for recession?). The Bloomberg article below reports that all three main agencies concerned with the oil market – the U.S. Energy Information Administration, the Paris-based International Energy Agency and OPEC – have trimmed their oil demand growth forecasts for 2019. With lower expected demand, oil companies are beginning to run down stocks and thus require to purchase less crude oil. Fracking (Source: US Bureau of Land Management Environmental Assessment, public domain image)
On the supply side, US shale output has grown rapidly in recent weeks and US output has now reached a record level of 11.7 million barrels per day (mbpd), up from 10.0 mbpd in January 2018, 8.8 mbpd in January 2017 and 5.4 mbpd in January 2010. The USA is now the world’s biggest oil producer, with Russia producing around 11.4 mpbd and Saudi Arabia around 11.1 mpbd.
Total world supply by the end of 2018 of around 102 mbpd is some 2.5 mbpd higher than expected at the beginning of 2018 and around 0.5 mbpd greater than consumption at current prices (the remainder going into storage).
So will oil prices continue to fall? Most analysts expect them to rise somewhat in the near future. Markets may have overcorrected to the gloomy news about global growth. On the supply side, global oil production fell in December by 0.53 mbpd. In addition OPEC and Russia have signed an accord to reduce their joint production by 1.2 mbpd starting this month (January). What is more, US sanctions on Iran have continued to curb its oil exports.
But whatever happens to global growth and oil production, the future price will continue to reflect demand and supply. The difficulty for forecasters is in predicting just what the levels of demand and supply will be in these uncertain times.
Workers in the UK and USA work much longer hours per year than those in France and Germany. This has partly to do with the number of days paid holiday per year, partly with the number of hours worked per day and partly with the number of days worked per week.
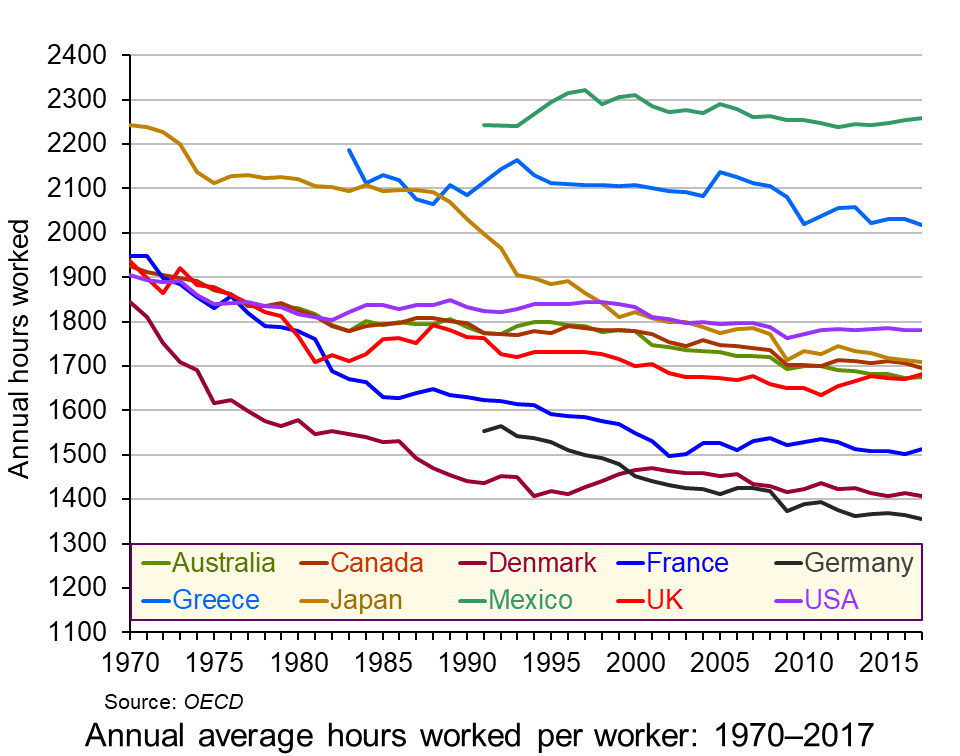
According to the latest OECD figures, in 2017 average hours worked per year ranged from 2257 in Mexico (the OECD’s highest) to 1780 in the USA, 1710 in Japan, 1681 in the UK, 1514 in France, 1408 in Denmark and 1356 in Germany (the OECD’s lowest). Annual working hours have been falling in most countries across the decades, as the chart shows. However, in most countries the process has slowed in recent years and in the UK, the USA and France working hours have begun to rise. (Click here for a PowerPoint of the chart.)
But why do working hours differ so much from country to country? How do they relate to productivity? How do they relate to human happiness and welfare more generally?
Causes of the differences
There are various reasons for the differences in hours worked between countries.
In a situation where individual workers can choose how many hours to work, they have to decide the best trade off for them between income and leisure. As wages rise over time, there will be substitution and income effects of these extra hourly wages. Higher wages make work more valuable in terms of what people can buy from an extra hour’s work. There is thus an incentive to substitute work for leisure and hence work longer. This is the substitution effect. On the other hand, higher wages allow people to work fewer hours for a given income. This is the income effect.
As incomes rise, generally the substitution effect will tend to decline relative to the income effect. This is because of the diminishing marginal utility of income. Richer people will tend to value a given rise in income less than poorer people and therefore will value the income from extra work less than poorer people. Richer people will prefer to work fewer hours than poorer people. Generally workers in richer OECD countries work fewer hours than those in poorer OECD countries.
But this does not explain why people in the USA, Canada, Japan and the UK work longer hours than people in Germany, Denmark, Norway, The Netherlands and France.
One possible explanation for these differences is the role of trade unions. These tend to be stronger in countries with lower working hours. Reducing the working week or obtaining longer holidays is one of the key objectives of unions.
Another is income distribution. The USA, despite its high average (mean) income, has a relatively unequal distribution of income compared with Germany or France. The post-tax-and-benefits Gini coefficient in the USA is around 0.39, whereas in Germany it is 0.29, meaning that Germany has a more equal distribution of disposable income than the USA. In fact, rises in real incomes in the USA over the past 10 years have gone almost exclusively to the top 10 per cent of earners, leaving the median income little changed. In fact median household income only rose above its 2007 (pre-recession) level in 2016.
Social and cultural explanations may also be important. People in countries with higher working hours relative to hourly wages may put a greater store on consumption relative to leisure. The desire to shop may be very strong. The ‘Anglo-Saxon’ economic model pursued by right-of-centre governments in English-speaking countries, such as the USA, Canada, Australia and the UK puts emphasis on low taxes, low regulation, low public expenditure and self-advancement. Such a model encourages a more individualistic approach to work, with more emphasis on earning money.
Then there is the attitude to hours worked generally. There is a saying that in the UK the last one to leave the office is seen as the hardest working, whereas in Germany the last one to leave is seen as the least efficient. Social pressures, from colleagues, family, friends and society more generally can have a major effect on people’s choices between work and leisure.
Productivity
Productivity, in terms of output per hour worked, tends to decline as workers work longer hours. People get tired and possibly bored and demotivated towards the end of a long day or week. If workers are paid by the output they produce and if productivity declines towards the end of the day, then the hourly wage would fall as the day progresses. This would act as a disincentive to work long hours. In practice, most workers are normally paid a constant rate per hour for normal-time working. For overtime, they may even be paid a higher rate, despite their likely lower productivity. This encourages them to work longer hours than if they were paid according to their marginal productivity.
Linking pay more closely to productivity could encourage people to opt for fewer hours (if they had the choice). Indeed some companies are now encouraging workers to choose their hours – which may mean fewer hours as people seek a better work–life balance. (See the BBC article below about PwC’s employment strategy.) Alternatively, some other employers adopt the system of giving workers a set amount of work to do and then they can leave work when it is finished. This acts as an incentive to work more efficiently.
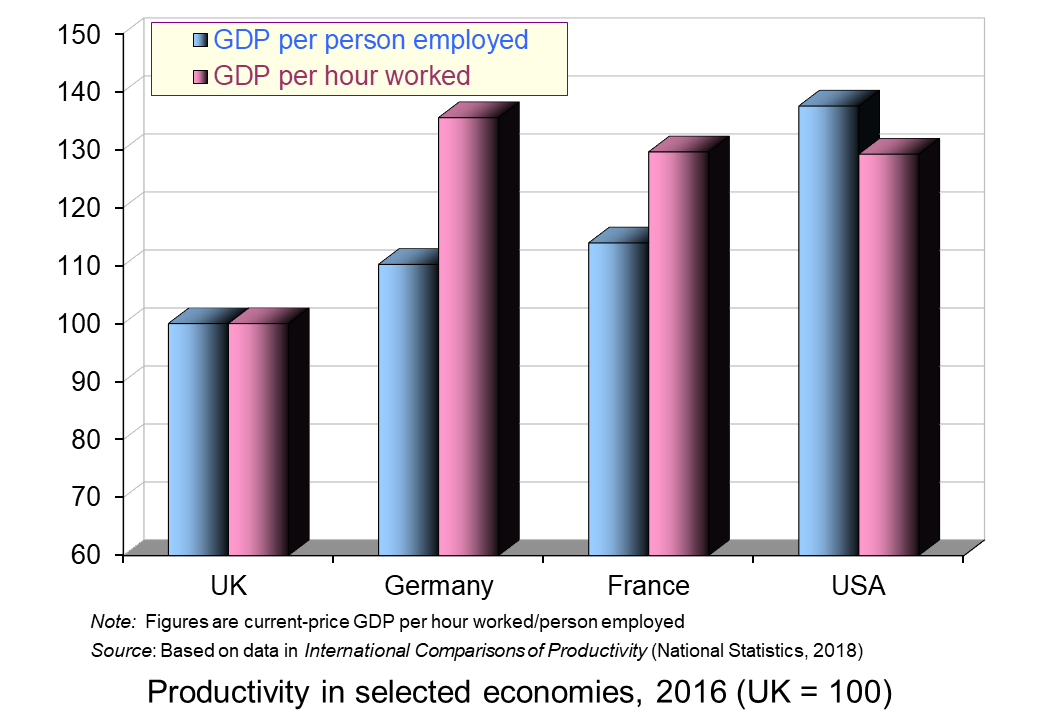
It is interesting that countries where workers work more hours per year tend to have a lower output per hour worked relative to output per worker than countries where workers work fewer hours. This is illustrated in the chart opposite. The USA, with its longer working hours, has higher output per person employed than France and Germany but very similar output per hour worked.
Hours and happiness
So are people who choose to work longer hours and take home more money likely to be happier than those who choose to work fewer hours and take home less money? If people were rational and had perfect knowledge, then they would choose the balance between work and leisure that best suited them.
In practice, labour markets are highly imperfect. People often do not have choices about the amount they work; they work the hours they are told. Even if they do have a choice, they are unlikely to have perfect knowledge about the impact of long hours on their health and happiness over their lifetime. They may not even be good judges of the shorter-term effects of more work and more pay. They may believe that more money will buy them more happiness only to find soon afterwards that they are wrong.
What factors are likely to encourage workers to work longer hours?
Give some examples of jobs where workers have flexibility in the amount of hours they work per week and jobs where the working week is of a fixed length.
For what reasons are annual working hours longer in the USA than in Germany?
Would it be in employers’ interests if the government legislated so as to reduce the maximum permitted working week? Explain.
What is meant by ‘efficiency wages’? How relevant is the concept to the issue of the average number of hours worked per year from country to country?
Explain why people in poorer countries tend to work more hours per year than people in richer countries.
If workers’ wages equalled their marginal revenue product, why might some workers choose to work more and others choose to work less (assuming they had a choice)?
Are jobs in the gig economy and zero-hour contract jobs in the interests of workers?
Is South Korea wise to cut its work limit from 68 hours a week to 52?
 The ‘Big 4’ supermarkets in the UK – Tesco, Sainsbury’s, Asda and Morrisons – have a 69.5% share of the Great Britain grocery market (see data link below). The next four – Aldi, Co-op, Lidl and Waitrose – have a 23.8% share. If two of the Big 4 were to merge, would there be a significant decline in competition? This is a question the Competition and Markets Authority (CMA) has been considering in the light of Sainsbury’s planned £7.3 billion takeover of Asda (owned by the US retailing giant, Walmart).
 And, with the growth in the German discounters, Aldi and Lidl, as well as competition from Waitrose, the Co-op, Marks & Spencer and Iceland, would there be any significant decline in competition and choice and a rise in prices?
 In response to the CMA’s findings, Sainsbury’s chief executive, Mike Coupe, claims that they focus too much on competition between the Big 4 and do not take into account competition from Lidl and Aldi, both of which are expending rapidly and now have a combined market share of 12.8% (compared with 10.7% two years ago).
 There was, however, a feeling that the world economic order is changing, with the rise in populism and with less certainty about the continuance of the model of freer trade and a model of capitalism modified by market intervention. There was also concern about the roles of the three major international institutions set up at the end of World War II: the IMF, the World Bank and the WTO (formerly the GATT). In a key speech, Angela Merkel urged countries not to abandon the world economic order that such institutions help to maintain. The world can only resolve disputes and promote development, she argued, by co-operating and respecting the role of such institutions.
  The World Bank was primarily set up to provide development finance to poorer countries. The General Agreement on Tariffs and Trade (GATT) and then the WTO were set up to encourage freer trade and to resolve trade disputes.
 With the UK parliament in Brexit gridlock, the Labour opposition is calling for a general election. Although its policy over Brexit and a second referendum is causing splits in the party, the Labour party is generally agreed that pubic expenditure on health, education and transport infrastructure needs to increase – that there needs to be an end to fiscal austerity. However, to fund extra public expenditure would require an increase in taxes and/or an increase in government borrowing.
 Back in October, we examined the
  Brent crude prices have fallen from $86 per barrel in early October to just over $50 by the end of the year – a fall of 41 per cent. (Click
 Workers in the UK and USA work much longer hours per year than those in France and Germany. This has partly to do with the number of days paid holiday per year, partly with the number of hours worked per day and partly with the number of days worked per week.
 Annual working hours have been falling in most countries across the decades, as the chart shows. However, in most countries the process has slowed in recent years and in the UK, the USA and France working hours have begun to rise. (Click
  Social and cultural explanations may also be important. People in countries with higher working hours relative to hourly wages may put a greater store on consumption relative to leisure. The desire to shop may be very strong. The
  Alternatively, some other employers adopt the system of giving workers a set amount of work to do and then they can leave work when it is finished. This acts as an incentive to work more efficiently.