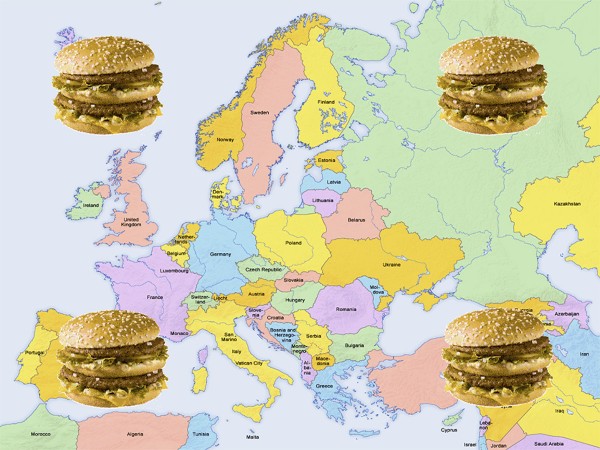
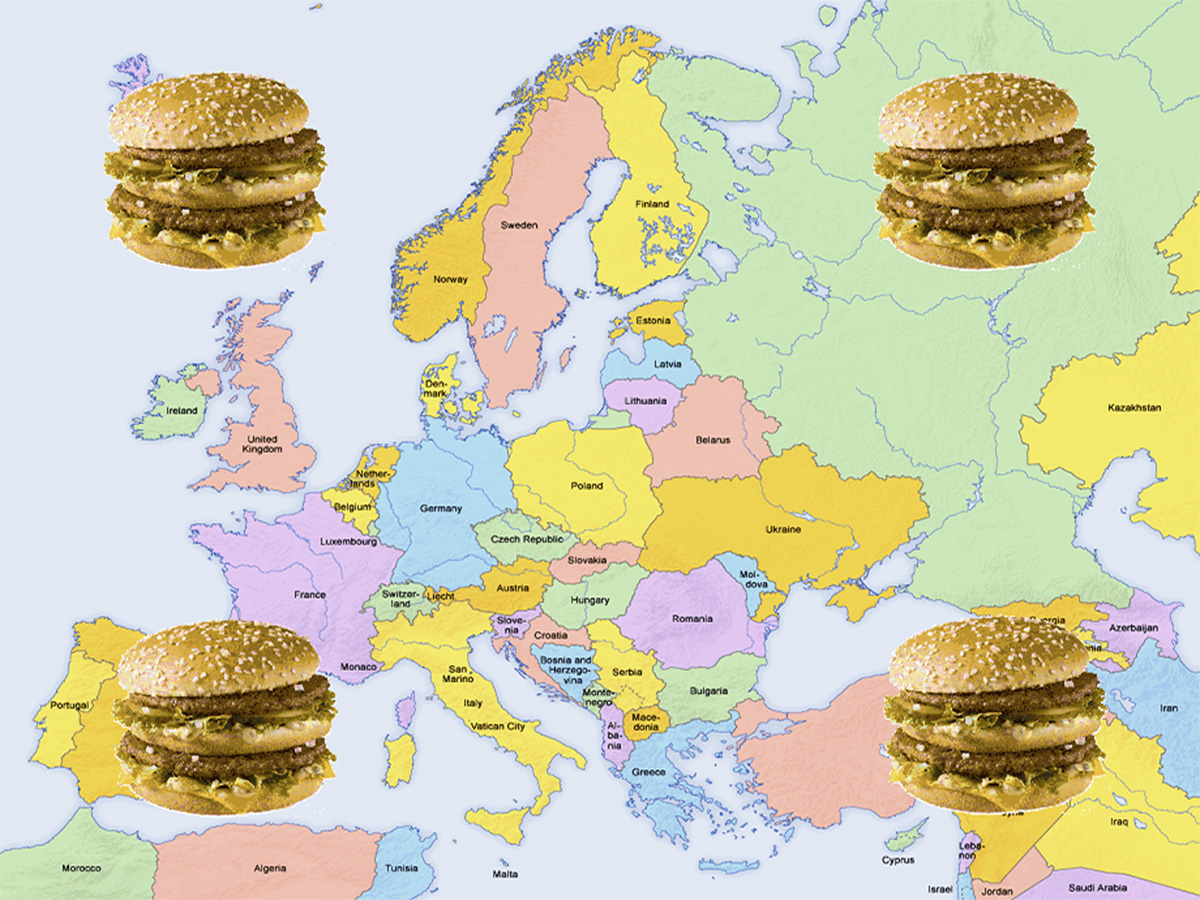
 At least once a year The Economist publishes its ‘hamburger standard’ exchange rates for currencies. It is a light-hearted attempt to see if currencies are exchanging at their purchasing-power parity rates. The test is the price at which a ‘Big Mac’ McDonald’s hamburger sells in different countries!
According to this simplified version of the purchasing-power parity theory, exchange rates should adjust so that a Big Mac costs the same in dollars everywhere (see Economics 8th edition Box 25.4).
These Big Mac exchange rates can be used to compare various prices and incomes between countries. The article linked below from The Guardian compares minimum wages between European countries in Big Mac terms.
There are 25 countries across Europe which have minimum wages. A clear pattern of minimum wage rates can be seen: although actual exchange rates understate the purchasing power of incomes in poorer European countries compared to richer ones, minimum wages, even in purchasing-power standard terms, are still higher in the richer countries.
Luxembourg’s minimum wage buys you just about three Big Macs in an hour, while most of northern Europe (and France) between 2–2.5 Big Macs. Moving south, the minimum wage nets about one Big Mac an hour. As we progress east, it begins to cost more than an hour of work on the minimum wage in order to afford a Big Mac.
Of course, there are other factors determining the dollar price of a Big Mac other than the failure of exchange rates to reflect purchasing-power parities. Nevertheless, using the Big Mac index in this way does give a useful preliminary snap shot of differences in what minimum wages can buy in different countries.
Articles
Comparing the minimum wage across Europe using the price of a Big Mac The Guardian datablog, Alberto Nardelli (25/9/14)
Minimum wage statistics Eurostat (Sept/14)
Data
Earnings Database Eurostat
Questions
- What is meant by ‘purchasing-power parity exchange rates’?
- Why may actual exchange rates not accurately reflect the purchasing power of currencies within countries?
- Using the link to Eurostat article above, compare Big Mac minimum wages with (a) actual minimum wages and (b) minimum wages expressed in purchasing-power standard terms.
- Using the links to the Eurostat article and Eurostat data, describe how the proportion of employees earning minimum wages varies across European countries. What factors determine this proportion?
- Using the same links, describe how the monthly minimum wage as a proportion of average monthly earnings varies across European countries. Explain these differences.
 Economic journalists, commentators and politicians have been examining the possible economic effects of a Yes vote in the Scottish independence referendum on 18 September. For an economist, there are two main categories of difficulty in examining the consequences. The first is the positive question of what precisely will be the consequences. The second is
  the normative question of whether the likely effects will be desirable or undesirable and how much so.
The first question is largely one of ‘known unknowns’. This rather strange term was used in 2002 by Donald Rumsfeld, US Secretary of Defense, in the context of intelligence about Iraq. The problem is a general one about forecasting the future. We may know the types of thing that are likely happen, but the magnitude of the outcome cannot be precisely known because there are so many unknowable things that can influence it.
Here are some known issues of Scottish independence, but with unknown consequences (at least in precisely quantifiable terms). The list is certainly not exhaustive and you could probably add more questions yourself to the list.
|
|
| • |
Will independence result in lower or higher economic growth in the short and long term? |
| • |
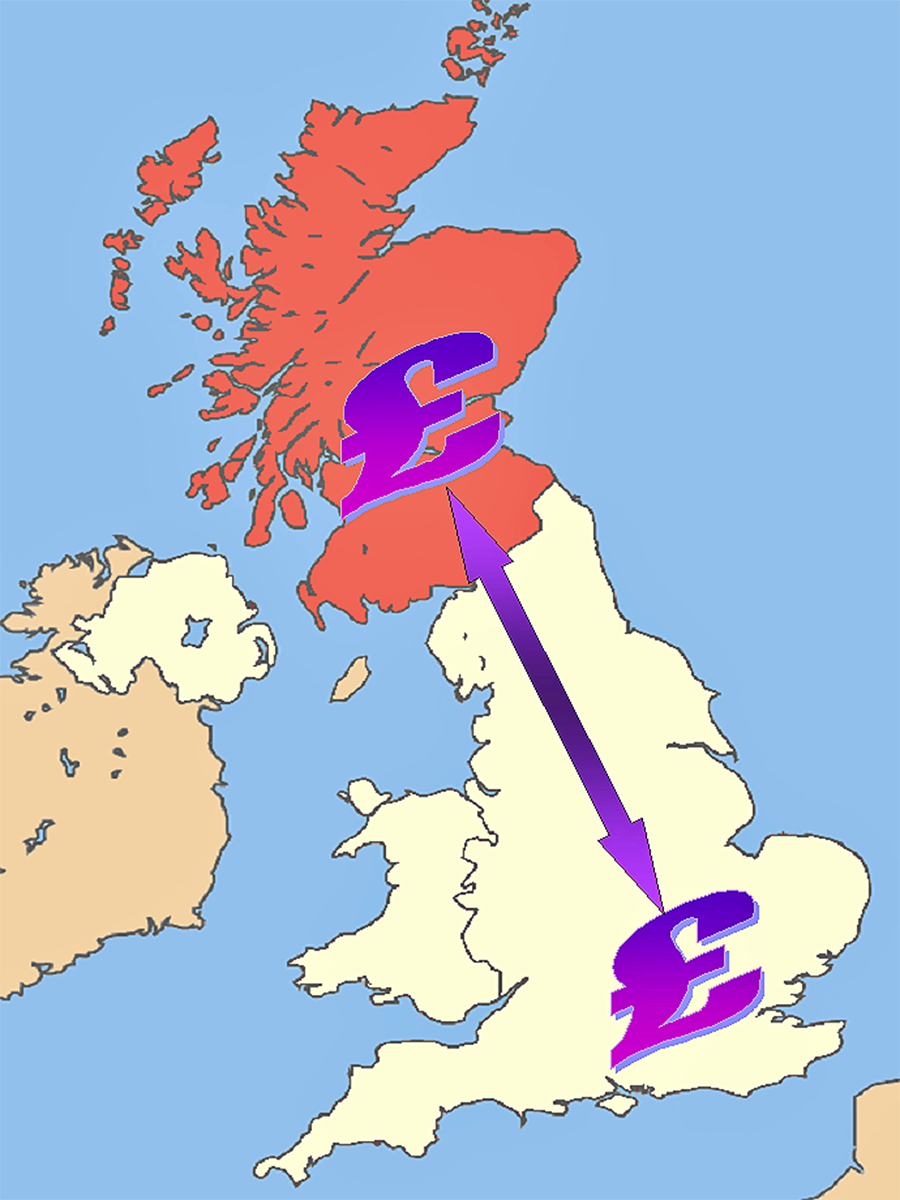
Will there be a currency union, with Scotland and the rest of the UK sharing the pound and a central bank? Or will Scotland merely use the pound outside a currency union? Would it prefer to have its own currency or join the euro over the longer term? |
| • |
What will happen to the sterling exchange rate with the dollar, the euro and various other countries? |
| • |
How will businesses react? Will independence encourage greater inward investment in Scotland or will there be a net capital outflow? And either way, what will be the magnitude of the effect? |
| • |
How will assets, such as oil, be shared between Scotland and the rest of the UK? And how will national debt be apportioned? |
| • |
How big will the transition costs be of moving to an independent Scotland? |
| • |
How will independence impact on Scottish trade (a) with countries outside the UK and (b) with the rest of the UK? |
| • |
What will happen about Scotland’s membership of the EU? Will other EU countries, such as Spain (because of its concerns about independence movements in Catalonia and the Basque country), attempt to block Scotland remaining in or rejoining the EU? |
| • |
What will happen to tax rates in Scotland, with the new Scottish government free to set its own tax rates? |
| • |
What will be the consequences for Scottish pensions and the Scottish pensions industry? |
| • |
What will happen to the distribution of income in Scotland? How might Scottish governments behave in terms of income redistribution and what will be its consequences on output and growth? |
Of course, just because the effects cannot be known with certainty, attempts are constantly being made to quantify the outcomes in the light of the best information available at the time. These are refined as circumstances change and newer data become available.
 But forecasts also depend on the assumptions made about the post-referendum decisions of politicians in Scotland, the rest of the UK and in major trading partner countries. It also depends on assumptions about the reactions of businesses. Not surprisingly, both sides of the debate make assumptions favourable to their own case.
Then there is the second category of question. Even if you could quantify the effects, just how desirable would they be? The issue here is one of the weightings given to the various costs and benefits. How would you weight distributional consequences, given that some people will gain or lose more than others? What social discount rate would you apply to future costs and benefits?
Then there are the normative and largely unquantifiable costs and benefits. How would you assess the desirability of political consequences, such as greater independence in decision-making or the break-up of a union dating back over 300 years? But these questions about nationhood are crucial issues for many of the voters.
Articles
Scottish Independence would have Broad Impact on UK Economy NBC News, Catherine Boyle (9/9/14)
Scottish independence: the economic implications The Guardian, Angela Monaghan (7/9/14)
Scottish vote: Experts warn of potential economic impact BBC News, Matthew Wall (9/9/14)
The economics of Scottish independence: A messy divorce The Economist (21/2/14)
Dispute over economic impact of Scottish independence Financial Times, Mure Dickie, Jonathan Guthrie and John Aglionby (28/5/14)
10 economic benefits for a wealthier independent Scotland Michael Gray (6/3/14)
Scottish independence, UK dependency New Economics Foundation (NEF), James Meadway (4/9/14)
Scottish Jobs and the World Economy Scottish Economy Watch, Brian Ashcroft (25/8/14)
Scottish yes vote: what happens to the pound in your pocket? Channel 4 News (9/9/14)
What price Scottish independence? BBC News, Robert Peston (12/9/14)
What price Scottish independence? BBC News, Robert Peston (7/9/14)
Economists can’t tell Scots how to vote BBC News, Robert Peston (16/9/14)
Books and Reports
The Economic Consequences of Scottish Independence Scottish Economic Society and Helmut Schmidt Universität, David Bell, David Eiser and Klaus B Beckmann (eds) (August 2014)
The potential implications of independence for businesses in Scotland Oxford Economics, Weir (April 2014)
Questions
- What is a currency union? What implications would there be for Scotland being in a currency union with the rest of the UK?
- If you could measure the effects of independence over the next ten years, would you treat £1m of benefits or costs occurring in ten years’ time the same as £1m of benefits and costs occurring next year? Explain.
- Is it inevitable that events occurring in the future will at best be known unknowns?
- If you make a statement that something will occur in the future and you turn out to be wrong, was your statement a positive one or a normative one?
- What would be the likely effects of Scottish independence on the current account of the balance of payments (a) for Scotland; (b) for the rest if the UK?
- How does inequality in Scotland compare with that in the rest of the UK and in other countries? Why might Scottish independence lead to a reduction in inequality? (See the chapter on inequality in the book above edited by David Bell, David Eiser and Klaus B Beckmann.)
- One of the problems in assessing the arguments for a Yes vote is uncertainty over what would happen if there was a majority voting No. What might happen in terms of further devolution in the case of a No vote?
- Why is there uncertainty over the amount of national debt that would exist in Scotland if it became independent?
 The latest balance of payments data for the UK show that in the final two quarters of 2013 the current account deficit as a percentage of GDP was the highest ever recorded. In quarter 3 it was 5.6% of GDP and in quarter 4 it was 5.4% of GDP. The previous highest quarterly figures were 5.3% in 1988 Q4 and 5.2% in 1989 Q3. The average current account deficit from 1960 to 2013 has been 1.1% of GDP and from 1980 to 2013 has been 1.6% of GDP.
The current account has four major components: the balance on goods, the balance on services, the balance on current transfers and the balance on income flows (e.g. investment income). The chart below shows the annual balances of each of these components, plus the overall current account balance, from 1960 to 2013.
There are large differences in the balances of these four and the differences seem to be widening. (Click here for a PowerPoint of the chart.)
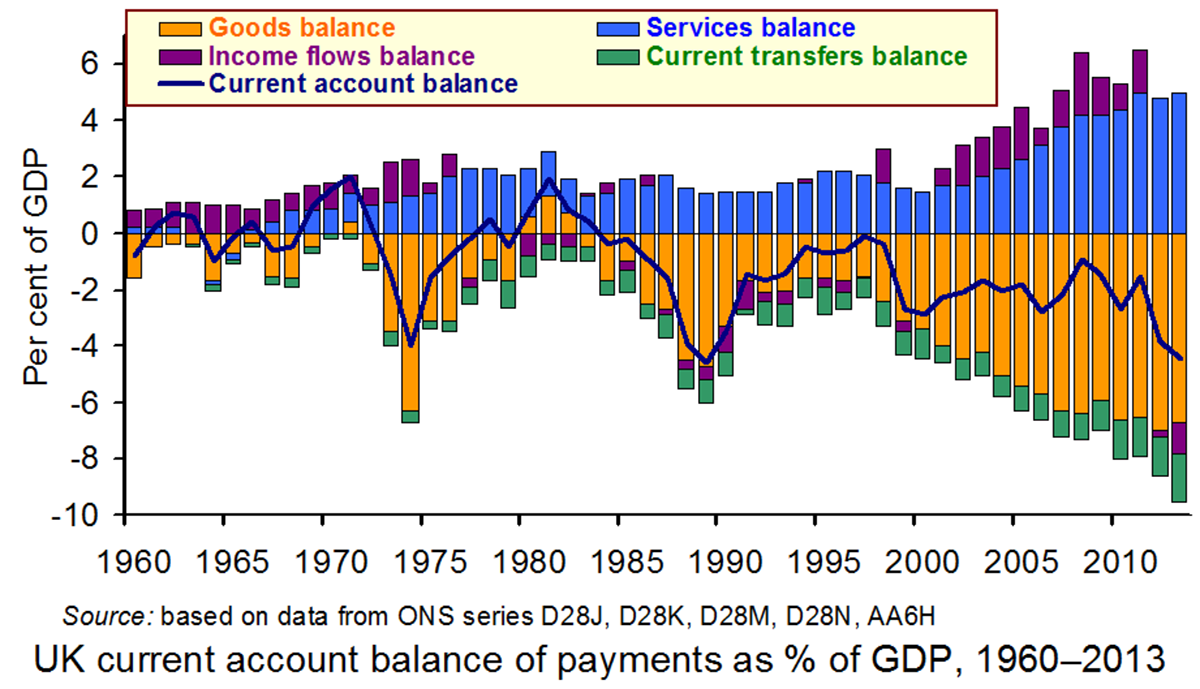
Traditionally the balance on goods has been negative. In 2013 Q3 the deficit on goods reached a record 7.3% of GDP. It fell back somewhat in Q4 to 6.5%, still significantly above the average since 2000 of 5.5%. With the economy still recovering slowly, it would normally be expected that the trade deficit would be low. However, the high exchange rate has made it difficult for UK exporters to compete. Also with consumer confidence returning, imports are rising, again boosted by the high exchange rate, which makes imports cheaper.
The services balance, by contrast, is typically in surplus. In the final two quarters of 2013, the surpluses were 4.9% and 5.1% of GDP respectively. These compare with an average of 3.3% since 2000. It seems that the service sector, which includes banking, insurance, consultancy, advertising, accountancy, law, etc., is much more able to compete in a global environment.
The balance of current transfers to and from such bodies as the EU and UN have traditionally been negative, although as a proportion of GDP this has gradually widened in recent years. In 2013 the deficit was 1.7% compared with an average of 1.0% since 2000.
 The most dramatic change has been in income flows and particularly those from investment. Before the crash in late 2008, the returns to many of the risky investments abroad made by UK financial institutions were very high. Income flows in the 12 months 2007 Q4 to 2008 Q3 averaged a surplus of 2.8% of GDP. They stayed positive, albeit at lower levels, until 2012 Q1, but then became negative as UK institutions reduced their exposure to overseas investments and as earnings in the UK by overseas investors increased. In the last two quarters of 2013, the deficits on income flows were 1.4% and 2.5% of GDP respectively.
How do these figures accord with the Chancellor’s desire to rebalance the economy towards exports? In terms of services, the export performance is good. In terms of goods, however, exports actually fell in the last two quarters from £78.4bn to £74.8bn. Although imports fell too in the final quarter, there is a danger that, with recovery and a high pound, these could begin to rise rapidly
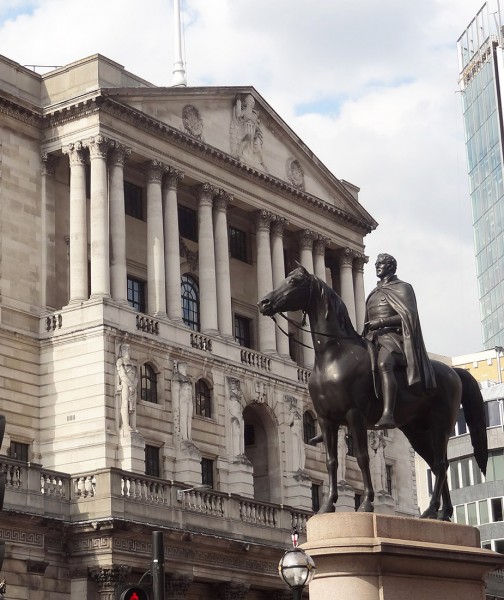 So should the Bank of England attempt to bring the sterling exchange rate down? After all, the exchange rate index has risen from 79.1 in March 2013 to 85.9 in February 2014 (an appreciation of 8.6%). But if it did want to do so, what could it do? The traditional methods of reducing Bank rate and increasing the money supply are not open to it at the present time: Bank rate, at 0.5%, is already about as low as it could go and the Bank has ruled out any further quantitative easing.
The articles consider the latest balance of payments figures and their implications for the economy and for economic policy
Articles
UK current account deficit far bigger than forecast The Guardian, Katie Allen (28/3/14)
UK current account deficit near record high at £22.4bn BBC News (28/3/14)
UK current account gap second widest on record The Telegraph, Szu Ping Chan (28/3/14)
When will the UK pay its way? BBC News, Robert Peston (28/3/14)
Current account deficit crisis creeping up on UK can no longer be ignored The Guardian, Larry Elliott (30/3/14)
Data
Balance of Payments, Q4 and annual 2013 ONS (28/3/14)
Statistical Interactive Database – interest & exchange rates data Bank of England
Questions
- If the current account is in deficit, how is the overall balance of payments in balance (i.e. is in neither deficit nor surplus)?
- If the current account is in record deficit, why has sterling appreciated over recent months? What effect is this appreciation likely to have on the balance on trade in goods and services?
- Why has the balance on investment income deteriorated? In what ways could this be seen as a ‘good thing’?
- To what extent do the balance of payments figures show a rebalancing of the economy in the way the Chancellor would like?
- What could the Bank of England do to bring about a depreciation of sterling?
- What would be the benefits and costs of a depreciation of sterling?
- Why do investors overseas seem so willing to lend to the UK, thereby producing a large surplus on the financial account?
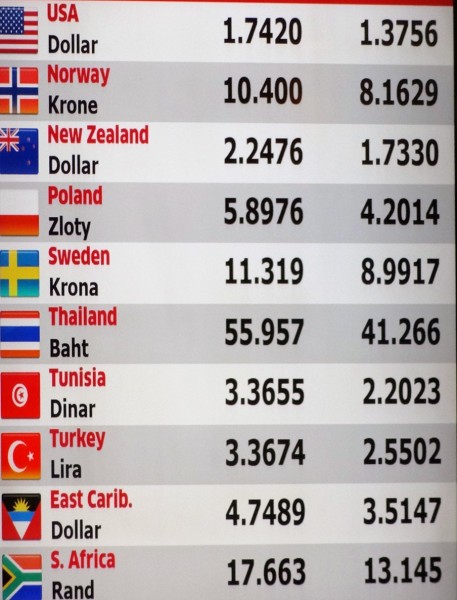 According to latest evidence from the Bank for International Settlements, in April 2013 some £3.2 trillion ($5.3 trillion) of foreign exchange was traded daily on global foreign exchange (forex) markets. About 40% of forex dealing goes through trading rooms in London. This market is highly profitable for the UK economy. But all is not well with the way people trade. There is a scandal about rate fixing.
Exchange rates on the forex market are freely determined by demand and supply and fluctuate second by second, 24 hours a day, except for weekends. Nevertheless, once a day rates are fixed for certain trades. At 4pm GMT a set of reference rates is set for corporate customers by banks and other traders. The rates are set at the free market average over the one minute from 16:00 to 16:01. The allegation is that banks have been colluding, through text messaging and chat rooms, to manipulate the market over that one minute.
Since the early summer of 2013, the Financial Conduct Authority (FCA) in the UK, along with counterparts in the USA, Switzerland, Hong Kong and elsewhere, has been looking into these allegations. Last week (4/3/14), the Bank of England suspended a member of its staff as part of its own investigation into potential rigging of the foreign exchange market. The allegation is not that the staff member(s) were involved in the rigging but that they might have known about it.The Bank said that, “An oversight committee will lead further investigations into whether bank officials were involved in forex market manipulation or were aware of manipulation, or at least the potential for such manipulation.”
Meanwhile, the House of Commons Treasury Select Committee has been questioning Bank of England staff, including the governor, Mark Carney, about the scandal. Speaking to the Committee, Martin Wheatley, head of the FCA said that the investigation over rigging had been extended to 10 banks and that the allegations are every bit as bad as they have been with Libor.
Forex rigging ‘as serious as’ Libor scandal: Carney Yahoo News, Roland Jackson (11/2/14)
Forex manipulation: How it worked HITC (Here Is The City), Catherine Boyle (11/3/14)
Bank of England Chief Grilled Over Forex Scandal ABC News, Danica Kirka (11/3/14)
Carney Faces Grilling as Currency Scandal Snares BOE Bloomberg, Scott Hamilton and Suzi Ring (10/3/14)
UK financial body urges quick action over foreign exchange ‘fixing’ Reuters, Huw Jones (11/3/14)
Timeline -The FX “fixing” scandal Reuters, Jamie McGeever (11/3/14)
Forex in the spotlight Financial Times (16/2/14)
Forex scandal: What is that all about? BBC News (11/3/14)
 Bank of England in shake-up after rate manipulation criticism BBC News (11/3/14)
Mark Carney faces Forex questions from MPs BBC News, Hugh Pym (11/3/14)
Bank of England’s Paul Fisher: ‘It’s not our job to go hunting for market wrongdoing’ Independent, Russell Lynch , Ben Chu (11/3/14)
Questions
- For what reasons would sterling appreciate against the dollar?
- Most of forex trading is for speculative purposes, rather than for financing trade or investment. Why is this and does it benefit international trade?
- If foreign exchange rates fluctuate, is it not a good thing that banks collude to agree the 4pm fixed rate? Explain.
- What was the Libor scandal? Why are some people arguing that the current forex scandal is worse?
- What can the FCA do to prevent collusion over exchange rates?
 One of the reasons why it is so hard to forecast economic growth and other macroeconomic indicators is that economies can be affected by economic shocks. Sometimes the effects of shocks are large. The problem with shocks is that, by their very nature, they are unpredictable or hard to predict.
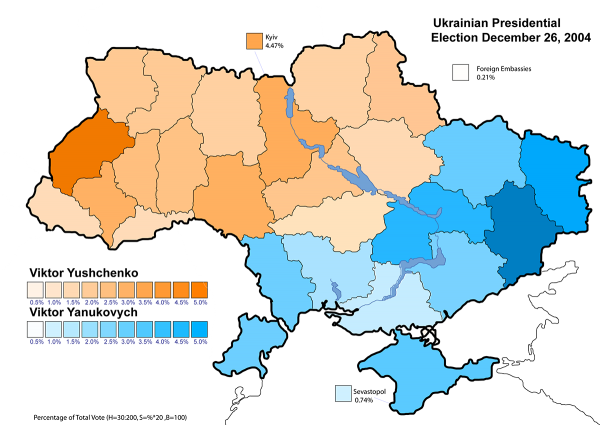
A case in point is the current crisis in Ukraine. First there was the uprising in Kiev, the ousting of President Yanukovich and the formation of a new government. Then there was the seizing of the Crimean parliament by gunmen loyal to Russia. The next day, Saturday March 1, President Putin won parliamentary approval to invade Ukraine and Russian forces took control of the Crimea.
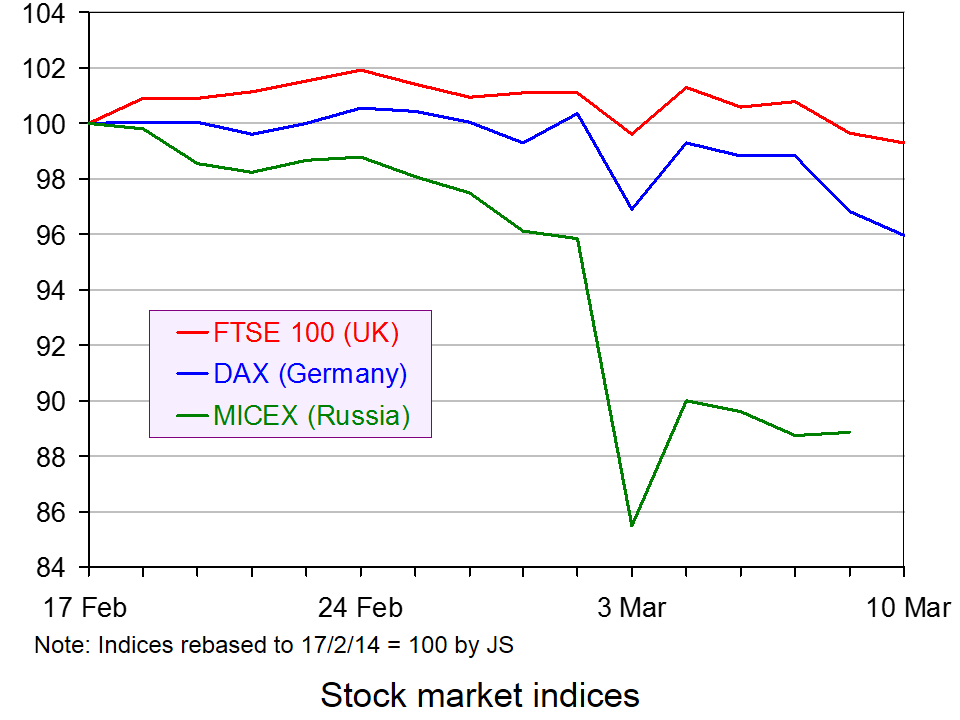 On Monday 3 March, stock markets fell around the world. The biggest falls were in Russia (see chart). In other stock markets, the size of the falls was directly related to the closeness of trade ties with Russia. The next day, with a degree of calm descending on the Crimea and no imminent invasion by Russia of other eastern parts of Ukraine, stock markets rallied.
What will happen to countries’ economies depends on what happens as the events unfold. There could be a continuing uneasy peace, with the West effectively accepting, despite protests, the Russian control of the Crimea. But what if Russia invades eastern Ukraine and tries to annex it to Russia or promote its being run as a separate country? What if the West reacted strongly by sending in troops? What if the reaction were simply sanctions? That, of course would depend on the nature of those sanctions.
Some of the possibilities could have serious effects on the world economy and especially the Russian economy and the economies of those with strong economic ties to Russia, such as those European countries relying heavily on gas and oil imports from Russia through the pipeline network.
Economists are often criticised for poor forecasts. But when economic shocks can have large effects and when they are hard to predict by anyone, not just economists, then it is hardly surprising that economic forecasts are sometimes highly inaccurate.
What Wall Street is watching in Ukraine crisis USA Today (3/3/14)
Ukraine’s economic shock waves – magnitude uncertain Just Auto, Dave Leggett (7/3/14)
Ukraine: The end of the beginning? The Economist (8/3/14)
Russia will bow to economic pressure over Ukraine, so the EU must impose it The Guardian, Guy Verhofstadt (6/3/14)
Russia paying price for Ukraine crisis CNN Money, Mark Thompson (6/3/14)
Ukraine Crimea: Russia’s economic fears BBC News, Nikolay Petrov (7/3/14)
How Russia’s conflict with Ukraine threatens vital European trade links The Telegraph, Szu Ping Chan (8/3/14)
Will a Russian invasion of Ukraine push the west into an economic war? Channel 4 News, Paul Mason (2/3/14)
Who loses from punishing Russia? BBC News, Robert Peston (4/3/14)
Should Crimea be leased to Russia? BBC News, Robert Peston (7/3/14)
The Ukraine Economic Crisis Counter Punch, Jack Rasmus (7-9/3/14)
UK price rise exposes failure to prepare for food and fuel shocks The Guardian, Phillip Inman (2/3/14)
Questions
- What sanctions could the West realistically impose on Russia?
- How would sanctions against Russia affect (a) the Russian economy and (b) the economies of those applying the sanctions?
- Which industries would be most affected by sanctions against Russia?
- Is Russia likely to bow to economic pressure from the West?
- Should Crimea be leased to Russia?
- Is the behaviour of stock markets a good indication of people’s expectations about the real economy?
- Identify some other economic shocks (positive and negative) and their impact.
- Could the financial crisis of 2007/8 be described as an economic shock? Explain.
 At least once a year The Economist publishes its ‘hamburger standard’ exchange rates for currencies. It is a light-hearted attempt to see if currencies are exchanging at their purchasing-power parity rates. The test is the price at which a ‘Big Mac’ McDonald’s hamburger sells in different countries!