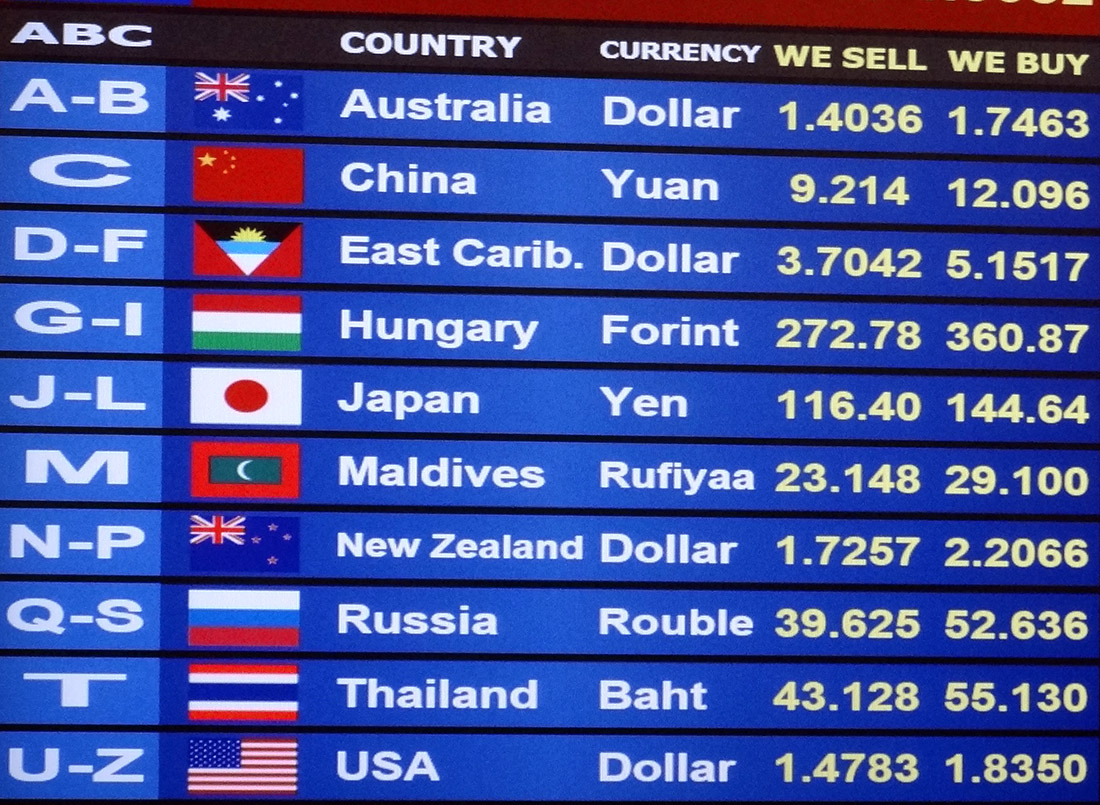
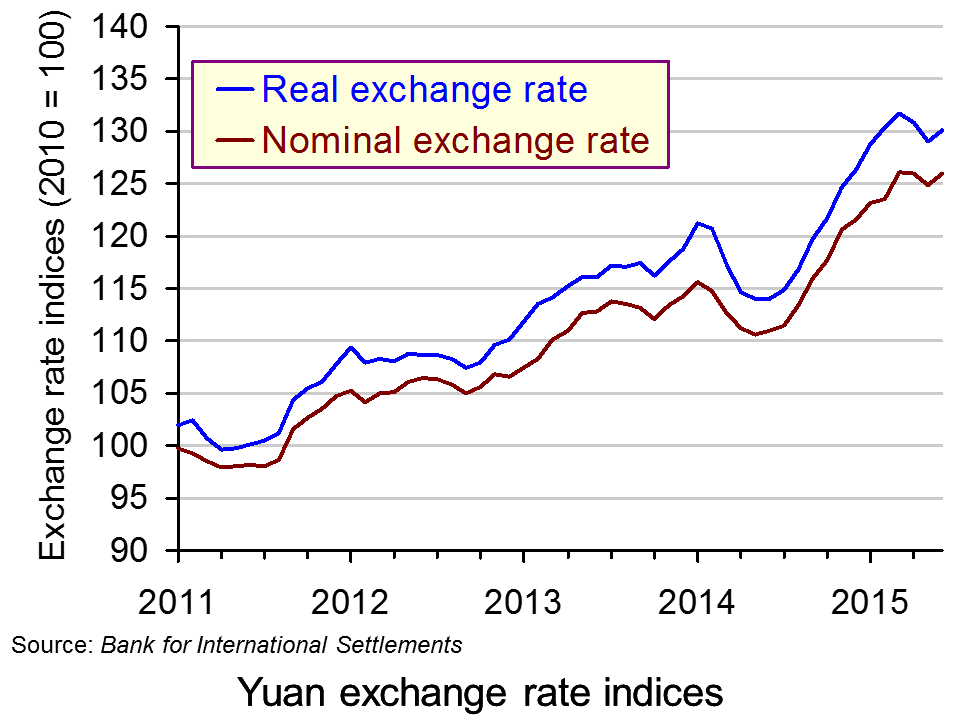
 On August 11th, China devalued its currency, the yuan, by 1.9%. The next day it devalued it by a further 1.6% and on the next day by a further 1.1%. Even though the total devaluation was relatively small, especially given a much bigger revaluation over the previous three years (see chart below), traders in world markets greeted the news with considerable pessimism. Stock markets around the world fell. For example, the US Dow Jones was down by 1.1%, the FTSE 100 was down by 2.5% and the German DAX by 5.8%.
There are three major concerns of investors about the devaluation. The first is that a weaker yuan will make other countries’ exports more expensive in China, thereby making it harder to export to China. At the same time Chinese imports into the rest of the world will be cheaper, thereby making it harder for domestic producers to compete with Chinese imports.
 The second is that cheaper Chinese imports will put downward pressure on prices at a time when inflation rates in the major economies are already below target rates. The fear of deflation has not gone away and this further deflationary twist will intensify such fears and possibly dampen demand.
The third is that the devaluation is taken as a sign that the Chinese authorities are worried about a slowing Chinese economy and are using the devaluation to boost Chinese exports. The rapidly expanding Chinese economy has been one of the major motors of the global economy in recent years and hence a slowing Chinese economy is cause for serious concern at a time when the global economy is still only very slowly recovering from the shock of the financial crisis of 2007–8
But just how worried should the rest of the world be about the falling yuan? And will it continue to fall, or could this be seen as a ‘one-off’ correction? What effect will it have on the macroeconomic policies of the USA, the eurozone and other major countries/regions? The following articles analyse Chinese policy towards its currency and the implications for the rest of the world.
China weakens yuan for a third straight day on Thursday CNBC, Nyshka Chandran (13/8/15)
Markets reel as investors fear worst of Chinese slowdown is yet to come The Telegraph, Peter Spence (12/8/15)
China cannot risk the global chaos of currency devaluation The Telegraph, Ambrose Evans-Pritchard (12/8/15)
Beware a China crisis that could crash down on us all The Telegraph, Liam Halligan (15/8/15)
The curious case of China’s currency The Economist, Buttonwood’s notebook (11/8/15)
China’s yuan currency falls for a second day BBC News (12/8/15)
China slowdown forces devaluation BBC News, Robert Peston (11/8/15)
What the yuan devaluation means around the world BBC News, Lerato Mbele, Daniel Gallas and Yogita Limaye (12/8/15)
 China allows yuan currency to drop for third day BBC News, various reporters (13/8/15)
The Guardian view on global currencies: it’s the economy, stupid The Guardian, Editorial (14/8/15)
China’s currency gambit and Labour’s debate about quantitative easing: old and new ways to cope with economic crisis The Guardian, Paul Mason (16/8/15)
Questions
- By what percentages have the nominal and real yuan exchange rate indices appreciated since the beginning of 2011? Use data from the Bank for International Settlements.
- Explain the difference between nominal and real exchange rate indices.
- Compare the changes in the yuan exchange rate indices with that of the yuan/dollar exchange rate (see Bank of England Interactive Database). Explain the difference.
- How is the yuan exchange rate with other currencies determined?
- How have the Chinese authorities engineered a devaluation of the yuan? To what extent could it be described as a ‘depreciation’ rather than a ‘devaluation’?
- Why have world stock markets reacted so negatively to the devaluation?
- Why, in global terms, is the devaluation described as deflationary?
- How much should the rest of the world be worried by the devaluation of the yuan?
- Explain the statement by Robert Peston that ‘Beijing has done the monetary tightening that arguably the US economy needs’.
- Comment on the following statement by Stephen King of HSBC (see the second Telegraph article below): ‘The world economy is sailing across the ocean without any lifeboats to use in case of emergency.’
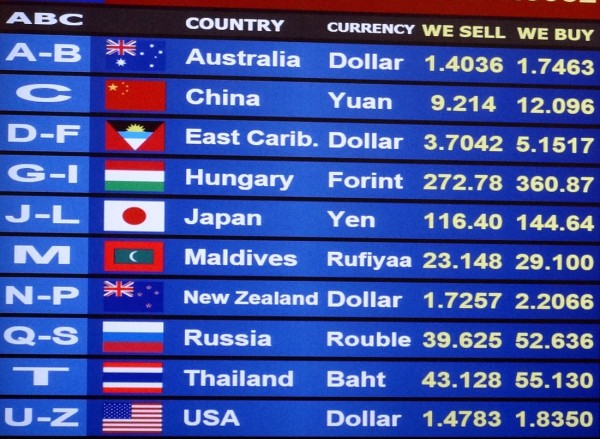 With an election approaching in the UK, uncertainty is a term we will hear frequently over the next few weeks. Until we know which party or parties will be in power and hence which policies will be implemented, planning anything is difficult. This is just one of the factors that has caused the British pound sterling to fall last week by 2% to an almost five year low against the dollar.
In the last election, uncertainty also prevailed and continued even after the election before the Coalition was formed. Given how close this election appears to be at present, another Coalition may have to be formed and this is adding to the current election uncertainty. A currency strategist at Standard Bank said:
“A $1.40 level for sterling/dollar is certainly not out of reach if the election aftermath turns ugly”
With such uncertainty, investors are refraining from putting their money into the UK and this has contributed towards the deprecation of the British pound against the dollar.
Another factor adding to this downward pressure on the pound is the latest data on industrial output. Although economic growth figures for the UK in 2014 were very positive, there are some suggestions that 2015 will not be as good as expected, though still a strong performance. The first quarter data will not be available until just before the election, but data from the ONS on industrial output shows very minimal growth at just 0.1% from January to February. Chris Williams at Markit said:
“Clearly this all bodes ill for economic growth in the opening quarter of the year. It’s now looking like the economy slowed, and possibly quite markedly, compared to the 0.6% expansion seen in the closing quarter of 2014 … The trend should improve in March, however, according to survey data.”
These two factors have combined to push the pound down, with investors preferring to hold their money in dollars, despite the weak US unemployment data. However, it is not only against the dollar that we must consider sterling’s performance. Against the euro, it has performed better, rising by 1.5%. Whether this is positive for the UK or very negative for the Eurozone is another question. The following articles consider the performance of the British pound.
Sterling falls to five-year low Financial Times, Neil Dennis (10/4/15)
Sterling plummets to five year low as economic slowdown looms The Telegraph, Mehreen Khan (10/4/15)
Pound at five-year low against dollar on weak output BBC News (10/4/15)
Sterling falls after Bank of England’s Haldane says even chances of rate cut or rise Reuters (10/4/15)
Pound falls to five-year low as volatility jumps before election Bloomberg, Anooja Debnath and David Goodman (11/4/15)
Pound falls to a five-year low against the dollar as polls suggest election will create economic uncertainty Mail Online, Matt Chorley (10/4/15)
Questions
- Draw a diagram illustrating the way in which the $/£ exchange rate is determined.
- Explain why the election is causing economic uncertainty in the UK.
- How would uncertainty affect the demand and supply of sterling and hence the exchange rate?
- US job data is worse than expected. Shouldn’t this have caused the dollar to depreciate against the pound and not appreciate?
- Industrial output data for the UK economy is lower than expected. What has caused this?
- Why does slower growth in industrial output cause the exchange rate to depreciate?
- In order to keep the UK’s inflation rate on target, Haldane has said that we could expect a cut or rise in interest rates and policy should be prepared for both. How has this affected the exchange rate?
- Are there any advantages of having a lower pound?
 Many important economic changes have occurred over the past two years and many have occurred in the past two months. Almost all economic events create winners and losers and that is no different for the Russian economy and the Russian population.
There is an interesting article plus videos on the BBC News website (see link below), which consider some of the economic events that, directly or indirectly, have had an impact on Russia: the fall in oil prices; the conflict between Russia and the Ukraine; the fall in the value of the rouble (see chart); the sanctions imposed by the West.
Clearly there are some very large links between events, but an interesting question concerns the impact they have had on the everyday Russian consumer and business. Economic growth in 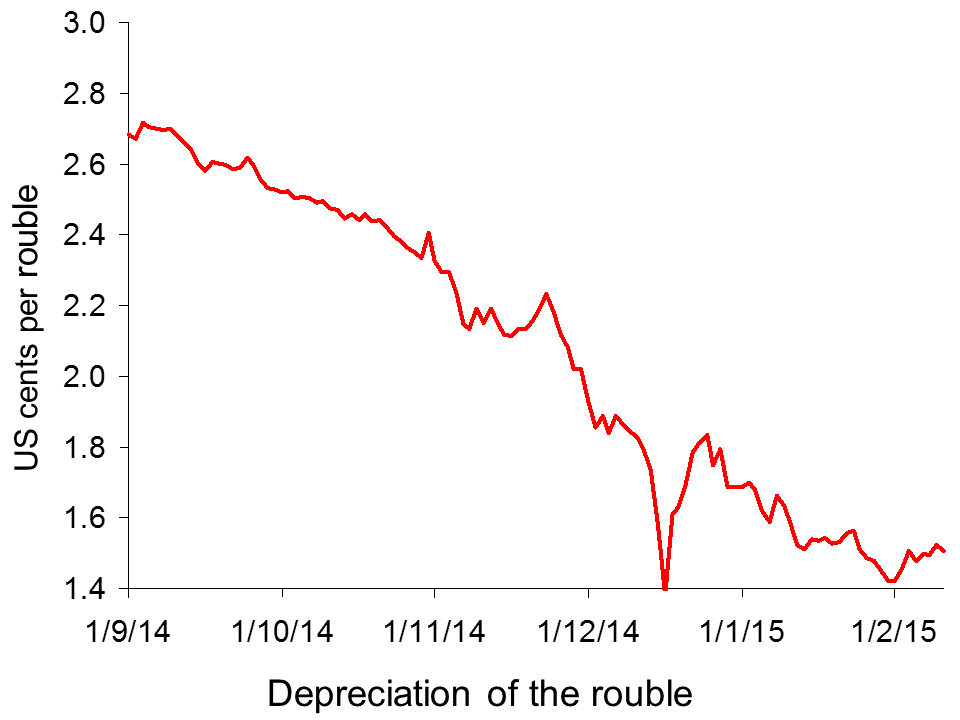 Russia has been adversely affected and estimates suggest that the economy will shrink further over the coming year. Oil and gas prices have declined significantly and while this is good news for many consumers across the world, it brings much sadder tidings for an economy, such as Russia, that is so dependent on oil exports.
However, is there a bright side to the sanctions or the falling currency? The BBC News article considers the winners and losers in Russia, including families struggling to feed their families following spending cuts and businesses benefiting from less competition.
Russia’s economic turmoil: nightmare or opportunity? BBC News, Olga Ivshina and Oleg Bodyrev (5/2/15)
Questions
- Why has the rouble fallen in value? Use a demand and supply diagram to illustrate this.
- What does a cheap rouble mean for exporters and importers within Russia and within countries such as the UK or US?
- One of the businesses described in the article explain how the sanctions have helped. What is the explanation and can the effects be seen as being in the consumer’s interest?
- Oil prices have fallen significantly over the past few months. Why is this so detrimental to Russia?
- What is the link between the exchange rate and inflation?
 Newspaper headlines this week read that the UK’s balance of trade deficit has widened to £34.8bn, the largest since 2010. And when you exclude services, the trade in goods deficit, at £119.9bn is the largest ever in nominal terms and is also likely to be the largest as a percentage of GDP.
So far so bad. But when you look a little closer, the picture is more mixed. The balance of trade deficit (i.e. on both goods and services) narrowed each quarter of 2014, although the monthly figure did widen in December 2014. In fact the trade in goods deficit increased substantially in December from £9.3bn to £10.2bn.
At first sight the widening of the trade deficit in December might seem surprising, given the dramatic drop in oil prices. Surely, with demand for oil being relatively inelastic, a large cut in oil prices should significantly reduce the expenditure on oil? In fact the reverse happened. The oil deficit in December increased from £598m to £940m. The reason is that oil importing companies have been stockpiling oil while low prices persist. Clearly, this is in anticipation that oil prices will rise again before too long. What we have seen, therefore, is a demand that is elastic in the short run, even though it is relatively inelastic in the medium run.
But the trade deficit is still large. Even when you strip out oil, the deficit in December still rose – from £8.7bn to £9.2bn. There are two main reasons for this deterioration.
The first is a strong pound. The sterling exchange rate index rose by 1.8% in December and a further 0.4% in January. With quantitative easing pushing down the value of the euro and loose monetary policies in China and Australia pushing down the value of their currencies, sterling is set to appreciate further.
The second is continuing weakness in the eurozone and a slowing of growth in some major developing countries, including China. This will continue to dampen the growth in UK exports.
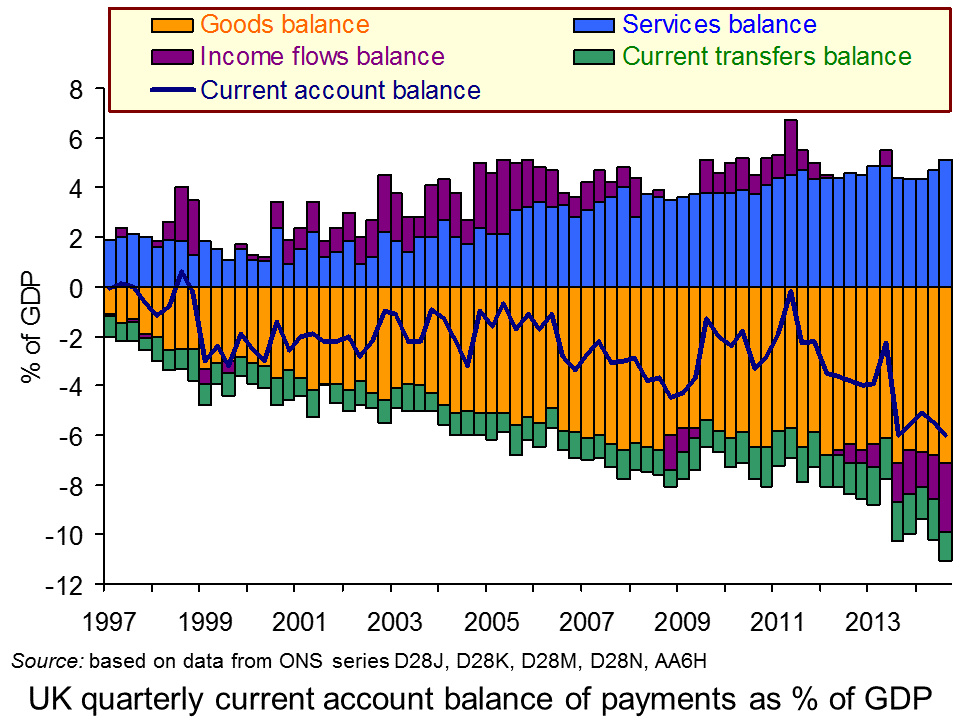 But what of the overall current account? Figures are at present available only up to 2014 Q3, but the picture is bleak (see the chart). As the ONS states:
The current account deficit widened in Q3 2014, to 6.0% of nominal Gross Domestic Product GDP, representing the joint largest deficit since Office for National Statistics (ONS) records began in 1955.
This deterioration in performance can be partly attributed to the recent weakness in the primary income balance [see]. This also reached a record deficit in Q3 2014 of 2.8% of nominal GDP; a figure that can be primarily attributed to a fall in UK residents’ earnings from investment abroad, and broadly stable foreign resident earnings on their investments in the UK
The primary income account captures income flows into and out of the UK economy, as opposed to current transfers (secondary income) from taxes, grants, etc. The large deficit reflects a decline in the holding by UK residents of foreign assets from 92% of GDP in 2008 to 67% by the end of 2014. This, in turn, reflects the poorer rate of return on many of these assets. By contrast, the holdings of UK assets by foreign residents has increased. They have been earning a higher rate of return on these assets than UK residents have on foreign assets. And so, despite UK interest rates having fallen, as the quote above says, foreign residents’ earnings on their holding of UK assets has remained broadly stable.
Articles
UK trade deficit last year widest since 2010 BBC News (6/2/15)
UK’s trade deficit widens to 2010 high as consumers take advantage of falling oil The Telegraph, Peter Spence (6/2/15)
UK trade deficit widens to four-year high The Guardian, Katie Allen (6/2/15)
UK trade deficit hits four-year high Financial Times, Ferdinando Giugliano (6/2/15)
Data
Balance of Payments ONS (topic link)
Summary: UK Trade, December 2014 ONS (6/2/15)
Current account, income balance and net international investment position ONS (23/1/15)
Pink Book – Tables ONS
Questions
- Distinguish between he current account, the capital account and the financial account of the balance of payments.
- If the overall balance of payments must, by definition, balance, why does it matter if the following are in deficit: (a) trade in goods; (b) the current account; (b) income flows?
- What would cause the balance of trade deficit to narrow?
- Discuss what policies the government could pursue to reduce the size of the current account deficit? Distinguish between demand-side and supply-side policies.
- Why has the sterling exchange rate index been appreciating in recent months?
- What do you think is likely to happen to the sterling exchange rate index in the coming months? Explain.
One effect of an expansionary monetary policy is a depreciation of the exchange rate. Take the case of countries using a combination of a reduction in central bank interest rates and quantitative easing (QE). A fall in interest rates will encourage an outflow of finance; and part of the money created through quantitative easing will be used to purchase foreign assets. Both create an increased demand for foreign currencies and drive down the exchange rate.
The latest case of expansionary monetary policy is that employed by the ECB. After months of promising to ‘do whatever it takes’ and taking various steps towards full QE, the ECB finally announced a large-scale QE programme on 22 January 2015.
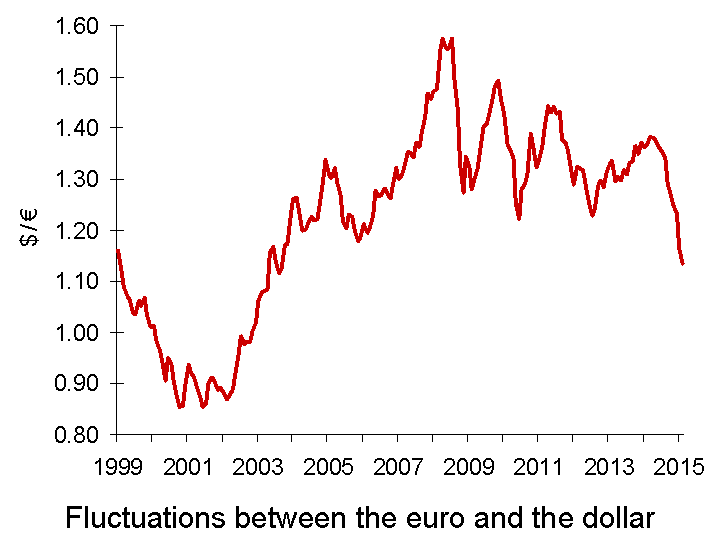 With people increasingly predicting QE and with the ECB reducing interest rates, so the euro depreciated. Between March 2014 and 21 January 2015, the euro depreciated by 20.2% against the dollar and the euro exchange rate index depreciated by 9.7%. With the announced programme of QE being somewhat larger than markets expected, in the week following the announcement the euro fell a further 2.3% against the dollar, and the euro exchange rate index also fell by 2.3%. The euro is now at its lowest level against the US dollar since April 2003 (see chart).
The depreciation of the euro will be welcome news for eurozone exporters. It makes their exports cheaper in foreign currency terms and thus makes their exports more competitive.  Similarly Japanese exporters were helped by the depreciation of the yen following the announcement on 31 October 2014 by the Bank of Japan of an increase in its own QE programme. The yen has depreciated by 7.7% against the dollar since then.
But every currency cannot depreciate against other currencies simultaneously. With any bilateral exchange rate, the depreciation of one currency represents an appreciation of the other. So just as the euro and yen have depreciated against the dollar, the dollar has appreciated against the euro and yen. This has made US goods less competitive relative to eurozone and Japanese goods.
The danger is that currency wars will result, with monetary policy being used in various countries to achieve competitive depreciations. Already, the Swiss have been forced, on 15 January, to remove the cap with the euro at SF1 – €0.833. Since then the Swiss franc has appreciated by some 15% to around SF1 – €0.96. Will the Swiss now be forced to relax their monetary policy?
The Danish and Canadian central banks have cut their interest rates, hoping to stem an appreciation of their currencies. On 28 January, the Monetary Authority of Singapore sold Singapore dollars to engineer a depreciation. The Singapore dollar duly fell by the most in over four years.
But are these policies simply beggar-my-neighbour policies? Is it a zero-sum game, where the gains to the countries with depreciating currencies are exactly offset by losses to the those with appreciating ones? Or is there a net gain from overall looser monetary policy at a time of sluggish growth? Or is there a net loss from greater currency volatility, which will create greater uncertainty and dampen cross-border investment? The following article explore the issues.
Articles
Massive Devaluation of the Euro Seeking Alpha, Sagar Joshi (26/1/15)
Devaluation and discord as the world’s currencies quietly go to war The Observer (25/1/15)
Why is dollar strong vs. 18 trillion of USA’s debt? Pravda, Lyuba Lulko (26/1/15)
Central Bankers Ramp Up Currency Wars Wall Street Journal, Anjani Trivedi, Josie Cox and Carolyn Cui (28/1/15)
The Raging Currency Wars Across Europe The Market Oracle, Gary_Dorsch (29/1/15)
Why ECB action is likely to stoke global currency wars Financial Times, Ralph Atkins (22/1/15)
Euro slides as ECB launches QE Financial Times (22/1/15)
Will Australia join the Currency Wars? The Daily Reckoning, Australia, Greg Canavan (23/1/15)
Australia’s central bank cuts rates to record low; currency plunges and stocks spike The Telegraph (3/2/15)
Singapore loosens monetary policy Financial Times, Jeremy Grant (28/1/15)
Currency Wars Have a Nuclear Option Bloomberg, Mark Gilbert (12/2/15)
Questions
- Explain how quantitative easing results in depreciation. What determines the size of the depreciation?
- How is the USA likely to react to an appreciation of the dollar?
- In the UK, who will benefit and who will lose from the depreciation of the euro?
- What are the global benefits and costs of a round of competitive depreciations?
- How does the size of the financial account of the balance of payments affect the size of a depreciation resulting from QE?
- What determines a country’s exchange-rate elasticity of demand for exports? How does this elasticity of demand affect the size of changes in the current account of the balance of payments following a depreciation?
- Might depreciation of their currencies reduce countries’ commitment to achieving structural reforms? Or might it ‘buy them time’ to allow them to introduce such reforms in a more carefully planned way and for such reforms to take effect? Discuss.