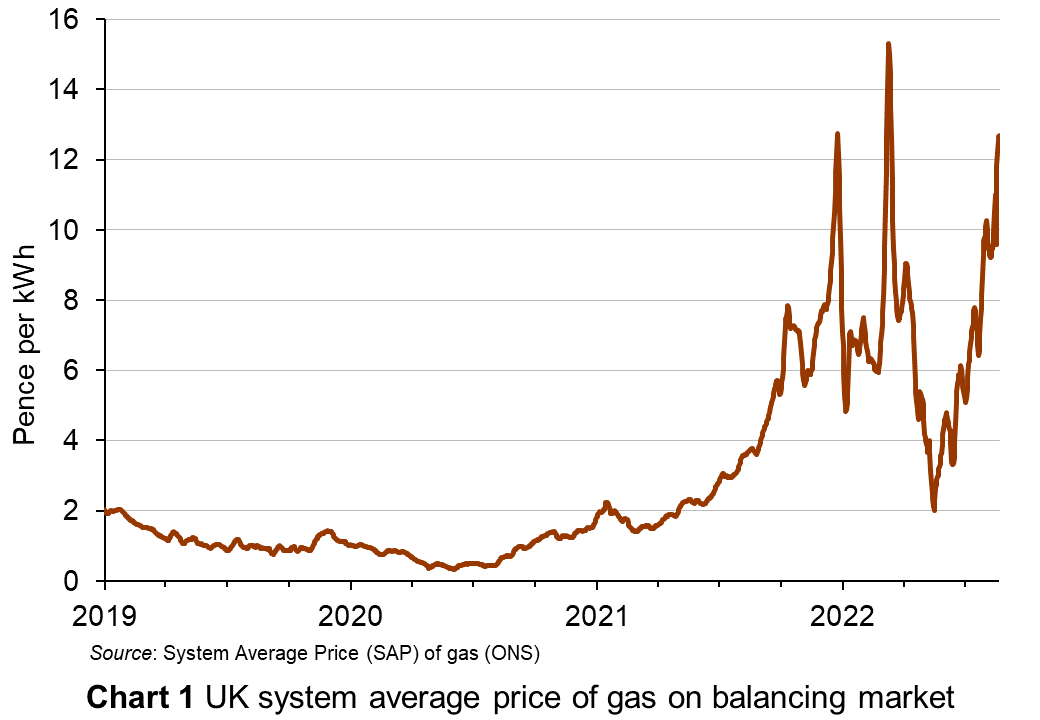
 International wholesale gas prices have soared in recent months. This followed a cold winter in 2021/22 across Europe, the bounceback in demand as economies opened up after COVID and, more recently, pressure on supplies since the Russian invasion of Ukraine and the resulting restricted gas supplies from Russia. The price of gas traded on the UK wholesale market is shown in Chart 1 (click here for a PowerPoint). Analysts are forecasting that the wholesale price of gas will continue to rise for some time. The higher price of gas has had a knock-on effect on wholesale electricity prices, as gas-fired power stations are a major source of electricity generation and electricity prices.
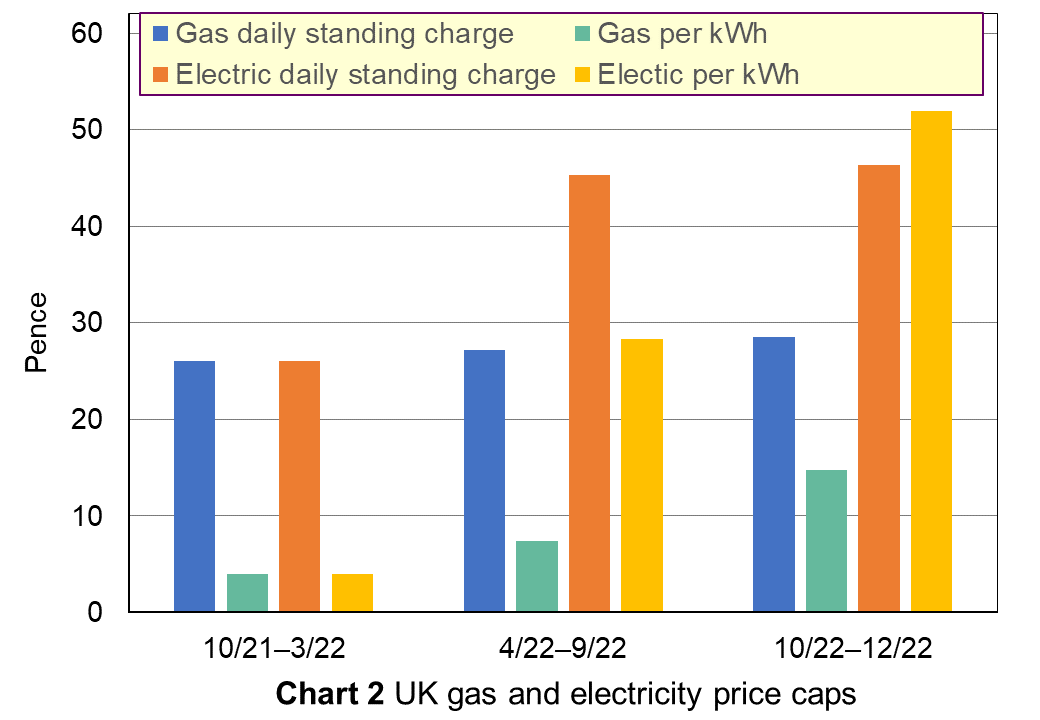 In the UK, domestic fuel prices were capped by the regulator, Ofgem. The cap reflected wholesale prices and was designed to allow electricity suppliers to make reasonable but not excessive profits. The cap was adjusted every six months, but this was been reduced to three months to reflect the rapidly changing situation. Prices are capped for both gas and electricity for both the standing charge and the rate per kilowatt hour (kWh). This is illustrated in Chart 2 (click here for a PowerPoint).
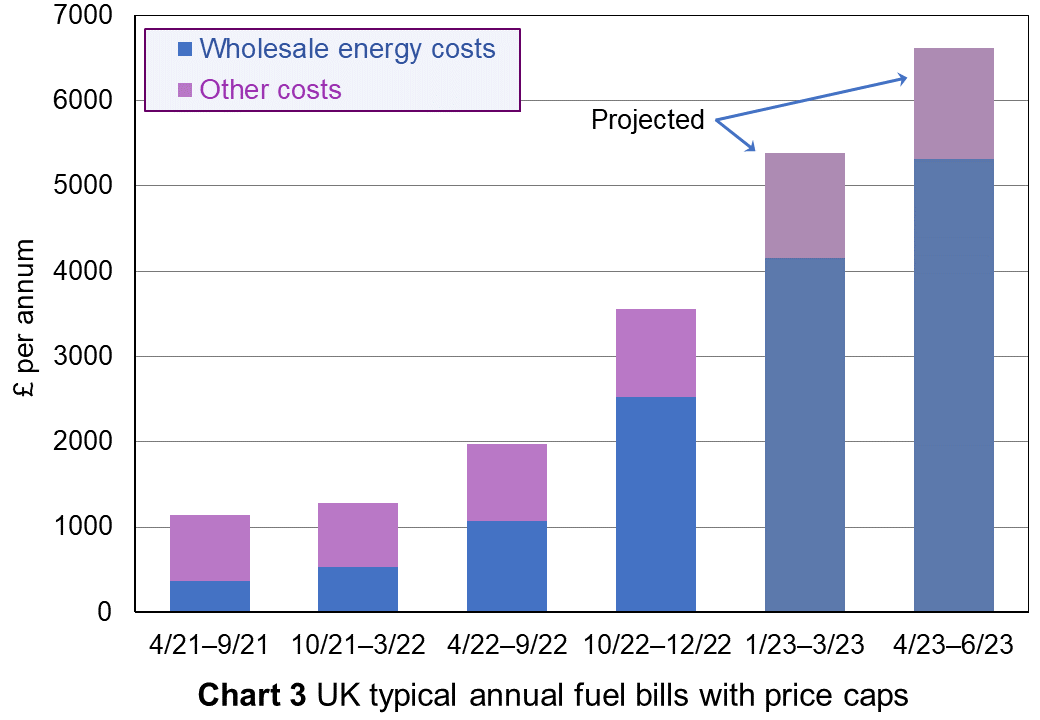 The effects of the cap were then projected in terms of a total annual bill for a typical household consuming 12 000 kWh of gas and 2900 kWh of electricity. Chart 3 shows the typical fuel bill for the last four price caps and, prior to the mini-Budget of 23 September, the projected price caps for the first and second quarters of 2023 based on forecasts at the time of wholesale prices (click here for a PowerPoint). As you can see, wholesale gas and electricity prices account for an increasing proportion of the total bill. The remaining elements in cost consist of profits (1.9% assumed), VAT (5%), operating costs, grid connection costs and green levies (around £153). The chart shows that, without government support for prices, the price cap would have risen by 80.6% in October 2022 and was projected to rise by a further 51% in January 2023 and by another 23% in March 2023. If this were to have been the case, then prices would have risen by 481% between the summer of 2021 and March 2023.
This was leading to dire warnings of extreme fuel poverty, with huge consequences for people’s health and welfare, which would put extra demands on an already stretched health service. Many small businesses would not be able to survive the extra fuel costs, which would lead to bankruptcies and increased unemployment.
Future wholesale gas prices
 Energy market analysts expect wholesale gas prices to remain high throughout 2023, with little likelihood that gas supplies from Russia will increase. Some European countries, such as Germany, have been buying large amounts of gas to fill storage facilities before winter and before prices rise further. This has added to demand.
The UK, however, has only limited storage facilities. Although it is not an importer of gas from Russia and so, in one sense, storage facilities are less important at the current time, wholesale gas prices reflect international demand and supply and thus gas prices in the UK will be directly affected by an overall global shortage of supply.
What would have been the response to the projected rise in gas prices? Eventually demand would fall as substitute fuels are used for electricity generation. But demand is highly inelastic. People cannot readily switch to alternative sources of heating. Most central heating is gas fired. People may reduce consumption of energy by turning down their heating or turning it off altogether, but such reductions are likely to be a much smaller percentage than the rise in price. Thus, despite some use of other fuels and despite people cutting their energy usage, people would still end up spending much more on energy.
Over the longer term, new sources of supply of gas, including liquified natural gas (LNG), may increase supply. And switching to green energy sources for electricity generation, may bring the price of electricity back down and lead to some substitution been gas and electricity in the home and businesses. Also improved home insulation and the installation of heat pumps and solar panels in homes, especially in new builds, may reduce the demand for gas. But these changes take time. Chart 4 illustrates the situation (click here for a PowerPoint).
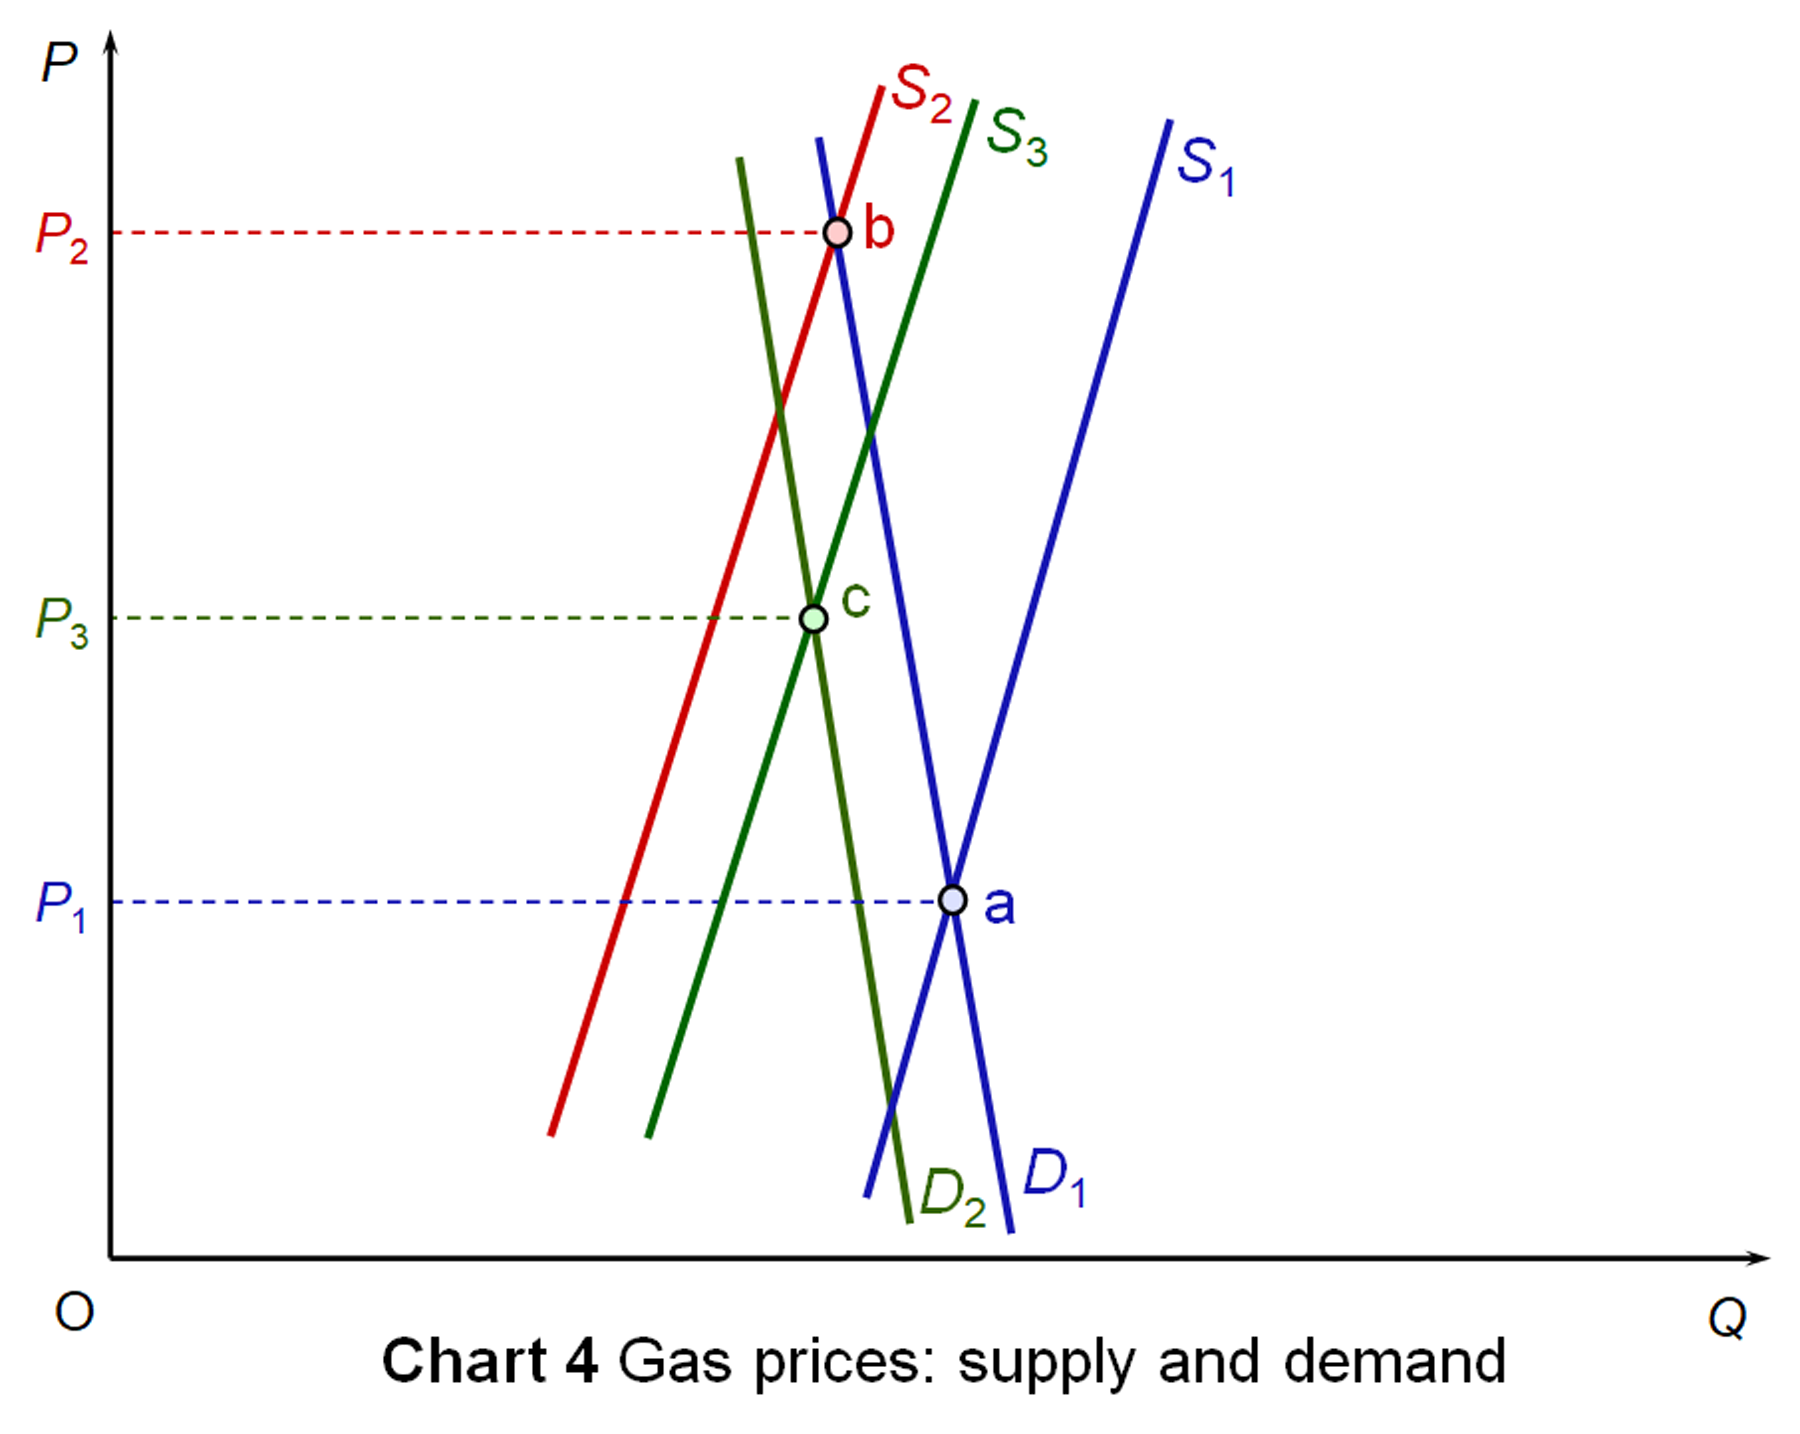 Both demand and supply are relatively inelastic. The initial demand and supply curves are D1 and S1. Equilibrium price is P1 (point a). There is now a fall in supply. Supply shifts to S2. With an inelastic demand, there is a large rise in price to P2 (point b).
Over two or three years, there is a modest fall in demand (as described above) to D2 and a modest rise in supply to S3. Price falls back somewhat to P3 (point c). Over a longer period of time, these shifts would be greater and the price would fall further.
Possible policy responses
What could the government do to alleviate the problem? Consensus was that the new Conservative Prime Minister, Liz Truss, and her Chancellor, Kwasi Kwarteng, would have to take radical measures if many households were to avoid severe hardship and debt. One proposal was to reduce VAT on domestic energy from 5% to zero and to cut green levies. Although this would help, it would make only a relatively small dent in people’s rising bills.
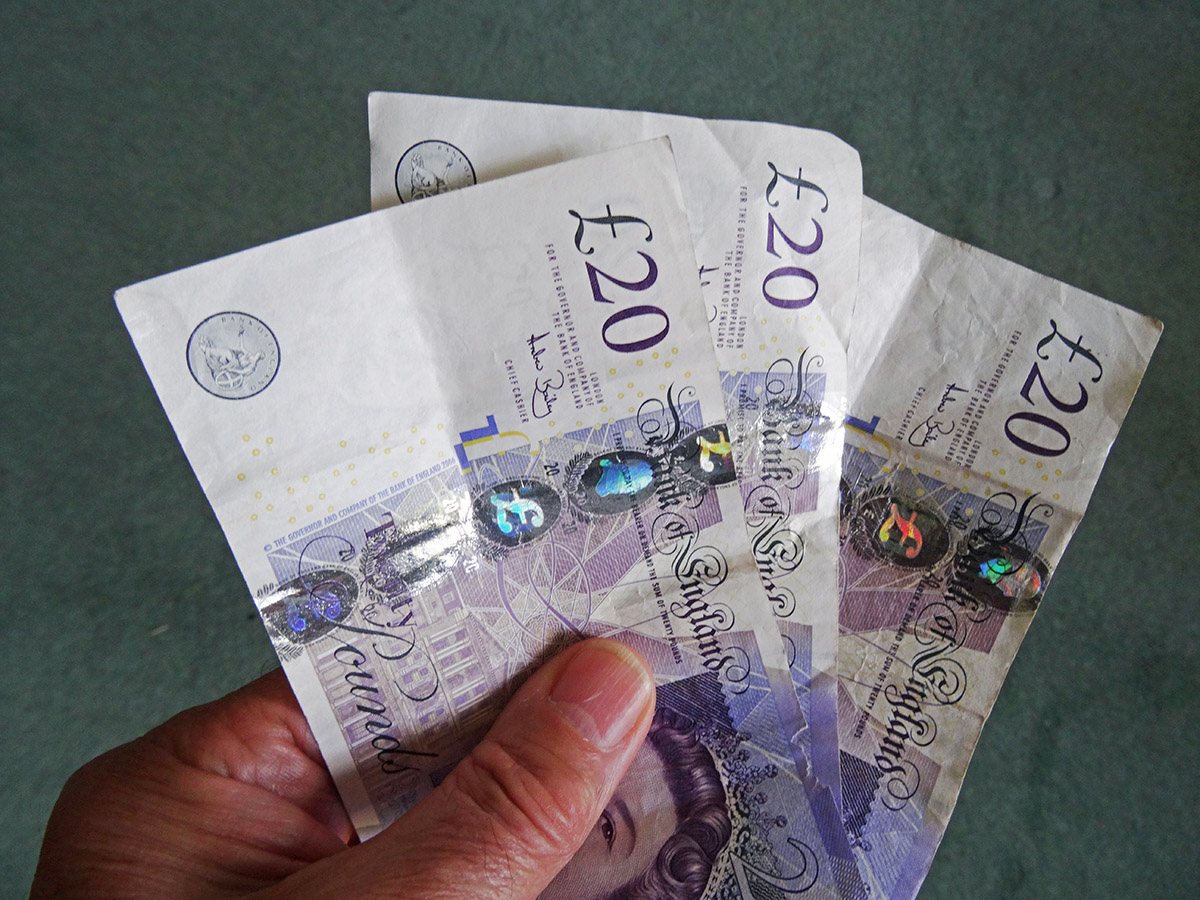 Another proposal was to give people cash payments to help with their bills. The more generous and widespread these payments, the more costly they would be.
One solution here would be to impose larger windfall taxes on oil and gas producers (as opposed to retailers). Their profits have soared as oil and gas prices have soared. Such a move is generally resisted by those on the right of politics, arguing that it could discourage investment in energy production. Those on the centre and left of politics argue that the profits are the result of global factors and not because of wise business decisions by the energy producers. A windfall tax would only take away these excess profits.
The EU has agreed a tax on fossil fuel companies’ surplus profits made either this year or next. It is also introducing a levy on the excess revenues that other low-cost power producers make from higher electricity prices.
Another proposal was to freeze retail energy prices at the current or some other level. This would make it impossible for energy suppliers to cover their costs and so they would have to be subsidised. This again would be very expensive and would require substantially increased borrowing at a time when interest rates are rising, or increased taxation at a time when people’s finances are already squeezed by higher inflation. An alternative would be to cap the price North Sea producers receive. As around half of the UK’s gas consumption is from the North Sea, this would help considerably if it could be achieved, but it might be difficult to do so given that the gas is sold onto international markets.
One proposal that was gaining support from energy producers and suppliers is for the government to set up a ‘deficit fund’. Energy suppliers (retailers) would freeze energy prices for two years and take out state-backed loans from banks. These would then be paid back over time by prices being capped sufficiently high to cover costs (which, hopefully, by then would be lower) plus repayments.
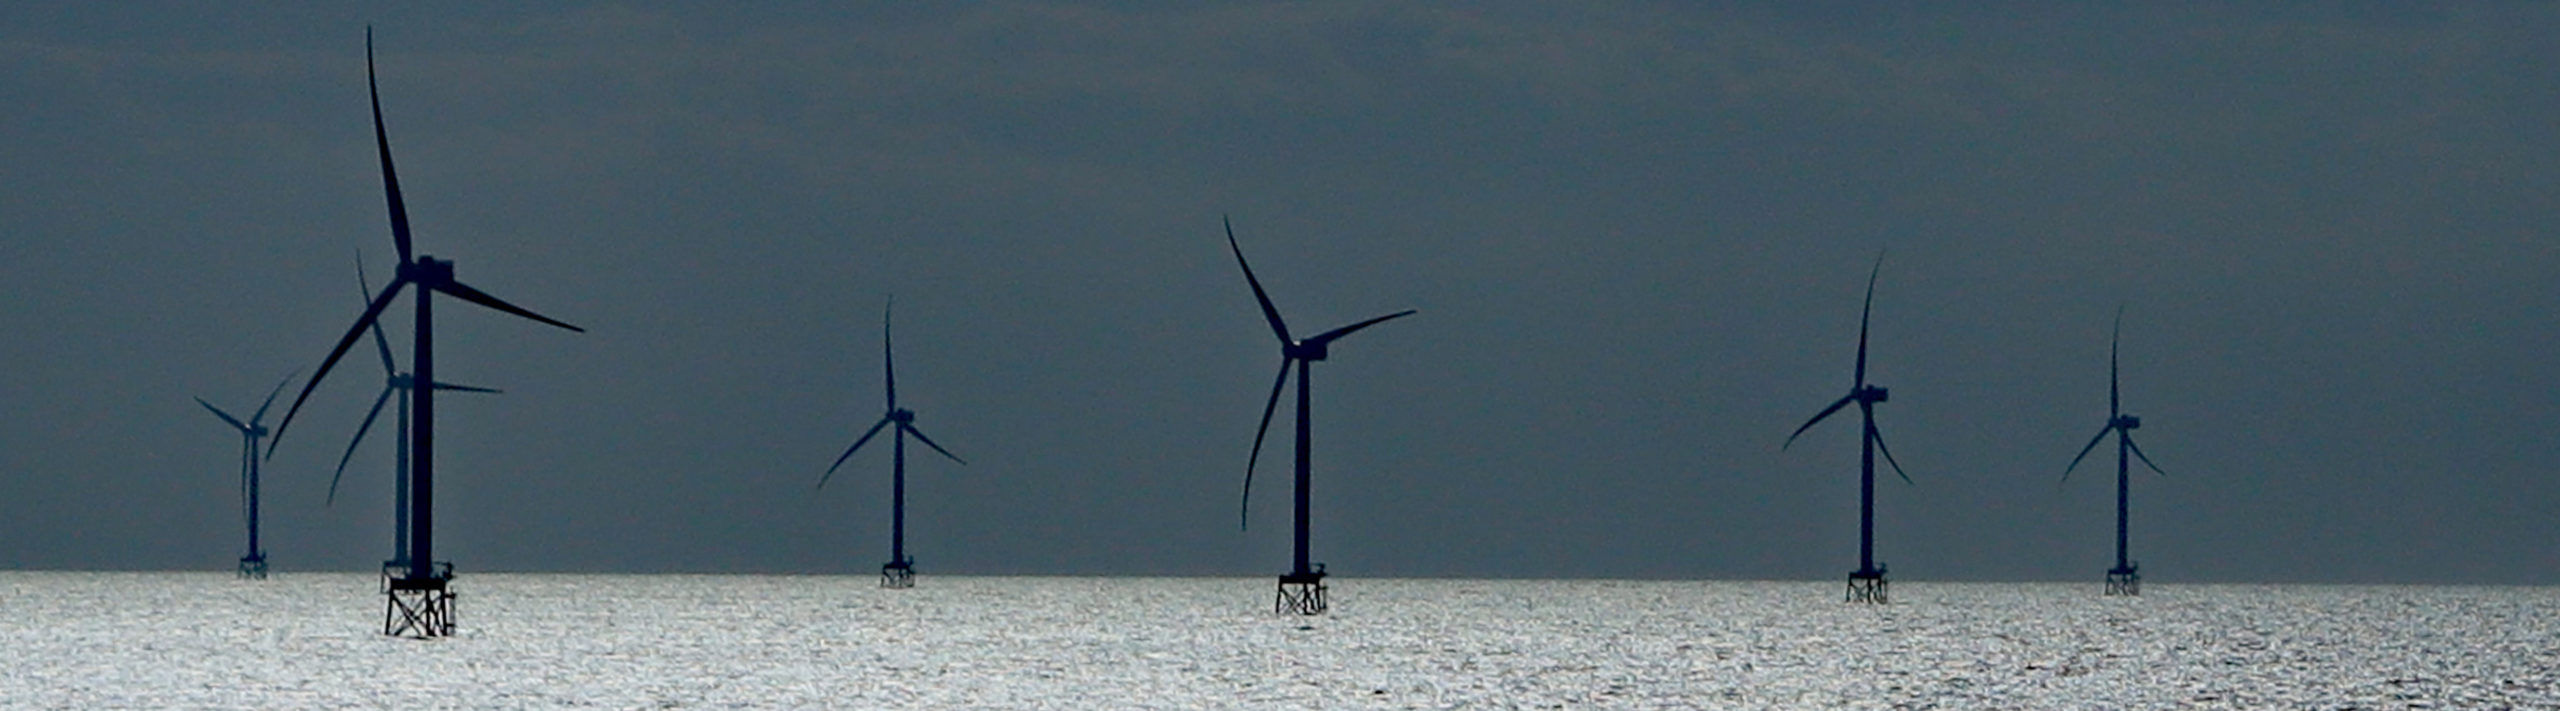
Another policy response would be to decouple electricity prices from the wholesale price of gas. This is being urgently considered in the EU, and Ofgem is also consulting on such a measure. This could make wholesale electricity prices reflect the costs of the different means of generation, including wind, solar and nuclear, and would see a fall in wholesale electricity prices. At the moment, generators using these methods are making large profits.
The government’s response
On September 23, the government held a mini-Budget. One of its key elements was a capping of the unit price of energy for both households and firms. The government called this the Energy Price Guarantee. For example, those households on a variable dual-fuel, direct-debit tariff would pay no more than 34.0p/kWh for electricity and 10.3p/kWh for gas. Standing charges are capped at 46p per day for electricity and 28p per day for gas. These rates will apply for 2 years from 1/10/22 and should give an average annual household bill of £2500.
Although the government has widely referred to the ‘£2500 cap’, it is the unit price that is capped, not the annual bill. It is still the case that the more you consume, the more you will pay. As you can see from Chart 3, the average £2500 still represents an average increase per annum of just over £500 per household and is almost double the cap of £1277 a year ago. It will thus still put considerable strain on many household finances.
For businesses, prices will be capped for 6 months from 1 October at 21.1p per kWh for electricity and 7.5p per KWh for gas – considerably lower than for domestic consumers.
The government will pay subsidies to the retail energy companies to allow them to make sufficient, but not excess, profit. These subsidies are estimated to cost around £150 billion. This will be funded by borrowing, not by tax increases, with the government ruling out a windfall tax on North Sea oil and gas extracting companies. Indeed, the mini-Budget contained a number of tax reductions, including scrapping the 45% top rate of income tax, cutting the basic rate of income tax from 20% to 19% and scrapping the planned rise in corporation tax from 19% to 25%.
Articles
Data
Questions
- Why are the demand and supply of gas relatively inelastic with respect to price?
- Why are the long-run elasticities of demand and supply of gas likely to be greater than the short-run elasticities?
- Find out how wholesale electricity prices are determined. Is there a case for reforming the system and, if so, how?
- Identify ways in which people could be protected from rising energy bills.
- Assess these different methods in terms of (a) targeting help to those most in need; (b) economic efficiency.
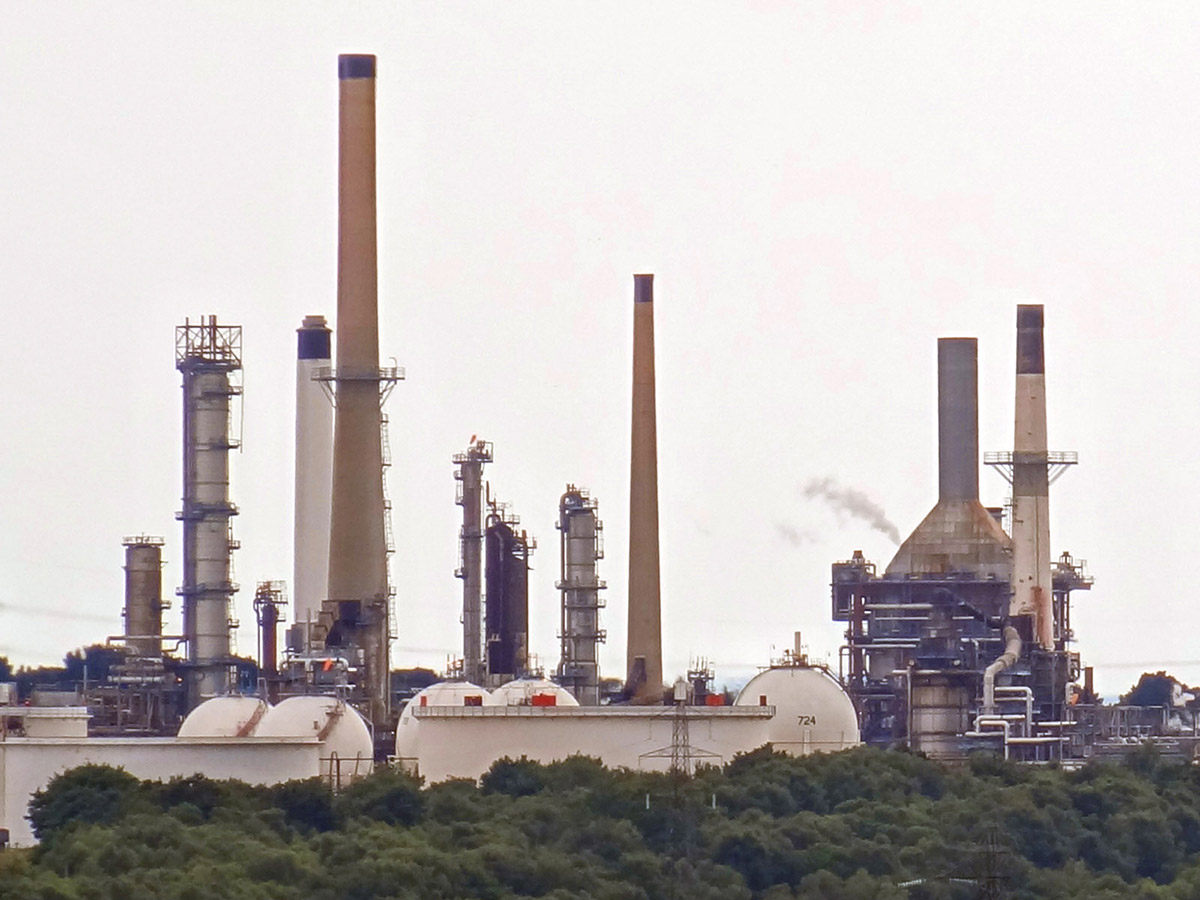 Global oil prices (Brent crude) reached $128 per barrel on 9 March, a level not seen for 10 years and surpassed only in the run up to the financial crisis in 2008. Oil prices are determined by global demand and supply, and the current surge in prices is no exception.
A rise in demand and/or a fall in supply will lead to a rise in the price. Given that both demand and supply are relatively price inelastic, such shifts can cause large rises in oil prices. Similarly, a fall in demand or rise in supply can lead to a large fall in oil prices.
These changes are then amplified by speculation. Traders try to get ahead of price changes. If people anticipate that oil prices will rise, they will buy now, or make a contract to buy more in the future at prices quoted today by buying on the oil futures market. This then pushes up both spot (current) prices and futures prices. If demand or supply conditions change, speculation will amplify the reaction to such a change.
What has happened since 2019?
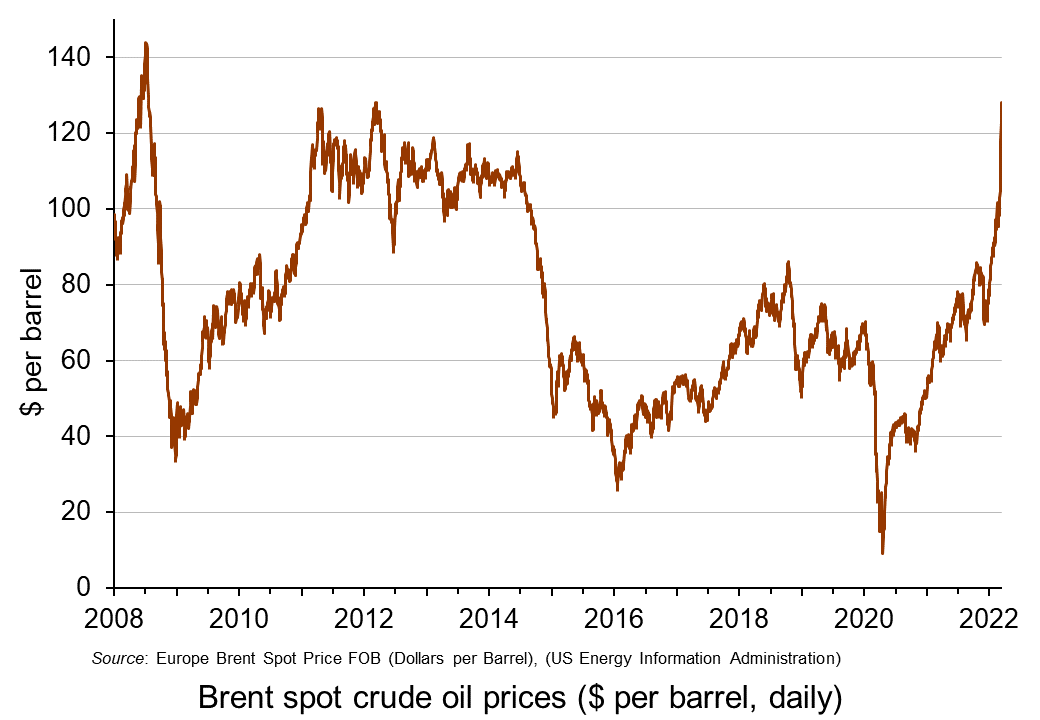 In 2019, oil was typically trading at around $60 to $70 per barrel. It then fell dramatically in early 2020 as the onset of COVID-19 led to a collapse in demand, for both transport and industry. The price fell below $20 in late April (see charts: click here for a PowerPoint).
Oil prices then rose rapidly as demand recovered somewhat but supply chains, especially shipping, were suffering disruptions. By mid-2021, oil was once more trading at around $60 to $70 per barrel. But then demand grew more strongly as economic recovery from COVID accelerated. But supply could not grow so quickly. By January 2022, Brent crude had risen above $80 per barrel.
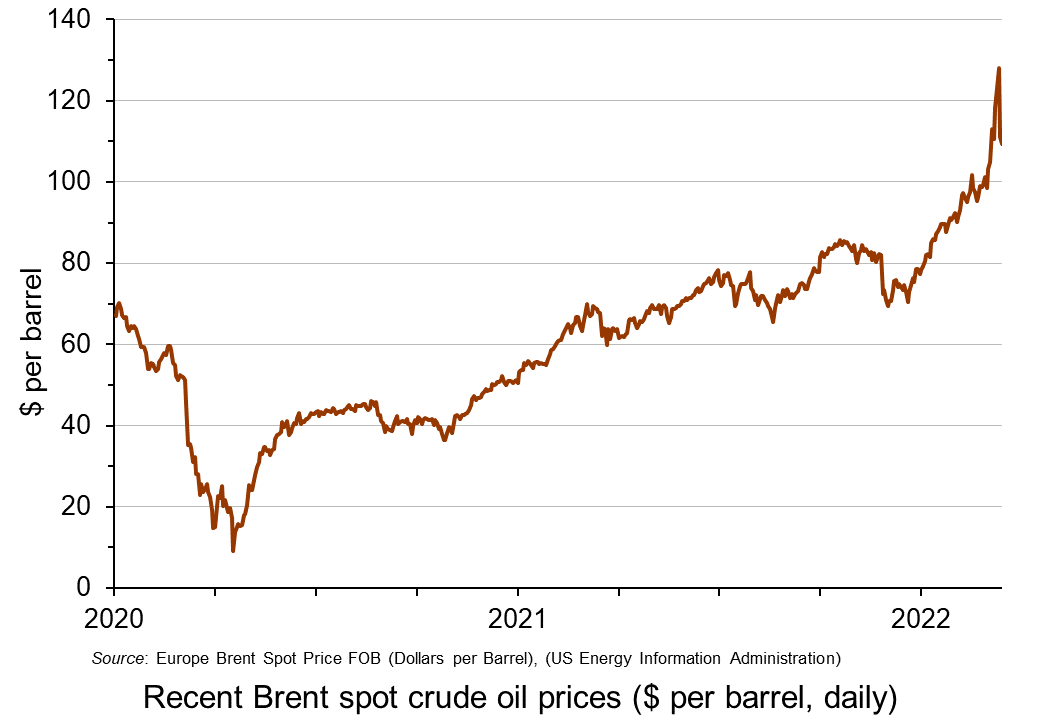 Then worries began to grow about Russian intentions over Ukraine as Russia embarked on large-scale military exercises close to the border with Ukraine. People increasingly disbelieved Russia’s declarations that it had no intention to invade. Russia is the world’s second biggest producer of oil and people feared that deliberate disruptions to supply by Russia or other countries banning imports of Russian oil would cause supply shortages. Speculation thus drove up the oil price. By 23 February, the day before the Russian invasion of Ukraine, Brent crude had risen to $95.
With the Russian invasion, moves were made by the EU the USA and other countries to ban or limit the purchase of Russian oil. This increased the demand for non-Russian oil.
 On 8 March, the USA announced that it was banning the import of Russian oil with immediate effect. The same day, the UK announced that it would phase out the import of Russian oil and oil products by the end of 2022.
The EU is much more dependent on Russian oil imports, which account for around 27% of EU oil consumption and 2/3 of extra-EU oil imports. Nevertheless, it announced that it would accelerate the move away from Russian oil and gas and towards green alternatives. By 8 March, Brent crude had risen to $128 per barrel.
The question was then whether other sources of supply would help to fill the gap. Initially it seemed that OPEC+ (excluding Russia) would not increase production beyond the quotas previously agreed by the cartel to meet recovery in world demand. But then, on 9 March, the UAE Ambassador to Washington announced that the county favoured production increases and would encourage other OPEC members to follow suit. With the announcement, the oil price fell by 11% to £111. But the next day, it rose again somewhat as the UAE seemed to backtrack, but then fell back slightly as OPEC said there was no shortage of oil.
This is obviously an unfolding story with the suffering of the Ukrainian people at its heart. But the concepts of supply and demand and their price elasticity and the role of speculation are central to understanding what will happen to oil prices in the coming months with all the consequences for poverty and economic hardship.
Articles
Data
Questions
- Use a demand and supply diagram to illustrate what has happened to oil prices over the past two years. How has the size of the effects been dependent on the price elasticity of demand for oil and the price elasticity of supply of oil?
- Use a demand and supply diagram to show what has been happening to the price of natural gas over the past two years. Are the determinants similar to those in the oil market? How do they differ (if at all)?
- What policy options are open to governments to deal with soaring energy prices?
- What are the distributional consequences of the rise in energy prices? (see the blog: Rise in the cost of living.)
- Under what circumstances are oil prices over the next six months likely (a) fall; (b) continue rising?
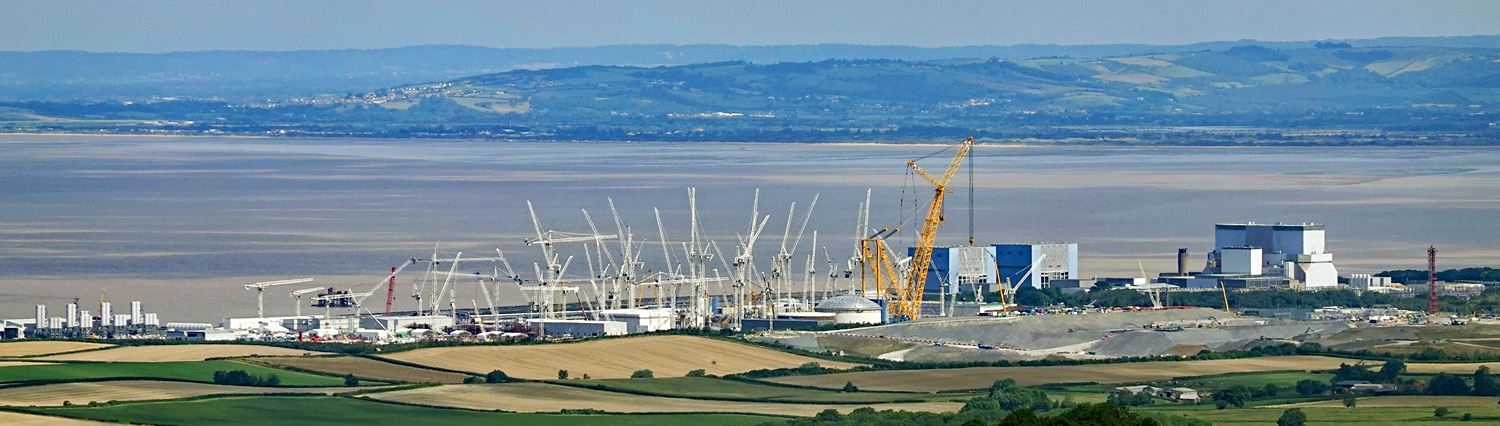
The transition towards clean energy in combination with a shortfall in supply has seen the price of raw uranium, also known as ‘yellowcake’, rise almost 60 per cent in recent weeks. It is now trading at over $50 a pound – a nine-year high. The market has been described as being at a ‘tipping point’. Given the recent boom in the market, the current conditions could tip the balance towards an era of rising uranium prices.
What is uranium?
Uranium is a heavy metal which has been used as a source of concentrated energy for over 60 years. Uranium ore can be mined from underground, milled, and then sold. It is then used in a nuclear reactor for electricity generation. About 10% of the world’s electricity is generated from uranium in nuclear reactors. There are some 445 nuclear reactors operating in 32 countries. It is the most energy-dense and efficient fuel source we have, with just ten uranium pellets able to power the average household for an entire year.
In March 2011, Japan’s most powerful earthquake on record triggered a tsunami, which then caused a meltdown at a nuclear power plant in Fukushima. It forced residents from their homes as radiation leaked from the plant. Since the Fukushima accident, uranium prices had been on a downtrend trend – enough to force several miners to suspend or scale back operations.
However, there has been a 42 per cent increase in the price of the metal in the first nine months of 2021 alone.
Demand for uranium
Since launching in July, a new investment trust, run by Canadian asset manager Sprott, has snapped up about 6m pounds of physical uranium, worth about $240m. This aggressive buying has helped push prices of uranium to more than $40 per pound, up from $30 at the start of the year. In the first part of September alone, prices surged by around 40%, outperforming all other major commodities. In just a few weeks, millions of pounds of supply were scooped up by the Sprott Physical Uranium Trust. This puts pressure on utilities that need to secure supplies of the commodity for electricity generation.
This increased demand is occurring at precisely the same time as countries and companies around the world are committing to net-zero carbon targets. As a result, nuclear power companies are now facing competition for supplies of uranium from financial investors, who are betting on sharply higher prices and demand for the radioactive material used to fuel reactors. This boost in demand is said to be due to uranium being used as a low-carbon energy source, despite the radioactive waste problem that comes with it. Investors are betting that nuclear power will be a key part of the move away from fossil fuels.
Production from world uranium mines has in recent years supplied 90% of the requirements of power utilities for uranium, with the current global mine supply expected to be about 125m pounds for 2021. In addition, there are secondary sources such as commercial and military stockpiles. However, according to the World Nuclear Association, demand for uranium is expected to climb from about 162m pounds this year to 206m pounds in 2030, and to 292m pounds by 2040. This is largely driven by increased power generation in China. China is planning a big increase in its nuclear power capacity over the next decade as the country seeks to cut its emissions.
Supply of uranium
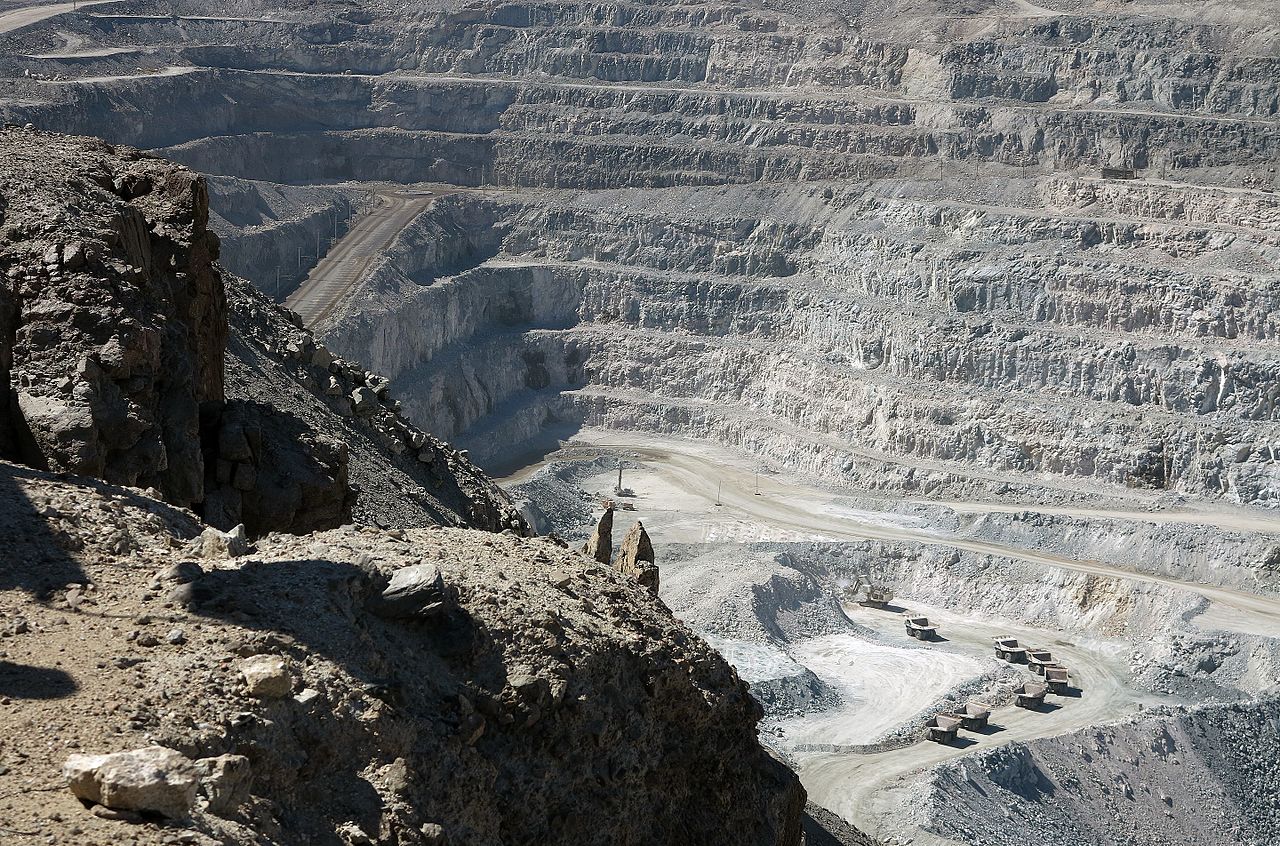 Although uranium is relatively abundant in the Earth’s crust, not all uranium deposits are economically recoverable. While some countries have uranium resources that can be mined profitably when prices are low, others do not. Kazakhstan is the largest producer of uranium and in 2019 produced more uranium than the second, third, and fourth-largest producers combined.
The big issue is that supply to the market is falling significantly. For deliveries that would start in 2022, Kazakh producer, Kazatomprom, is now discussing the possibility of supplying the metal directly to Sprott. However, it also warned of the risk that its mines would not reach their output target for 2021, and it said earlier this year that it would keep its production at reduced levels through 2023. In addition to this, the recent surge in buying is also reducing the inventories that accumulated after the Fukushima accident.
The supply of uranium is set to fall 15 per cent by 2025 and by 50 per cent by 2030. This is mainly due to a lack of investment in new mines. The lack of new uranium mines will mean the price has to move higher. Namibian mines, accounting for 8 per cent of world supply, are approaching the end of their lives. Cameco of Canada, another important source, has shut one large pit because of uneconomic prices. According to BMO Capital, a mine supply deficit since 2019 will continue.
Supply has also been affected by the pandemic. The boom in demand has coincided with historically low prices and pandemic-driven mine disruptions, prompting uranium producers to buy from the spot market to fulfil long-term contracts with consumers. Some of the largest mining operations in Canada and Kazakhstan had to suspend production temporarily due to a shortage of workers.
Adding to the security of supply concerns is the role of commercial and state-owned entities in the uranium market. Uranium is a highly trade-dependent commodity with international trade policies highlighting the disconnect between where uranium is produced and where it is consumed. About 80% of primary production comes from countries that consume little-to-no uranium, and nearly 90% of uranium consumption occurs in countries that have little-to-no primary production. As a result, government-driven trade policies can be particularly disruptive for the uranium market. It is argued that the risk to uranium supply may create a renewed focus on ensuring availability of long-term supply to fuel nuclear reactors.
The role of financial players
Financial players have been accelerating the recent recovery in the price of uranium, with large-scale speculative buying and withholding of supply. But it can be argued that this would not have occurred if there were not a fundamental and substantial shortage.
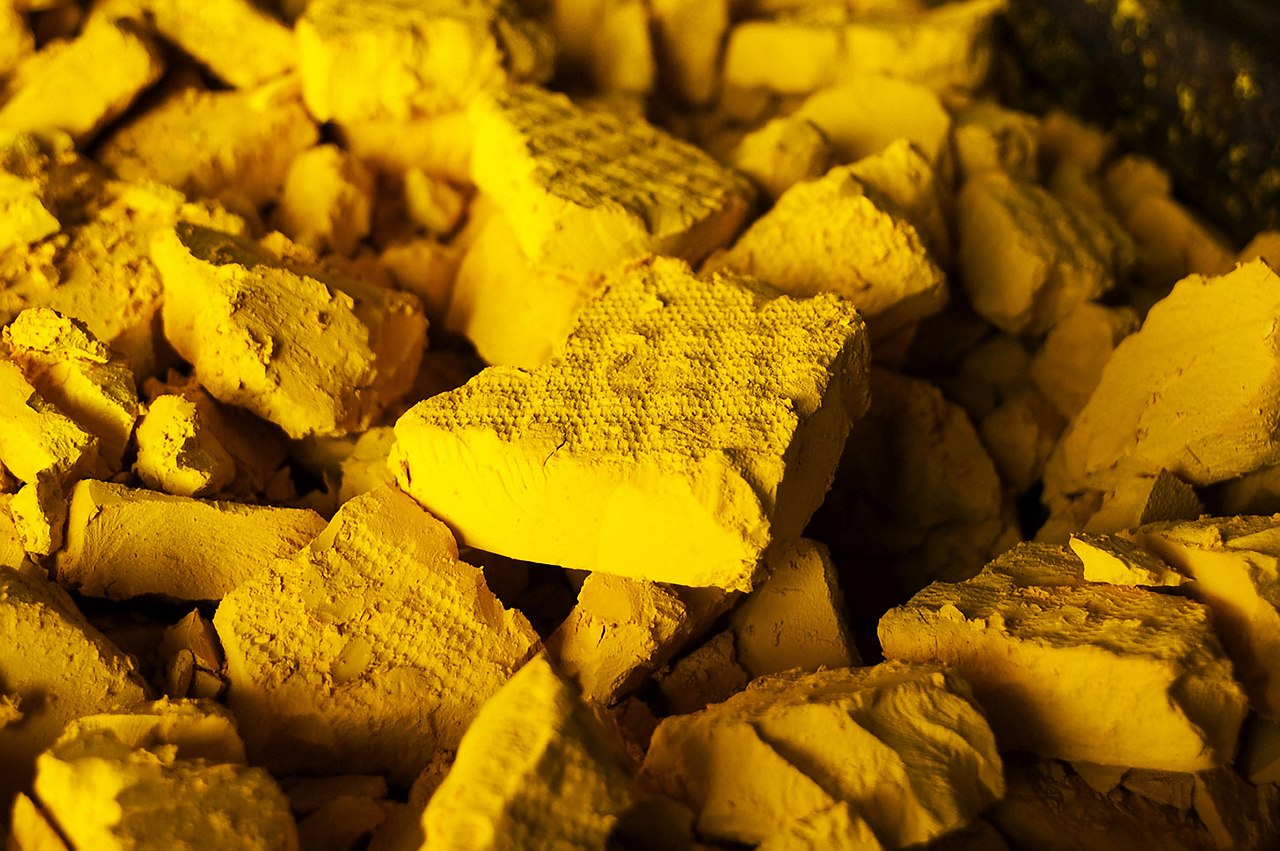 If investors keep buying uranium, analysts expect utility companies will come under pressure to replace long-term supply agreements before they expire. At the moment, long-term contracts cover 98 per cent of the uranium needed by US utility companies. But that figure drops to 84 per cent next year, and 55 per cent by 2025, according to uranium investment company, Yellow Cake.
As annual supply declines, demand for uranium from producers and financial players increases, and with trade policy potentially restricting access to some markets, it is believed the pounds available in the spot market will not be adequate to satisfy the growing backlog of long-term demand. As a result, companies expect there will be increased competition to secure uranium under long-term contracts on terms that will ensure the availability of reliable primary supply to meet growing demand.
What will the future look like?
Many countries are turning their attention to nuclear power in order to become net-zero economies. Even in Japan, nuclear generation has slowly been returning. It is argued that nuclear power is needed to some degree for the country to achieve its pollution-curbing goals. However, not all nations are re-embracing nuclear. Germany, for example, is set to shut its last reactor next year.
The concern is whether the recent gains in investor demand is enough to underpin the market. It can be argued that even before the recent price rally started, demand for uranium from the investment sector was already growing. However, observers of the market have suggested that just as quickly as uranium skyrocketed, prices may now be hitting the brakes. Producer stocks that got swept up in the frenzy seem to have peaked. In addition, the world’s top uranium miner Kazatomprom has warned that the recent price action was being fuelled by financial investors rather than the utilities that use the radioactive metal as fuel in their reactors. On the other hand, it is argued that this pickup in the spot market will be the catalyst to push more utilities to get involved in term contracting.
Despite the impact of the pandemic on global energy demand, it is now growing again. Gas and other energy shortages are being seen and the price of gas has been rising rapidly. This rise in energy prices plus a focus on carbon-free generation is likely to continue driving demand for nuclear power and hence for uranium. In addition, producers have warned of supply shortages in the long term as investors scoop up physical inventory and new mines are not starting quickly enough. Thus nuclear’s growing role in the clean energy transition, in addition to a supply shortfall, could turn the tide for the uranium industry.
Articles
Data
Questions
- Using the uranium market as an example, describe the relationship between an increase in demand and the market price.
- Explain whether the supply of uranium would be price elastic or inelastic in (a) the short run; (b) the long run.
- What is the role of speculation in determining the recent movements in the price of uranium and likely future price movements?
- Given your answers to the above questions, draw supply and demand diagrams to illustrate (a) the recent increase in the market price of uranium; (b) the likely price of uranium in five years from now.
 House prices are soaring throughout the world, making them unaffordable for many first-time buyers. In the UK, for example, according to the Nationwide, the annual house price increase was 13.4% in 2021 Q2. In the USA, house prices are rising by over 23% per annum.
The reason for this rampant house price inflation is that demand is rising much faster than supply. What is more, with inelastic supply in the short term, a given percentage rise in demand leads to a larger percentage increase in prices.
Reasons for rapidly rising house prices
 But why has demand risen so rapidly? One major reason is that central banks have engaged in massive quantitative easing. This has driven down interest rates to historic lows and has led to huge asset purchases. Mortgage lenders, awash with money, have been able to increase the ratio of lending to income. Borrowing by house purchasers, encouraged by low interest rates and easy access to mortgages, has thus increased rapidly.
Another reason for the increased demand is that economies are beginning to recover from the COVID-induced recessions. This makes people more confident about their future financial positions and more willing to take on increased mortgage debt. Another reason is that, with increased working from home, people are looking for larger houses where rooms can be used as studies. Another is that, with less spending during the lockdowns, people have built up savings, which can be used to buy larger homes.
Some countries have deliberately boosted demand by fiscal measures. In the UK, the government introduced a stamp duty ‘holiday’. Previously a 3% ‘stamp duty’ tax was applied to purchases over £125 000. Under the holiday scheme, the rate would only apply to purchases over £500 000 until 30 June 2021 and then to purchases over £250 000 until 30 September 2021. This massively boosted demand, especially as the deadlines approached. In the USA, there are various schemes at federal and state level to support first-time buyers, including low-interest loans and vouchers. Supporting demand is counterproductive if it merely leads to higher prices and thus does not make it easier for people to buy.
Speculation has played a major part too, with many potential purchasers keen to buy before prices rise further. On the supply side, some vendors have held back hoping to get a higher price by waiting. Gazumping has returned. This is where vendors accept a new higher offer even though they have already accepted a previous lower one.
Effects of higher house prices
Higher house prices have had a knock-on effect on rents, which have also soared. This has encouraged house purchases for rent both by individuals and by property investment companies. The effect of rapidly rising house prices and rents has been to increase the divide in society between property owners and those unable to afford to buy and forced to rent.
Increased housing wealth is likely to lead to greater housing equity withdrawal. This is where people draw on some of their equity in order to finance increased consumer spending, thereby boosting aggregate demand and possibly inflation.
Will the house price boom end soon?
 One scenario is that there will be a gradual slowdown in house price increases as quantitative easing is tapered off and as support measures, such as the UK’s stamp duty holiday, are unwound.
There is a real possibility, however, that there will be a more severe correction, with house prices actually falling. This could be triggered by central banks raising interest rates in response to higher inflation caused by the recovery and by higher commodity prices. In the UK, labour shortages brought about by Brexit could make the inflationary problem worse. With high levels of mortgage debt, even a half percentage point rise in mortgage interest rates could have a severe effect on demand. Falling house prices will then be compounded by speculation, with buyers holding off and sellers rushing to sell.
Articles
- “UK Boom the Biggest in 50 years” thanks to House Prices, but Oxford Economics Warn of Risks
PoundSterling Live, Gary Howes (18/6/21)
- US house prices see biggest rise in 30 YEARS and are outstripping Britain’s pandemic-fuelled boom: Is a global housing market bubble emerging?
This is Money, Helen Crane (1/7/21)
- House prices: urban exodus of upsizers shifts property demand
Business Telegraph (18/4/21)
- House prices rise at fastest pace in 17 years
BBC News (30/6/21)
- Runaway house prices: the ‘winners and losers’ from the pandemic
Financial Times, Delphine Strauss and Colby Smith (25/6/21)
- World’s Bubbliest Housing Markets Flash 2008 Style Warnings
Bloomberg, Enda Curran (15/6/21)
- House prices climb to record levels in US and Europe
Financial Times, Martin Arnold, Colby Smith and Matthew Rocco (22/6/21)
- With house prices through the roof, young buyers’ hopes go out the window
The Observer, Phillip Inman (3/7/21)
- Is the UK housing bubble about to burst? These are the best and worst scenarios
The Guardian, Josh Ryan-Collins (2/7/21)
- House prices: the risks of a fall are higher than most people think
The Conversation, Geoff Meen (28/6/21)
Data
Questions
- Use a supply and demand diagram to illustrate what has been happening to house prices. Illustrate the importance of the price elasticity of supply in the process.
- Under what circumstances might tax relief help or not help first-time buyers?
- Use a supply and demand diagram to illustrate the effect of speculation on house prices? Under what circumstances might speculation (a) make the market less stable; (b) help to stabilise the market?
- Explain what is meant by housing equity withdrawal. Using the Bank of England website, find out what has happened to housing equity withdrawal in the UK over the past 15 years. Explain.
- Under what circumstances would a sudden house price correction be more likely?
- Write a critique of housing policy in the light of growing inter-generational inequality of wealth.
 In its latest Commodity Special Feature (pages 43 to 53 of the October 2020 World Economic Outlook), the IMF examines the future of oil and other commodity prices. With the collapse in oil demand during the early stages of the coronavirus pandemic, oil prices plummeted. Brent crude fell from around $60 per barrel in late January to below $20 in April.
However, oil prices then rose somewhat and have typically been between $40 and $45 per barrel since June 2020 – still more than 35% lower than at the beginning of the year (see chart below: click here for a PowerPoint). This rise was caused by a slight recovery in demand but largely by supply reductions. These were the result partly of limits agreed by OPEC+ (OPEC, Russia and some other non-OPEC oil producing countries) and partly of reduced drilling in the USA and the closure of many shale oil wells which the lower prices had made unprofitable.
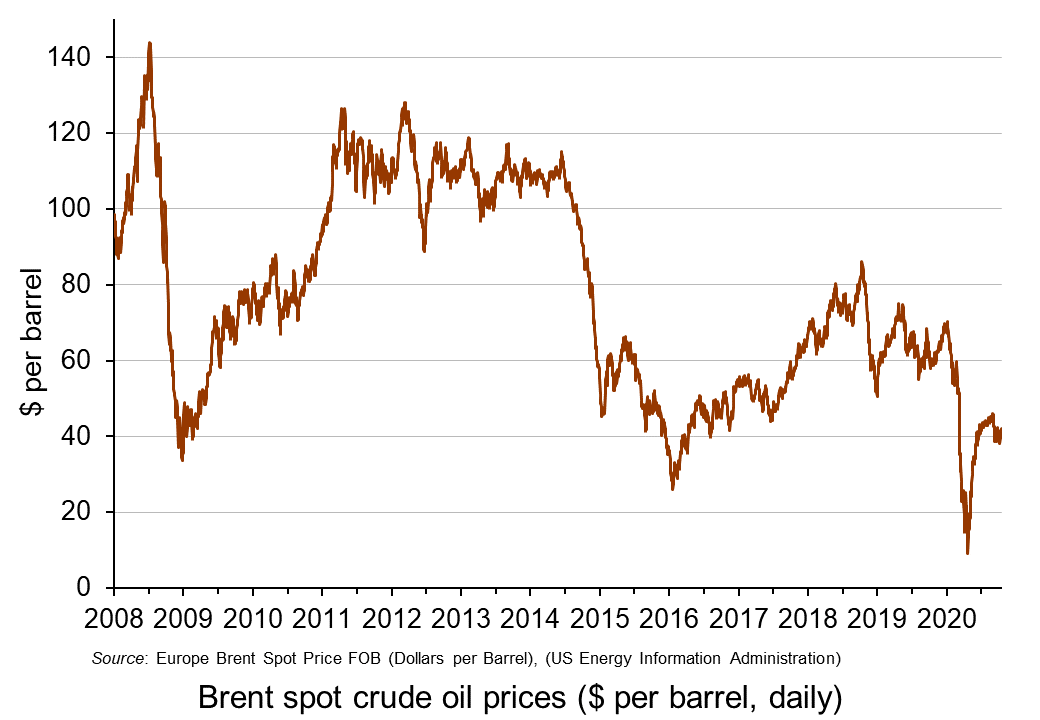 The IMF considers the future for oil prices and concludes that prices will remain subdued. It forecasts that petroleum spot prices will average $47 per barrel in 2021, up only slightly from the $42 average it predicts for 2020.
On the supply side it predicts that ‘stronger oil production growth in several non-OPEC+ countries, a faster normalization of Libya’s oil production, and a breakdown of the OPEC+ agreement’ will push up supply and push down prices. Even if the OPEC+ agreement holds, the members are set to ease their production cut by nearly 25% at the start of 2021. This rise in supply will be offset to some extent by possibly ‘excessive cuts in oil and gas upstream investments and further bankruptcies in the energy sector’.
On the demand side, the speed of the recovery from the pandemic will be a major determinant. If the second wave is long-lasting and deep, with a vaccine available to all still some way off, oil demand could remain subdued for many months. This will be compounded by the accelerating shift to renewable energy and electric vehicles and by government policies to reduce CO2 emissions.
Report
Articles
Oil price data
Questions
- Describe a scenario in which oil prices rebound significantly over the coming months. Illustrate your answer with a supply and demand diagram.
- Describe a scenario in which oil prices fall over the coming months. Again, illustrate your answer with a supply and demand diagram.
- How are the price elasticities of demand and supply relevant to the size of any oil price change?
- Project forward 10 years and predict whether oil prices will be higher or lower than now. What are the major determinants of supply and demand in your prediction?
- What are oil futures? What determines oil future prices?
- How does speculation affect oil prices?