 With the imposition of a new lockdown in England from 5 November to 2 December and in Wales from 3 October to 9 November, and with strong restrictions in Scotland and Northern Ireland, the UK economy is set to return to negative growth – a W-shaped GDP growth curve.
With the closure of leisure facilities and non-essential shops in England and Wales, spending is likely to fall. Without support, many businesses would fail and potential output would fall. In terms of aggregate demand and supply, both would decline, as the diagram below illustrates. (Click here for a PowerPoint.)
The aggregate demand curve shifts from AD1 to AD2 as consumption and investment fall. Exports also fall as demand is hit by the pandemic in other countries. 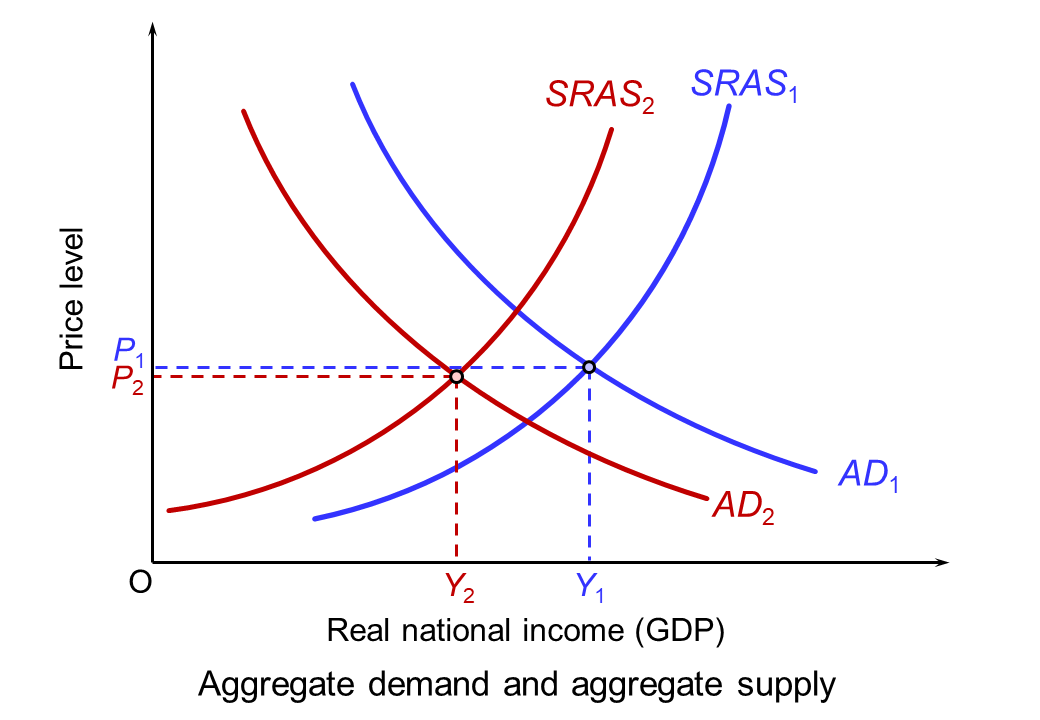 The fall in aggregate supply is represented partly by a movement along the short-run aggregate supply curve (SRAS) as demand falls for businesses which remain open (such as transport services). Largely it is represented by a leftward shift in the curve from SRAS1 to SRAS2 as businesses such as non-essential shops and those in the hospitality and leisure sector are forced to close. What happens to the long-run supply curve depends on the extent to which businesses reopen when the lockdown and any other subsequent restrictions preventing their reopening are over. It also depends on the extent to which other firms spring up or existing firms grow to replace the business of those that have closed. The continuing rise in online retailing is an example.
With the prospect of falling GDP and rising unemployment, the UK government and the Bank of England have responded by giving a fiscal and monetary boost. We examine each in turn.
Fiscal policy
 In March, the Chancellor introduced the furlough scheme, whereby employees temporarily laid off would receive 80% of their wages through a government grant to their employers. This scheme was due to end on 31 October, to be replaced by the less generous Job Support Scheme (see the blog, The new UK Job Support Scheme: how much will it slow the rise in unemployment?). However, the Chancellor first announced that the original furlough scheme would be extended until 2 December for England and then, on 5 November, to the end of March 2021 for the whole of the UK. He also announced that the self-employed income support grant would increase from 55% to 80% of average profits up to £7500.
In addition, the government announced cash grants of up to £3000 per month for businesses which are closed (worth more than £1 billion per month), extra money to local authorities to support businesses and an extension of existing loan schemes for business. Furthermore, the government is extending the scheme whereby people can claim a repayment ‘holiday’ for up to 6 months for mortgages, personal loans and car finance.
The government hopes that the boost to aggregate demand will help to slow, or even reverse, the predicted decline in GDP. What is more, by people being put on furlough rather than being laid off, it hopes to slow the rise in unemployment.
Monetary policy
At the meeting of the Bank of England’s Monetary Policy Committee on 4 November, further expansionary monetary policy was announced. Rather than lowering Bank Rate from its current historically low rate of 0.1%, perhaps to a negative figure, it was decided to engage in further quantitative easing.
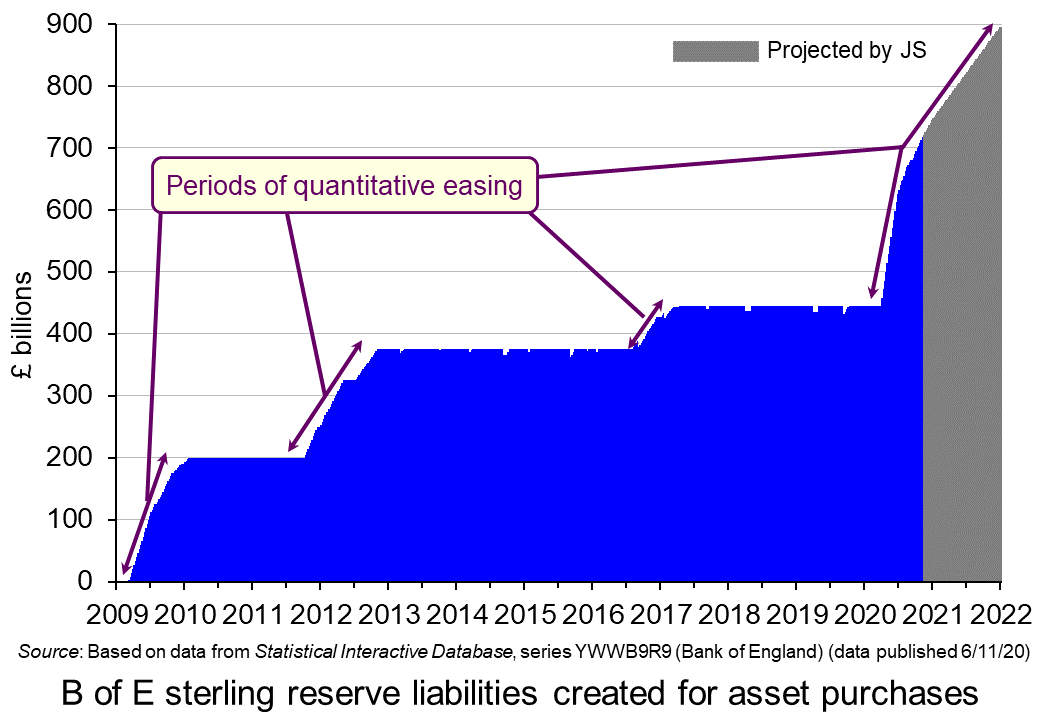 An additional £150 billion of government bonds will be purchased under the asset purchase facility (APF). This will bring the total vale of bonds purchased since the start of the pandemic to £450 billion (including £20 billion of corporate bonds) and to £895 billion since 2009 when QE was first introduced in response to the recession following the financial crisis of 2007–8.
The existing programme of asset purchases should be complete by the end of December this year. The Bank of England expects the additional £150 billion of purchases to begin in January 2021 and be completed within a year.
UK quantitative easing since the first round in March 2009 is shown in the chart above. The reserve liabilities represent the newly created money for the purchase of assets under the APF programme. (There are approximately £30 billion of other reserve liabilities outside the APF programme.) The grey area shows projected reserve liabilities to the end of the newly announced programme of purchases, by which time, as stated above, the total will be £895 billion. This, of course, assumes that the Bank does not announce any further QE, which it could well do if the recovery falters.
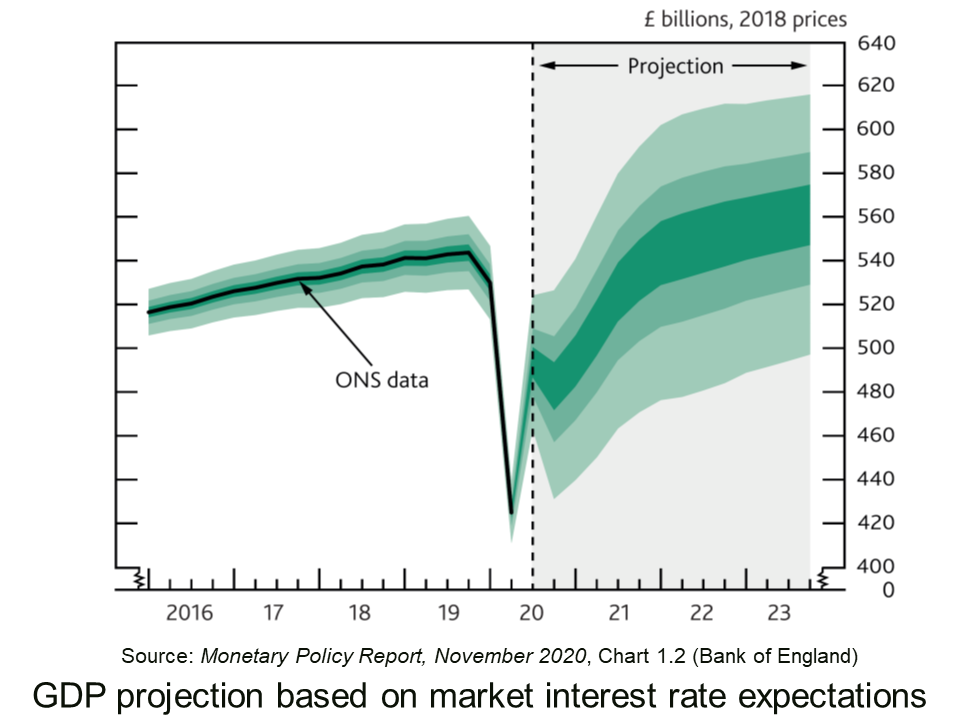
Justifying the decision, the MPC meeting’s minutes state that:
There are signs that consumer spending has softened across a range of high-frequency indicators, while investment intentions have remained weak. …The fall in activity over 2020 has reflected a decline in both demand and supply. Overall, there is judged to be a material amount of spare capacity in the economy.
Conclusions
How effective these fiscal and monetary policy measures will be in mitigating the effects of the Covid restrictions remains to be seen. A lot will depend on how successful the lockdown and other restrictions are in slowing the virus, how quickly a vaccine is developed and deployed, whether a Brexit deal is secured, and the confidence of both consumers, businesses and financial markets that the economy will bounce back in 2021. As the MPC’s minutes state:
The outlook for the economy remains unusually uncertain. It depends on the evolution of the pandemic and measures taken to protect public health, as well as the nature of, and transition to, the new trading arrangements between the European Union and the United Kingdom. It also depends on the responses of households, businesses and financial markets to these developments.
Articles
- Covid: Rishi Sunak to extend furlough scheme to end of March
BBC News (6/11/20)
- Furlough extended until March and self-employed support boosted again
MSE News, Callum Mason (6/11/20)
- Number on furlough in UK may double during England lockdown
The Guardian, Richard Partington (3/11/20)
- ‘We wouldn’t manage without it’: business owners on the furlough extension
The Guardian, Molly Blackall and Mattha Busby (6/11/20)
- Sunak’s abrupt turn on UK furlough scheme draws criticism from sceptics
Financial Times, Delphine Strauss (6/11/20)
 Coronavirus: Bank of England unleashes further £150bn of support for economy
Sky News, James Sillars (5/11/20)
- Bank of England boss pledges to do ‘everything we can’
BBC News, Szu Ping Chan (6/11/20)
- Savers are spared negative rates but the magic money tree delivers £150bn more QE: What the Bank of England’s charts tell us about the economy
This is Money, Simon Lambert (5/11/20)
- Covid-19 and the victory of quantitative easing
The Spectator, Bruce Anderson (26/10/20)
- Will the Bank of England’s reliance on quantitative easing work for the UK economy?
The Conversation, Ghulam Sorwar (9/11/20)
- With a W-shaped recession looming and debt piling up, the government should start issuing GDP-linked bonds
LSE British Politics and Policy blogs, Costas Milas (6/11/20)
Official documents
Questions
- Illustrate the effects of expansionary fiscal and monetary policy on (a) a short-run aggregate supply and demand diagram; (b) a long-run aggregate supply and demand diagram.
- In the context of the fiscal and monetary policy measures examined in this blog, what will determine the amount that the curves shift?
- Illustrate on a Keynesian 45° line diagram the effects of (a) the lockdown and (b) the fiscal and monetary policy measures adopted by the government and Bank of England.
- If people move from full-time to part-time working, how is this reflected in the unemployment statistics? What is this type of unemployment called?
- How does quantitative easing through asset purchases work through the economy to affect output and employment? In other words, what is the transmission mechanism of the policy?
- What determines the effectiveness of quantitative easing?
- Under what circumstances will increasing the money supply affect (a) real output and (b) prices alone?
- Why might quantitative easing benefit the rich more than the poor?
- How could the government use quantitative easing to finance its budget deficit?
In March 2020, the UK government introduced a Coronavirus Job Retention Scheme. Businesses that had to close or cut back could put staff on furlough and the scheme would allow employers to claim 80% of workers’ wages up to £2500 per month. This would be passed on to workers.
There was large-scale uptake of the scheme. By the end of August, 9.6 million employees were on furlough (28% of the workforce) from around 1.2 million employers (61% of eligible employers). The scheme significantly stemmed the rise in unemployment. The claimant count rose 121% from March to August from 1.24 million to 2.74 million, far less than it would have done without the furlough scheme.
Since 1 August the level of support has been reduced in stages and is due to end on 31 October. It will then be replaced by a new ‘Job Support Scheme (JSS)‘ running from 1 November 2020 to 30 April 2021. Initially, employees must work at least 33% of their usual hours. For hours not worked, the government and the employer will pay a third each. There would be no pay for the final third. This means that an employee would receive at least 77.7% (33% + (2/3)67%) of their full pay – not far short of the 80% under the furlough scheme.
Effects on unemployment
 Will the scheme see a substantial rise in unemployment, or will it be enough to support a gradual recovery in the economy as more businesses are able to reopen or take on more staff?
On first sight, it might seem that the scheme will give only slightly less job protection than the job furlough scheme with employees receiving only a little less than before. But, unlike the previous scheme, employers will have to pay not only for work done, but also an additional one-third for work not done. This is likely to encourage employers to lay off part of their staff and employ the remainder for more than one-third of their usual hours. Other firms may simply not engage with the scheme.
What is more, the furlough scheme paid wages for those previously employed by firms that were now closed. Under the new scheme, employees of firms that are forced to stay closed, such as many in the entertainments industry, will receive nothing. They will lose their jobs (at least until such firms are able to reopen) and will thus probably have to look for a new job. The scheme does not support them.
The government acknowledges that some people will lose their jobs but argues that it should not support jobs that are no longer viable. The question here is whether some jobs will eventually become viable again when the Covid restrictions are lifted.
With Covid cases on the rise again and more restrictions being imposed, especially at a local level, it seems inevitable that unemployment will continue to rise for some time with the ending of the furlough scheme and as the demand for labour remains subdued. The ending of the new scheme in April could compound the problem. Even when unemployment does begin to fall, it may take many months to return to pre-pandemic levels.
Update: expansion of the scheme
On 9 October, with Covid-19 cases rising rapidly in some parts of the country and tighter restrictions being imposed, the government announced that it was extending the scheme. From 1 November, employees of firms in certain parts of the country that would be required to close by the government, such as bars and restaurants, would be paid two-thirds of their previous wages by the government.
Critics of this extension to the scheme argue many firms will still be forced to shut because of lack of demand, even though they are not legally being required close. Employees of such firms will receive nothing from the scheme and will be forced onto Universal Credit. Also, the scheme will mean that many of the workers who do receive the money from the government will still face considerable hardship. Many will previously have been on minimum wages and thus will struggle to manage on only two-thirds of their previous wages.
Articles
- Job Support Scheme: What will I be paid after furlough?
BBC News, Eleanor Lawrie (1/10/20)
- Chancellor unveils new Job Support Scheme and extends self-employed grant
MSE News, Callum Mason (24/9/20)
- Sunak has bought himself time, but his big test will come as crisis eases
IFS Newspaper article, Paul Johnson (28/9/20)
- The businesses that feel left behind by Sunak’s jobs support scheme
Channel 4 News, Paul McNamara (25/9/20
- Covid: Jobs scheme ‘won’t stop major rise in unemployment’
BBC News (25/9/20)
- How the new Job Support Scheme will work
FT Adviser, Richard Churchill (30/9/20)
- Covid scheme: UK government to cover 22% of worker pay for six months
The Guardian, Phillip Inman (24/9/20)
- Hard winter ahead as Sunak tries to stop job losses hitting postwar record
The Guardian, Larry Elliott (24/9/20)
- Job Support Scheme ‘won’t reduce job losses’
Personnel Today, Ashleigh Webber (25/9/20)
- Sunak’s new job support scheme offers warm words but no escape from the coming unemployment chill
The Conversation, David Spencer (24/9/20)
Articles: update
Government information
Questions
- If people on furlough were counted as unemployed, find out what would have happened to the unemployment rate between March and August 2020.
- If an employer were previously employing two people doing the same type of job and now has enough work for only one person, under the Job Support Scheme would it be in the employers’ financial interest to employ one worker full time and make the other redundant or employ both of the workers half time? Explain your arguments.
- What are the arguments for and against the government supporting jobs for more than a few months?
- What determines the mobility of labour? What policies could the government pursue to increase labour mobility?
- Find out what policies to support employment or wages have been pursued by two other countries since the start of the pandemic. Compare them with the policies of the UK government.
 Share prices are determined by demand and supply. The same applies to stock market indices, such as the FTSE 100 and FTSE 250 in the UK and the Dow Jones Industrial Average and the S&P 500 in the USA. After all, the indices are the weighted average prices of the shares included in the index. Generally, when economies are performing well, or are expected to do so, share prices will rise. They are likely to fall in a recession or if a recession is anticipated. A main reason for this is that the dividends paid on shares will reflect the profitability of firms, which tends to rise in times of a buoyant economy.
When it first became clear that Covid-19 would become a pandemic and as countries began locking down, so stock markets plummeted. People anticipated that many businesses would fail and that the likely recession would cause profits of many other surviving firms to decline rapidly. People sold shares.
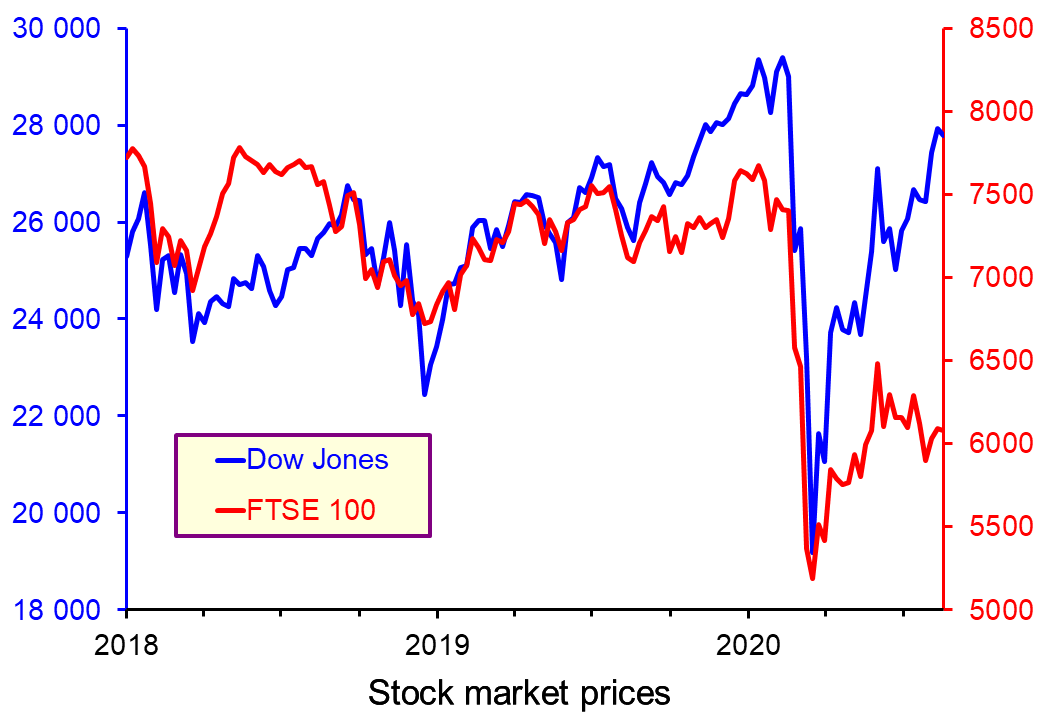 The first chart shows how the FTSE 100 fell from 7466 in early February 2020 to 5190 in late March, a fall of 30.5%. The Dow Jones fell by 34% over the same period. In both cases the fall was driven not only by the decline in the respective economy over the period, but by speculation that further declines were to come (click here for a PowerPoint of the chart).
But then stock markets started rising again, especially the Dow Jones, despite the fact that the recessions in the UK, the USA and other countries were gathering pace. In the second quarter of 2020, the Dow Jones rose by 23% and yet the US economy declined by 33% – the biggest quarterly decline on record. How could this be explained by supply and demand?
Quantitative easing
In order to boost aggregate demand and reduce the size of the recession, central banks around the world engaged in large-scale quantitative easing. 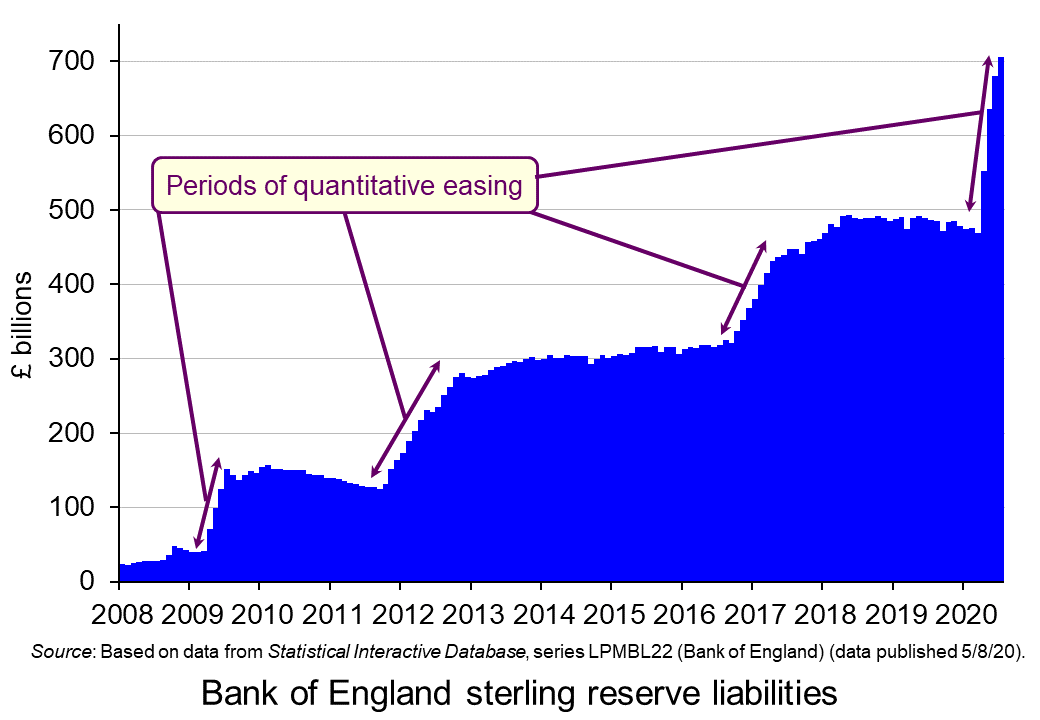 This involves central banks buying government bonds and possibly corporate bonds too with newly created money. The extra money is then used to purchase other assets, such as stocks and shares and property, or physical capital or goods and services. The second chart shows that quantitative easing by the Bank of England increased the Bank’s asset holding from April to July 2020 by 50%, from £469bn to £705bn (click here for a PowerPoint of the chart).
But given the general pessimism about the state of the global economy, employment and personal finances, there was little feed-through into consumption and investment. Instead, most of the extra money was used to buy assets. This gave a huge boost to stock markets. Stock market movements were thus out of line with movements in GDP.
Confidence
Stock market prices do not just reflect the current economic and financial situation, but also what people anticipate the situation to be in the future. 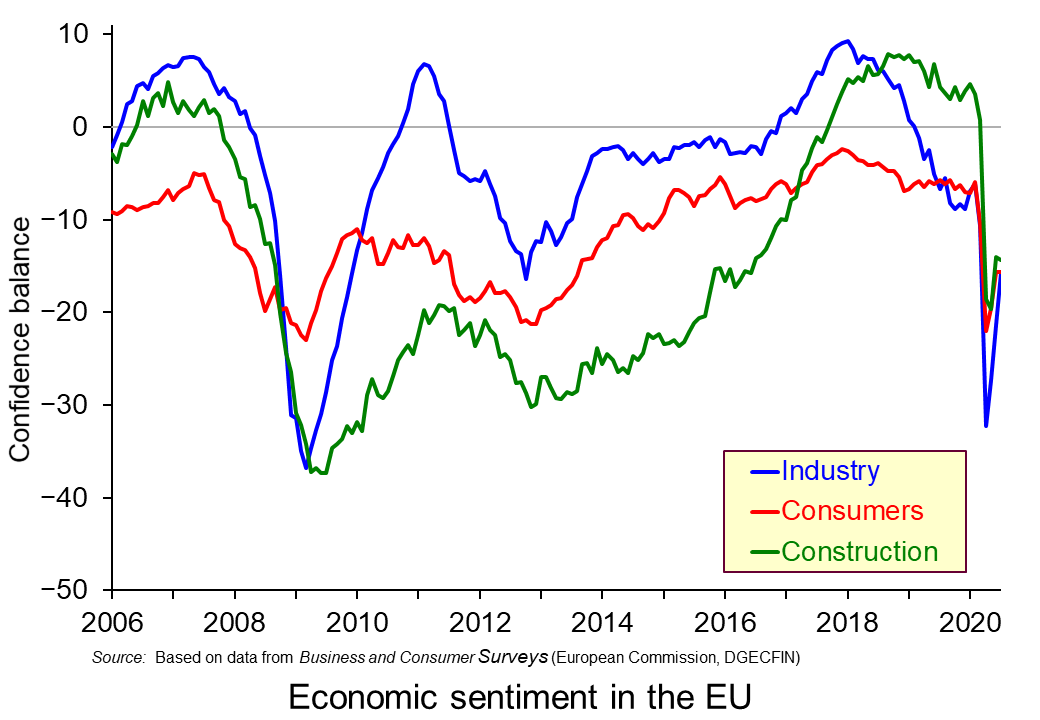 As infection and death rates from Covid-19 waned around Europe and in many other countries, so consumer and business confidence rose. This is illustrated in the third chart, which shows industrial, consumer and construction confidence indicators in the EU. As you can see, after falling sharply as the pandemic took hold in early 2020 and countries were locked down, confidence then rose (click here for a PowerPoint of the chart).
But, as infection rates have risen somewhat in many countries and continue to soar in the USA, Brazil, India and some other countries, this confidence may well start to fall again and this could impact on stock markets.
Speculation
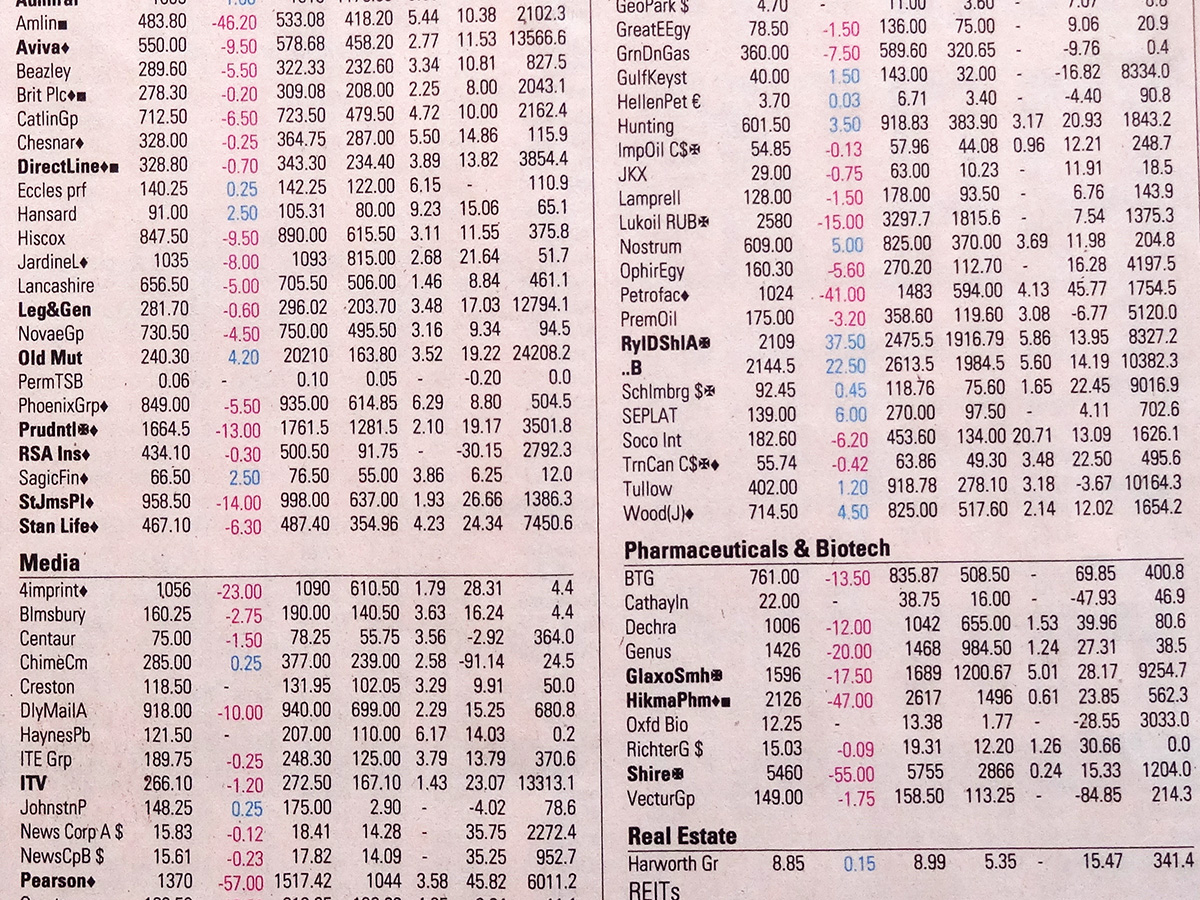 A final, but related, cause of recent stock market movements is speculation. If people see share prices falling and believe that they are likely to fall further, then they will sell shares and hold cash or safer assets instead. This will amplify the fall and encourage further speculation. If, however, they see share prices rising and believe that they will continue to do so, they are likely to want to buy shares, hoping to make a gain by buying them relatively cheaply. This will amplify the rise and, again, encourage further speculation.
If there is a second wave of the pandemic, then stock markets could well fall again, as they could if speculators think that share prices have overshot the levels that reflect the economic and financial situation. But then there may be even further quantitative easing.
There are many uncertainties, both with the pandemic and with governments’ policy responses. These make forecasting stock market movements very difficult. Large gains or large losses could await people speculating on what will happen to share prices.
Articles
Questions
- Illustrate the recent movements of stock markets using demand and supply diagrams. Explain your diagrams.
- What determines the price elasticity of demand for shares?
- Distinguish between stabilising and destabilising speculation. How are the concepts relevant to the recent history of stock market movements?
- Explain how quantitative easing works to increase (a) asset prices; (b) aggregate demand.
- What is the difference between quantitative easing as currently conducted by central banks and ‘helicopter money‘?
- Give some examples of companies whose share prices have risen strongly since March 2020. Explain why these particular shares have done so well.
 The LSE’s Centre for Economic Performance has just published a paper looking at the joint impact of Covid-19 and Brexit on the UK economy. Apart from the short-term shocks, both will have a long-term dampening effect on the UK economy. But they will largely affect different sectors.
Covid-19 has affected, and will continue to affect, direct consumer-facing industries, such as shops, the hospitality and leisure industries, public transport and personal services. Brexit will tend to hit those industries most directly involved in trade with Europe, the UK’s biggest trading partner. These industries include manufacturing, financial services, posts and telecommunications, mining and quarrying, and agriculture and fishing.
Despite the fact that largely different sectors will be hit by these two events, the total effect may be greater than from each individually. One of the main reasons for this is the dampening impact of Covid-19 on globalisation.  Travel restrictions are likely to remain tighter to more distant countries. And countries are likely to focus on trading within continents or regions rather than the whole world. For the UK, this, other things being equal, would mean an expansion of trade with the EU relative to the rest of the world. But, unless there is a comprehensive free-trade deal with the EU, the UK would not be set to take full advantage of this trend.
Another problem is that the effects of the Covid-19 pandemic have weakened the economy’s ability to cope with further shocks, such as those from Brexit. Depending on the nature (or absence) of a trade deal, Brexit will impose higher burdens on trading companies, including meeting divergent standards and higher administrative costs from greater form filling, inspections and customs delays.
Papers
Articles
Questions
- Referring to the LSE paper, give some examples of industries that are likely to be particularly hard hit by Brexit when the transition period ends? Explain why.
- Why have university finances been particularly badly affected by both Covid-19 and Brexit? Are there any other sectors that have suffered (or will suffer) badly from both events?
- Is there a scenario where globalisation in trade could start to grow again?
- Has Covid-19 affected countries’ comparative advantage in particular products traded with particular countries and, if so, how?
- The authors of the LSE report argue that ‘government policies to stimulate demand, support workers to remain in employment or find new employment, and to support businesses remain essential’. How realistic is it to expect the government to provide additional support to businesses and workers to deal with the shock of Brexit?
 In a little over a decade economies around the world have experienced two ‘once-in-a-lifetime’ shocks. First, there was the global financial crisis of the late 2000s, which saw an unsustainable expansion of banks’ balance sheets that resulted in a global economic slowdown. Now in 2020, a global health emergency has meant unprecedented falls in economic activity. In both cases, the public sector has been the economy’s shock absorber but this has had dramatic effects on its financial wellbeing. We consider here the effect on the UK public finances and reflect on their sustainability in light of the recent Fiscal Sustainability Report published by the Office of Budget Responsibility (OBR).
The COVID-19 pandemic saw the government initiate a range of fiscal interventions to support people and businesses. Interventions directly affecting public-sector spending included a series of employment support measures. These included the Coronavirus Job Retention Scheme, commonly referred to as the furlough scheme, the Self-employed Income Support scheme, a ‘Kickstart Scheme’ of work placements for universal credit recipients aged between 16 and 24 and a ‘Job Retention Bonus’ whereby employers can receive a one-off payment of £1,000 for every furloughed employee continuously employed from the cessation of the Job Retention Scheme on 31 October through to 31 January 2021.
Further spending interventions have included small business grant schemes, such as the Coronavirus Small Business Grant Fund, the coronavirus Retail, Hospitality and Leisure Grant Fund and the Coronavirus Local Authority Discretionary Grants Fund.
Meanwhile, taxation relief measures have included a business rates holiday for retail, hospitality and leisure businesses and a reduced rate of VAT of 5 per cent for hospitality, accommodation and attractions until 12 January 2021.
OBR’s central scenario
The OBR in its Fiscal Stability Report in July 2020 attempts to assess the wellbeing of the public finances not just in the short term but in the medium and longer term too. This longer-term perspective allows it to assess the sustainability of the public finances.
 Its analysis is based on some key assumptions, including population growth and future demands on public services, but, understandably, the timing of this report has necessitated some key assumptions around path of the economy, including the extent to which the economy will experience scarring effects, also known as hysteresis effects. While the analysis does not incorporate the Chancellor’s measures announced in its summer statement on the 8 July, including the kickstart scheme, job retention bonus and the reduced rate of VAT, which would have a material effect on this year’s numbers, the OBR concludes that there would be less significant impact on its medium-term analysis.
In what it describes as its ‘central scenario’ the OBR forecasts that national output (real GDP) will fall by 12 per cent in 2020 before growing by 9 per cent in 2021 and 4 per cent in 2022. National output therefore reaches its pre-virus peak at the end of 2022. However, 20 quarters on from the pandemic shock in Q1 2020 output is estimated to be 3.2 per cent less than it would otherwise have been, while the cumulative loss of output is expected to be 6.4 per cent over the period. The cumulative loss of output in the 20 quarters following the financial crisis (Q2 2008) is estimated to have been 9.3 per cent of actual cumulative output.
While national output is expected to be permanently lower because of the pandemic, consistent with hysteresis, the forecast assumes that the longer-term growth rate is unaffected. In other words, there is not expected to be what some now refer to as ‘super hysteresis’, whereby the scarring effects have persistent effects on rates of capital accumulation, innovation and productivity, which therefore depress structural economic growth rates.
Meanwhile, the unemployment rate is expected to peak at 11.9 per cent in the final quarter of this year, before falling to 8.8 per cent in Q4 2021 and 6.3 per cent in Q4 2022. By Q4 2025 the unemployment rate is forecast to be 5.1 per cent, one percentage point higher than the OBR was forecasting at the time of the Budget in March.
Spending and receipts
Chart 1 shows shows the predicted paths of (nominal) public-sector receipts and expenditures as a percentage of (nominal) GDP. Receipts are expected come in at £740 billion this financial year (excluding the impact of the summer statement measures), some £133 billion lower than was forecast at the time of the March budget. This will amount to a 10 per cent fall in receipts in the financial year, driven by a much-shrunken economy. However, the fact that nominal GDP falls somewhat more means that the receipts-to-GDP ratio ticks up slightly. (Click here for a PowerPoint of the chart.)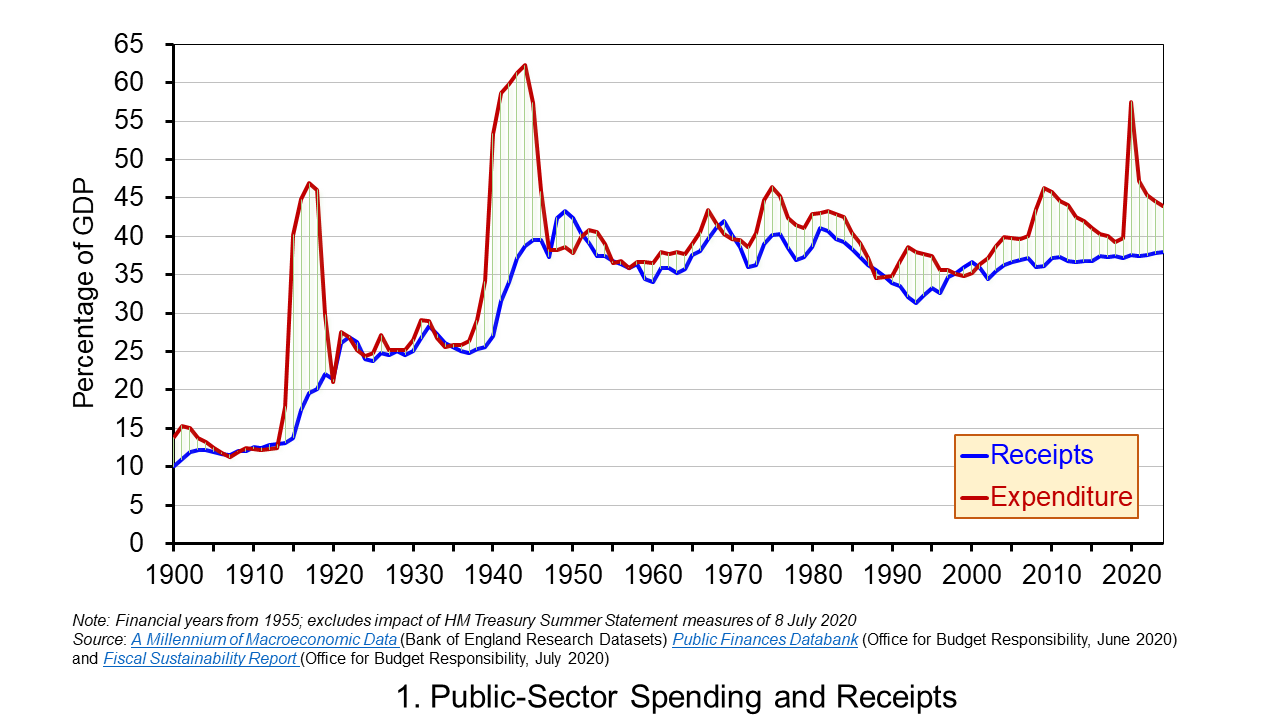
Public-sector spending is expected to be higher in 2020/21 than was forecast in the March by £135 million (excluding the summer statement measures) reflecting the COVID-19 interventions. This would result in spending rising to £1.06 trillion, a 20 per cent rise in the financial year. It would also mean that public-sector spending as a share of GDP rises to 54 per cent – its highest since 1945/46.
Going forward, in cash terms receipts are permanently lower than forecast because GDP is lower, though as a share of GDP cash receipts increase very slightly, but remain below what was expected at the time of the March budget. Spending in cash terms is expected to fall back by close to 8 per cent next financial year before increasing by 3 per cent per year up to 2024/25. This means that the spending-to-GDP ratio falls back to around 43 per cent by 2024/25, a couple of percentage points higher than was forecast back in March.
Deficits and debt
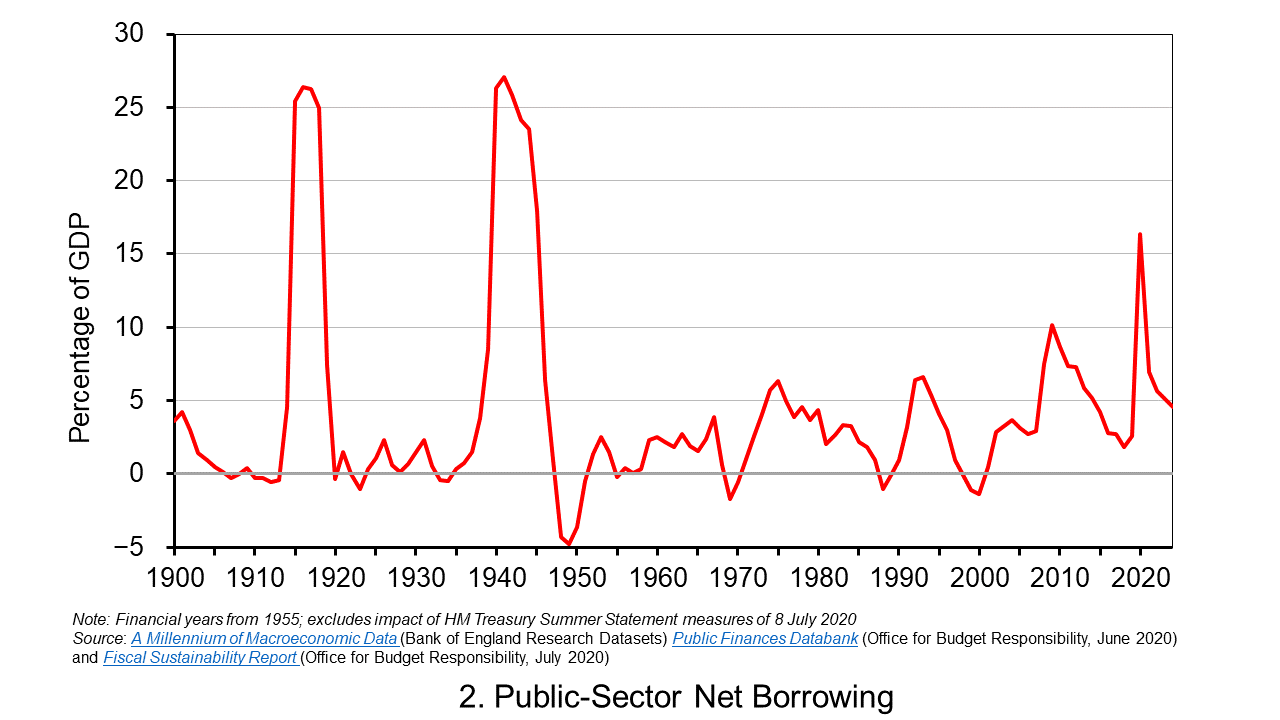
The difference between spending and receipts is known as public-sector net borrowing. While the extent of borrowing can be inferred by inspection of Chart 1, it can be seen more readily in Chart 2 which plots the path of public-sector net borrowing as a share of GDP.
The OBR is now forecasting a budget deficit of £322 billion (excluding the summer statement measures) in 2020/21 compared to £55 billion at the time of the March Budget. This would be equivalent to over 16 per cent of GDP, the highest since the Second World War. In a follow-up presentation on the Fiscal Stability Report on the 14 July the OBR suggested that the inclusion of summer statement measures could mean the deficit being as high as £375 billion, implying a deficit-to-GDP ratio of just shy of 19 per cent. (Click here for a PowerPoint of the chart.)
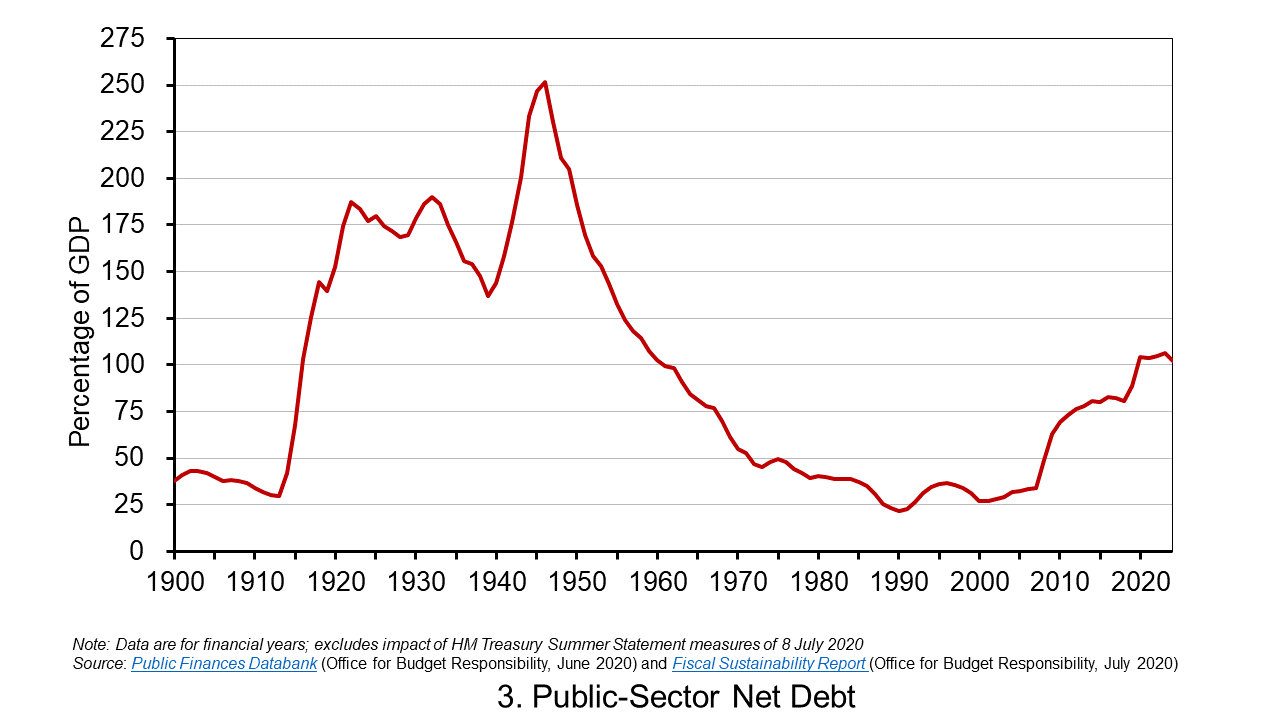
Deficits represent borrowing and are therefore a flow concept. The accumulated deficits over the years (minus any surpluses) gives total debt, which is a stock concept. The public-sector’s net debt is its gross debt less its liquid assets, principally deposits held with financial institutions and holdings of international reserves. This is also affected by Bank of England interventions, such as the Term Funding Scheme which enables banks and building societies to borrow funds at close to Bank Rate for up to four years. Nonetheless, the key driver of net debt-to-GDP ratio going forward is the persistence of deficits.
Chart 3 shows the expected path of the net debt-to-GDP ratio. The OBR expects this to exceed 100 per cent in 2020/21 for the first time since 1960/61. This reflects an increase in cash terms of the stock of net debt to £2.2 trillion, up from £1.8 trillion at the end of 2019/20, as well as a fall in GDP. By 2024/25 the net debt stock is expected to have risen to £2.6 trillion, £600 billion more than expected at the time of the March budget, with the net debt-to-GDP ratio still above 100 per cent at 102.1 per cent. (Click herefor a PowerPoint of the chart.)
Sustainability
The higher debt-to-GDP ratio raises longer-term questions about the sustainability of the public finances. The government is currently reviewing its fiscal rules and is expected to report back in time for the autumn budget. A key question is what debt-stabilising level might be considered appropriate. Is it the 102 per cent that the OBR is predicting at the end of 2024/25 (the medium-term horizon)? Or is it the 75 per cent that was being forecast for this point back in the March budget? This has profound implications for the fiscal arithmetic and, specifically, for the primary balance (the difference between non-interest spending and receipts) that the public sector needs to run.
If the government accepts a higher debt-to-GDP ratio as a ‘new norm’ that eases the fiscal arithmetic somewhat. However, some economists would be concerned about the economic consequences of larger public-sector debts, most notably so-called potential crowding-out effects on private-sector investment if upward pressure on interest rates was to materialise (see the news item MMT – a Magic Money Tree or Modern Monetary Theory?).
Even if the higher stabilising debt level was deemed appropriate, the OBR’s report analysis suggests problems in the government meeting this because it could still be running a primary deficit of 3.7 per cent of GDP by 2024/25. Therefore, even with interest rates expected to be lower than economic growth rates in 2024/25 (a negative growth-corrected interest rate) that enable governments to run primary deficits and yet maintain debt-to-GDP ratios, the debt-stabilising primary deficit for 2024/25 is estimated at only 3.2 per cent. All in all, this points to difficult fiscal choices ahead.
Articles
Questions
- What do you understand by the term financial wellbeing? What might this mean in respect of the government?
- What is meant by the fiscal arithmetic of government debt? Explain the factors that determine the fiscal arithmetic and the path of government debt?
- What is the difference between an increase in the size of a government deficit and an increase in the stock of government debt?
- Discuss the economic argument that, following the COVID-19 pandemic, government should avoid a return to an agenda of fiscal austerity ?
- What is the difference between the budget deficit, the primary deficit and the structural deficit?
- What are hysteresis effects? Discuss their relevancy in the design of the UK’s COVID-19 interventions.