 With many countries experiencing low growth some 12 years after the financial crisis and with new worries about the effects of the coronavirus on output in China and other countries, some are turning to a Keynesian fiscal stimulus (see Case Study 16.6 on the student website). This may be in the form of tax cuts, or increased government expenditure or a combination of the two. The stimulus would be financed by increased government borrowing (or a reduced surplus).
The hope is that there will also be a longer-term supply-side effect which will boost potential national income. This could be through tax reductions creating incentives to invest or work more efficiently; or it could be through increased capacity from infrastructure spending, whether on transport, energy, telecommunications, health or education.
In the UK, the former Chancellor, Sajid Javid, had adopted a fiscal rule similar to the Golden Rule adopted by the Labour government from 1997 to 2008. This stated that, over the course of the business cycle, the government should borrow only to invest and not to fund current expenditure. Javid’s rule was that the government would balance its current budget by the middle of this Parliament (i.e. in 2 to 3 years) but that it could borrow to invest, provided that this did not exceed 3% of GDP. Previously this limit had been set at 2% of GDP by the former Chancellor, Philip Hammond. Using his new rule, it was expected that Sajid Javid would increase infrastructure spending by some £20 billion per year. This would still be well below the extra promised by the Labour Party if they had won the election and below what many believe Boris Johnson Would like.
 Sajid Javid resigned at the time of the recent Cabinet reshuffle, citing the reason that he would have been required to sack all his advisors and use the advisors from the Prime Minister’s office. His successor, the former Chief Secretary to the Treasury, Rishi Sunak, is expected to adopt a looser fiscal rule in his Budget on March 11. This would result in bigger infrastructure spending and possibly some significant tax cuts, such as a large increase in the threshold for the 40% income tax rate.
A Keynesian stimulus would almost certainly increase the short-term economic growth rate as inflation is low. However, unemployment is also low, meaning that there is little slack in the labour market, and also the output gap is estimated to be positive (albeit only around 0.2%), meaning that national income is already slightly above the potential level.
 Whether a fiscal stimulus can increase long-term growth depends on whether it can increase capacity. The government hopes that infrastructure expenditure will do just that. However, there is a long time lag between committing the expenditure and the extra capacity coming on stream. For example, planning for HS2 began in 2009. Phase 1 from London to Birmingham is currently expected to be operation not until 2033 and Phase 2, to Leeds and Manchester, not until 2040, assuming no further delays.
Crossrail (the new Elizabeth line in London) has been delayed several times. Approved in 2007, with construction beginning in 2009, it was originally scheduled to open in December 2018. It is now expected to be towards the end of 2021 before it does finally open. Its cost has increased from £14.8 billion to £18.25 billion.
Of course, some infrastructure projects are much quicker, such as opening new bus routes, but most do take several years.
The first five articles look at UK policy. The rest look at Keynesian fiscal policies in other countries, including the EU, Russia, Malaysia, Singapore and the USA. Governments seem to be looking for a short-term boost to aggregate demand that will increase short-term GDP, but also have longer-term supply-side effects that will increase the growth in potential GDP.
Articles
Questions
- Illustrate the effect of an expansionary fiscal policy with a Keynesian Cross (income and expenditure) diagram or an injections and withdrawals diagram.
- What is meant by the term ‘output gap’? What are the implications of a positive output gap for expansionary Keynesian policy?
- Assess the benefits of having a fiscal rule that requires governments to balance the current budget but allows borrowing to invest.
- Would there be a problem following such a rule if there is currently quite a large positive output gap?
- To what extent are the policies being proposed in Russia, the EU, Malaysia and Singapore short-term demand management policies or long-term supply-side policies?
 Elections are times of peak deception. Political parties have several ways in which they can use data to persuade people to vote for them. At one extreme, they can simply make up ‘facts’ – in other words, they can lie. There have been various examples of such lies in the run-up to the UK general election of 12 December 2019. The linked article below gives some examples. But data can be used in other deceptive ways, short of downright lies.
Politicians can use data in two ways. First, statistics can be used to describe, explain and interpret the past. Second, they can be used as the basis of forecasts of the future effects of policies.
In terms of past data, one of the biggest means of deception is the selective use of data. If you are the party currently in power, you highlight the good news and ignore the bad. You do the reverse if you are currently in opposition. The data may be correct, but selective use of data can give a totally false impression of events.
In terms of forecast data, you highlight those forecasts, or elements of them, that are favourable to you and ignore those that are not.
 Politicians rely on people’s willingness to look selectively at data. People want to see ‘evidence’ that reinforces their political views and prejudices. News media know this and happily do the same as politicians, selectively using data favourable to their political leanings. And it’s not just newspapers that do this. There are many online news sites that feed their readers with data supportive of their position. And there are many social media platforms, where people can communicate with people in their political ‘bubble’.
Genuine fact-checking sites can help, as can independent forecasters, such as the Institute for Fiscal Studies. But too many voters would rather only look at evidence, genuine or not, that supports their political point of view.
This can make life hard for economists who seek to explain the world with an open mind, based on a non-biased use of evidence – and hard for economic forecasters, who want to use full and accurate data in their models and to make realistic assumptions, emphasising that their forecasts are only the most likely outcome, not a certainty. As the article states:
Economic forecasts are flawed and their limitations should be acknowledged. But they should not be blindly dismissed as fake facts. And as far as political debate and discourse is concerned, in the long run, the truth may will out.
Article
Questions
- Give some specific examples of ways in which politicians misuse data.
- Give some specific examples of ways in which politicians misuse the analysis of economists.
- Distinguish between positive and normative statements? Should economists make policy recommendations? If so, in what context?
- Why are economic forecasts flawed, but why should they not be dismissed as ‘fake facts’?
- Examine the manifestos of two political parties and provide a critique of their economic analysis.
 Economists are often criticised for making inaccurate forecasts and for making false assumptions. Their analysis is frequently dismissed by politicians when it contradicts their own views.
But is this fair? Have economists responded to the realities of the global economy and to the behaviour of people, firms, institutions and government as they respond to economic circumstances? The answer is a qualified yes.
Behavioural economics is increasingly challenging the simple assumption that people are ‘rational’, in the sense that they maximise their self interest by weighing up the marginal costs and benefits of alternatives open to them. And macroeconomic models are evolving to take account of a range of drivers of global growth and the business cycle.
 The linked article and podcast below look at the views of 2019 Nobel Prize-winning economist Esther Duflo. She has challenged some of the traditional assumptions of economics about the nature of rationality and what motivates people. But her work is still very much in the tradition of economists. She examines evidence and sees how people respond to incentives and then derives policy implications from the analysis.
Take the case of the mobility of labour. She examines why people who lose their jobs may not always move to a new one if it’s in a different town. Partly this is for financial reasons – moving is costly and housing may be more expensive where the new job is located. Partly, however, it is for reasons of identity. Many people are attached to where they currently live. They may be reluctant to leave family and friends and familiar surroundings and hope that a new job will turn up – even if it means a cut in wages. This is not irrational; it just means that people are driven by more than simply wages.
Duflo is doing what economists typically do – examining behaviour in the light of evidence. In her case, she is revisiting the concept of rationality to take account of evidence on what motivates people and the way they behave.
 In the light of workers’ motivation, she considers the implications for the gains from trade. Is free trade policy necessarily desirable if people lose their jobs because of cheap imports from China and other developing countries where labour costs are low?
The answer is not a clear yes or no, as import-competing industries are only part of the story. If protectionist policies are pursued, other countries may retaliate with protectionist policies themselves. In such cases, people working in the export sector may lose their jobs.
She also looks at how people may respond to a rise or cut in tax rates. Again the answer is not clear cut and an examination of empirical evidence is necessary to devise appropriate policy. Not only is there an income and substitution effect from tax changes, but people are motivated to work by factors other than take-home pay. Likewise, firms are encouraged to invest by factors other than the simple post-tax profitability of investment.
Podcast
Article
Questions
- In traditional ‘neoclassical’ economics, what is meant by ‘rationality’ in terms of (a) consumer behaviour; (b) producer behaviour?
- How might the concept of rationality be expanded to take into account a whole range of factors other than the direct costs and benefits of a decision?
- What is meant by bounded rationality?
- What would be the effect on workers’ willingness to work more or fewer hours as a result of a cut in the marginal income tax rate if (a) the income effect was greater than the substitution effect; (b) the substitution effect was greater than the income effect? Would your answers to (a) and (b) be the opposite in the case of a rise in the marginal income tax rate?
- Give some arguments that you consider to be legitimate for imposing controls on imports in (a) the short run; (b) the long run. How might you counter these arguments from a free-trade perspective?
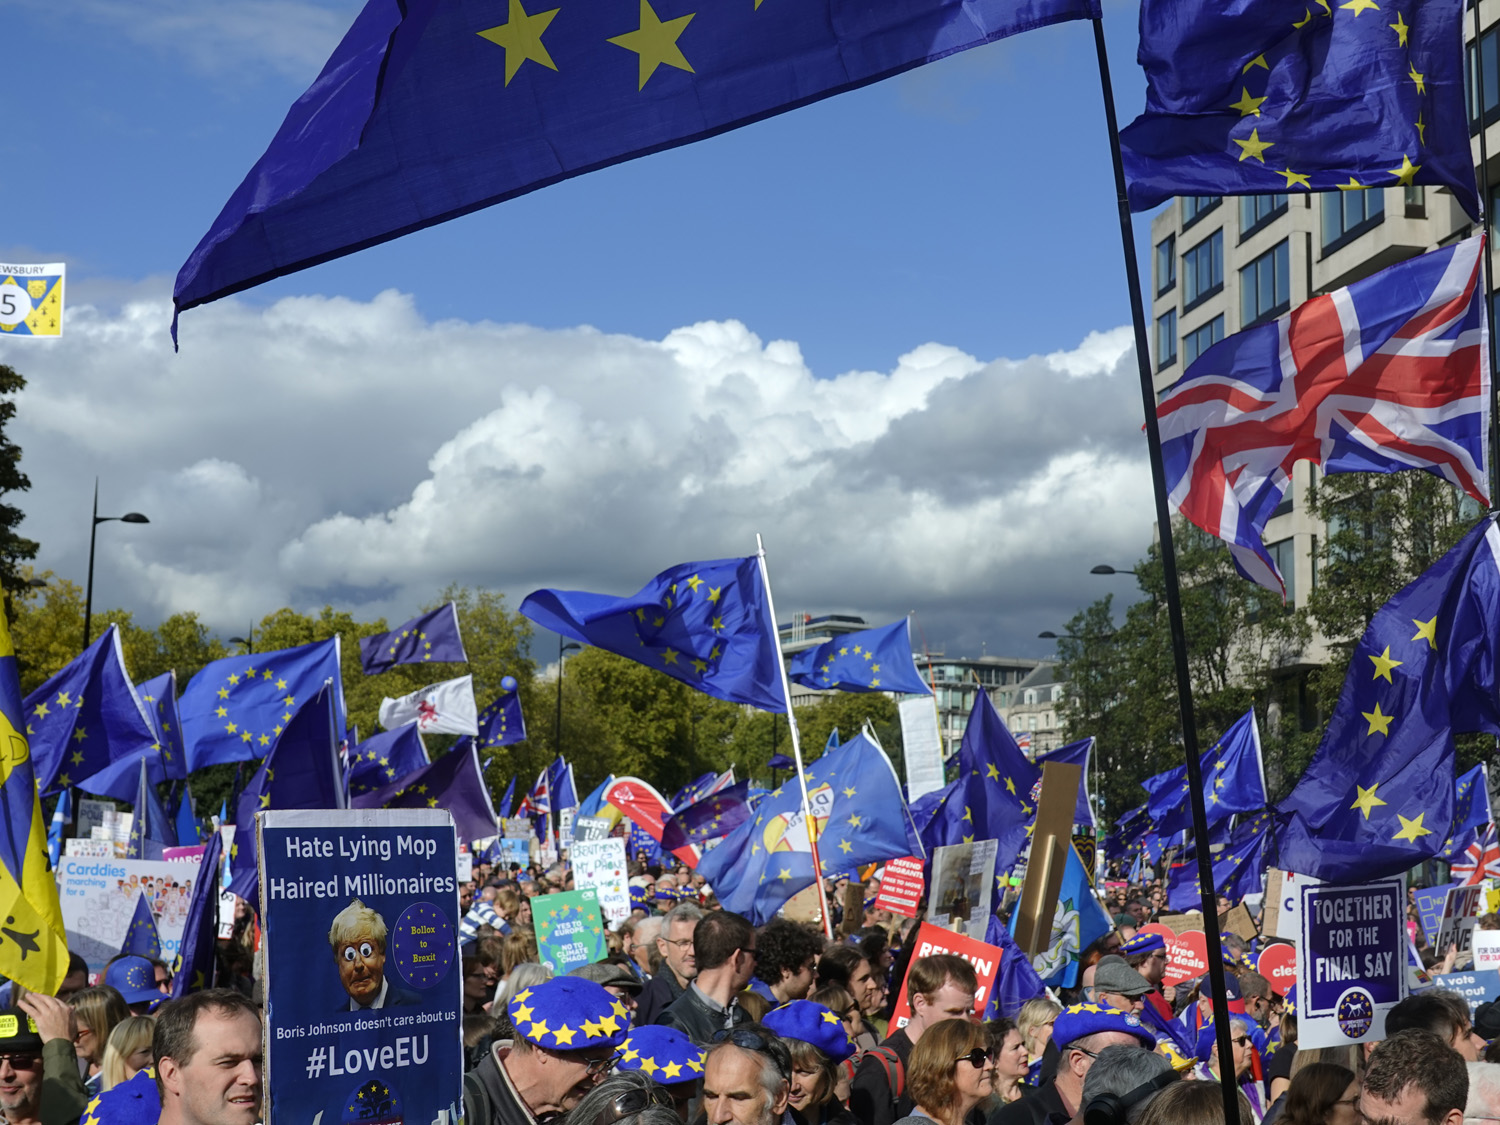 A general election has been called in the UK for 12 December. Central to the debates between the parties will be their policy on Brexit.
They range from the Liberal Democrats’, Plaid Cymru’s and Sinn Féin’s policy of cancelling Brexit and remaining in the EU, to the Scottish Nationalists’ and Greens’ policy of halting Brexit while a People’s Vote (another referendum) is held, with the parties campaigning to stay in the EU, to the Conservative Party’s policy of supporting the Withdrawal Agreement and Political Declaration negotiated between the Boris Johnson government and the EU, to the DUP which supports Brexit but not a version which creates a border between Great Britain and Northern Ireland, to the Brexit Party and UKIP which support leaving the EU with no deal (what they call a ‘clean break’) and then negotiating individual trade deals on a country-by-country basis.
The Labour Party also supports a People’s Vote, but only after renegotiating the Withdrawal Agreement and Political Declaration, so that if Brexit took place, the UK would have a close relationship with the single market and remain in a customs union. Also, various laws and regulations on environmental protection and workers’ rights would be retained. The referendum would take place within six months of the election and would be a choice between this new deal and remain.
But what are the economic costs and benefits of these various alternatives? Prior to the June 2016 referendum, the Treasury costed various scenarios. After 15 years, a deal would make UK GDP between 3.4% and 7.8% lower than if it remained in the EU, depending on the nature of the deal. No deal would make GDP between 5.4% and 9.5% lower.
Then in November 2018, the Treasury published analysis of the original deal negotiated by Theresa May in July 2018 (the ‘Chequers deal’). It estimated that GDP would be up to 3.9% lower after 15 years than it would have been if the UK had remained in the EU. In the case of a no-deal Brexit, GDP would be up to 9.3% lower after 15 years.
When asked for Treasury forecasts of the effects of Boris Johnson’s deal, the Chancellor, Sajid Javid, said that the Treasury had not been asked to provide forecasts as the deal was “self-evidently in our economic interest“.
 Other forecasters, however, have analysed the effects of the Johnson deal. The National Institute for Economic and Social Research (NIESR), the UK’s longest established independent economic research institute, has estimated the costs of various scenarios, including the Johnson deal, the May deal, a no-deal scenario and also a scenario of continuing uncertainty with no agreement over Brexit. The NIESR estimates that, under the Johnson deal, with a successful free-trade agreement with the EU, in 10 years’ time UK GDP will be 3.5% lower than it would be by remaining in the EU. This represents a cost of £70 billion. The costs would arise from less trade with the EU, lower inward investment, slower growth in productivity and labour shortages from lower migration. These would be offset somewhat by savings on budget contributions to the EU.
Under Theresa May’s deal UK GDP would be 3.0% lower (and thus slightly less costly than Boris Johnson’s deal). Continuing in the current situation with chronic uncertainty about whether the UK would leave or remain would leave the UK 2% worse off after 10 years. In other words, uncertainty would be less damaging than leaving. The costs from the various scenarios would be in addition to the costs that have already occurred – the NIESR estimates that GDP is already 2.5% smaller than it would have been as a result of the 2016 Brexit vote.
Another report also costs the various scenarios. In ‘The economic impact of Boris Johnson’s Brexit proposals’, Professors Anand Menon and Jonathan Portes and a team at The UK in a Changing Europe estimate the effects of a decline in trade, migration and productivity from the various scenarios – again, 10 years after new trading arrangements are in place.  According to their analysis, UK GDP would be 4.9%, 6.4% and 8.1% lower with the May deal, the Johnson deal and no deal respectively than it would have been from remaining in the EU.
But how much reliance should we put on such forecasts? How realistic are their assumptions? What other factors could they have taken into account? Look at the two reports and at the articles discussing them and then consider the questions below which are concerned with the nature of economic forecasting.
Articles
- UK’s new Brexit deal worse than continued uncertainty – NIESR
Reuters, David Milliken (30/10/19)
- Brexit deal means ‘£70bn hit to UK by 2029′
BBC News, Faisal Islam (30/10/19)
- Boris Johnson’s Brexit deal worse for economy than Theresa May’s, new analysis shows
Politics Home, Matt Honeycombe-Foster (30/10/19)
- Boris Johnson’s Brexit deal ‘would cost UK economy £70bn’
The Guardian, Richard Partington (30/10/19)
- UK economy suffers ‘slow puncture’ as general election is called
ITV News, Joel Hills (30/10/19)
 Boris Johnson’s Brexit deal ‘would deliver £70bn hit to economy by 2029’
Sky News, Ed Conway (30/10/19)
- Boris Johnson’s Brexit deal won’t cost Britain £70bn by 2029
The Spectator, Ross Clark (30/10/19)
- Boris Johnson’s Brexit deal would make people worse off than Theresa May’s
The Guardian, Anand Menon and Jonathan Portes (13/10/19)
- How Boris Johnson’s hard Brexit would hit the UK economy
Financial Times, Chris Giles (13/10/19)
- Boris Johnson’s Brexit deal is worse for the UK economy than Theresa May’s, research suggests
CNBC, Elliot Smith (19/10/19)
Reports
Questions
- What are the arguments in favour of the assumptions and analysis of the two recent reports considered in this blog?
- What are the arguments against the assumptions and analysis of the two reports?
- How useful are forecasts like these, given the inevitable uncertainty surrounding (a) the outcome of negotiations post Brexit and (b) the strength of the global economy?
- If it could be demonstrated beyond doubt to everyone that each of the Brexit scenarios meant that UK GDP would be lower than if it remained in the EU, would this prove that the UK should remain in the EU? Explain.
- If economic forecasts turn out to be inaccurate, does this mean that economists should abandon forecasting?
 The latest UK house price index reveals that annual house price growth in the UK slowed to just 1.2 per cent in May. This is the lowest rate of growth since January 2013. This is being driven, in part, by the London market where annual house price inflation rates have now been negative for 15 consecutive months. In May the annual rate of house price inflation in London fell to -4.4 per cent, it lowest since August 2009 as the financial crisis was unfolding. However, closer inspection of the figures show that while many other parts of the country continue to experience positive rates of annual house price inflation, once general inflation is accounted for, there is widespread evidence of widespread real house price deflation.
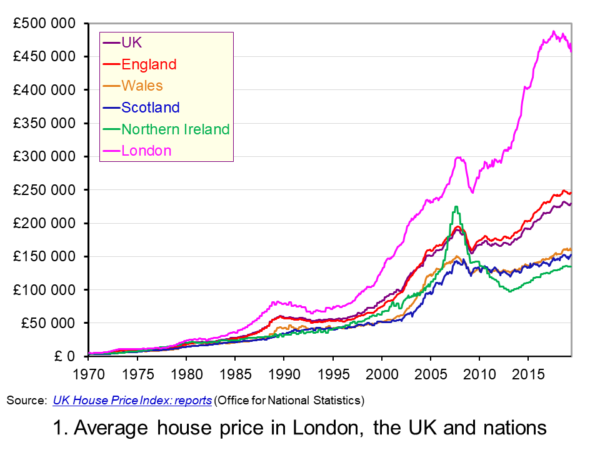 The average UK house price in May 2019 was £229,000. As Chart 1 shows, this masks considerable differences across the UK. In England the average price was £246,000 (an annual increase of 1.0 per cent), in Scotland it was £153,000 (an increase of 2.8 per cent), in Wales £159,000 (an increase of 3.0 per cent) and in Northern Ireland it was £137,000 (an increase of 2.1 per cent). (Click here to download a PowerPoint copy of the chart.)
The London market distorts considerably the English house price figures. In London the average house price in May 2019 was £457,000 (an annual decrease of 4.4 per cent). House prices were lowest in the North East region of England at £128,000. The North East was the only other English region alongside London to witness a negative rate of annual house price inflation, with house prices falling in the year to May 2019 by 0.7 per cent.
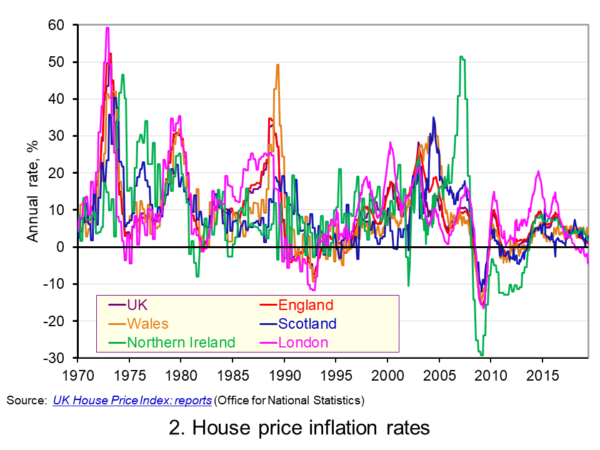 Chart 2 allows us to see more readily the rates of house price growth. It plots the annual rates of house price inflation across London, the UK and its nations. What is readily apparent is the volatility of house price growth. This is evidence of frequent imbalances between the flows of property on to the market to sell (instructions to sell) and the number of people looking to buy (instructions to buy). An increase in instructions to buy relative to those to sell puts upwards pressure on prices whereas an increase in the relative number of instructions to sell puts downward pressure on prices. (Click here to download a PowerPoint copy of the chart.)
Despite the volatility in house prices, the longer-term trend in house prices is positive. The average annual rate of growth in house prices between January 1970 and May 2019 in the UK is 9.1 per cent. For England the figure is 9.4 per cent, for Wales 8.8 per cent, for Scotland 8.5 per cent and for Northern Ireland 8.3 per cent. In London the average rate of growth is 10.4 per cent per annum.
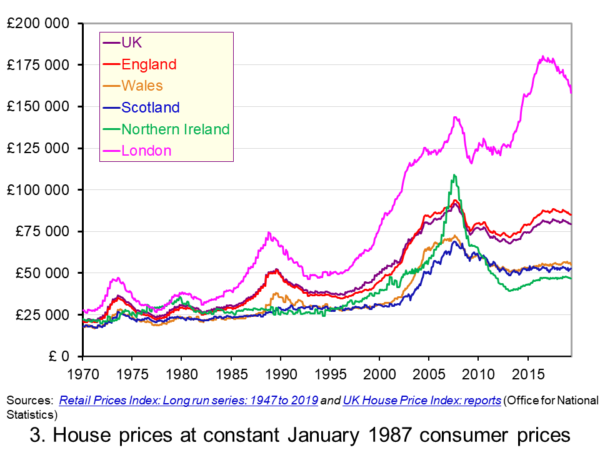 As Chart 3 illustrates, the longer-term growth in actual house prices cannot be fully explained by the growth in consumer prices. It shows house price values as if consumer prices, as measured by the Retail Prices Index (RPI), were fixed at their January 1987 levels. We see real increases in house prices or, expressed differently, in house prices relative to consumer prices. In real terms, UK house prices were 3.6 times higher in May 2019 compared to January 1970. For England the figure is 4.1 times, for Wales 3.1 times, for Scotland 2.9 times and for Northern Ireland 2.1 times. In London inflation-adjusted house prices were 5.7 times higher. (Click here to download a PowerPoint copy of the chart.)
The volatility in house prices continues to be evident when adjusted for changes in consumer prices. The UK’s annual rate of real house price inflation was as high as 40 per in January 1973, yet, on the other hand, in June 1975 inflation-adjusted house prices were 16 per cent lower than a year earlier. Over the period from January 1970 to May 2019, the average annual rate of real house price inflation was 3.2 per cent. Hence house prices have, on average, grown at an annual rate of consumer price inflation plus 3.2 per cent.
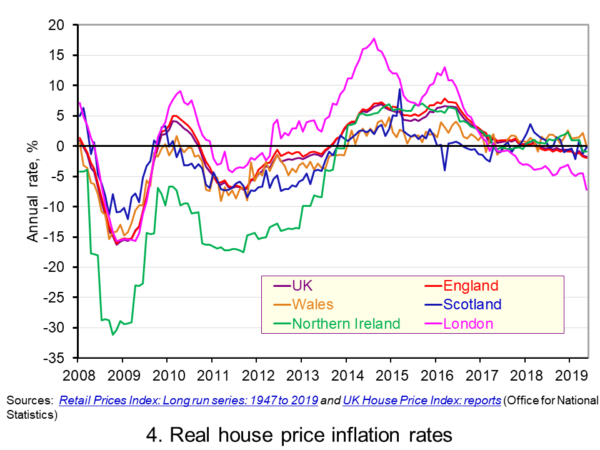 Chart 4 shows annual rates of real house price inflation since 2008 and, hence, from around the time the financial crisis began to unfold. The period is characterised by acute volatility and with real house prices across the UK falling at an annual rate of 16 per cent in 2009 and by as much 29 per cent in Northern Ireland. (Click here to download a PowerPoint copy of the chart.)
The UK saw a rebound in nominal and real house price growth in the period from 2013, driven by a strong surge in prices in London and the South East, and supported by government initiatives such as Help to Buy designed to help people afford to buy property. But house price growth then began to ease from early/mid 2016. Some of the easing may be partly due to any excessive fizz ebbing from the market, especially in London, and the impact on the demand for buy-to-let investments resulting from reductions in tax relief on interest payments on buy-to-let mortgages.
However, the housing market is notoriously sensitive to uncertainty, which is not surprising when you think of the size of the investment people are making when they enter the market. The uncertainty surrounding Brexit and the UK’s future trading relationships will have been a drag on demand and hence on house prices.
Chart 4 shows that by May 2019 all the UK nations were experiencing negative rates of real house price inflation, despite still experiencing positive rates of nominal house price inflation. In Wales the real annual house price inflation rate was -0.1 per cent, in Scotland -0.2 per cent, in Northern Ireland -0.9 per cent and in England -2.0 per cent. Meanwhile in London, where annual house price deflation has been evident for 15 consecutive months, real house prices in May 2019 were falling at an annual rate of 7.2 per cent.
Going forward the OBR’s Fiscal Risks Report predicts that, in the event of a no-deal, no-transition exit of the UK from the European Union, nominal UK house prices would fall by almost 10 per cent between the start of 2019 and mid-2021. This forecast is driven by the assumption that the UK would enter a year-long recession from the final quarter of 2019. It argues that property transactions and prices ‘move disproportionately’ during recessions. (See John’s blog The costs of a no-deal Brexit for a fuller discussion of the economics of a no-deal Brexit). The danger therefore is that the housing market becomes characterised by both nominal and real house price falls.
Articles
Questions
- Explain the difference between a rise in the rate of house price inflation a rise in the level of house prices.
- Explain the difference between nominal and real house prices.
- If nominal house prices rise can real house price fall? Explain your answer.
- What do you understand by the terms instructions to buy and instructions to sell?
- What factors are likely to affect the levels of instructions to buy and instructions to sell?
- How does the balance between instructions to buy and instructions to sell affect house prices?
- How can we differentiate between different housing markets? Illustrate your answer with examples.