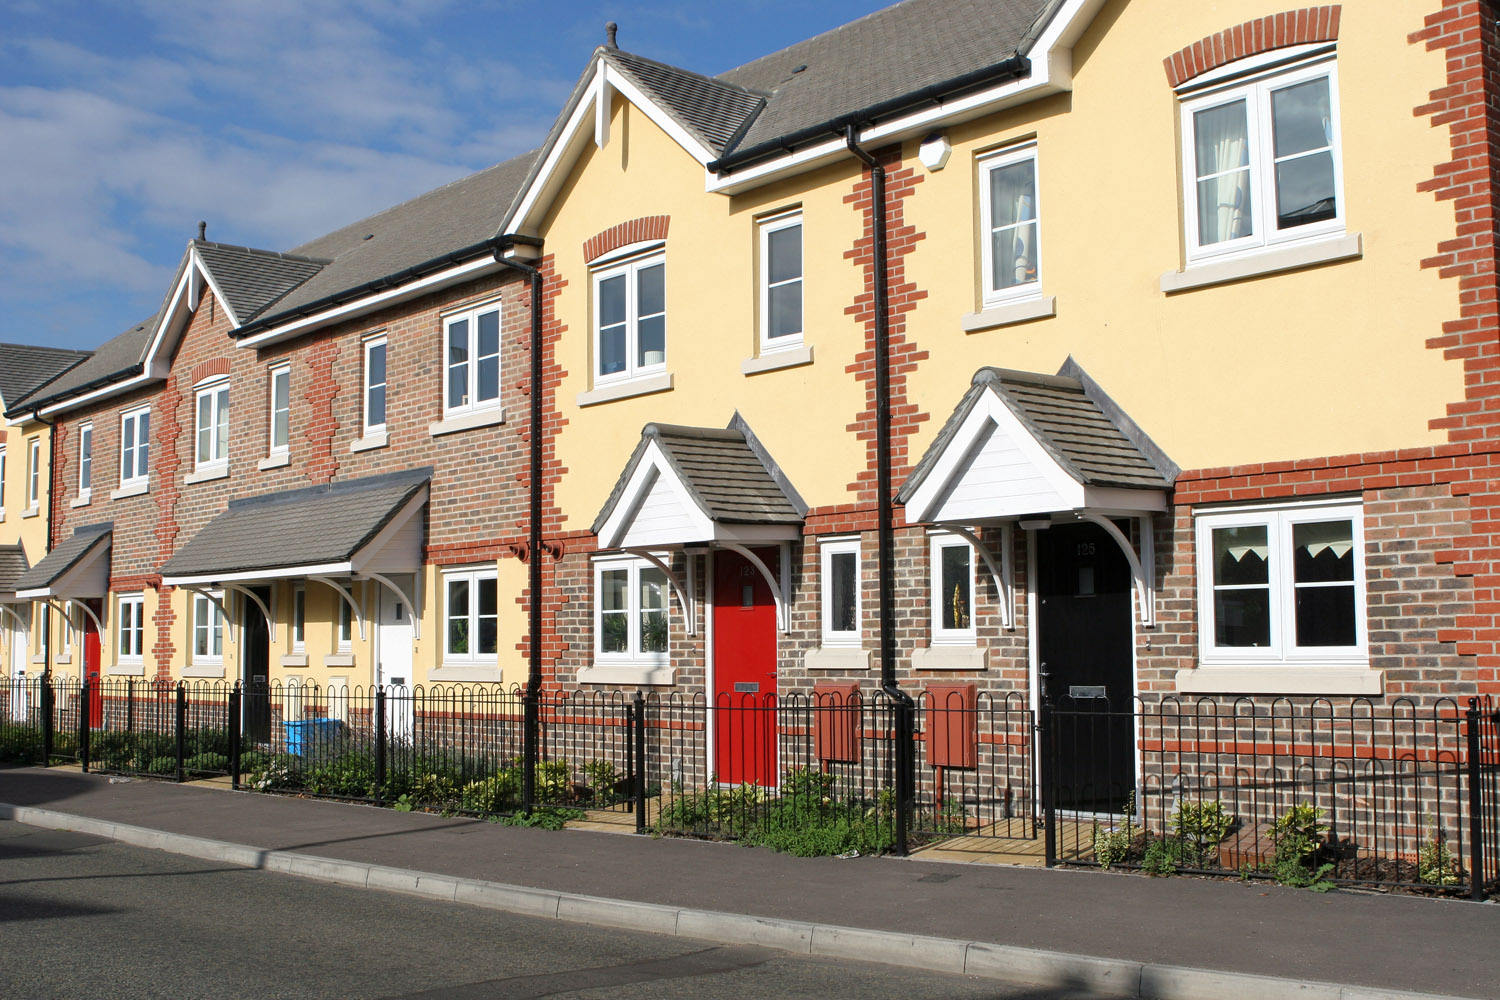
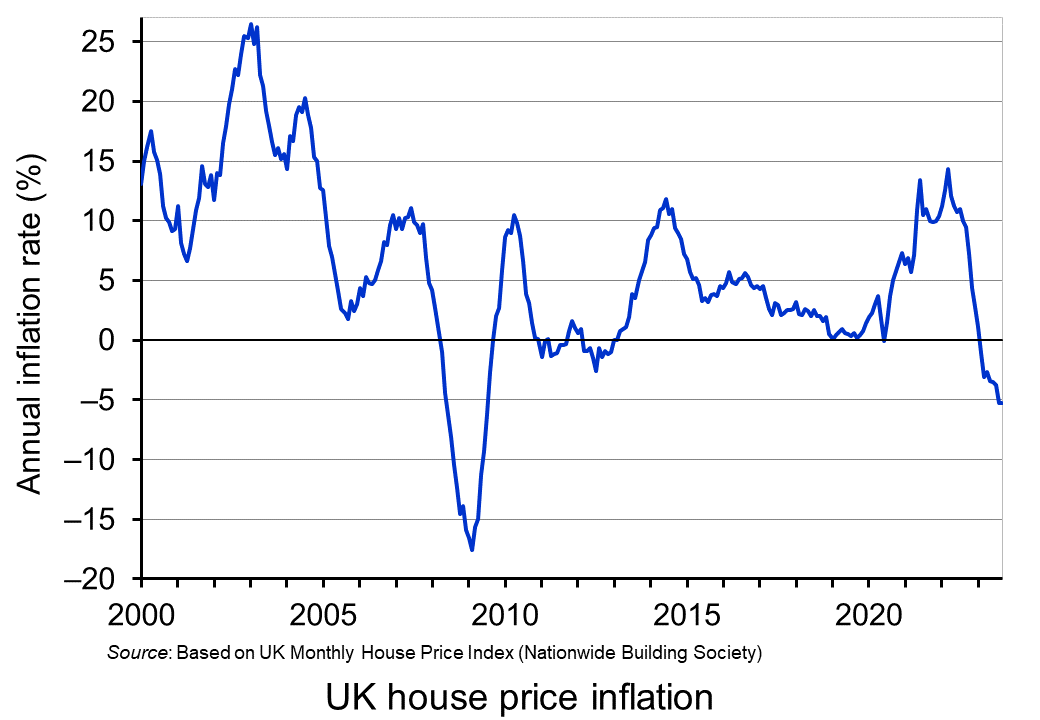
 UK house prices have been falling in recent months. According to the Nationwide Building Society, average UK house prices in September 2023 were 5.3% lower than in September 2022. This fall reflects the increasing cost of owning a home as mortgage rates have risen. The average standard variable rate mortgage was 3.61% in August 2021, 4.88% in August 2022 and 7.85% in August 2023. A two-year fixed rate mortgage with a 10% deposit had an interest rate of 2.48% in August 2021, 3.93% in August 2022 and 6.59% in August 2023. Thus over two years, mortgage rates have more than doubled. This has made house purchase less affordable and has dampened demand.
But do house prices simply reflect current affordability? Given the large increase in mortgage costs and the cost-of-living crisis, it might seem surprising that house prices have fallen so little. After all, from September 2019 to August 2023, the average UK house price rose by 27.1% (from £215 352 to £273 751). Since then it has fallen by only 5.8% (to £257 808 in September 2023). However, there are various factors that help to explain why house prices have not fallen considerably more.
 The first is that 74% of borrowers are on fixed-rate mortgages and 96% of new mortgages since 2019 have been at fixed rates. More than half of people with fixed rates have not yet had to renew their mortgage since interest rates began rising in December 2021. These people, therefore, have not yet been affected by the rise in mortgage interest rates.
The second is that interest rates are expected to peak and then fall. Even though by December 2024 another 2 million households will have had to renew their mortgage, those taking out new longer-term fixed rates may find that rates are lower than those on offer today. This could help to reduce the downward effect on house prices.
The third is that rents continue to rise, partly in response to the higher mortgage rates paid by landlords. With the price of this substitute product rising, this acts as an incentive for existing homeowners not to sell and existing renters to buy, even though they are facing higher mortgage payments.
The fourth is that house prices do not necessarily reflect the overall market equilibrium. People selling may hold out for a better price, hoping that they will eventually attract a buyer. Houses thus are taking longer to sell. This creates a glut of houses at above-equilibrium prices, with fewer sales taking place. At the same time, these higher prices depress demand. People would rather wait for a fall in house prices than pay the current asking price. This creates more of a ‘buyers’ market’, with some sellers being forced to sell well below the asking price. According to Zoopla (see linked article below), the average selling price is 4.2% below the asking price – the highest since 2019. Nevertheless, with sellers holding out and with reduced sales, actual sale prices have fallen less than if markets cleared.
 So will house prices continue to fall and will the rate of decline accelerate? This depends on confidence and affordability. With interest rates falling, confidence and affordability are likely to rise. This will help to arrest further price falls.
However, with large numbers of people still on low fixed rates but with these fixed terms ending over the coming months, for them interest rates will be higher and this could continue to have a dampening effect on demand. What is more, affordability is likely to rise only slowly and in the short term could fall further. Petrol and diesel prices remain high and home energy costs and food prices are still well above the levels of two years ago. Inflation generally is coming down only slowly. The higher prices plus a rising tax burden from fiscal drag1 will continue to squeeze household budgets. This will reduce the size of deposits and the monthly payments that house purchasers can afford.
Over the longer term, house prices are set to rise again. Lower interest rates, rising real incomes again and a failure of house building to keep up with the growth in the number of people seeking to buy houses will all contribute to this. However, over the next few months, house prices are likely to continue falling. But just how much is difficult to predict. A lot will depend on expectations about house prices and incomes, how quickly inflation falls and how quickly the Bank of England reduces interest rates.
1 With tax thresholds frozen, as people’s wages rise, so a higher proportion of their income is taxed and, for higher earners, a higher proportion is taxed at a higher rate. This automatically increases income tax as a proportion of income.
Articles
- House Price Index – September 2023
Zoopla, Richard Donnell (28/9/23)
- UK home sellers increase discounts to secure deals, Zoopla data shows
Financial Times, Joshua Oliver (28/9/23)
- Buyer’s market! House hunters bag £12k off average asking price, says Zoopla
This is Money, Jane Denton (28/9/23)
- House price growth remained weak in September
Nationwide HPI Reports (2/10/23)
- UK mortgage approvals hit six-month low as interest rates cool market
The Guardian, Phillip Inman (29/9/23)
- UK house prices are plummeting at the most rapid pace in over a decade
Euronews, Daniel Harper (2/10/23)
- House prices fall across all UK regions for first time since 2009
Financial Times, Valentina Romei (2/10/23)
- Will house prices fall in 2023?
The Times, Hannah Smith and Georgie Frost (4/10/23)
- First-time buyers in UK drop by a fifth as higher mortgage costs bite
The Guardian, Julia Kollewe (27/9/23)
- England worst place in developed world to find housing, says report
The Guardian, Robert Booth (5/10/23)
- UK homeowners face huge rise in payments when fixed-rate mortgages expire
The Guardian, Richard Partington (17/6/23)
- UK house prices: Where the cheapest areas to buy are, and how far prices could fall
i News, Zesha Saleem (29/9/23)
- Why are house prices falling?
Independent, Vicky Shaw (7/9/23)
Data
Questions
- Use a supply and demand diagram to illustrate the situation where house prices are above the equilibrium.
- Why does house price inflation/deflation differ (a) from one type of house (or flat) to another; (b) from one region of the economy/locality to another?
- Find out why house prices rose so much (a) in the early 2000s; (b) from 2020 to 2022.
- Find out why house prices fell so much from 2008 to 2010. Why was this fall so much greater than in recent months?
- Find out what is happening to house prices in two other developed countries of your choice. How does the current housing market in these countries differ from that in the UK?
- Paint possible scenarios (a) where UK house prices continue to fall by several percentage points; (b) begin to rise again very soon.
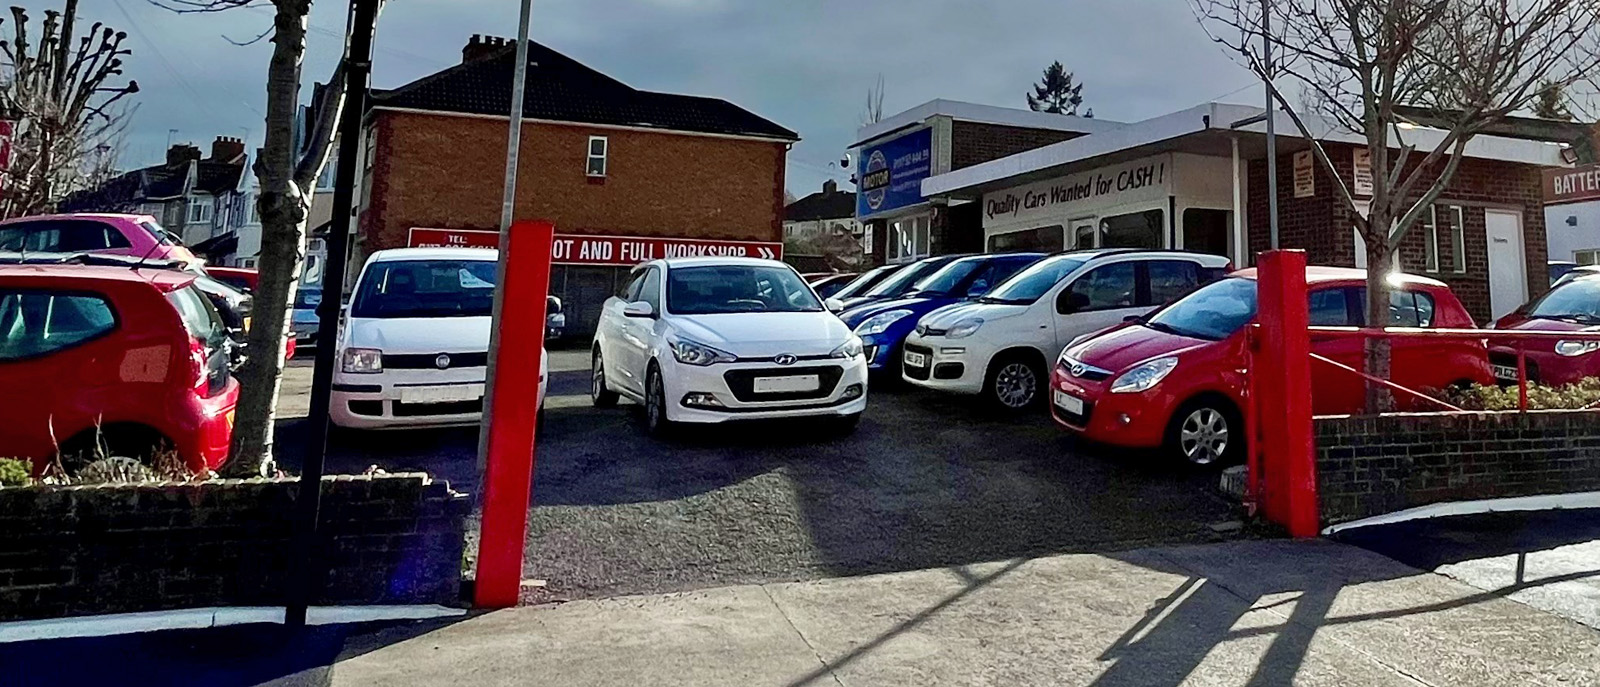 Prices of used fully electric cars (EVs) are falling in the UK, even though prices of used internal combustion engine (ICE) cars are rising. According to Auto Trader (see the first two articles below), in February 2023 the average price of used petrol cars rose by 3.3% compared with January and the price of used diesel cars rose by 1.4%. But the price of used EVs fell by 9.1%. This follows a fall of 2.1% in January.
But why are used EV prices falling? After all, the last few years has seen a drive to replace ICEs with EVs and hybrids, with many consumers preferring electric cars to petrol and diesel ones. What is more, vehicle excise duty is currently zero for EVs (and will be until 2025) and the sale of new ICEs will be banned from the end of the decade. The answer lies in demand and supply.
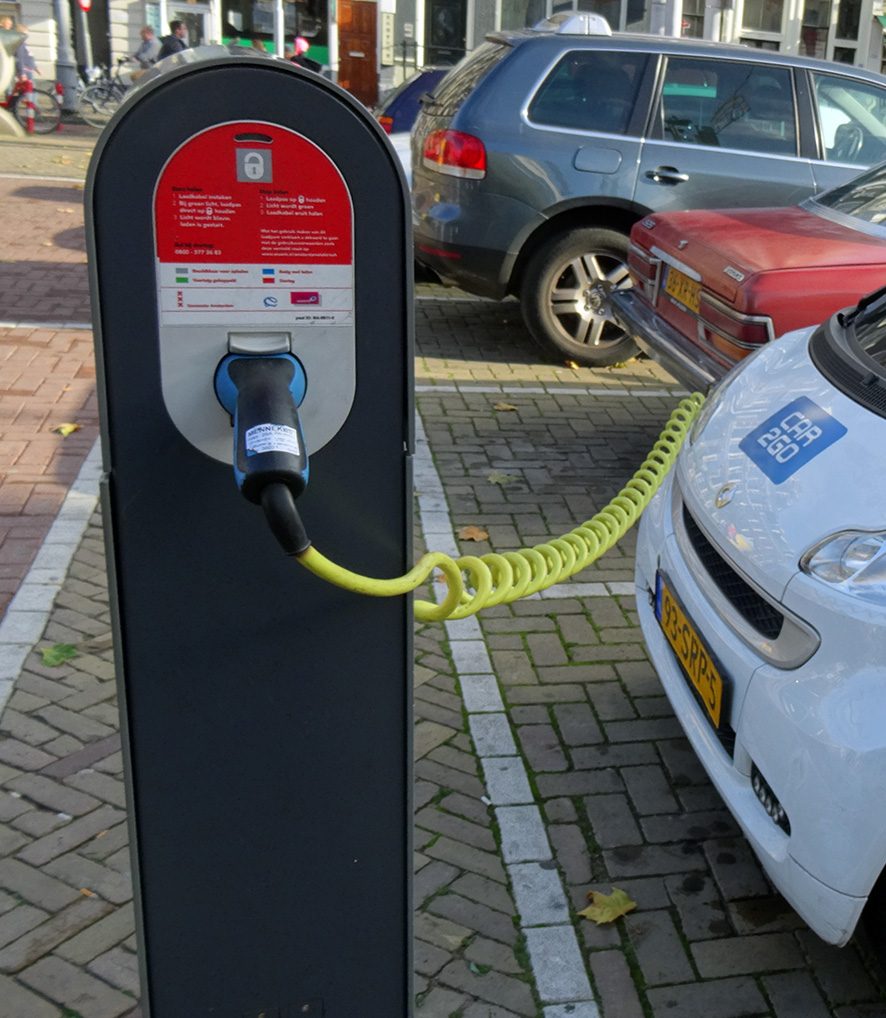 On the demand side, many existing and potential EV owners worry about the charging infrastructure. The number of EVs has grown more rapidly than the number of charging points. In 2020 there was one charging point per 16 cars; by 2022 this had worsened to one per 30 cars. Also the distribution of charging points is patchy and there is a lack of rapid and ultra-rapid chargers. Increasingly, people have to queue for access to a charger and this can substantially delay a journey and could mean missed appointments. There were many pictures in the media around Christmas of long queues for chargers at service stations and supermarkets. Poor charging infrastructure can be more of a problem for second-hand EVs, which tend to have a smaller range.
Also on the demand side is the price of fuel. After the Russian invasion of Ukraine and the rise in oil prices, the price of petrol and diesel soared. This increased the cost of running ICE vehicles and boosted the demand for EVs. But the war also drove up the price of natural gas and this price largely determines the wholesale price of electricity. With government subsidies for electricity, this constrained the rise in electricity prices. This made running an EV for a time comparatively cheaper. 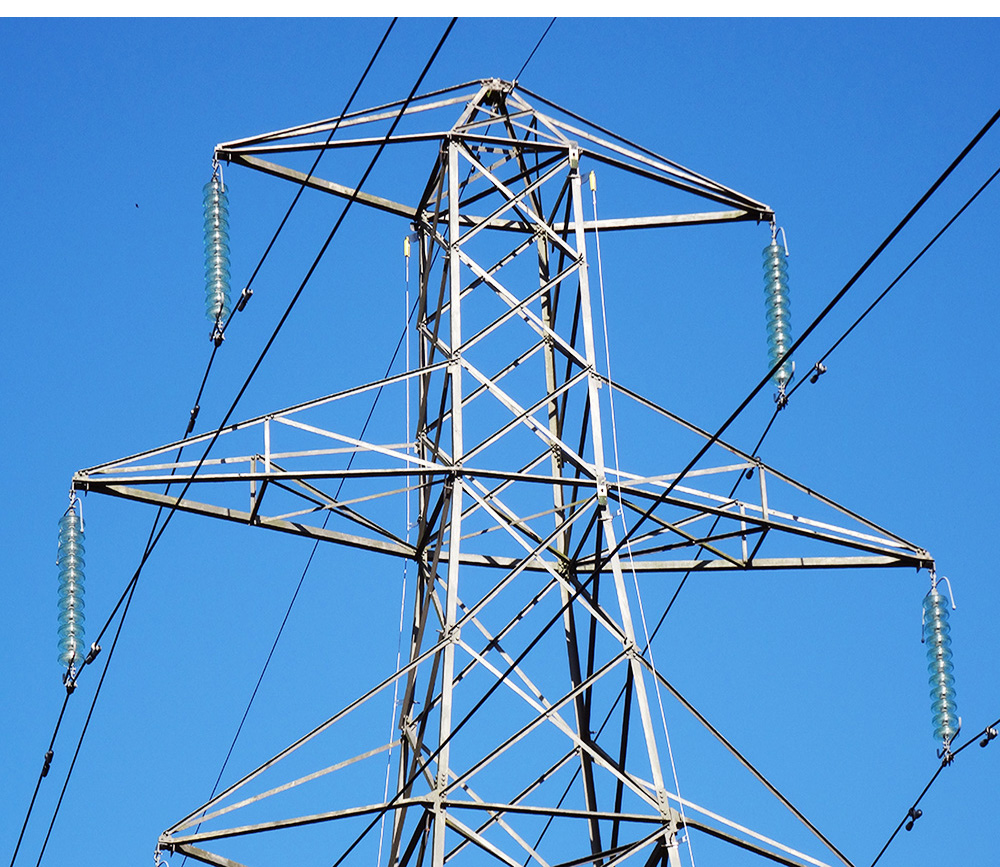 More recently, the price of oil has fallen and with it the price of petrol and diesel. But electricity prices are set to rise in April as government subsidies cease. The cost advantage of running an electric car is likely to disappear, or at least substantially decline.
Another substitute for second-hand EVs is new EVs. As the range of new EVs increases, then anyone thinking about buying an EV may be more tempted to buy a new one rather than a used one. Such demand has also been driven by Tesla’s decision to cut the UK prices of many of it models by between 10% and 13%.
The fall in demand for used EVs is compounded, at least in the short term, by speculation. People thinking of trading in their ICE or hybrid car for a fully electric one are likely to wait if they see prices falling. Why buy now if, by waiting, you could get the same model cheaper?
On the supply side, EV owners, faced with the infrastructure problems outlined above, are likely to sell their EV and buy an ICE or hybrid one instead. This increases the supply of used EVs. This is again compounded by speculation as people thinking of selling their EV do so as quickly as possible before price falls further.
In many other countries, there is much more rapid investment in charging infrastructure and/or subsidies for purchasing not only new but used EVs. This has prevented or limited the fall in price of used EVs.
Articles
- Auto Trader diagnoses used car sector’s ‘robust health’ after February value rise
AM-online, Tom Sharpe (20/2/23)
- Auto Trader: Used car prices UP AGAIN in February but EV prices continue to tumble
Car Dealer, James Baggott (20/2/23)
- Used electric car prices caught in vicious downward cycle as experts warn of trouble ahead
Car Dealer, James Baggott (13/2/23)
- Used EV market needs more support in Spring Budget, says Vehicle Remarketing Association
Car Dealer, Jack Williams (15/2/23)
- Middle classes cannot afford electric cars, warns Vauxhall owner
The Telegraph, Howard Mustoe (23/2/23)
- British drivers are hurtling towards the electric car cliff edge
The Telegraph on msn, Ben Marlow (23/2/23)
- Cars Drivers should be ‘cautious’ when buying a used EV before 2030 car ban – ‘still an issue!’
Express, Felix Reeves (12/2/23)
- Motorpoint revenues accelerate but dealership group issues profit warning as used electric car prices crash
This is Money, Camilla Canocchi (27/1/23)
- Tesla cuts prices by up to a fifth to boost demand
BBC News, Lucy Hooker (13/1/23)
Questions
- Draw a supply and demand diagram to illustrate what has been happening in the market for used EVs.
- How has the price elasticity of (a) demand and (b) supply affected the amount by which used EV prices have fallen?
- Identify substitutes and complements for used electric vehicles. How relevant is the cross-price elasticity of demand for these complements and substitutes in determining price changes of used EVs?
- Draw a diagram to illustrate the effect of speculation on used EV prices.
- What is likely to happen to used EV prices in the months ahead? Explain.
- How are externalities in car usage relevant to government action to influence the market for EVs? What should determine the size of this intervention?
- Devise a short survey for people thinking of buying an EV to determine the factors that are likely to affect their decision to buy one and, if so, whether to buy a new or used one.
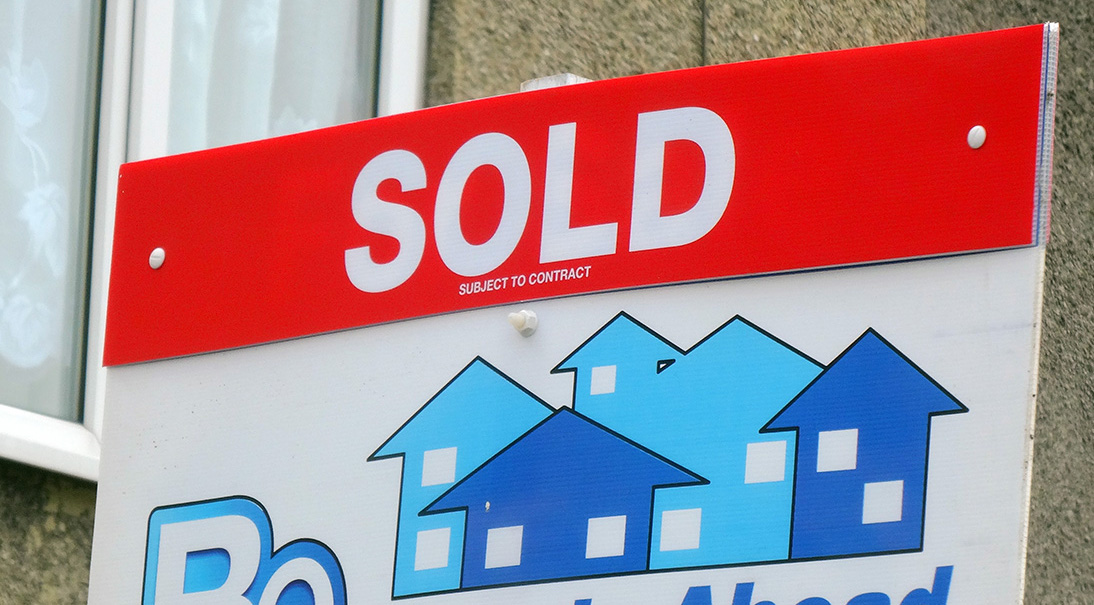 In July this year, the UK saw the highest annual house price inflation rate since May 2003. The housing market is experiencing an excess demand for houses. There is a greater demand from buyers than there are homes for sale. This has led to a double-digit annual rise for the 10th consecutive month. Nationwide building society data show that UK house prices rose by 10% in the year to August 2022, with the typical property price rising by £50 000 in the past two years to £273 751.
The market has seen this continued growth in house prices despite the growing pressure on buyers’ budgets. It is even reported that estate agents are seeing a recent surge in activity. However, can the housing market continue to grow, or will we witness a crash?
House market activity
There are also signs that the housing market is now losing some momentum. According to the Nationwide, the average price of a home was £294 260 in August, 0.4% higher than the previous month. Although this marked another record high, the rise was less than earlier in the year. Halifax called the monthly rise ‘relatively modest’ compared with the rapid house price inflation that has been seen in recent times, where the average monthly increase in house prices has been 0.9%. The latest increase marked a return to growth for house prices, after they fell in July for the first time in more than a year.
However, the annual growth did slow in August, despite house prices still growing. The annual rate of house price growth dropped to 11.5% from 11.8% in July – the lowest level in three months. The Nationwide is predicting that an increase in energy costs and rising mortgage interest rates will add to the pressure on household budgets in the coming months. Energy prices are continually rising, and it is suggested that the least energy-efficient properties could typically see bills surge by £2700 a year, or £225 a month. This added squeeze on households’ disposable income, combined with the expectation that that inflation is set to remain in double digits into next year, is predicted to slow house price increases further or even cause them to fall.
Barratt Developments, the country’s biggest housebuilder, stated that the number of homes reserved each week until the end of August had fallen below the level of a year earlier, and was now lower than before the coronavirus pandemic. This has been partly driven by people anticipating further rises in interest rates and provides further evidence of a slowdown in the housing market.
Bank of England decisions on interest rates
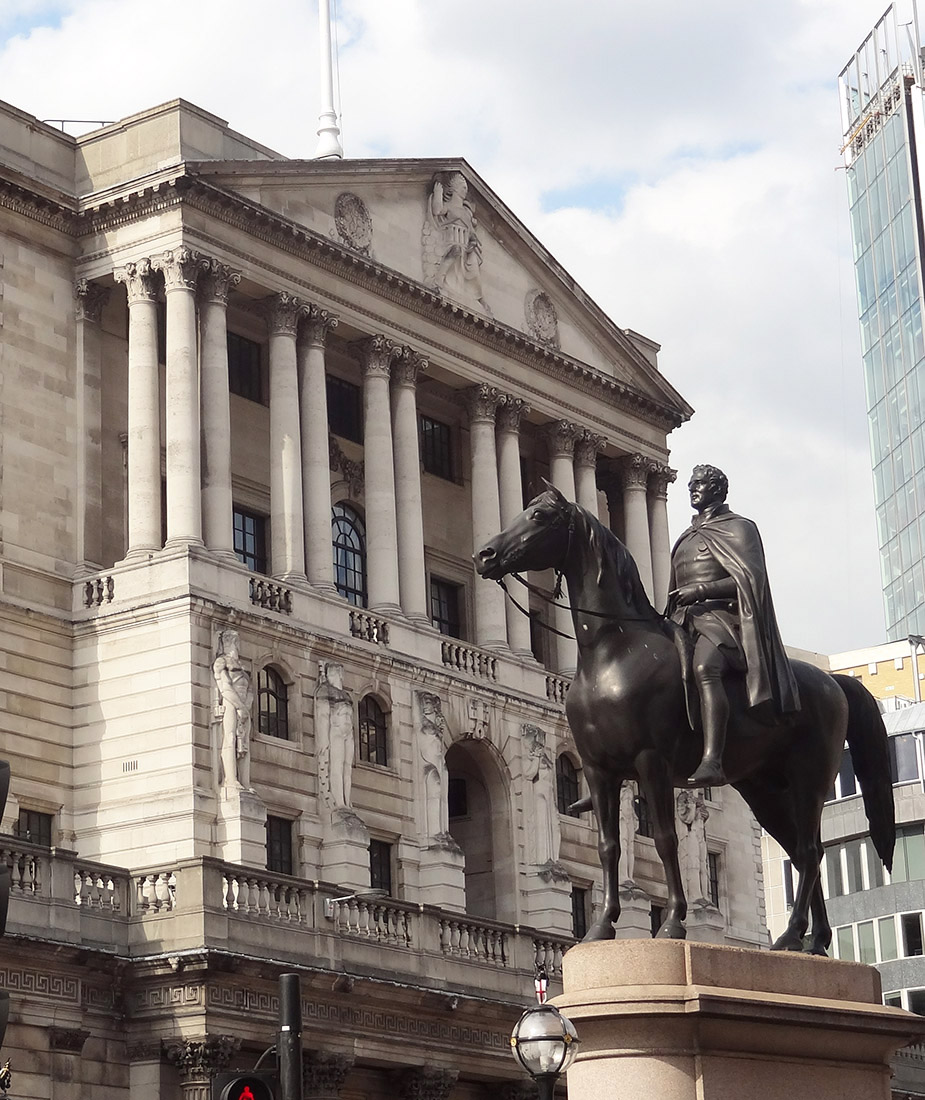 In early August, the Bank of England announced its biggest increase in interest rates in 27 years, taking the UK base rate from 1.25% to 1.75%, a 13-year high. This rise in the base rate, which has a knock-on effect on other interest rates, was an attempt to control rising inflation as energy and food prices soared.
Then, on Thursday 22nd September, the Bank of England announced a further 0.5 percentage point rise in the base rate to 2.25%. This is now the highest level for 14 years, but this is unlikely to be the peak as it is expected that the Bank will continue raising rates into next year.
The government’s mini-Budget on 23 September involved a price cap on energy prices, estimated to cost around £150 billion, and various tax cuts. The package would be funded largely by borrowing. This is likely to drive interest rates up further. Indeed, in response to the package, the interest rate on new government bonds soared and price of existing bonds (which pay a fixed amount per annum) correspondingly fell, thereby increasing their yield. Yields rose above 4%; they were just 1.3% rate at the start of the year.
These further increases in interest rates will have a negative impact on the market as they feed through to mortgage rates, which have already increased noticeably recently. Indeed, following the mini-Budget and the rise in bond prices, around half the mortgage products on offer to new buyers or those re-mortgaging were withdrawn. Many households with mortgages will thus see their costs rise. Experts have warned that borrowers in the UK are especially exposed, with many people having mortgages tracking central bank rates or having short-term fixed deals set to expire. Those on fixed-rate deals will not be immediately affected, although their costs could jump when their deals come up for renewal.
The impact of a recession
Even though the housing market is slowing, it is nowhere near a crash. But, with the Bank of England predicting a recession, there is concern about the impact on the housing market. In August, the Bank had warned that Britain was likely to enter into a recession by December this year and predicted it to last 15 months. However, with the announcement of higher interest rates, the Bank now warns that the UK may already be in a recession. The central bank had previously expected the economy to grow between July and September, but it now believes it will have shrunk by 0.1%. This comes after the economy already shrank slightly between April and June.
A recession is defined as when an economy shrinks for two consecutive quarters. During a recession, house prices typically flatline or decrease but it all depends on how severe the recession is. Historically, when there is a deep and prolonged contraction in the economy with rising unemployment, house prices tend to fall.
Finance experts have predicted that the UK will suffer its longest downturn since the 2008 financial crisis. The global financial crisis saw the availability of mortgage finance contract, making it much harder for people to borrow, thereby reducing the demand for homes. This, together with rising unemployment, resulted in average house prices falling by 12%. It was not until 2010 that the housing market in London began to recover and not until 2013 in the wider UK market.
The BoE’s Monetary Policy Committee (MPC) have warned:
Real household post-tax income is projected to fall sharply in 2022 and 2023, while consumption growth turns negative.
This will be the first recession in the UK since the height of the Covid crisis 2020. However, then the housing market didn’t behave in the typical way and property prices continued rising. This was fuelled by people working from home, which encouraged both house movers and first-time buyers to seek houses with sufficient space. The housing market has been rampant ever since as people have taken advantage of low interest rates and also of the stamp duty holiday between July 2020 and September 2021 (see the blog, The red hot housing market).
This time, however, the predicted recession could finally put the brakes on growing house prices as people’s real incomes fall. With people faced with higher mortgage rates and the cost-of-living squeeze, the growth in demand for property is likely to slow rapidly: to 5% in the second half of this year and then lower still in 2023. This could eventually match the supply of property. Supply may also increase as a result of an increase in repossessions as people struggle to pay their monthly mortgage bills.
Cuts to stamp duty
In his mini-Budget on 23 September, the new Chancellor, Kwasi Kwarteng, announced that stamp duty on house purchases would be cut. The threshold at which buyers have to start paying the duty would rise from £125 000 to £250 000 and first-time buyers would not pay any duty on the first £425 000.
This cut in tax on house purchase will go some way to offsetting the effect of rising mortgage interest rates and is likely to reduce the slowdown in house price rises.
First time buyers
A recession could actually help some people climb onto the property ladder if it pushes property prices down. That would lead to smaller deposits being needed and lower total amounts having to be borrowed.
 However, despite the prospect of falling house prices, it still remains tough for first-time buyers. The biggest risk for hopeful homebuyers in a recession is losing their job. At a time of increased uncertainty, some first-time buyers are likely to wait, hoping that homes will become cheaper. However, there have only been 31 months in the past 20 years when house prices have fallen, all of which occurred between 2008 and 2012. Myron Jobson, senior personal finance analyst at Interactive Investor said:
Fast-rising rents are not offering any relief and could keep some buyers in the hunt for a home for longer than they would like.
Also, prices are not yet actually falling, even though demand is slowing. Demand for homes is still outstripping the available housing inventory. This means that the market is still a difficult one for first-time buyers and those looking to climb up the property ladder.
At first sight, it may seem that cuts to stamp duty will help first-time buyers, especially as the duty is paid after a higher threshold than for other purchasers. However, the stamp duty cuts will stimulate demand, which, as we argued above, will reduce the slowdown in house price rises. Also, despite the threshold being higher for first-time buyers, by stimulating house price inflation, most if not all the gains in the duty cut could be offset and could risk pricing-out first-time buyers.
Conclusion
The economic outlook is uncertain. However, the rises in the energy price cap in October and beyond, and the general rise on the cost of living as prices rise faster than wages, are expected to increase pressure on household finances, which will limit the amount that prospective house buyers can afford to borrow. As a result, house price inflation is expected to fall across the majority of UK regions, as buyer demand eases. But just how much house price inflation will fall and whether it will turn negative (i.e. a fall in house prices) is hard to predict
Articles
- House price growth at 10% a year despite squeeze on finances
BBC News, Kevin Peachey (1/9/22)
- How will a recession hit the UK housing market?
BBC News, Simon Read (5/8/22)
- Could the UK see interest rates rise to 5%?
BBC News, Faisal Islam (22/9/22)
- UK may already be in recession – Bank of England
BBC News, Dearbail Jordan & Daniel Thomas (22/9/22)
- Mortgage rates: act fast as increases loom
Financial Times, James Pickford (16/9/22)
- Who escapes the great mortgage reset?
Financial Times, Tom Braithwaite (16/9/22)
- UK house prices: Halifax and Barratt warn of challenges ahead
The Guardian, Joanna Partridge (7/9/22)
- Annual rate of UK house price growth doubles to 15.5% in one month
The Guardian, Rupert Jones (14/9/22)
- After an autumn flurry, is the UK housing market going to fall at last?
The Observer, Julia Kollewe (17/9/22)
- Stamp duty cut will benefit UK’s wealthier and raise inflation, say experts
The Guardian, Richard Partington (21/9/22)
- What does Kwarteng’s stamp duty cut mean for UK homebuyers?
The Guardian, Jess Clark (23/9/22)
- What happens to house prices in a recession? A property expert explains
Metro, Jack Slater (13/8/22)
Questions
- With the aid of a diagram, explain the current demand and supply in the housing market.
- How does an expectation of a rise in interest rates affect the demand for housing?
- Define the term recession. Why is the UK likely to enter recession (if it has not already done so)?
- Describe the characteristics of the business cycle during a recession.
- How do expectations of house price increases affect actual house price increases?
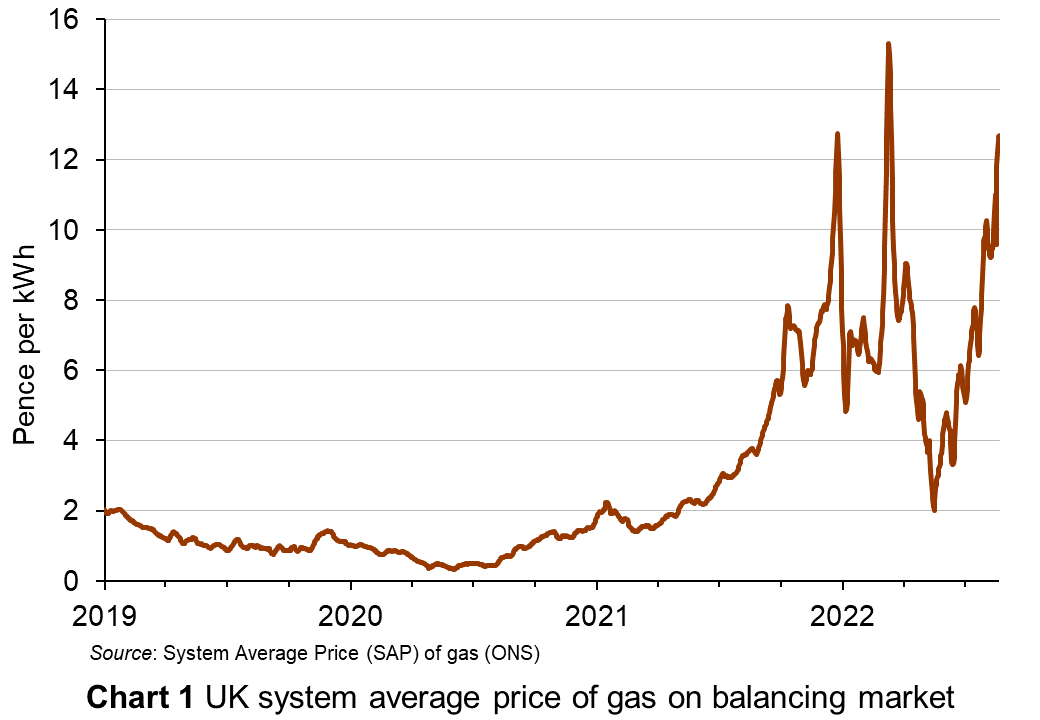 International wholesale gas prices have soared in recent months. This followed a cold winter in 2021/22 across Europe, the bounceback in demand as economies opened up after COVID and, more recently, pressure on supplies since the Russian invasion of Ukraine and the resulting restricted gas supplies from Russia. The price of gas traded on the UK wholesale market is shown in Chart 1 (click here for a PowerPoint). Analysts are forecasting that the wholesale price of gas will continue to rise for some time. The higher price of gas has had a knock-on effect on wholesale electricity prices, as gas-fired power stations are a major source of electricity generation and electricity prices.
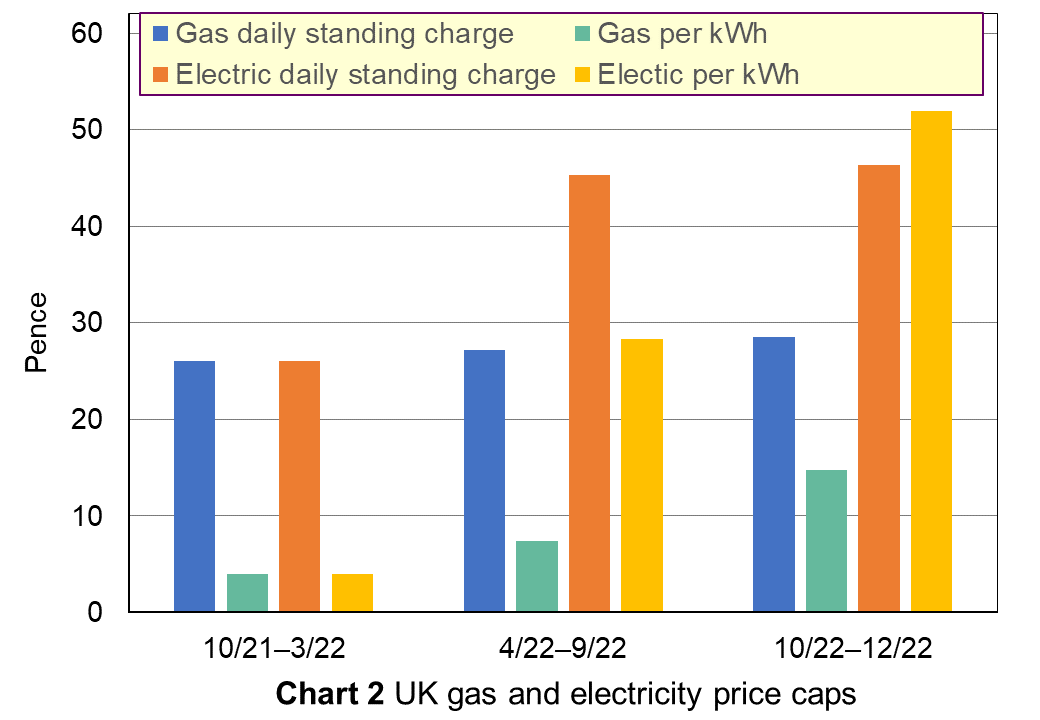 In the UK, domestic fuel prices were capped by the regulator, Ofgem. The cap reflected wholesale prices and was designed to allow electricity suppliers to make reasonable but not excessive profits. The cap was adjusted every six months, but this was been reduced to three months to reflect the rapidly changing situation. Prices are capped for both gas and electricity for both the standing charge and the rate per kilowatt hour (kWh). This is illustrated in Chart 2 (click here for a PowerPoint).
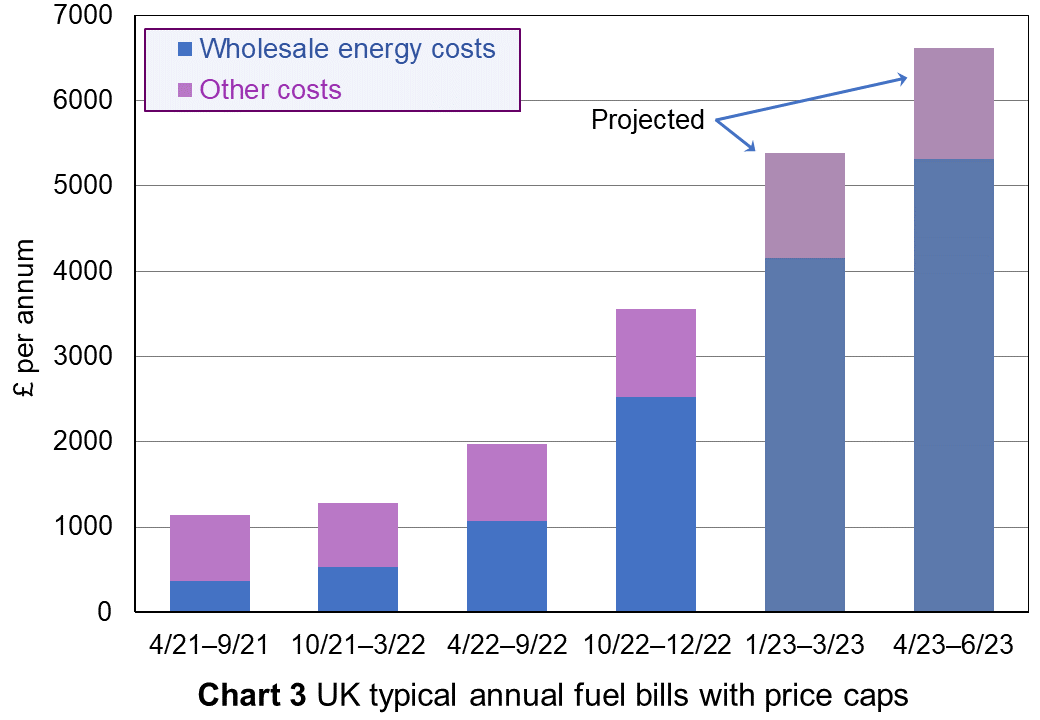 The effects of the cap were then projected in terms of a total annual bill for a typical household consuming 12 000 kWh of gas and 2900 kWh of electricity. Chart 3 shows the typical fuel bill for the last four price caps and, prior to the mini-Budget of 23 September, the projected price caps for the first and second quarters of 2023 based on forecasts at the time of wholesale prices (click here for a PowerPoint). As you can see, wholesale gas and electricity prices account for an increasing proportion of the total bill. The remaining elements in cost consist of profits (1.9% assumed), VAT (5%), operating costs, grid connection costs and green levies (around £153). The chart shows that, without government support for prices, the price cap would have risen by 80.6% in October 2022 and was projected to rise by a further 51% in January 2023 and by another 23% in March 2023. If this were to have been the case, then prices would have risen by 481% between the summer of 2021 and March 2023.
This was leading to dire warnings of extreme fuel poverty, with huge consequences for people’s health and welfare, which would put extra demands on an already stretched health service. Many small businesses would not be able to survive the extra fuel costs, which would lead to bankruptcies and increased unemployment.
Future wholesale gas prices
 Energy market analysts expect wholesale gas prices to remain high throughout 2023, with little likelihood that gas supplies from Russia will increase. Some European countries, such as Germany, have been buying large amounts of gas to fill storage facilities before winter and before prices rise further. This has added to demand.
The UK, however, has only limited storage facilities. Although it is not an importer of gas from Russia and so, in one sense, storage facilities are less important at the current time, wholesale gas prices reflect international demand and supply and thus gas prices in the UK will be directly affected by an overall global shortage of supply.
What would have been the response to the projected rise in gas prices? Eventually demand would fall as substitute fuels are used for electricity generation. But demand is highly inelastic. People cannot readily switch to alternative sources of heating. Most central heating is gas fired. People may reduce consumption of energy by turning down their heating or turning it off altogether, but such reductions are likely to be a much smaller percentage than the rise in price. Thus, despite some use of other fuels and despite people cutting their energy usage, people would still end up spending much more on energy.
Over the longer term, new sources of supply of gas, including liquified natural gas (LNG), may increase supply. And switching to green energy sources for electricity generation, may bring the price of electricity back down and lead to some substitution been gas and electricity in the home and businesses. Also improved home insulation and the installation of heat pumps and solar panels in homes, especially in new builds, may reduce the demand for gas. But these changes take time. Chart 4 illustrates the situation (click here for a PowerPoint).
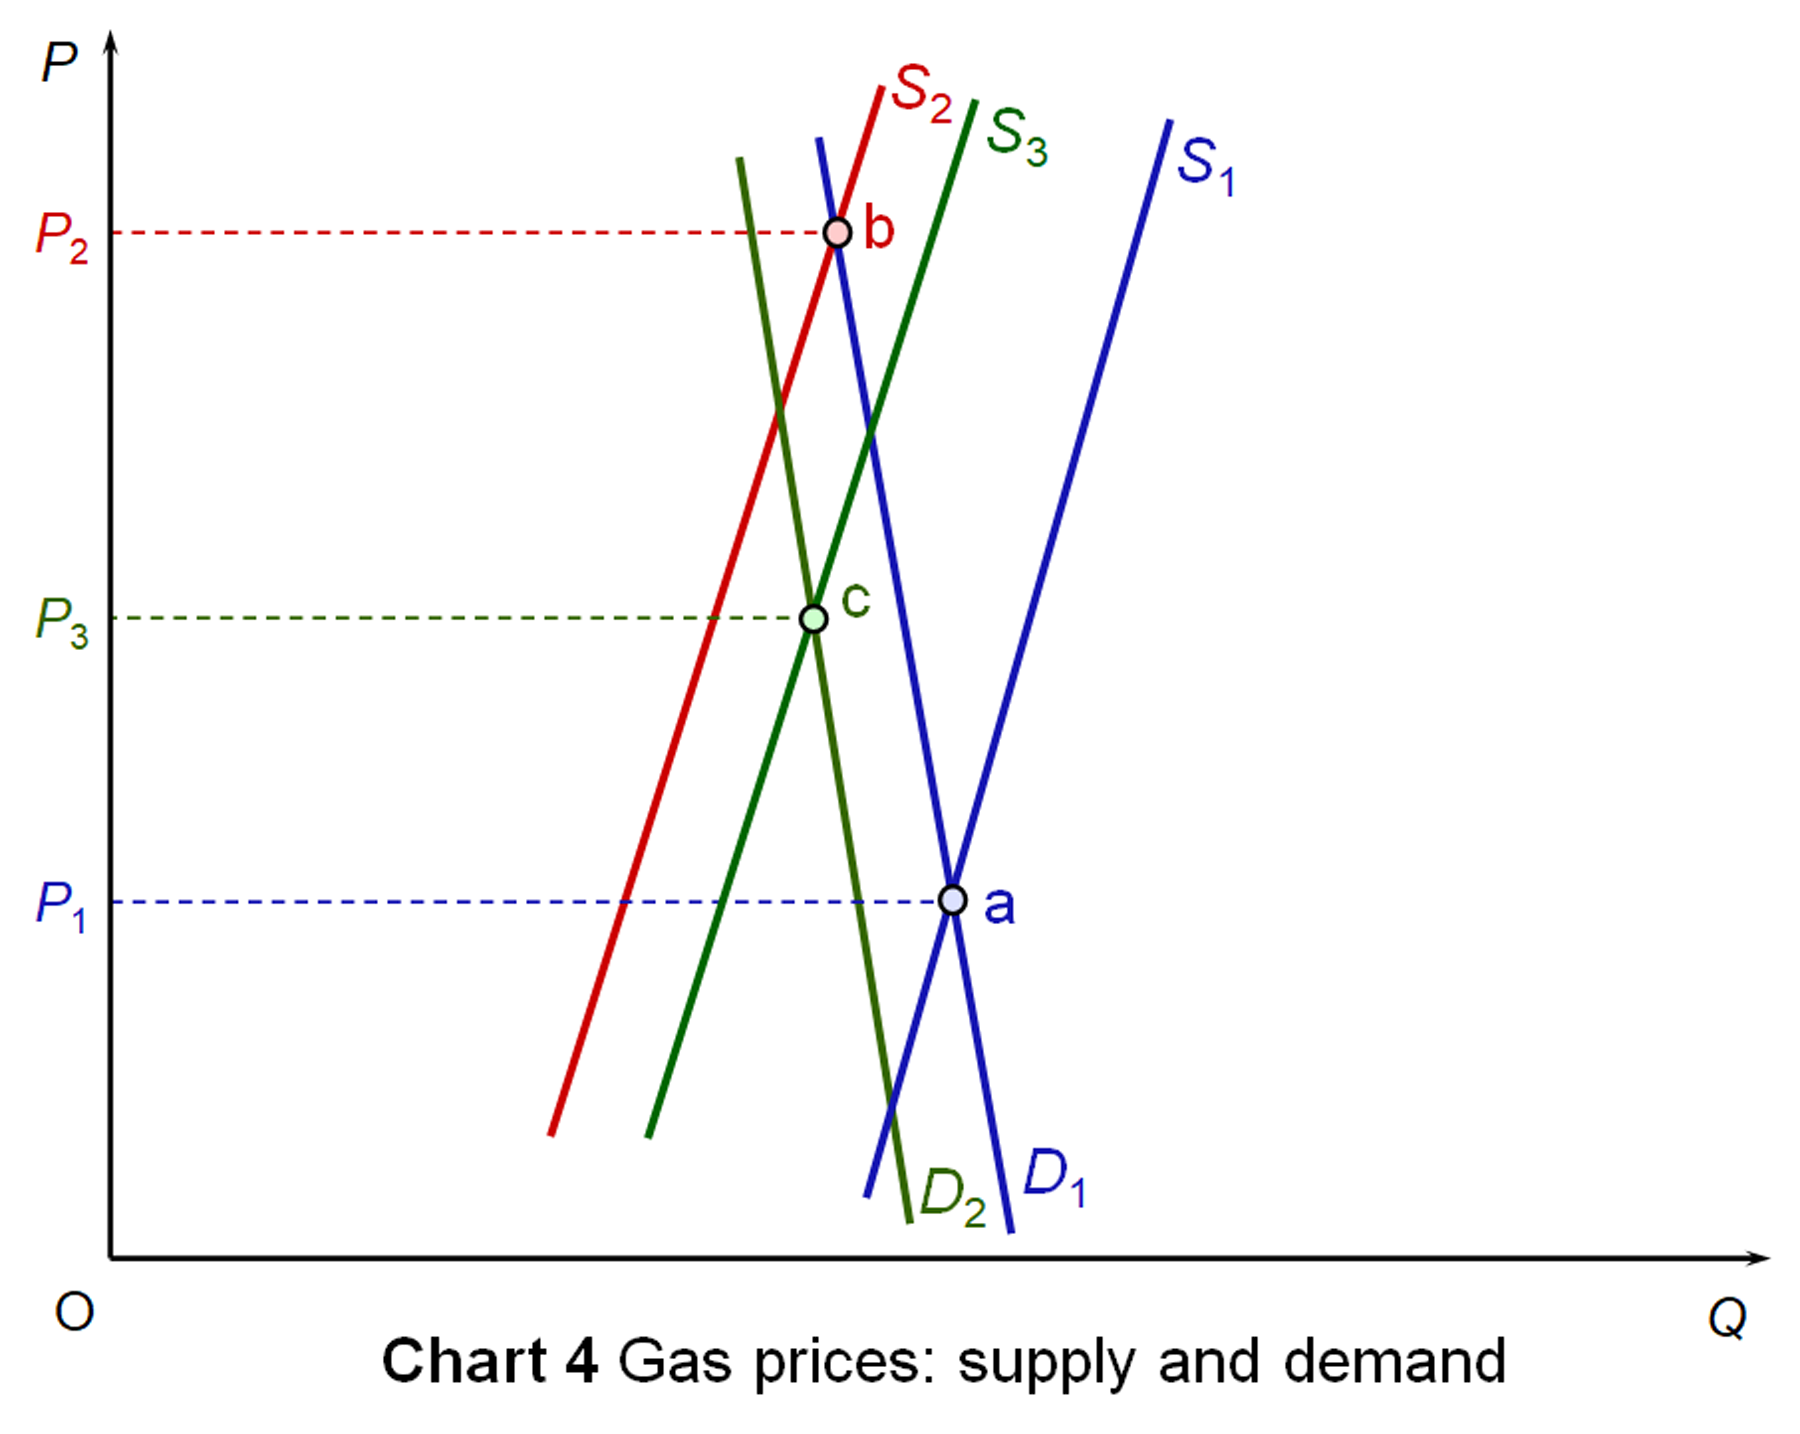 Both demand and supply are relatively inelastic. The initial demand and supply curves are D1 and S1. Equilibrium price is P1 (point a). There is now a fall in supply. Supply shifts to S2. With an inelastic demand, there is a large rise in price to P2 (point b).
Over two or three years, there is a modest fall in demand (as described above) to D2 and a modest rise in supply to S3. Price falls back somewhat to P3 (point c). Over a longer period of time, these shifts would be greater and the price would fall further.
Possible policy responses
What could the government do to alleviate the problem? Consensus was that the new Conservative Prime Minister, Liz Truss, and her Chancellor, Kwasi Kwarteng, would have to take radical measures if many households were to avoid severe hardship and debt. One proposal was to reduce VAT on domestic energy from 5% to zero and to cut green levies. Although this would help, it would make only a relatively small dent in people’s rising bills.
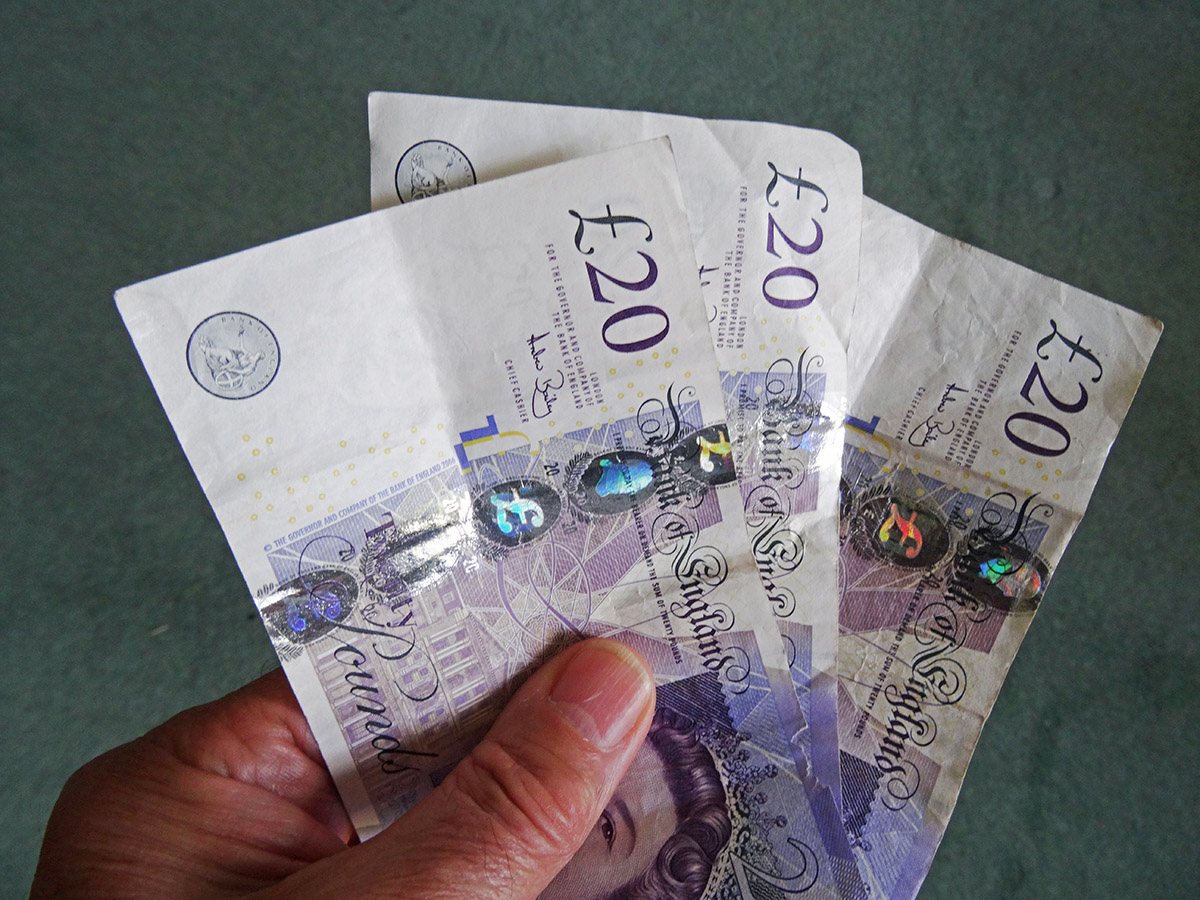 Another proposal was to give people cash payments to help with their bills. The more generous and widespread these payments, the more costly they would be.
One solution here would be to impose larger windfall taxes on oil and gas producers (as opposed to retailers). Their profits have soared as oil and gas prices have soared. Such a move is generally resisted by those on the right of politics, arguing that it could discourage investment in energy production. Those on the centre and left of politics argue that the profits are the result of global factors and not because of wise business decisions by the energy producers. A windfall tax would only take away these excess profits.
The EU has agreed a tax on fossil fuel companies’ surplus profits made either this year or next. It is also introducing a levy on the excess revenues that other low-cost power producers make from higher electricity prices.
Another proposal was to freeze retail energy prices at the current or some other level. This would make it impossible for energy suppliers to cover their costs and so they would have to be subsidised. This again would be very expensive and would require substantially increased borrowing at a time when interest rates are rising, or increased taxation at a time when people’s finances are already squeezed by higher inflation. An alternative would be to cap the price North Sea producers receive. As around half of the UK’s gas consumption is from the North Sea, this would help considerably if it could be achieved, but it might be difficult to do so given that the gas is sold onto international markets.
One proposal that was gaining support from energy producers and suppliers is for the government to set up a ‘deficit fund’. Energy suppliers (retailers) would freeze energy prices for two years and take out state-backed loans from banks. These would then be paid back over time by prices being capped sufficiently high to cover costs (which, hopefully, by then would be lower) plus repayments.
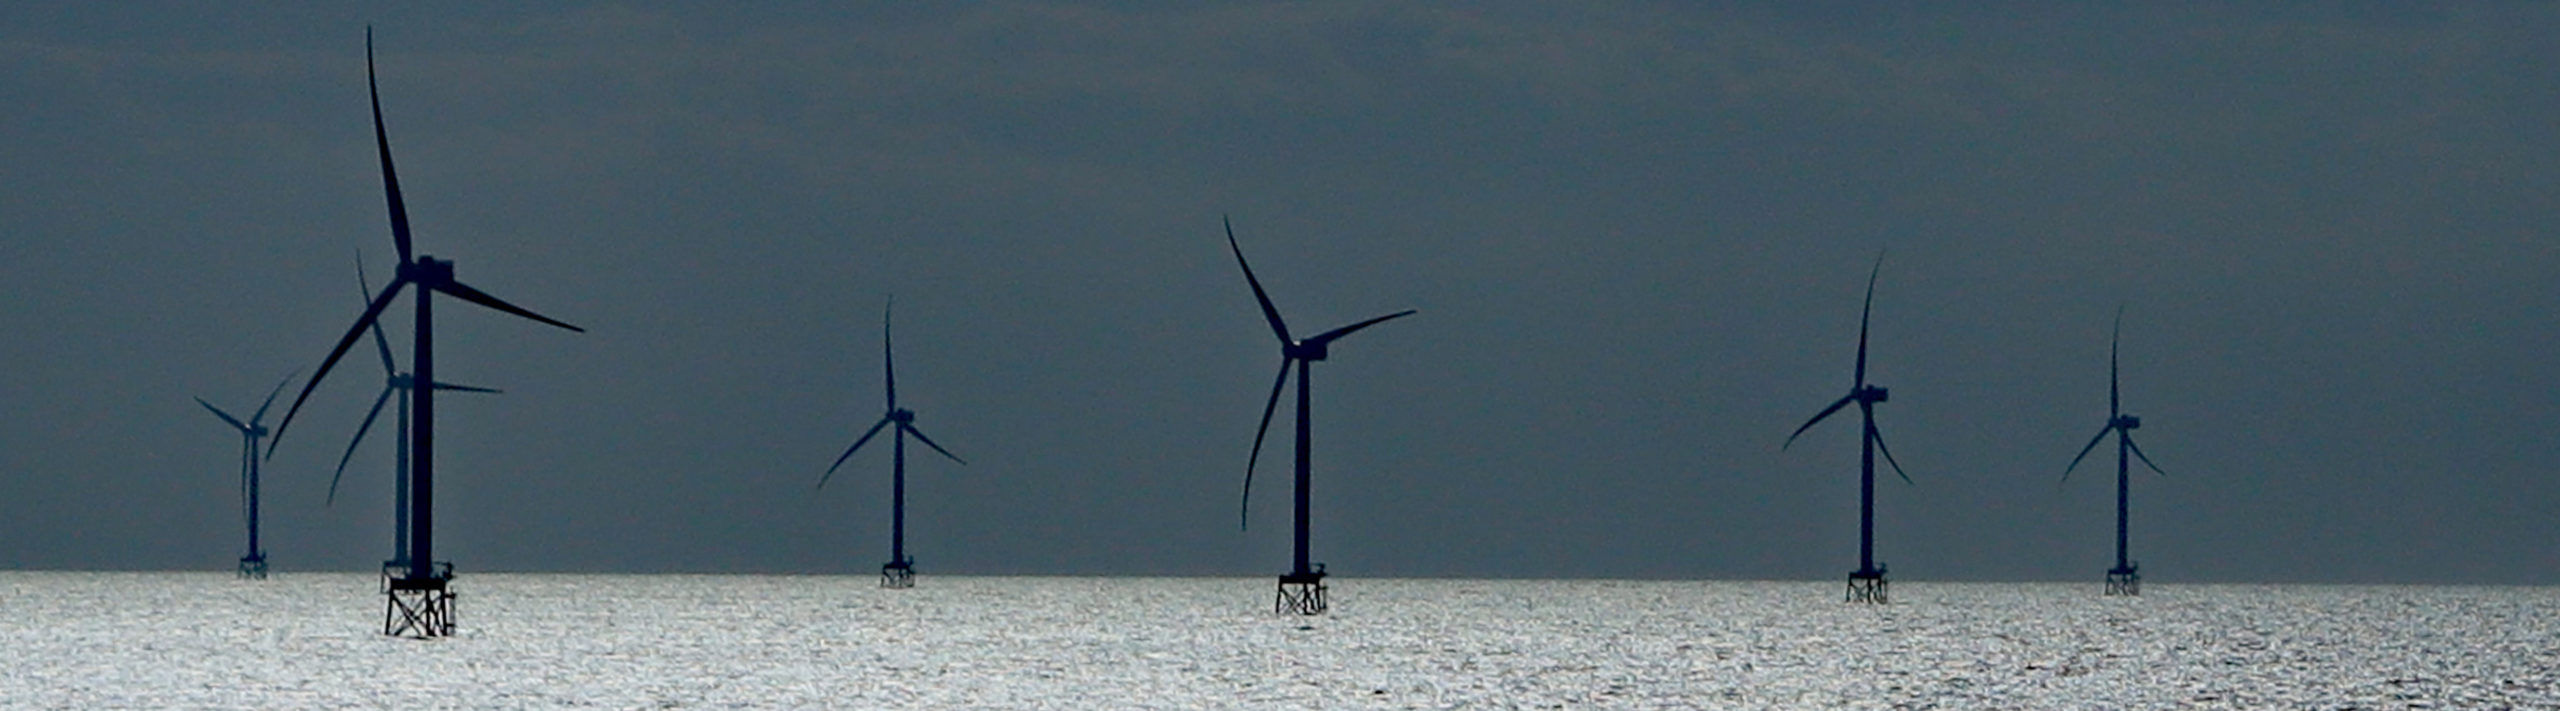
Another policy response would be to decouple electricity prices from the wholesale price of gas. This is being urgently considered in the EU, and Ofgem is also consulting on such a measure. This could make wholesale electricity prices reflect the costs of the different means of generation, including wind, solar and nuclear, and would see a fall in wholesale electricity prices. At the moment, generators using these methods are making large profits.
The government’s response
On September 23, the government held a mini-Budget. One of its key elements was a capping of the unit price of energy for both households and firms. The government called this the Energy Price Guarantee. For example, those households on a variable dual-fuel, direct-debit tariff would pay no more than 34.0p/kWh for electricity and 10.3p/kWh for gas. Standing charges are capped at 46p per day for electricity and 28p per day for gas. These rates will apply for 2 years from 1/10/22 and should give an average annual household bill of £2500.
Although the government has widely referred to the ‘£2500 cap’, it is the unit price that is capped, not the annual bill. It is still the case that the more you consume, the more you will pay. As you can see from Chart 3, the average £2500 still represents an average increase per annum of just over £500 per household and is almost double the cap of £1277 a year ago. It will thus still put considerable strain on many household finances.
For businesses, prices will be capped for 6 months from 1 October at 21.1p per kWh for electricity and 7.5p per KWh for gas – considerably lower than for domestic consumers.
The government will pay subsidies to the retail energy companies to allow them to make sufficient, but not excess, profit. These subsidies are estimated to cost around £150 billion. This will be funded by borrowing, not by tax increases, with the government ruling out a windfall tax on North Sea oil and gas extracting companies. Indeed, the mini-Budget contained a number of tax reductions, including scrapping the 45% top rate of income tax, cutting the basic rate of income tax from 20% to 19% and scrapping the planned rise in corporation tax from 19% to 25%.
Articles
Data
Questions
- Why are the demand and supply of gas relatively inelastic with respect to price?
- Why are the long-run elasticities of demand and supply of gas likely to be greater than the short-run elasticities?
- Find out how wholesale electricity prices are determined. Is there a case for reforming the system and, if so, how?
- Identify ways in which people could be protected from rising energy bills.
- Assess these different methods in terms of (a) targeting help to those most in need; (b) economic efficiency.
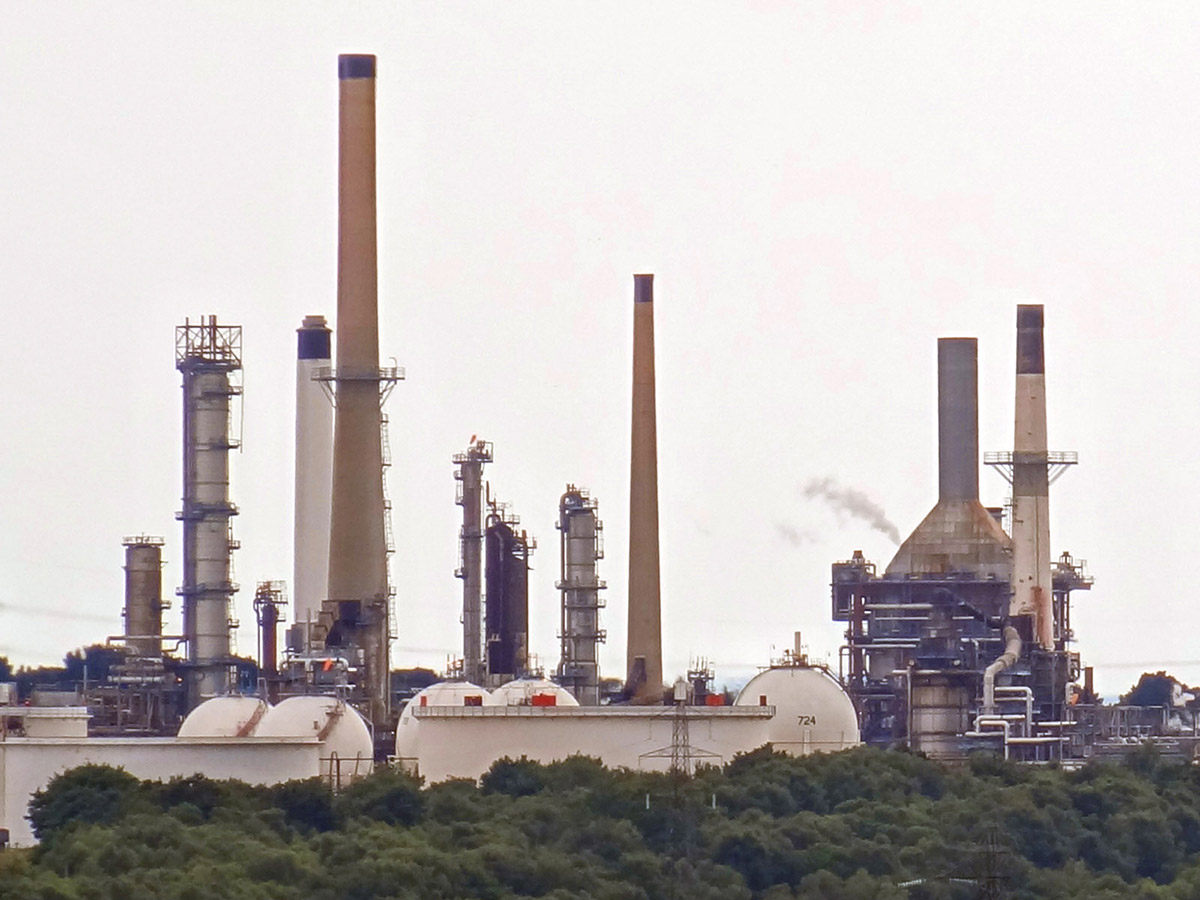 Global oil prices (Brent crude) reached $128 per barrel on 9 March, a level not seen for 10 years and surpassed only in the run up to the financial crisis in 2008. Oil prices are determined by global demand and supply, and the current surge in prices is no exception.
A rise in demand and/or a fall in supply will lead to a rise in the price. Given that both demand and supply are relatively price inelastic, such shifts can cause large rises in oil prices. Similarly, a fall in demand or rise in supply can lead to a large fall in oil prices.
These changes are then amplified by speculation. Traders try to get ahead of price changes. If people anticipate that oil prices will rise, they will buy now, or make a contract to buy more in the future at prices quoted today by buying on the oil futures market. This then pushes up both spot (current) prices and futures prices. If demand or supply conditions change, speculation will amplify the reaction to such a change.
What has happened since 2019?
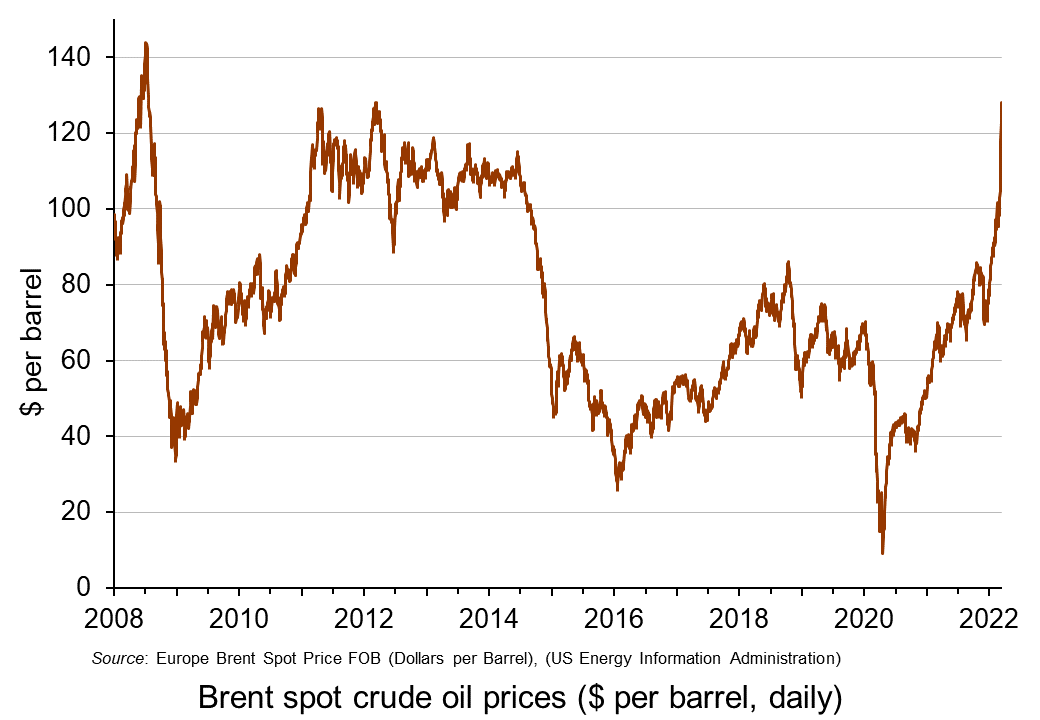 In 2019, oil was typically trading at around $60 to $70 per barrel. It then fell dramatically in early 2020 as the onset of COVID-19 led to a collapse in demand, for both transport and industry. The price fell below $20 in late April (see charts: click here for a PowerPoint).
Oil prices then rose rapidly as demand recovered somewhat but supply chains, especially shipping, were suffering disruptions. By mid-2021, oil was once more trading at around $60 to $70 per barrel. But then demand grew more strongly as economic recovery from COVID accelerated. But supply could not grow so quickly. By January 2022, Brent crude had risen above $80 per barrel.
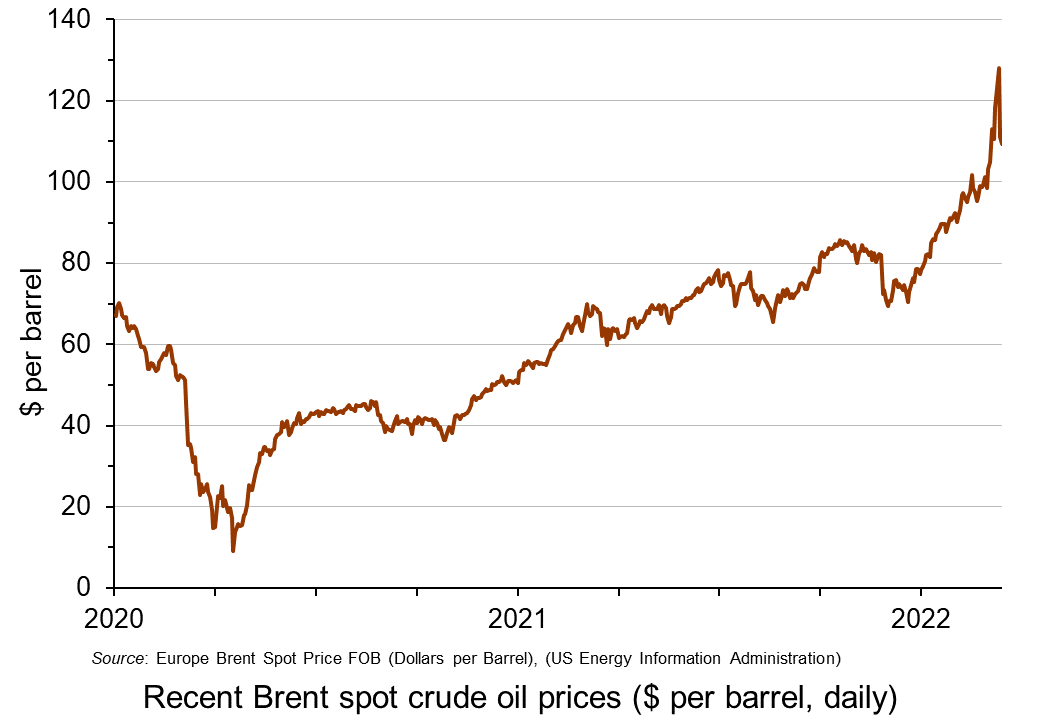 Then worries began to grow about Russian intentions over Ukraine as Russia embarked on large-scale military exercises close to the border with Ukraine. People increasingly disbelieved Russia’s declarations that it had no intention to invade. Russia is the world’s second biggest producer of oil and people feared that deliberate disruptions to supply by Russia or other countries banning imports of Russian oil would cause supply shortages. Speculation thus drove up the oil price. By 23 February, the day before the Russian invasion of Ukraine, Brent crude had risen to $95.
With the Russian invasion, moves were made by the EU the USA and other countries to ban or limit the purchase of Russian oil. This increased the demand for non-Russian oil.
 On 8 March, the USA announced that it was banning the import of Russian oil with immediate effect. The same day, the UK announced that it would phase out the import of Russian oil and oil products by the end of 2022.
The EU is much more dependent on Russian oil imports, which account for around 27% of EU oil consumption and 2/3 of extra-EU oil imports. Nevertheless, it announced that it would accelerate the move away from Russian oil and gas and towards green alternatives. By 8 March, Brent crude had risen to $128 per barrel.
The question was then whether other sources of supply would help to fill the gap. Initially it seemed that OPEC+ (excluding Russia) would not increase production beyond the quotas previously agreed by the cartel to meet recovery in world demand. But then, on 9 March, the UAE Ambassador to Washington announced that the county favoured production increases and would encourage other OPEC members to follow suit. With the announcement, the oil price fell by 11% to £111. But the next day, it rose again somewhat as the UAE seemed to backtrack, but then fell back slightly as OPEC said there was no shortage of oil.
This is obviously an unfolding story with the suffering of the Ukrainian people at its heart. But the concepts of supply and demand and their price elasticity and the role of speculation are central to understanding what will happen to oil prices in the coming months with all the consequences for poverty and economic hardship.
Articles
Data
Questions
- Use a demand and supply diagram to illustrate what has happened to oil prices over the past two years. How has the size of the effects been dependent on the price elasticity of demand for oil and the price elasticity of supply of oil?
- Use a demand and supply diagram to show what has been happening to the price of natural gas over the past two years. Are the determinants similar to those in the oil market? How do they differ (if at all)?
- What policy options are open to governments to deal with soaring energy prices?
- What are the distributional consequences of the rise in energy prices? (see the blog: Rise in the cost of living.)
- Under what circumstances are oil prices over the next six months likely (a) fall; (b) continue rising?