Category: Podcasts and Videos

In his 1971 book, Income Distribution, Jan Pen, a Dutch economist, gave a graphic illustration of inequality in the UK. He described a parade of people marching by. They represent the whole population and the parade takes exactly one hour to pass by. The height of each person represents his or her income. People of average height are the people with average incomes – the observer is of average height. The parade starts with the people on the lowest incomes (the dwarfs), and finishes with those on the highest incomes (the giants).

Because income distribution is unequal, there are many tiny people. Indeed, for the first few minutes of the parade, the marchers are so small they can barely be seen. Even after half an hour, when people on median income pass by, they are barely waist high to the observer.

The height is growing with tantalising slowness, and forty-five minutes have gone by before we see people of our own size arriving. To be somewhat more exact: about twelve minutes before the end the average income recipients pass by.

In the final minutes, giants march past and then in the final seconds:

the scene is dominated by colossal figures: people like tower flats. Most of them prove to be businessmen, managers of large firms and holders of many directorships and also film stars and a few members of the Royal Family.

The rear of the parade is brought up by a few participants who are measured in miles. Indeed they are figures whose height we cannot even estimate: their heads disappear into the clouds and probably they themselves do not even know how tall they are.

Pen’s description could be applied to most countries – some with even more dwarfs and even fewer but taller giants. Generally, over the 43 years since the book was published, countries have become less equal: the giants have become taller and the dwarfs have become smaller.

The 2011 Economist article, linked below, uses changes in Gini coefficients to illustrate the rise in income inequality. A Gini coefficient shows the area between the Lorenz curve and the 45° line. The figure will be between 0 and 1 (or 0% and 100%). a figure of 0 shows total equality; a figure of 1 shows a situation of total inequality, where one person earns all the nation’s income. The higher the figure, the greater the inequality.

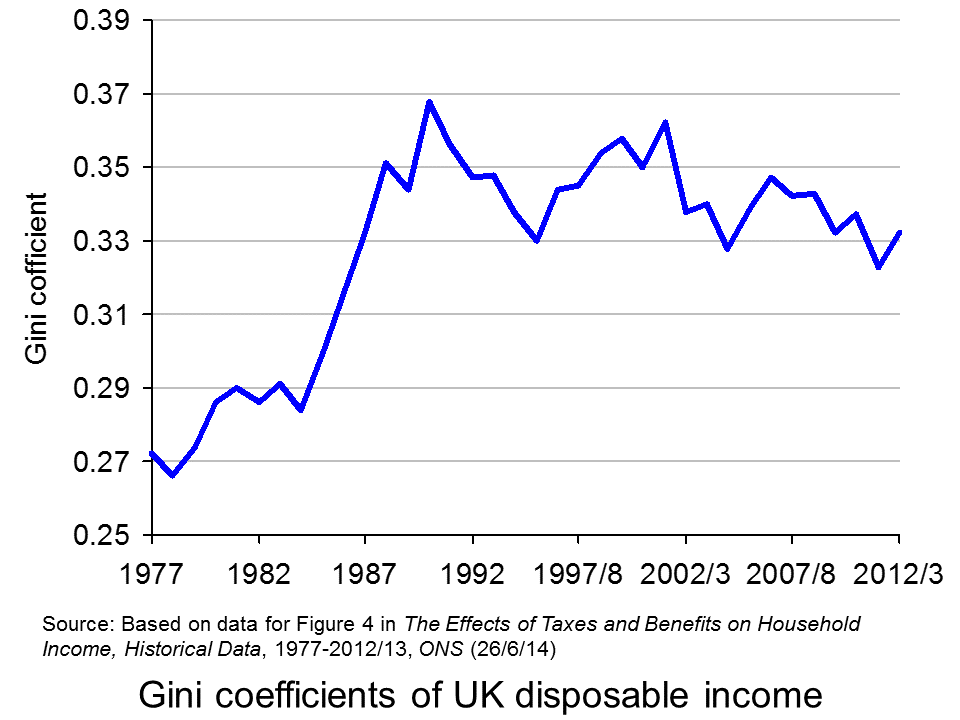
The chart opposite shows changes in the Gini coefficient in the UK (see Table 27 in the ONS link below for an Excel file of the chart). As this chart and the blog post Rich and poor in the UK show, inequality rose rapidly during the years of the 1979–91 Thatcher government, and especially in the years 1982–90. This was associated with cuts in the top rate of income tax and business deregulation. It fell in the recession of the early 1990s as the rich were affected more than the poor, but rose with the recovery of the mid- to late 1990s. It fell again in the early 2000s as tax credits helped the poor. It fell again following the financial crisis as, once more, the rich were affected proportionately more than the poor.

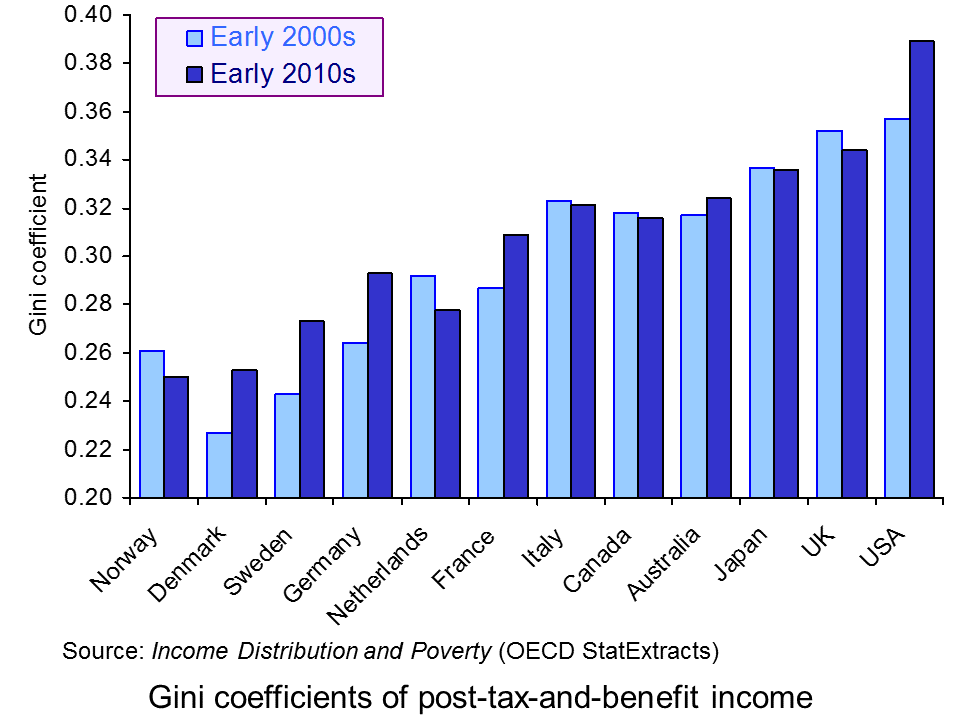
The most up-to-date international data for OECD countries can be found on the OECD’s StatExtracts site (see chart opposite: click here for a PowerPoint). The most unequal developed county is the USA, with a Gini coefficient of 0.389 in 2012 (see The end of the American dream?), and US inequality is rising. Today, the top 1% of the US population earns some 24% of national income. This compares with just 9% of national income in 1976.

Many developing countries are even less equal. Turkey has a Gini coefficient of 0.412 and Mexico of 0.482. The figure for South Africa is over 0.6.

When it comes to wealth, distribution is even less equal. The infographic, linked below, illustrates the position today in the USA. It divides the country into 100 equal-sized groups and shows that the top 1% of the population has over 40% of the nation’s wealth, whereas the bottom 80% has only 7%.

So is this inequality of income and wealth desirable? Differences in wages and salaries provide an incentive for people to work harder or more effectively and to gain better qualifications. The possibility of increased wealth provides an incentive for people to invest.

But are the extreme differences in wealth and income found in many countries today necessary to incentivise people to work, train and invest? Could sufficient incentives exist in more equal societies? Are inequalities in part, or even largely, the result of market imperfections and especially of economic power, where those with power and influence are able to use it to increase their own incomes and wealth?

Could it even be the case that excessive inequality actually reduces growth? Are the huge giants that exist today accumulating too much financial wealth and creating too little productive potential? Are they spending too little and thus dampening aggregate demand? These arguments are considered in some of the articles below. Perhaps, by paying a living wage to the ‘tiny’ people on low incomes, productivity could be improved and demand could be stimulated.

Infographic

Wealth Inequality in America YouTube, Politizane (20/11/12)

Articles

The rise and rise of the cognitive elite The Economist (20/1/11)
Inequality in America: Gini in the bottle The Economist (26/11/13)
Pen’s Parade: do you realize we’re mostly dwarves? LVTFan’s Blog (21/2/11)
Here Are The Most Unequal Countries In The World Business Insider, Andy Kiersz (8/11/14)
Inequality in the World Dollars & Sense, Arthur MacEwan (Nov/Dec 14)
Britain is scared to face the real issue – it’s all about inequality The Observer, Will Hutton (19/1/14)
The tame inequality debate FundWeb, Daniel Ben-Ami (Nov 14)
Is inequality the enemy of growth? BBC News, Robert Peston (6/10/14)

Data

GINI index World Bank data
List of countries by income equality Wikipedia
The Effects of Taxes and Benefits on Household Income, 2012/13 ONS (see table 27)
Income Distribution and Poverty: Gini (disposale income) OECD StatExtract

Questions

  1. Distinguish between income and wealth. Is each one a stock or a flow?
  2. Explain how (a) a Lorenz curve and (b) a Gini coefficient are derived.
  3. What other means are there of measuring inequality of income and wealth other than using Gini coefficients (and giants and dwarfs!)?
  4. Why has inequality been rising in many countries over the years?
  5. How do (a) periods of rapid economic growth and (b) recessions affect income distribution?
  6. Define ‘efficiency wages’. How might an increase in wages to people on low incomes result in increased productivity?
  7. What is the relationship between the degree of inequality and household debt? What implications might this have for long-term economic growth and future financial crises? Is inequality the ‘enemy of growth’?

An investigation by the International Consortium of Investigative Journalists has revealed how more than 1000 businesses from 340 major companies from around the world have used Luxembourg as a base for avoiding huge amounts of tax. Many of the companies are household names, such as Ikea, FedEx, Apple, Pepsi, Coca Cola, Dyson, Amazon, Fiat, Google, Accenture, Burberry, Procter & Gamble, Heinz, JP Morgan, Caterpillar, Deutsche Bank and Starbucks. Through complicated systems of ‘advanced tax agreements’ (ATAs), negotiated with the Luxembourg authorities via accountants PricewaterhouseCoopers (PwC), companies have used various methods of avoiding tax.

Although such measures are legal, they have denied other countries vast amounts of tax revenues on sales generated in their own countries. Instead, the much reduced tax bills have been paid to Luxembourg. The result is that this tiny country, with a population of just 550,000, has, according to the IMF, the highest (nominal) GDP per head in the world (estimated to be $116,752 in 2014).

So what methods do Luxembourg and these multinational companies use to reduce the companies’ tax bills? There are three main methods. All involve having a subsidiary based in Luxembourg: often little more than a small office with one employee, a telephone and a bank account. All involve varieties of transfer pricing: setting prices that the company charges itself in transactions between a subsidiary in Luxembourg and divisions in other countrries.

The first method is the use of internal loans. Companies lend money to themselves, say in the UK, from Luxembourg at high interest rates. The loan interest can be offset against profit in the UK, reducing tax liability to the UK tax authorities. But the interest earned by the Luxembourg subsidiary incurs very low taxes. Profits are thus effectively transferred from the UK to Luxembourg and a much lower tax bill is incurred.

The second involves royalty payments for the use of the company’s brands. These are owned by the Luxembourg subsidiary and the overseas divisions pay the Luxembourg subsidiary large sums for using the logos, designs and brand names. Thus, again, profits are transferred to Luxembourg, where there is a generous tax exemption.

The third involves generous allowances in Luxembourg for losses in the value of investments, even without the company having first to sell the investments. These losses can be offset against future profits, again reducing tax liability. By transferring losses made elsewhere to Luxembourg, again usually by some form of transfer pricing, these can be used to reduce the already small tax bill in Luxembourg even further.

Tax loopholes offered by tax havens, such as Luxembourg, the Cayman Islands and the Channel Islands, are denying exchequers around the world vast sums. Not surprisingly, countries, especially those with large deficits, are concerned to address the issue of tax avoidance by multinationals. This is one item on the agenda of the G20 meeting in Brisbane from the 12 to 16 November 2014.

The problem, however, is that, with countries seeking to attract multinational investment and to gain tax revenues from them, there is an incentive to reduce corporate tax rates. Getting any binding agreement on tax harmonisation, and creating an essentially global single market, is likely, therefore, to prove virtually impossible.

Webcasts and videos

Luxembourg Leaks: Tricks of the Trade ICIJ in partnership with the Pulitzer Center (5/11/14)
Luxembourg ‘abetted’ companies in avoiding taxes France 24, Siobhán Silke (6/11/14)
Tax deals with Luxembourg save companies billions, says report Deutsche Welle, Dagmar Zindel (6/11/14)
Luxembourg: the tax haven and the $870m loan company above a stamp shop The Guardian, John Domokos, Rupert Neate and Simon Bowers (5/11/14)
Luxembourg leaks: nation under spotlight over tax avoidance claims euronews (6/11/14)
Northern and Shell used west Dublin address to cut Luxembourg tax bill on €1bn The Irish Times, Colm Keena (6/11/14)
The ATO’s global tax avoidance investigation ABC News, Phillip Lasker (9/11/14)
Pepsi, IKEA Secret Luxembourg Tax Deals Exposed TheLipTV, Elliot Hill (9/11/14)

Articles

Leaked Docs Expose More Than 340 Companies’ Tax Schemes In Luxembourg Huffington Post, Leslie Wayne, Kelly Carr, Marina Walker Guevara, Mar Cabra and Michael Hudson (5/11/14)
Luxembourg tax files: how tiny state rubber-stamped tax avoidance on an industrial scale The Guardian, Simon Bowers (5/11/14)
Fact and fiction blur in tales of tax avoidance The Guardian (9/11/14)
companies engaged in tax avoidance The Guardian, Michael Safi (6/11/14)
The Guardian view on tax avoidance: Europe must take Luxembourg to task The Guardian, Editorial (6/11/14)
G20 leaders in the mood to act on tax avoidance after Luxembourg leaks Sydney Morning Herald, Tom Allard (6/11/14)
Scale of Luxembourg tax avoidance revealed economia, Oliver Griffin (6/11/14)
EU to press Luxembourg over tax breaks amid fresh allegations BBC News (6/11/14)
Luxembourg leaks: G20 alone can’t stamp out tax avoidance The Conversation, Charles Sampford (7/11/14)
‘Lux leaks’ scandal shows why tax avoidance is a bad idea European Voice, Paige Morrow (8/11/14)
EU to Probe Luxembourg’s ‘Sweetheart Tax Deal’ with Amazon International Business Times, Jerin Mathew (7/10/14)

Investigative Project

Luxembourg Leaks: Global Companies’ Secrets Exposed The International Consortium of Investigative Journalists (5/11/14)

Questions

  1. Distinguish between tax avoidance and tax evasion. Which of the two is being practised by companies in their arrangements with Luxembourg?
  2. Explain what is meant by transfer pricing.
  3. Do a search of companies to find out what parts of their operations as based in Luxembourg.
  4. In what sense can the setting of corporate taxes be seen as a prisoner’s dilemma game between countries?
  5. Discuss the merits of changing corporate taxes so that they are based on revenues earned in a country rather than on profits.
  6. What type of agreement on tax havens is likely to be achieved by the international community?
  7. Is it desirable for companies to be able to offset losses against future profits?

Lloyds Banking Group has announced that it plans to reduce its labour force by 9000. Some of this reduction may be achieved by not replacing staff that leave, but some may have to be achieved through redundancies.

The reasons given for the reduction in jobs are technological change and changes in customer practice. More banking services are available online and customers are making more use of these services and less use of branch banking. Also, the increasingly widespread availability of cash machines (ATMs) means that fewer people withdraw cash from branches.

And it’s not just outside branches that technological change is impacting on bank jobs. Much of the work previously done by humans is now done by software programs.

One result is that many bank branches have closed. Lloyds says that the latest planned changes will see 150 fewer branches – 6.7% of its network of 2250.

What’s happening in banking is happening much more widely across modern economies. Online shopping is reducing the need for physical shops. Computers in offices are reducing the need, in many cases, for office staff. More sophisticated machines, often controlled by increasingly sophisticated computers, are replacing jobs in manufacturing.

So is this bad news for employees? It is if you are in one of those industries cutting employment. But new jobs are being created as the economy expands. So if you have a good set of skills and are willing to retrain and possibly move home, it might be relatively easy to find a new, albeit different, job.

As far as total unemployment is concerned, more rapid changes in technology create a rise in frictional and structural unemployment. This can be minimised, however, or even reduced, if there is greater labour mobility. This can be achieved by better training, education and the development of transferable skills in a more adaptive labour force, where people see changing jobs as a ‘normal’ part of a career.

Webcasts

Lloyds Bank cuts 9,000 jobs – but what of the tech future? Channel 4 News, Symeon Brown (28/10/14)
Lloyds Bank confirms 9,000 job losses and branch closures BBC News, Kamal Ahmed (28/10/14)

Article

Lloyds job cuts show the technology axe still swings for white collar workers The Guardian, Phillip Inman (28/10/14)

Reports

Unleashing Aspiration: The Final Report of the Panel on Fair Access to the Professions Cabinet Office (July 2009)
Fair access to professional careers: a progress report Cabinet Office (30/5/12)

Questions

  1. Is a reduction in banking jobs inevitable? Explain.
  2. What could banks do to reduce the hardship to employees from a reduction in employment?
  3. What other industries are likely to see significant job losses resulting from technological progress?
  4. Distinguish between demand-deficient, real-wage, structural and frictional unemployment. Which of these are an example, or examples, of equilibrium unemployment?
  5. What policies could the government pursue to reduce (a) frictional unemployment; (b) structural unemployment?
  6. What types of industry are likely to see an increase in employment and in what areas of these industries?

In two posts recently, we considered the pessimistic views of Robert Peston about the prospects for the global economy (see Cloudy skies ahead? and The end of growth in the West?). In this post we consider the views of Christine Lagarde, Managing Director of the International Monetary Fund, and Lord Adair Turner, the former head of the Financial Services Authority (FSA) (which was replaced in 2013 by the Financial Conduct Authority and the Prudential Regulation Authority).

Christine Lagarde was addressing an audience at Georgetown University in Washington DC. The first four links below are to webcasts of the full speech and subsequent interviews about the speech. She gives a more gloomy assessment of the global economy than six months ago, especially the eurozone economy and several emerging economies, such as China. There are short- to medium-term dangers for the world economy from political conflicts, such as that between Russia and the West over Ukraine. But there are long-term dangers too. These come from the effects of subdued private investment and low infrastructure spending by governments.

Her views are backed up by the six-monthly World Economic Outlook, published by the IMF on 7 October. There are links below to two webcasts from the IMF discussing the report and the accompanying datasets.

In the final webcast link below, Lord Turner argues that there is a “real danger of a simultaneous slowdown producing a big setback to growth expectations.” He is particularly worried about China, which is experiencing an asset price bubble and slowing economic growth. Other emerging economies too are suffering from slowing growth. This poses real problems for developed countries, such as Germany, which are heavily reliant on their export sector.

Webcasts

The Challenges Facing the Global Economy: New Momentum to Overcome a New Mediocre IMF Videos, Christine Lagarde (full speech) (2/10/14)
Christine Lagarde downbeat on global economy BBC News Canada, Christine Lagarde interviewed by Katy Kay (2/10/14)
IMF’s Lagarde on Global Economy, Central Banks Bloomberg TV, Christine Lagarde interviewed by Tom Keene (2/10/14)
Lagarde: Global economy weaker than envisioned 6 months ago, IMF to cut growth outlook CNBC (2/10/14)
IMF Says Uneven Global Growth Disappoints IMF Videos, Olivier Blanchard (7/10/14)
Time Is Right for an Infrastructure Push IMF Videos, Abdul Ablad (30/9/14)
China slowdown poses ‘biggest risk to global economy’ The Telegraph, Adair Turner (4/10/14)

Articles

Global Growth Disappoints, Pace of Recovery Uneven and Country-Specific IMF Survey Magazine (7/10/14)
Global economy risks becoming stuck in low growth trap The Telegraph, Szu Ping Chan (2/10/14)
American Exceptionalism Thrives Amid Struggling Global Economy Bloomberg, Rich Miller and Simon Kennedy (4/10/14)
World Bank cuts China growth forecast for next three years BBC News (6/10/14)
Beware a Chinese slowdown The Guardian, Kenneth Rogoff (6/10/14)
IMF says economic growth may never return to pre-crisis levels The Guardian, Larry Elliott (7/10/14)
IMF goes back to the future with gloomy talk of secular stagnation The Guardian, Larry Elliott (7/10/14)

Data

World Economic Outlook Database IMF (7/10/14)
World Economic Outlook IMF (October 2014)

Questions

  1. What are the particular ‘headwinds’ facing the global economy?
  2. Why is the outlook for the global economy more pessimistic now than six months ago?
  3. Why are increasing levels of debt and asset price rises a threat to Chinese economic growth?
  4. Why may China be more able to deal with high levels of debt than many other countries?
  5. In what ways are commodity prices an indicator of the confidence of investors about future economic growth?
  6. What are the determinants of long-term economic growth? Why are potential economic growth rates lower today than in the 2000s?
  7. How might governments today boost long-term economic growth?
  8. What are the arguments for and against governments engaging in large-scale public investment in infrastructure projects? What would be the supply-side and demand-side effects of such policies?
  9. If confidence is a major determinant of investment, how might bodies such as the IMF boost confidence?
  10. Why does the IMF caution against over-aggressive attempts to reduce budget deficits?

On my commute to work on the 6th October, I happened to listen to a programme on BBC radio 4, which provided some fascinating discussion on climate change, growth, capitalism and the need for co-operation. With more countries emerging as leading economic powers, pollution and emissions continue to grow. Is it time for a green revolution?

The programme considers some ‘typical’ policies and also discusses some radical solutions. There is discussion on developing and developed nations and how these countries should be looked at in terms of compensation, entitlement and aid. Carrots and sticks are analysed as means of saving the planet and how environmental damage can be reduced, without adversely affecting the growth rate of the world economy. I won’t say any more, but it’s certainly worth listening to, for an interesting discussion on one of the biggest problems that governments across the world are facing and it is not going to go away any time soon.

Naomi Klein on climate change and growth BBC Radio 4, Start the Week (6/10/14)

Questions

  1. What are the market failures with the environment?
  2. Why is global co-operation so important for tackling the problem of climate change?
  3. Which policies are discussed as potential solutions to the problem of climate change?
  4. What has been the problem with the European carbon trading scheme?
  5. Why may there be a trade-off between capitalism, growth and the problem of carbon emissions?
  6. To what extent do you think that countries such as Bangladesh should be ‘compensated’?