How would your life be without the internet? For many of you, this is a question that may be difficult to answer – as the internet has probably been an integral part of your life, probably since a very young age. We use internet infrastructure (broadband, 4G, 5G) to communicate, to shop, to educate ourselves, to keep in touch with each other, to buy and sell goods and services. We use it to seek and find new information, to learn how to cook, to download music, to watch movies. We also use the internet to make fast payments, transfer money between accounts, manage our ISA or our pension fund, set up direct debits and pay our credit-card bills.
I could spend hours writing about all the things that we do over the internet these days, and I would probably never manage to come up with a complete list. Just think about how many hours you spend online every day. Most likely, much of your waking time is spent using internet-based services one way or another (including apps on your phone, streaming on your phone, tablet or your smart TV and similar). If your access to the internet was disrupted, you would certainly feel the difference. What if you just couldn’t afford to have computer or internet access? What effect would that have on your education, your ability to find a job, and your income?
Martin Jenkins, a former homeless man, now entrepreneur, thinks that the magnitude of this effect is rather significant. In fact, he is so convinced about the importance of bringing the internet to poorer households, that he recently founded a company, Neptune, offering low-income households in the Bronx district of New York free access to online education, healthcare and finance portals. His venture was mentioned in a recent (and very interesting) BBC article – a link to which can be found at the end of this blog. But is internet connectivity really that important when it comes to economic and labour market outcomes? And is there a systematic link between economic growth and internet penetration rates?
These are all questions that have been the subject of intensive debate over the last few years, in the context of both developed and developing economies. Indeed, the ‘digital divide’ as it is known (the economic gap between the internet haves and have nots) is not something that concerns only developing countries. According to a recent policy brief published by the New York City Comptroller:
More than one-third (34 percent) of households in the Bronx lack broadband at home, compared to 30 percent in Brooklyn, 26 percent in Queens, 22 percent in Staten Island, and 21 percent in Manhattan.
The report goes on to present data on the percentage of households with internet connection at home by NYC district, and it does not take advanced econometric skills for one to notice that there is a clear link between median district income and broadband access. Wealthier districts (e.g. Manhattan Community District 1 & 2 – Battery Park City, Greenwich Village & Soho PUMA), tend to have a significantly higher share of households with broadband access, than less affluent ones (e.g. NYC-Brooklyn Community District 13 – Brighton Beach & Coney Island PUMA) – 88% of total households compared with 58%.
But, do these large variations in internet connectivity matter? The evidence is mixed. On the one hand, there are several studies that find a clear, strong link between internet penetration and economic growth. Czernich et al (2011), for instance, using data on OECD countries over the period 1996–2007, find that “a 10 percentage point increase in broadband penetration raised annual per capita growth by 0.9–1.5 percentage points”.
Another study by Koutroumpis (2018) examined the effect of rolling out broadband in the UK.
For the UK, the speed increase contributed 1.71% to GDP in total and 0.12% annually. Combining the effect of the adoption and speed changes increased UK GDP by 6.99% cumulatively and 0.49% annually on average”. (pp.10–11)
The evidence is less clear, however, when one tries to estimate the benefits between different types of workers – low and high skilled. In a recent paper, Atasoy (2013) finds that:
gaining access to broadband services in a county is associated with approximately a 1.8 percentage point increase in the employment rate, with larger effects in rural and isolated areas.
But then he adds:
most of the employment gains result from existing firms increasing the scale of their labor demand and from growth in the labor force. These results are consistent with a theoretical model in which broadband technology is complementary to skilled workers, with larger effects among college-educated workers and in industries and occupations that employ more college-educated workers.
Similarly, Forman et al (2009) analyse the effect of business use of advanced internet technology and local variation in US wage growth, over the period 1995–2000. Their findings show that:
Advanced internet technology is associated with larger wage growth in places that were already well off. These are places with highly educated and large urban populations, and concentration of IT-intensive industry. Overall, advanced internet explains over half of the difference in wage growth between these counties and all others.
How important then is internet access as a determinant of growth and economic activity and what role does it have in bridging economic disparities between communities? The answer to this question is most likely ‘very important’ – but less straightforward than one might have assumed.
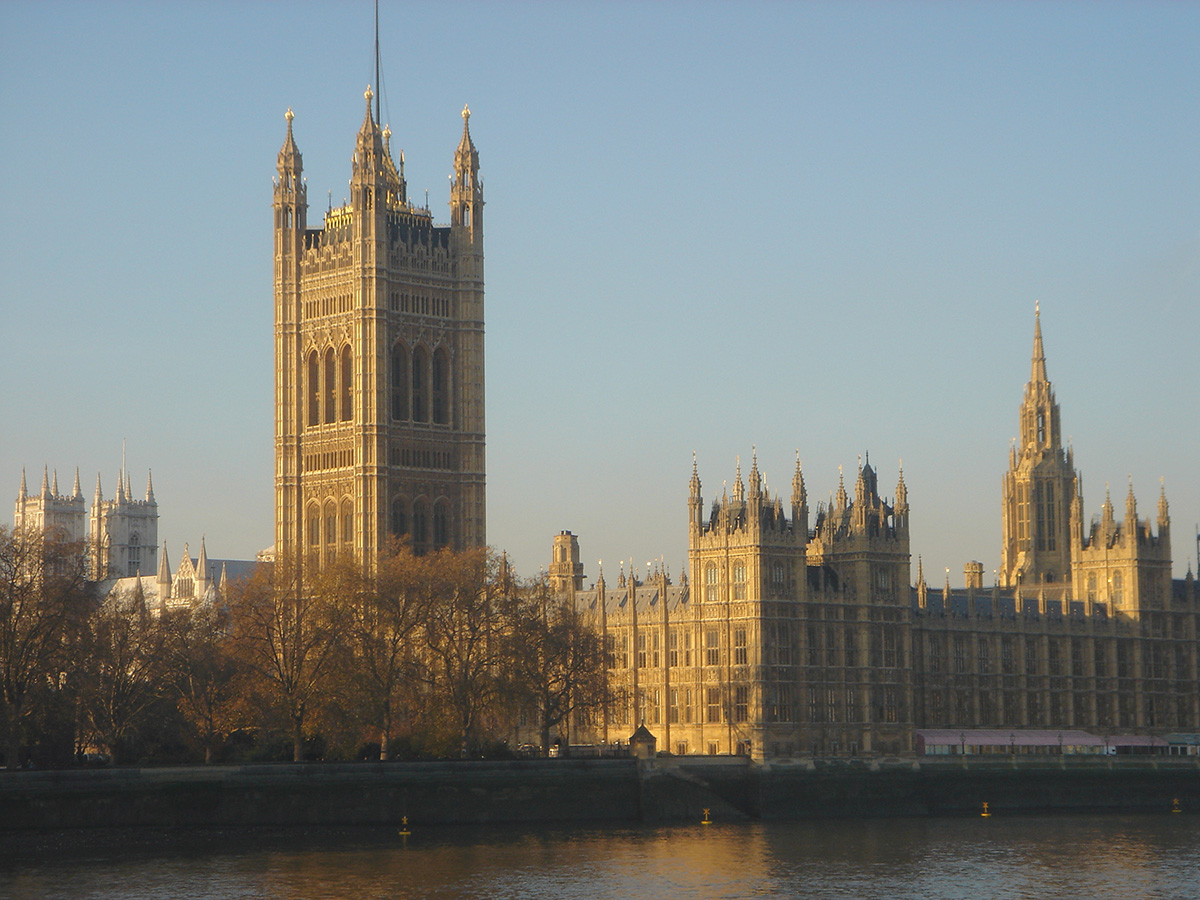
With the UK parliament in Brexit gridlock, the Labour opposition is calling for a general election. Although its policy over Brexit and a second referendum is causing splits in the party, the Labour party is generally agreed that pubic expenditure on health, education and transport infrastructure needs to increase – that there needs to be an end to fiscal austerity. However, to fund extra public expenditure would require an increase in taxes and/or an increase in government borrowing.
One of the arguments against increasing government borrowing is that it will increase public-sector debt. The desire to get public-sector debt down as a percentage of GDP has been central to both the Coalition and Conservative governments’ economic strategy. Austerity policies have been based on this desire.
But, in the annual presidential address to the American Economics Association, former chief economist at the IMF, Olivier Blanchard, criticised this position. He has argued for several years that cutting government deficits may weaken already weak economies and that this may significantly reduce tax revenues and potential national income, thereby harming recovery and doing long-term economic damage. Indeed, the IMF has criticised excessively tight fiscal policies for this reason.
In his presidential address, he expanded the argument to consider whether an increase in government borrowing will necessarily increase the cost of servicing government debt. When the (nominal) interest rate (r) on government borrowing is below the nominal rate of economic growth (gn), (r < gn), then even if total debt is not reduced, it is likely that the growth in tax revenues will exceed the growth in the cost of servicing the debt. Debt as a proportion of GDP will fall. The forecast nominal growth rate exceeds the 10-year nominal rate on government bonds by 1.3% in the USA, 2.2% in the UK and 1.8% in the eurozone. In fact, with the exception of a short period in the 1980s, nominal growth (gn) has typically exceeded the nominal interest rate on government borrowing (r) for decades.
When r < gn, this then gives scope for increasing government borrowing to fund additional government spending without increasing the debt/GDP ratio. Indeed, if that fiscal expansion increases both actual and potential income, then growth over time could increase, giving even more scope for public investment.
Peterson Institute on YouTube, Olivier Blanchard (4/1/19)
Questions
What do you understand by ‘fiscal illusion’?
What is the justification for reducing government debt as a proportion of GDP?
What are the arguments against reducing government debt as a proportion of GDP?
Explain the significance of the relationship between r and gn for fiscal policy and the levels of government debt, government borrowing and the government debt/GDP ratio.
Under what circumstances would a rise in the budget deficit not lead to a rise in government debt as a proportion of GDP?
Does Blanchard’s analysis suggest that a combination of both loose monetary policy and loose fiscal policy is desirable?
Under Blanchard’s analysis, what would limit the amount that governments should increase spending?
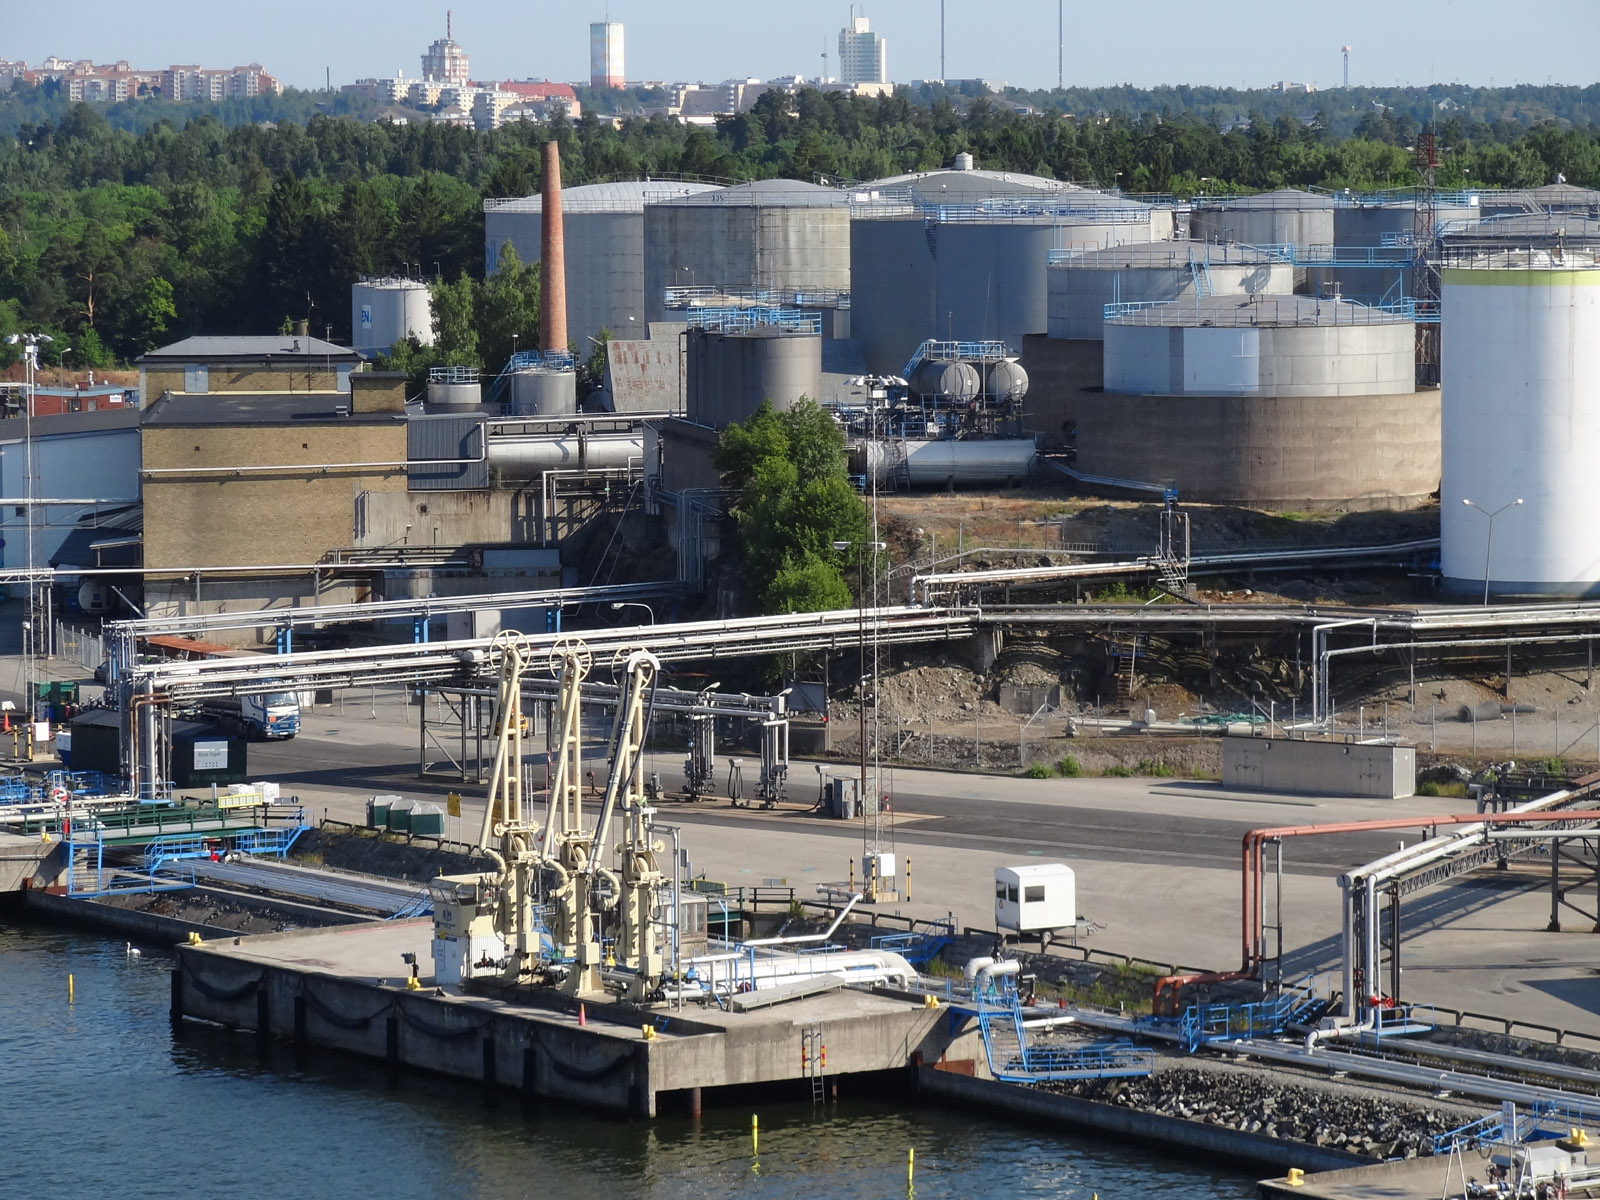
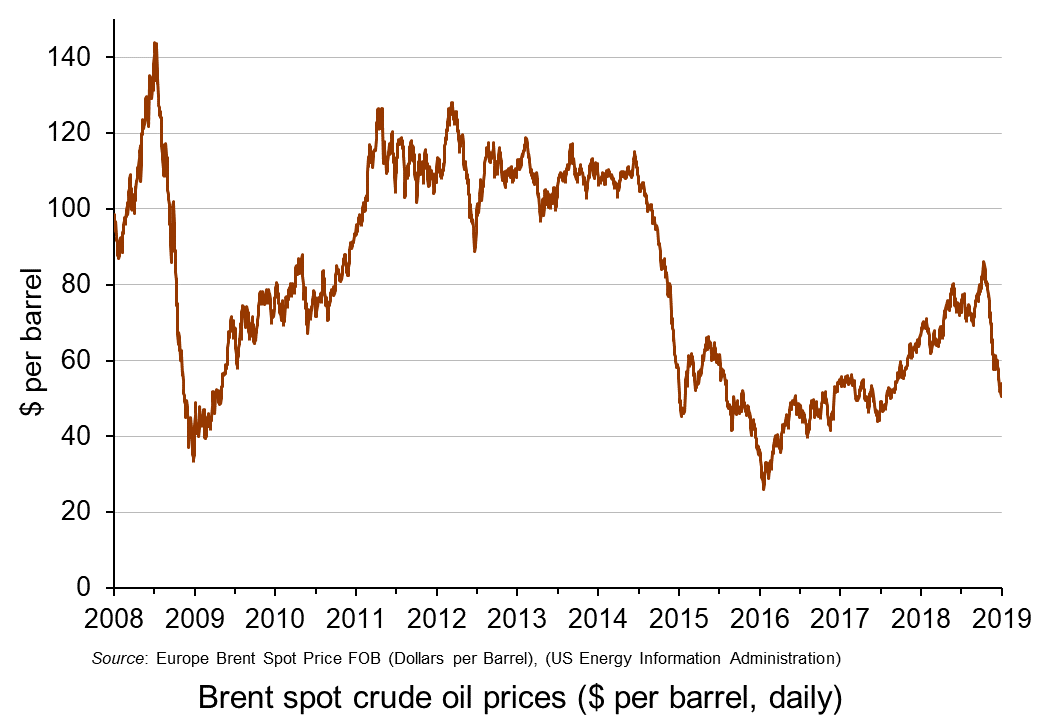
Back in October, we examined the rise in oil prices. We said that, ‘With Brent crude currently at around $85 per barrel, some commentators are predicting the price could reach $100. At the beginning of the year, the price was $67 per barrel; in June last year it was $44. In January 2016, it reached a low of $26.’ In that blog we looked at the causes on both the demand and supply sides of the oil market. On the demand side, the world economy had been growing relatively strongly. On the supply side there had been increasing constraints, such as sanctions on Iran, the turmoil in Venezuela and the failure of shale oil output to expand as much as had been anticipated.
But what a difference a few weeks can make!
Brent crude prices have fallen from $86 per barrel in early October to just over $50 by the end of the year – a fall of 41 per cent. (Click here for a PowerPoint of the chart.) Explanations can again be found on both the demand and supply sides.
On the demand side, global growth is falling and there is concern about a possible recession (see the blog: Is the USA heading for recession?). The Bloomberg article below reports that all three main agencies concerned with the oil market – the U.S. Energy Information Administration, the Paris-based International Energy Agency and OPEC – have trimmed their oil demand growth forecasts for 2019. With lower expected demand, oil companies are beginning to run down stocks and thus require to purchase less crude oil. Fracking (Source: US Bureau of Land Management Environmental Assessment, public domain image)
On the supply side, US shale output has grown rapidly in recent weeks and US output has now reached a record level of 11.7 million barrels per day (mbpd), up from 10.0 mbpd in January 2018, 8.8 mbpd in January 2017 and 5.4 mbpd in January 2010. The USA is now the world’s biggest oil producer, with Russia producing around 11.4 mpbd and Saudi Arabia around 11.1 mpbd.
Total world supply by the end of 2018 of around 102 mbpd is some 2.5 mbpd higher than expected at the beginning of 2018 and around 0.5 mbpd greater than consumption at current prices (the remainder going into storage).
So will oil prices continue to fall? Most analysts expect them to rise somewhat in the near future. Markets may have overcorrected to the gloomy news about global growth. On the supply side, global oil production fell in December by 0.53 mbpd. In addition OPEC and Russia have signed an accord to reduce their joint production by 1.2 mbpd starting this month (January). What is more, US sanctions on Iran have continued to curb its oil exports.
But whatever happens to global growth and oil production, the future price will continue to reflect demand and supply. The difficulty for forecasters is in predicting just what the levels of demand and supply will be in these uncertain times.
One of the announcements in the recent UK Budget was the ending of the Private Finance Initiative (PFI), including its revised form, PF2. PFI was introduced by the Conservative government in 1992. Subsequently, it was to become central to the Labour government’s ‘Third-way’ approach of using the private sector to deliver public projects and services.
PFI involves a public–private partnership (PPP). The private sector builds and/or runs public projects, such as new schools, hospitals, roads, bridges, student accommodation, and so on. The public sector, in the form of government departments, NHS foundation trusts, local authorities, etc., then pays the private sector company a rent for the infrastructure or pays the company to provide services. The benefit of PFI is that it allows private-sector capital to be used for new projects and thus reduces the need for government to borrow; the disadvantage is that it commits the public-sector body to payments over the long-term to the company involved.
As the chart shows, PFI became an important means of funding public service provision during the 2000s. In the 10-year period up to financial year 2007/08, more than 50 new projects were being signed each year.
As the number of projects grew and with them the long-term financial commitments of the public sector, so criticisms mounted. These included:
Quality and cost. It was claimed that PFI projects were resulting in poorer quality of provision and that cost control was often poor, resulting in a higher burden for the taxpayer in the long term.
Credit availability. PFI projects are typically dependent on the private partner using debt finance to acquire the necessary funds. Therefore, credit conditions affect the ability of PFI to fund the delivery of public services. With the credit crunch of 2008/9, many firms operating PFI projects found it difficult to raise finance.
The financial health of the private partner. What happens if the private company runs into financial difficulties. In 2005, the engineering company Jarvis only just managed to avoid bankruptcy by securing refinancing on all 14 of its PFI deals.
PF2
Recognising these problems, in 2011 the government set up a review of PFI. The result was a revised form of PFI, known as ‘PF2’. PF2 projects involved tighter financial control, with the government acting as a minority co-investor; more robust tendering processes, with bidders required to develop a long-term financing solution, where bank debt does not form the majority of the financing of the project; the removal of cleaning, catering and other ‘soft services’.
Despite the government’s intention that PPPs remain an important plank of its funding of public services, the number of new PFI/PF2 projects has nonetheless declined sharply during the 2010s as the chart shows. Of the 715 PPP projects as of 31 March 2017, 631 had been signed before May 2010. Indeed, in 2016/17 only 1 new project was signed.
The collapse of Carillion
Concerns over PPPs remained despite the reforms under PF2. These were brought dramatically into focus with the collapse of Carillion plc (see the blog, Outsourcing, PFI and the demise of Carillion). Carillion was a British company focused on construction and facilities management (i.e. support services for organisations). It was a significant private-sector partner in PPP projects. By 2014 it had won 60 PPP projects in the UK and Canada, including hospitals, schools, university buildings, prisons, roads and railways.
However, Carillion had increasing burdens of debt, caused, in part, by various major acquisitions, including McAlpine in 2008. Events came to a head when, on 15 January 2018, an application was made to the High Court for a compulsory liquidation of the company.
A subsequent report for the House of Commons Public Administration and Constitutional Affairs Committee in light of the collapse of Carillion found that procurement procedures were fundamentally flawed. It found that contracts were awarded based on cost rather than quality. This meant that some contracts were not sustainable. Between 2016 and the collapse of Carillion the government had been forced to renegotiate more than £120m of contracts so that public services could continue.
The ending of PPPs?
On 18 January 2018, the National Audit Office published an assessment of PFI and PF2. The report stated that there were 716 PFI and PF2 projects at the time, either under construction or in operation, with a total capital value of £59.4 billion. In recent years, however, ‘the government’s use of the PFI and PF2 models had slowed significantly, reducing from, on average, 55 deals each year in the five years to 2007/8 to only one in 2016/17.’
At its conference in September 2018, the Labour shadow chancellor, John McDonnell, said that, if elected, a Labour government would not award any new PFI/PF2 contracts. He claimed that PFI/PF2 contracts were set to cost the taxpayer £200bn over the coming decade. Labour policy would be to review all existing PFI/PF2 contracts and bring the bulk of them fully back into the public sector.
Then in the Budget of 29 October 2018, the Chancellor announced that no further PFI/PF2 projects would be awarded, although existing ones would continue.
I have never signed off a PFI contract as chancellor, and I can confirm today that I never will. I can announce that the government will abolish the use of PFI and PF2 for future projects.
We will honour existing contracts. But the days of the public sector being a pushover, must end. We will establish a centre of excellence to actively manage these contracts in the taxpayers’ interest, starting in the health sector.
But does this mean that there will be no more public-private partnerships, of which PFI is just one example? The answer is no. As the Chancellor stated:
And in financing public infrastructure, I remain committed to the use of public-private partnership where it delivers value for the taxpayer and genuinely transfers risk to the private sector.
But just what form future PPPs will take is unclear. Clearly, the government will want to get value for money, but that depends on the mechanisms used to ensure efficient and high-quality projects. What is more, there is still the danger that the companies involved could end up with unsustainable levels of debt if economic circumstances change and it will still involve a burden on the taxpayer for the future.
Find out how PF2 differs from PFI and assess the extent to which it overcame the problems identified with PFI.
The government is not bringing back existing PFI contracts into the public sector, whereas the Labour Party would do so – at least with some of them. Assess the arguments for and against bringing PFI contracts ‘in-house’.
Find out why Carillion collapsed. To what extent was this due to its taking on PFI contracts?
The government still supports the use of public-private partnerships (PPPs). What form could these take other than as PFI/PF2 contracts? Would the problems associated with PFI/PF2 also apply to PPPs in general?
Source: Wikimedia Commons: author, Today Testing (https://todaytesting.com)In his Budget on 29 October, the UK Chancellor, Philip Hammond, announced a new type of tax. This is a ‘digital services tax’, which, after consultation, he is planning to introduce in April 2020. The target of the tax is the profits made by major companies providing social media platforms (e.g. Facebook and Twitter), internet marketplaces (e.g. Amazon and eBay) or search engines (such as Alphabet’s Google).
The proposed digital services tax is a 2% tax on the revenues earned by such companies in the UK. It would only apply to large companies, defined as those whose global revenue is at least £500m a year. It is expected to raise around £400m per year.
The EU is considering a similar tax at a rate of 3%. India, Pakistan, South Korea and several other countries are considering introducing digital taxes. Indeed, many countries are arguing for a worldwide agreement on such a tax. The OECD is studying the implications of the possible use of such a tax by its 36 members. If an international agreement on such a tax can be reached, a separate UK tax may not go ahead. As the Chancellor stated in his Budget speech:
In the meantime we will continue to work at the OECD and G20 to seek a globally agreed solution. And if one emerges, we will consider adopting it in place of the UK Digital Services Tax.
The proposed UK tax is a hybrid between direct and indirect taxes. Like corporation tax, a direct tax, its aim is to tax companies’ profits. But, unlike corporation tax, it would be harder for such companies to avoid. Like VAT, an indirect tax, it would be a tax on revenue, but, unlike VAT, it would be an ‘end-stage’ tax rather than a tax on value added at each stage of production. Also, it would not be a simple sales tax on companies as it would be confined to revenue (such as advertising revenue) earned from the use in the UK of search engines, social media platforms and online marketplaces. As the Chancellor said in his speech.
It is important that I emphasise that this is not an online-sales tax on goods ordered over the internet: such a tax would fall on consumers of those goods – and that is not our intention.
There is, however, a political problem for the UK in introducing such a tax. The main companies it would affect are American. It is likely that President Trump would see such taxes as a direct assault on the USA and could well threaten retaliation. As the Accountancy Age article states, ‘Dragging the UK into an acrimonious quarrel with one of its largest trading partners is perhaps not what the Chancellor intends.’ This will be especially so as the UK seeks to build new trading relationships with the USA after Brexit. As the BBC article states, ‘The chancellor will be hoping that an international agreement rides to his rescue before the UK tax has to be imposed.’
 How would your life be without the internet? For many of you, this is a question that may be difficult to answer – as the internet has probably been an integral part of your life, probably since a very young age. We use internet infrastructure (broadband, 4G, 5G) to communicate, to shop, to educate ourselves, to keep in touch with each other, to buy and sell goods and services. We use it to seek and find new information, to learn how to cook, to download music, to watch movies. We also use the internet to make fast payments, transfer money between accounts, manage our ISA or our pension fund, set up direct debits and pay our credit-card bills.
 With the UK parliament in Brexit gridlock, the Labour opposition is calling for a general election. Although its policy over Brexit and a second referendum is causing splits in the party, the Labour party is generally agreed that pubic expenditure on health, education and transport infrastructure needs to increase – that there needs to be an end to fiscal austerity. However, to fund extra public expenditure would require an increase in taxes and/or an increase in government borrowing.
 Back in October, we examined the
  Brent crude prices have fallen from $86 per barrel in early October to just over $50 by the end of the year – a fall of 41 per cent. (Click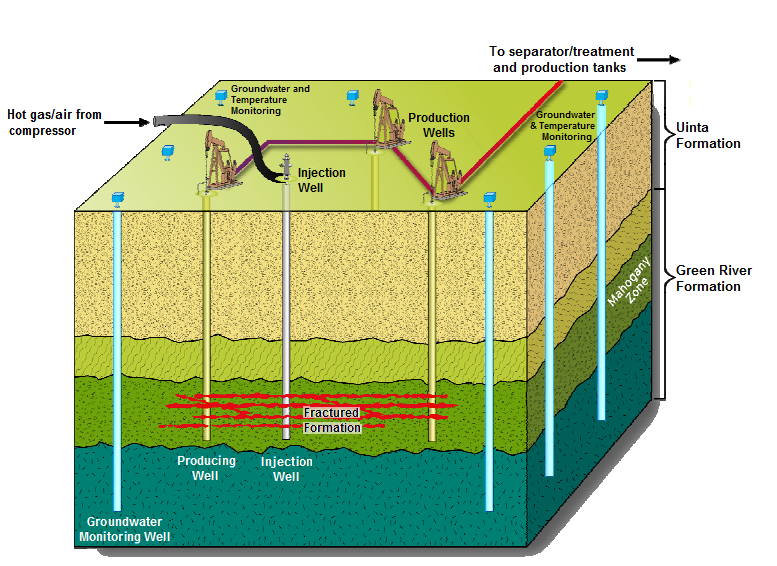
 One of the announcements in the recent UK Budget was the ending of the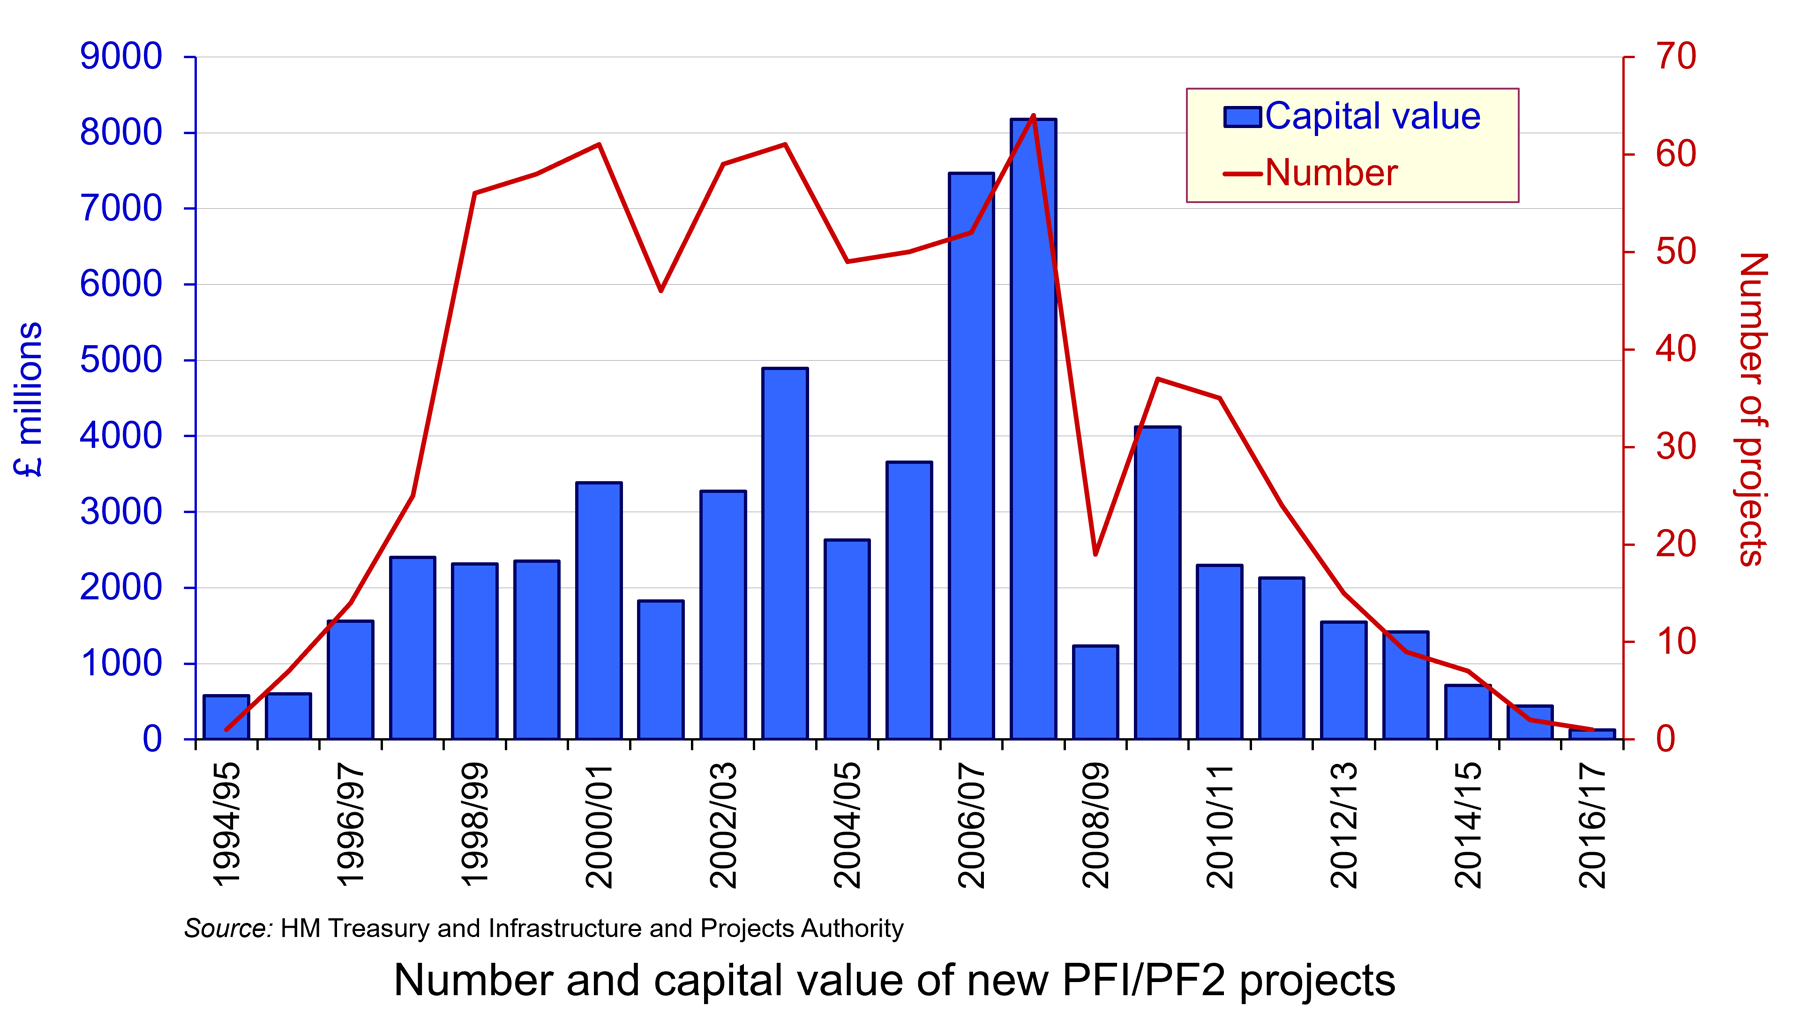
 Concerns over PPPs remained despite the reforms under PF2. These were brought dramatically into focus with the collapse of Carillion plc (see the blog,
 The proposed digital services tax is a 2% tax on the revenues earned by such companies in the UK. It would only apply to large companies, defined as those whose global revenue is at least £500m a year. It is expected to raise around £400m per year.