 The latest data in the Quarterly National Accounts show that UK households in 2015 spent £1.152 trillion, the equivalent of 62 per cent of the country’s Gross Domestic Product (GDP). In real terms, household spending rose by 2.8 per cent in 2015 in excess of the 2.3 per cent growth observed in GDP. In the final quarter of 2015 real household spending rose by 0.6 per – the same rate of growth as that recorded for the UK economy. This was the tenth consecutive quarter of positive consumption growth and the twelfth of economic growth.
It is the consistent growth seen over the recent past in real household spending that marks it out from the other components of aggregate demand. Consequently, household spending remains the bedrock of UK growth.
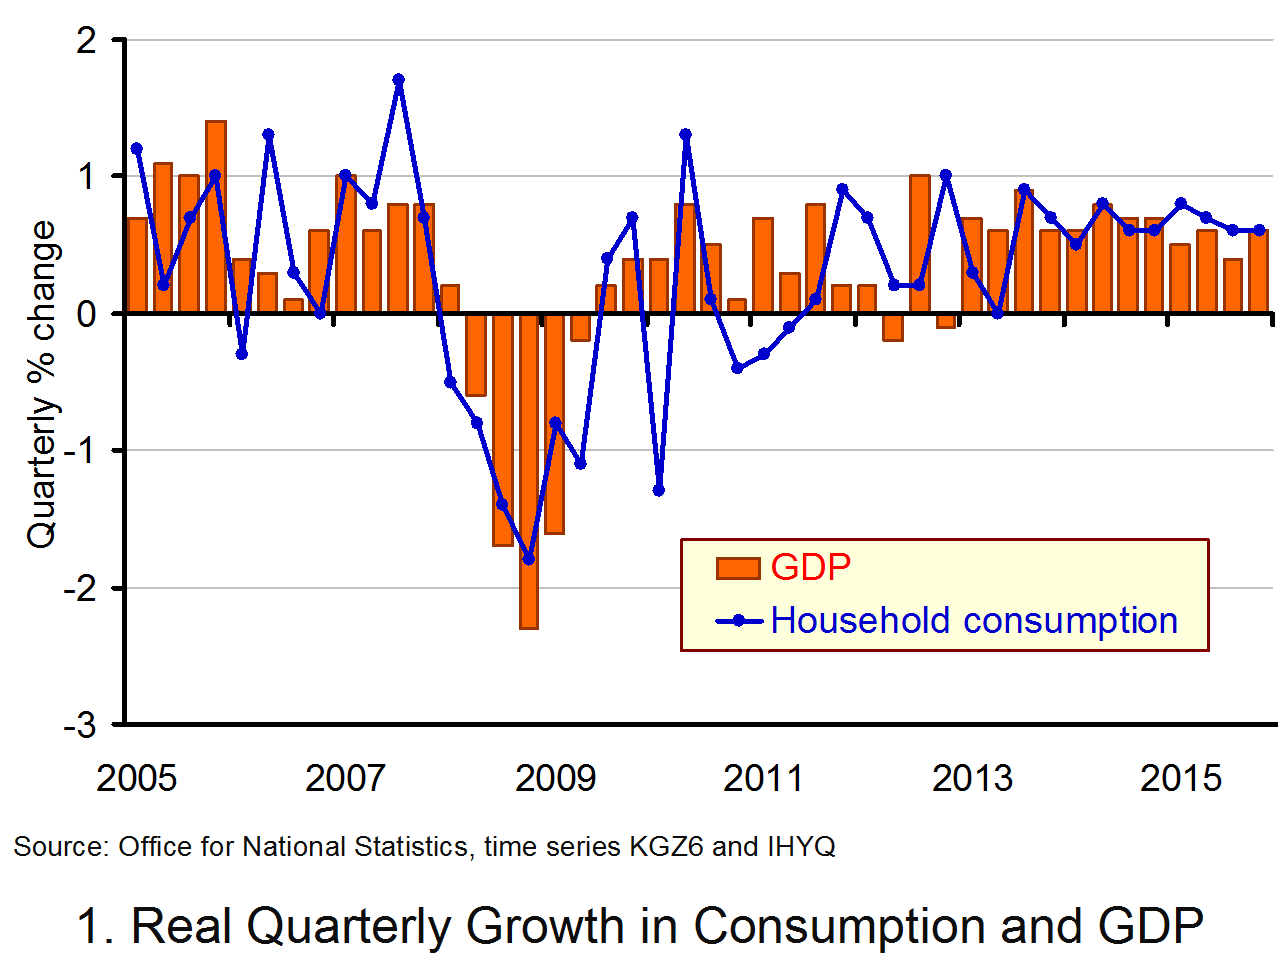 Chart 1 helps to evidence the close relationship between consumption and economic growth. It picks out nicely the stark turnaround both in economic growth and consumer spending following the financial crisis. Over the period from 2008 Q1 to 2011 Q2, real consumer spending typically fell by 0.4 per cent each quarter. This weakness in consumption was mirrored by economic growth. Real GDP contracted over this period by an average of 0.2 per cent each quarter. (Click here to download a PowerPoint of the chart.)
Since 2011 Q3 real consumption growth has averaged 0.6 per cent per quarter – the rate at which consumption grew in 2015 Q4 – while, real GDP growth has averaged 0.5 per cent per quarter. Over this same period the real disposable income (post-tax income) of the combined household and NPISH (non-profit institutions serving households), has typically grown by 0.4 per cent per quarter. (NPISHs are charities and voluntary organisations.)
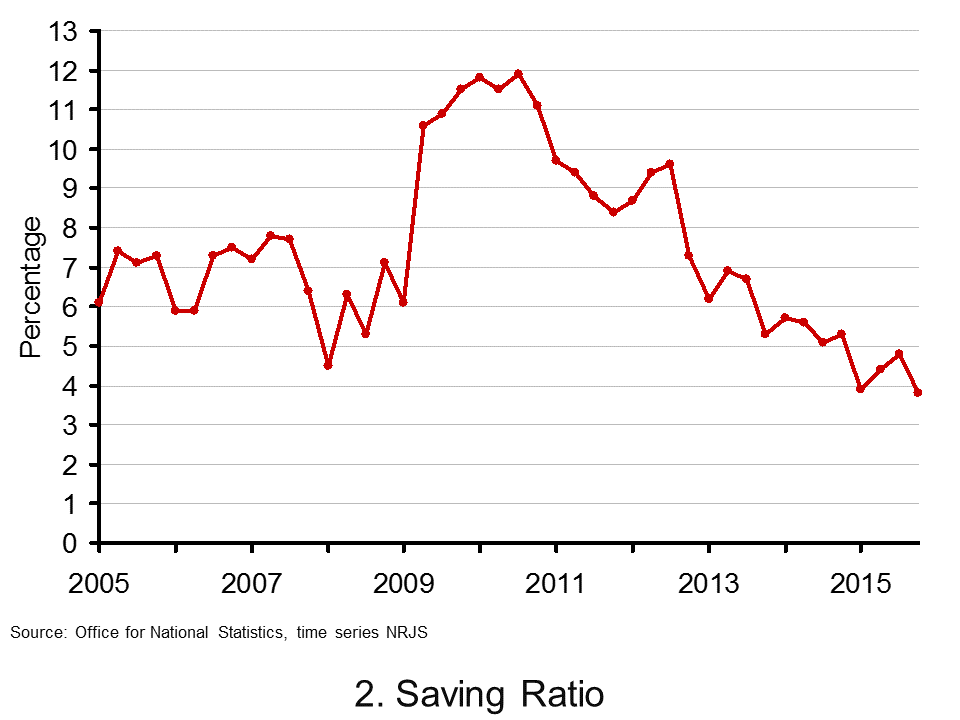 The strength of consumption relative to income is evidenced by the decline in the saving ratio as can be observed in Chart 2. The ratio captures the percentage of disposable income that households (and NPISHs) choose to save. In 2010 Q3 the proportion of income saved hit 11.9 per cent having been as low as 4.5 per cent in 2008 Q1. By 2015 Q4 the saving ratio had fallen to 3.8 per cent, the lowest value since the series began in 1963 Q1. (Click here to download a PowerPoint.)
The historic low in the saving ratio in the final quarter of 2015 reflects the strength of consumption alongside a sharp fall in real disposable income of 0.6 per cent in the quarter. However, the bigger picture shows a marked downward trend in the saving ratio over the period from 2012.
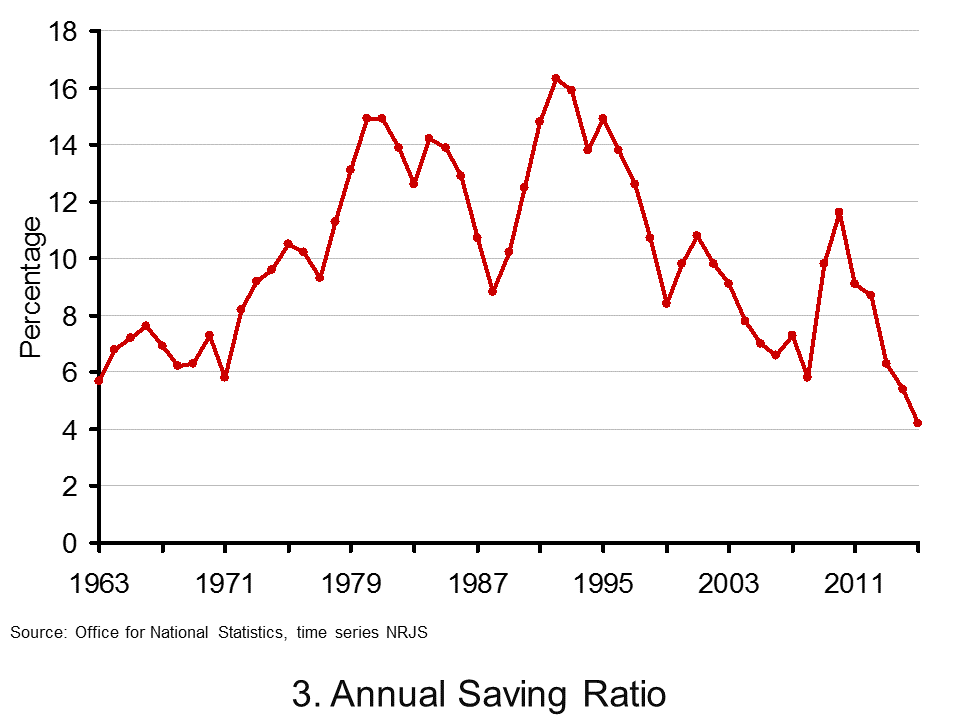 When seen in a more historic context the latest numbers taken on even greater significance. Chart 3 shows the annual saving ratio since 1963. From it we can see that the 2015 value of 4.2 was the first year when the ratio fell below 5 per cent. With 2014 being the previous historic low, there must be some concern that UK consumption growth is not being underpinned by income growth. (Click here to download a PowerPoint.)
 Of course, consumption theory places great emphasis on expected future income in determining current spending. To some extent it may be argued that households were liquidity-constrained following the financial crisis. They were unable to borrow to support spending and, as time moved on, to borrow against the expectation of stronger income growth in the future. This would have depressed consumption growth. But, there may also have been a self-imposed liquidity constraint as the financial crisis unfolded. Heightened uncertainty may have led households to be more prudent and divert resources to saving. Such precautionary saving would tend to boost the saving ratio and so may be a factor in the sharp rise we observed in the ratio.
 The easing of credit constraints as we headed through the early 2010s allied with stronger economic growth may help to explain the strength of the recovery in consumption growth. However, it is the extent and, in particular, the duration of this strong consumption growth that is fuelling a debate over its sustainability. The current uncertainty around future income growth and the need for households to be mindful of the indebtedness built up prior to the financial crisis point to households needing to retain a degree of caution. Consequently, the debates around the financial well-being of households and the need to rebalance the UK economy away from consumer spending are likely to be further intensified by the latest consumption and saving data.
Data
All data related to Quarterly National Accounts: Quarter 4 (Oct to Dec) 2015 Office for National Statistics
Office for National Statistics Office for National Statistics
Articles
Britons raid savings to fund spending as economists warn recovery ‘built on sand’ Telegraph, Szu Ping Chan (31/3/16)
UK Growth Higher But Deficit Hits New Record Sky News, (31/3/16)
Britain is a nation that has forgotten how to save Telegraph, Jeremy Warner (31/3/16)
A vulnerable economy: the true cost of Britain’s current account deficit Guardian, Larry Elliott (31/3/16)
U.K. Manufacturing ‘In the Doldrums’ Leaves Growth Lopsided Bloomberg, Emma Charlton (1/4/16)
Pound drops as UK manufacturing languishes in the doldrums Telegraph, Szu Ping Chan (1/4/16)
Questions
- Why is the distinction between nominal and real growth an important one when looking at many macroeconomic variables.
- Examine the argument that the historic low saving ratio in the UK is a cause for concern.
- What factors might we expect to impact on the saving ratio?
- To what extent do you think the current growth in consumer spending is sustainable?
- How important are expectations in determining consumer behaviour?
- Explain what you understand by consumption smoothing.
- Why would we would typically expect consumption growth to be less variable than that in disposable income?
- Why might consumption sometimes be observed to be less sensitive or more sensitive to income changes?
- What factors might cause households to be liquidity constrained?
- What is precautionary saving? What might affect its perceived importance among households?
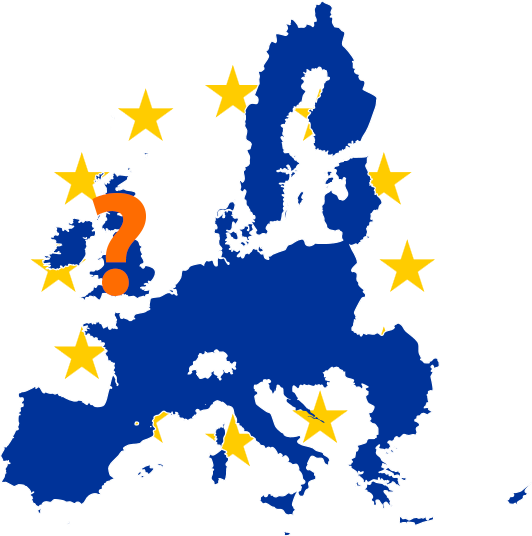 On 20 February, the UK Prime Minister, David Cameron, announced the date for the referendum on whether the UK should remain in or leave the EU. It will be on 23 June. The announcement followed a deal with EU leaders over terms of UK membership of the EU. He will argue strongly in favour of staying in the EU, supported by many in his cabinet – but not all.
Two days later, Boris Johnson, the Mayor of London, said that he would be campaigning for the UK to leave the EU.
In the meantime, Mr Johnson’s announcement, the stance of various politicians and predictions of the outcome of the referendum are having effects on markets.
One such effect is on the foreign exchange market. As the Telegraph article below states:
The pound suffered its biggest drop against the dollar in seven years after London Mayor Boris Johnson said he will campaign for Britain to leave the European Union [‘Brexit’].
Sterling fell by as much as 2.12pc to $1.4101 against the dollar on Monday afternoon, putting it on course for the biggest one day drop since February 2009. Experts said the influential Mayor’s decision made a British exit from the bloc more likely.
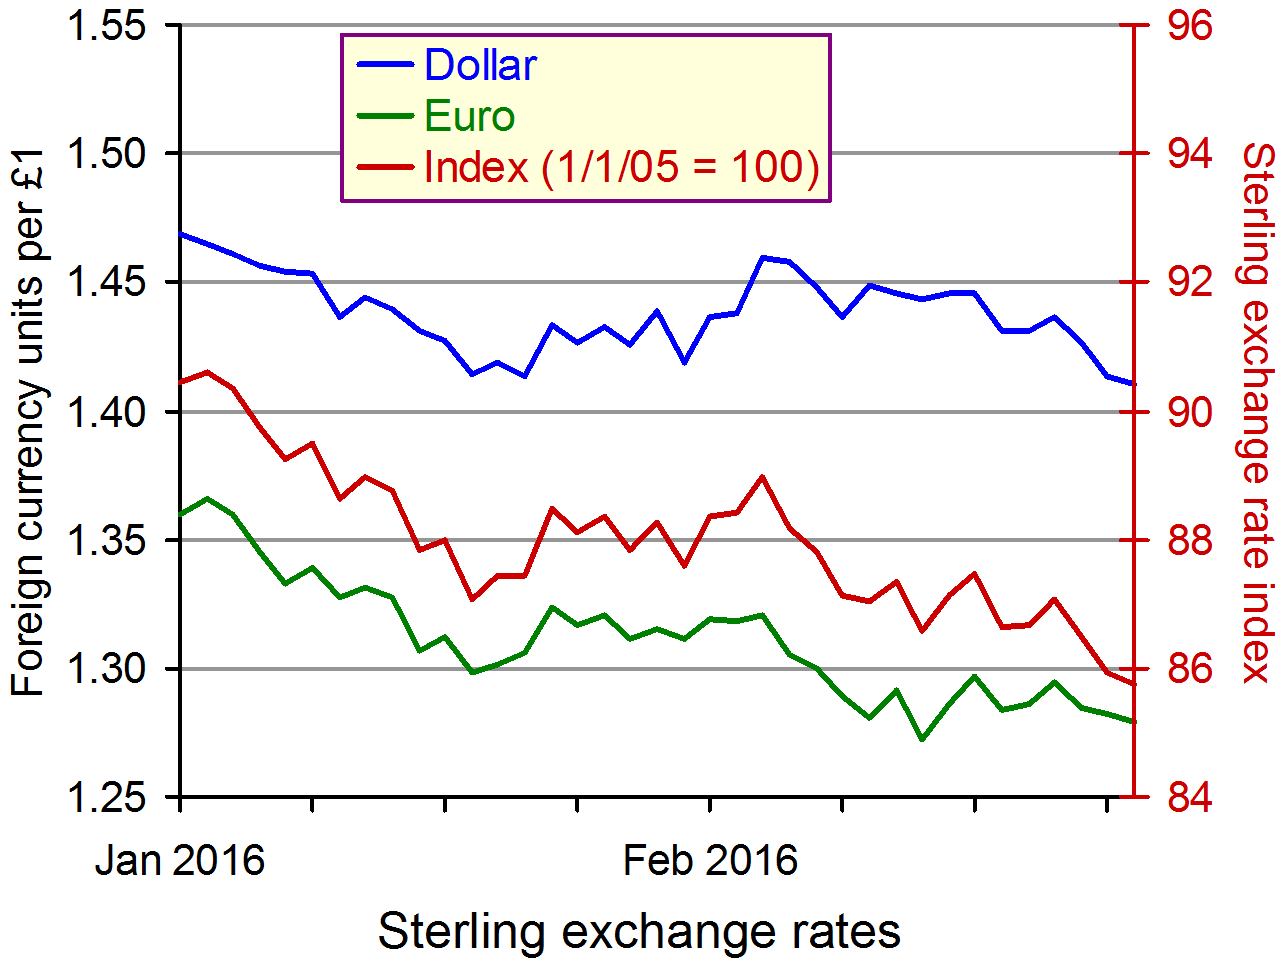
The pound also fell by as much as 1.2pc to €1.2786 against the euro and hit a two-year low against Japan’s yen.
This follows depreciation that has already taken place this year as predictions of possible Brexit have grown. The chart shows that from the start of the year to 23 February the sterling trade weighted index fell by 5.3% (click here for a PowerPoint).
But why has sterling depreciated so rapidly? How does this reflect people’s concerns about the effect of Brexit on the balance of payments and business more generally? Read the articles and try answering the questions below.
Articles
 Pound in Worst Day Since Banking Crisis as `Brexit’ Fears Bite Bloomberg, Eshe Nelson (21/2/16)
Pound hits 7-year low on Brexit fears Finiancial Times, Michael Hunter and Peter Wells (22/2/16)
Pound in freefall as Boris Johnson sparks Brexit fears The Telegraph, Szu Ping Chan (22/2/16)
Pound falls below $1.39 as economists warn Brexit could hammer households The Telegraph, Peter Spence (24/2/16)
Why is the pound falling and what does it mean for households and businesses? The Telegraph, Szu Ping Chan (23/2/16)
Pound heading for biggest one-day fall since 2009 on Brexit fears BBC News (22/2/16)
Cameron tries to sell EU deal after London mayor backs Brexit Euronews, Guy Faulconbridge and Michael Holden (22/2/16)
EU referendum: Sterling suffers biggest fall since 2010 after Boris Johnson backs Brexit International Business Times, Dan Cancian (22/2/16)
Exchange rate data
Spot exchange rates against £ sterling Bank of England
Questions
- What are the details of the deal negotiated by David Cameron over the UK’s membership of the EU?
- Why did sterling depreciate in (a) the run-up to the deal on UK EU membership and (b) after the announcement of the date of the referendum?
- Why did the FTSE100 rise on the first trading day after the Prime Minister’s announcement?
- What is the relationship between the balance of trade and the exchange rate?
- What are meant by the ‘six-month implied volatility in sterling/dollar’ and the ‘six-month risk reversals’?
- Why is it difficult to estimate the effect of leaving the EU on the UK’s balance of trade?
 In the UK, petrol prices have fallen significantly over the past couple of years and currently stand in some places at below £1 per litre. For UK residents, this price is seen as being cheap, but if we compare it to prices in Venezuela, we get quite a different picture. Prices are increasing here for the first time in 20 years from $0.01 per litre to $0.60 per litre – around 40 pence, while lower grade petrol increases to $0.10 per litre.
Venezuela has oil fields in abundance, but has not used this natural resource to its full potential to bolster the struggling economy. The price of petrol has been heavily subsidised for decades and the removal of this subsidy is expected to save around $800 million per year.
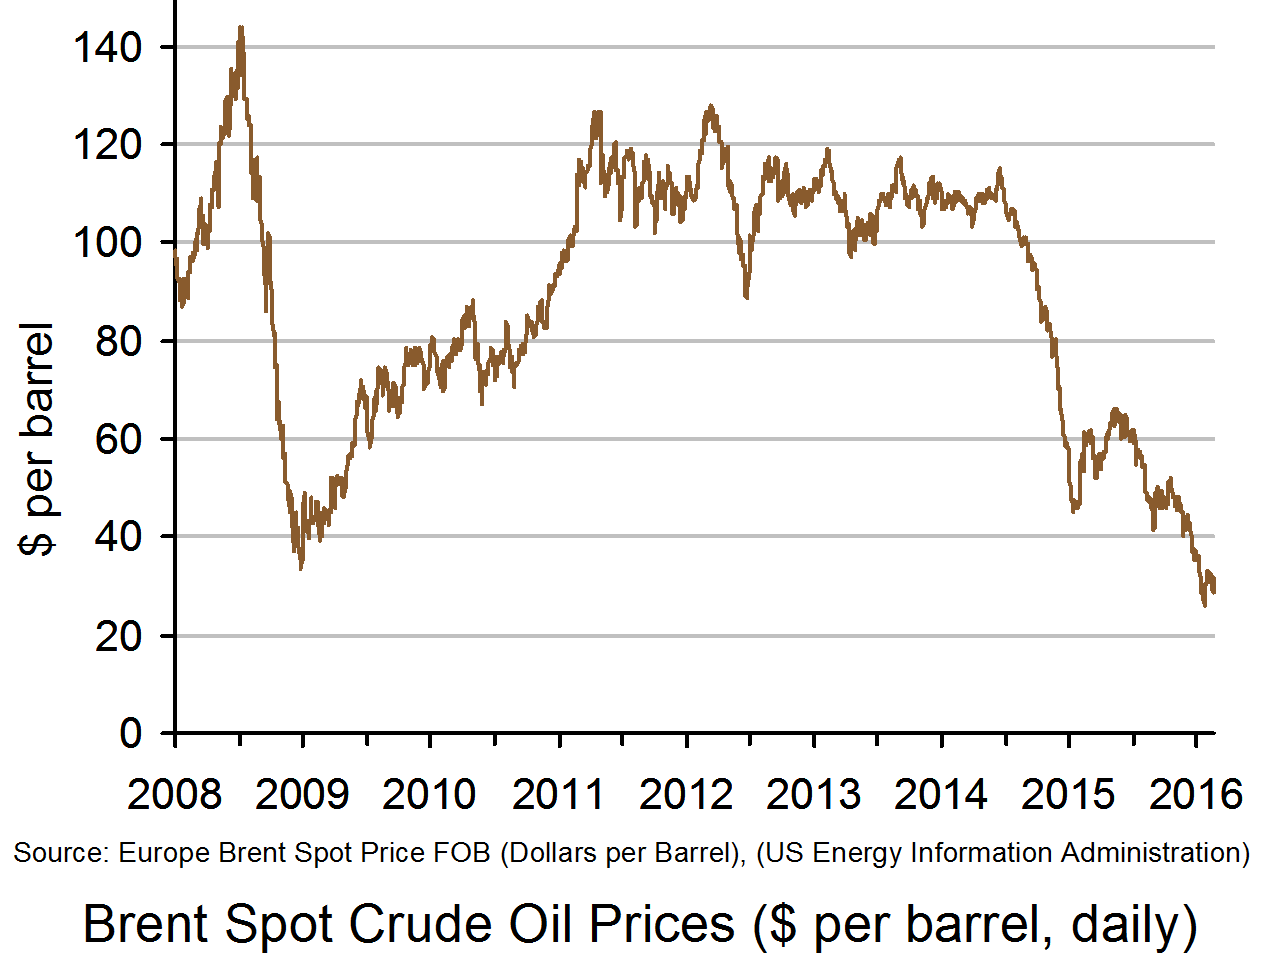 This will be important for the economy, given its poor economic growth, high inflation and shortages of some basic products. Venezuela relies on oil as the main component of its export revenues and so it has been hit very badly, by such low oil prices. The money from this reduced subsidy will be used to help social programmes across the country, which over time should help the economy.
In addition to this reduced subsidy on petrol prices, Venezuela’s President has also taken steps to devalue the exchange rate. This will help to boost the economy’s competitiveness and so is another policy being implemented to help the economy. However, some analysts have said that these changes don’t go far enough, calling them ‘small steps’, ‘nowhere near what is required’ and ‘late and insufficient’. The following articles consider the Venezuelan crisis and policies.
Venezuela raises petrol price for first time in 20 years BBC News (18/02/16)
Venezuela president raises fuel price by 6,000% and devalues bolivar to tackle crisis The Guardian, Sibylla Brodzinsky (18/02/16)
Venezuela’s Maduro devalues currency and raises gasoline prices Financial Times, Andres Schipani (18/02/16)
Venezuela hikes gasoline price for first time in 20 years The Economic Times (18/02/16)
Venezuela hikes fuel prices by 6000%, devalues currency to tackle economic crisis International Business Times, Avaneesh Pandey (18/02/16)
Market dislikes Venezuela reforms but debt rallies again Reuters (18/02/16)
Questions
- Why are oil prices so important for the Venezuelan economy?
- How will they affect the country’s export revenues and hence aggregate demand?
- Inflation in Venezuela has been very high recently. What is the cause of such high inflation? Illustrate this using an aggregate demand/aggregate supply diagram.
- How will a devaluation of the currency help Venezuela? How does this differ from a depreciation?
- Petrol prices have been subsidised in Venezuela for 20 years. Show how this government subsidy has affected petrol prices. Now that this subsidy is being reduced, how will this affect prices – show this on your diagram.
- Why are many analysts suggesting that these policies are insufficient to help the Venezuelan economy?
 Sustained economic growth in Japan remains elusive. Preliminary Quarterly Estimates of GDP point to the Japanese economy having contracted by 0.4 per cent in the final quarter of 2015. This follows on from growth of 0.3 per cent in the third quarter, a contraction of 0.3 per cent in the second and growth of 1 per cent in the first quarter. Taken as a whole output in 2015 rose by 0.4 per cent compared to zero growth in 2014. The fragility of growth means that over the past 20 years the average annual rate of growth in Japan is a mere 0.8 per cent.
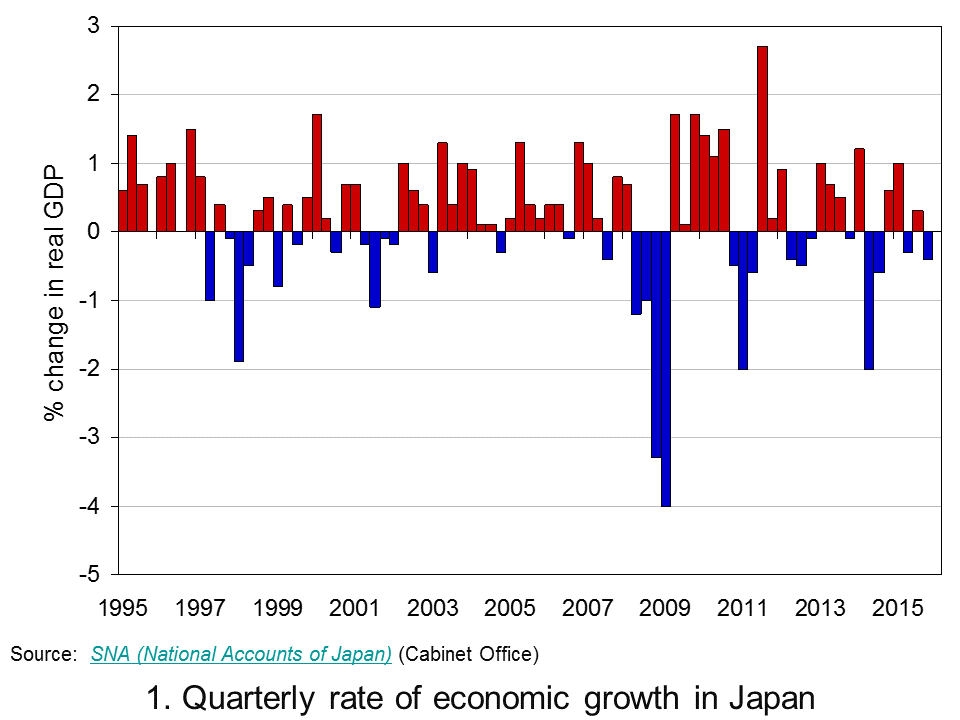 Chart 1 shows the quarter-to-quarter change in real GDP in Japan since the mid 1990s (Click here to download a PowerPoint of the chart). While economies are known to be inherently volatile the Japanese growth story over the past twenty or years so is one both of exceptional volatility and of repeated bouts of recession. Since the mid 1990s Japan has experienced 6 recessions, four since 2008.
Of the four recessions since 2008, the deepest was that from 2008 Q2 to 2009 Q1 which saw the economy shrink by 9.2 per cent. This was followed by a recession from 2010 Q4 to 2011 Q2 when the economy shrunk by 3.1 per cent, then from 2012 Q2 to 2012 Q4 when the economy shrunk by 0.9 per cent and from 2014 Q2 to 2014 Q3 when output fell another 2.7 per cent. As a result of these four recessionary periods the economy’s output in 2015 Q4 was actually 0.4 per cent less than in 2008 Q1.
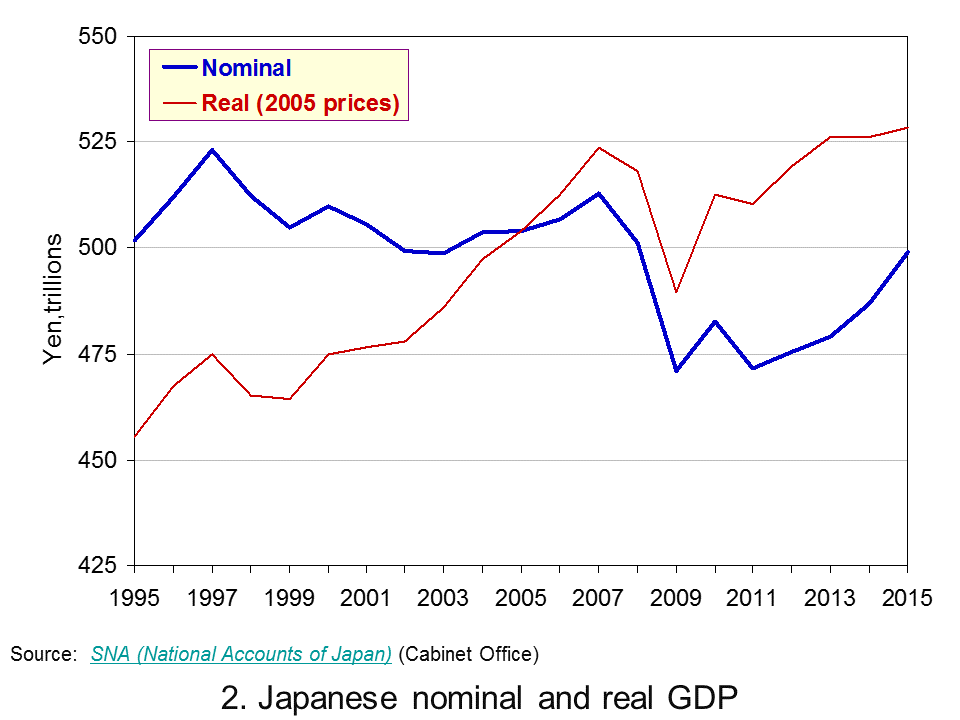 Chart 2 shows the annual levels of nominal (actual) and real (constant-price) GDP in trillions of Yen (¥) since 1995. (Click here to download a PowerPoint of the chart). Over the period actual GDP has fallen from ¥502 trillion to ¥499 trillion (about £3 trillion at the current exchange rate) while GDP at constant 2005 prices has risen from ¥455 trillion to ¥528 trillion.
Chart 2 reveals an interesting phenomenon: the growth in real GDP at the same time as a fall in nominal GDP. So why has the actual value of GDP fallen slightly between 1995 and 2005? The answer is quite simple: deflation.
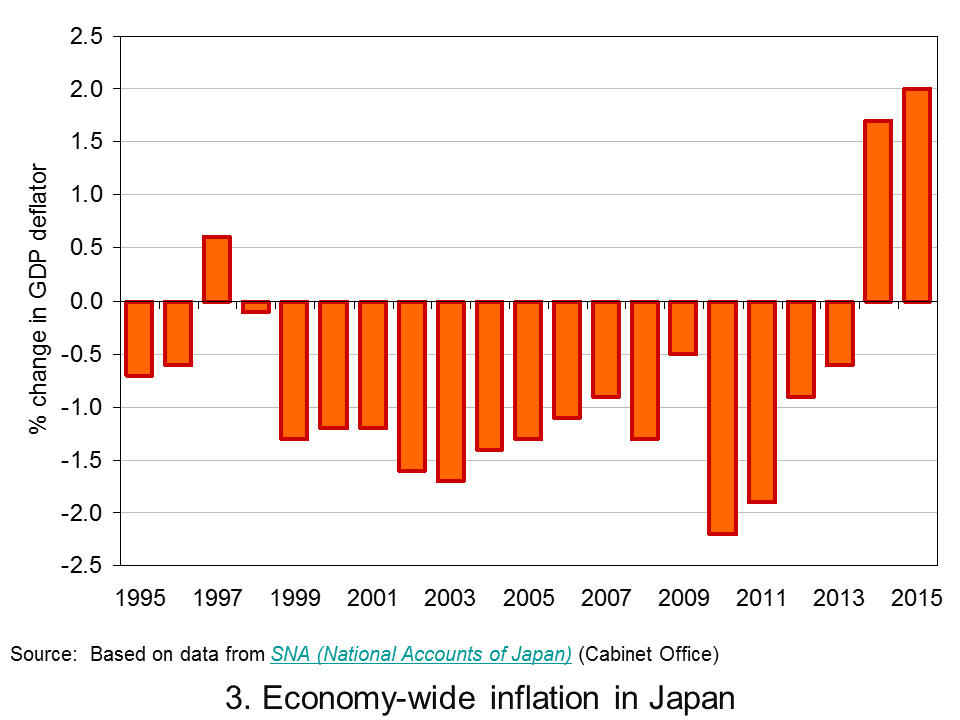 Chart 3 shows a protracted period of economy-wide deflation from 1999 to 2013. (Click here to download a PowerPoint of the chart). Over this period the GDP deflator fell each year by an average of 1.0 per cent. 2014 and 2015 saw a pick up in economy-wide inflation. However, the quarterly profile through 2015 shows the pace of inflation falling quite markedly. As we saw in Japan’s interesting monetary stance as deflation fears grow, policymakers are again concerned about the possibility of deflation and the risks that poses for growth.
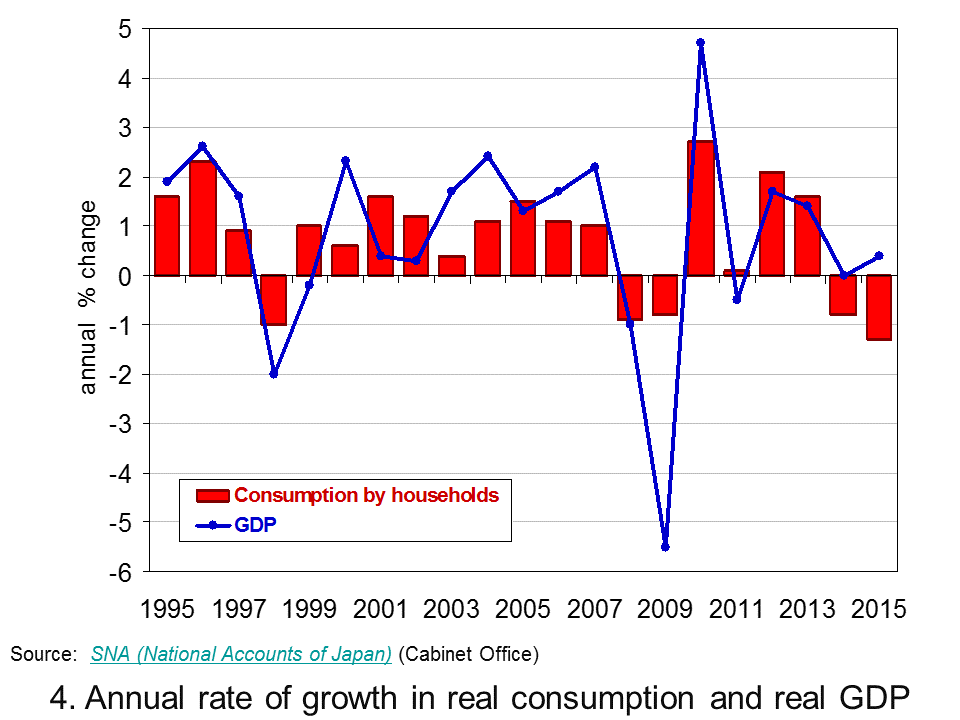 As Chart 4 helps to demonstrate, a significant factor behind the latest slowdown in Japan’s growth is household spending. (Click here to download a PowerPoint of the chart). In 2015 household spending accounted for about 57 per cent by value of GDP in Japan. In the last quarter of 2015 real household spending fell by 0.9 per cent while across 2015 as a whole real household spending fell by 1.3 per cent. This follows on from a 0.8 per cent decrease in spending by households in 2014.
The recent marked weakening of household spending is a significant concern for the short term growth prospects of the Japanese economy. The roller coaster ride continues, unfortunately it appears that the ride is again downwards.
Data
Quarterly Estimates of GDP Japanese Cabinet Office
Japan and the IMF IMF Country Reports
Economic Outlook Annex Tables OECD
Articles
Japan’s economy contracts in fourth quarter BBC News, (15/2/16)
Japanese economy shrinks again, raising expectations of more stimulus Telegraph, Szu Ping Chan (15/2/16)
Japan’s economy shrinks again as Abenomics is blown off course Guardian, Justin McCurry (15/2/16)
Japan’s economy contracts in latest setback for Abe policies New Zealand Herald, (15/2/16)
Japan’s ‘Abenomics’ on the ropes as yen soars, markets plunge Daily Mail, (15/2/16)
Japan economy shrinks more than expected, highlights lack of policy options CNBC, Leika Kihara and Tetsushi Kajimoto (15/2/16)
Questions
- Why is the distinction between nominal and real important in analysing economic growth?
- How do we define a recession?
- Of what importance is aggregate demand to the volatility of economies?
- Why are Japanese policymakers concerned about the prospects of deflation?
- What policy options are available to policymakers trying to combat deflation?
- Why is the strength of household consumption important in affecting the path of an economy?
- Why has Japan experienced an increase in real GDP but a fall in nominal GDP between 1995 and 2015?
 Some of the largest companies around the world operate in multiple locations. This allows them to take advantage of wider markets, cheaper transport and of course, lower taxes. In many cases, we see companies selling in one country, but locating their Headquarters in another, where tax rates are cheaper and hence their tax bills are lower. Much criticism has been levelled at such companies, who are accused of not paying their fair share in tax. There has been a crackdown on these companies and the UK is playing a leading role in this tightening of tax laws. Google is the latest company to face a large payment in backdated taxes.
This is a company with a complex structure, which has involved Bermuda as a key location, with its zero rate of corporation tax and a Irish European base. Though locating its business in different countries is legal, it has now agreed to pay HMRC £130 million in back taxes from 2005, following a 6 year investigation. Google will also change its accounting system such that it pays more tax in Britain for sales in this country.
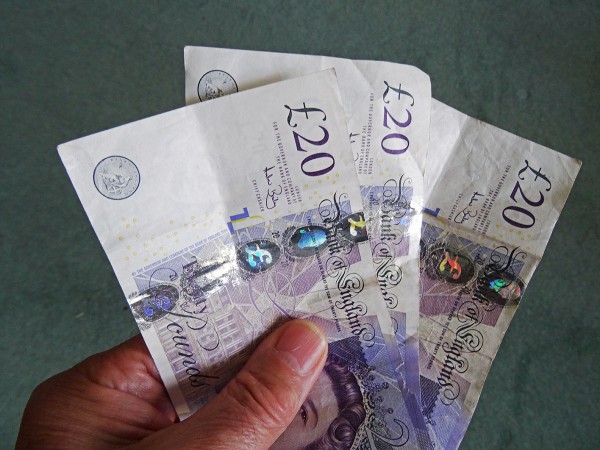 Google may be the first in a line of companies making such changes to its accounting practices following a global drive to tackle the low levels of taxes paid by these large companies. This change in tax rules may bring welcome relief to government coffers, though criticisms remain about the ‘real’ figure that Google owes. As an example of this: in 2013, Google’s UK revenues were $5.6bn. Yet it only paid £20.5m in tax on its UK profits. The Head of Google Europe, Matt Brittin said:
“The rules are changing internationally and the UK government is taking the lead in applying those rules so we’ll be changing what we are doing here. We want to ensure that we pay the right amount of tax.”
Mr Brittin was clear in saying that these back dated taxes are not evidence that they had been paying too little tax in previous years. He confirmed that they were abiding by tax laws at the time and that tax laws are now changing and hence so will the amount of tax they pay. He continued:
“I think there was concern that international companies were paying only in respect of profits that they make and those were the rules and the pressure was to see us pay in respect of the sales we make to UK customers – and the same for other companies…So, we are making a change because we want to continue to comply with the rules and the rules are changing.”
As the push to tighten tax laws changes, with firms paying more tax on sales as well as profits, we may observe more companies changing their accounting structures. The OECD has taken a big step in simplifying international tax laws and the coming years will tell us just how big an impact this will have and whether companies such as Google will face tax bills in other European countries as well. The following articles consider this taxing matter.
Google agrees £130m UK tax deal with HMRC BBC News, Kamal Ahmed (23/01/16)
Google strikes £130m back tax deal Financial Times, John Gapper (22/01/16)
Google strikes deal with UK tax authority Wall Street Journal, Sam Schechner and Stephen Fidler (23/01/16)
Google agrees to pay HMRC £130m in back taxes The Guardian, Kevin Rawlinson (23/01/16)
Google tax labelled ‘derisory’ by Labour’s John McDonnell BBC News (23/01/16)
Google to pay £130 million UK back taxes, critics want more Reuters, Tom Bergin (23/01/16)
Google to pay UK £130m in back taxes The Telegraph (22/01/16)
Google says it will pay £130m in back taxes Independent, Adam Barnett (23/01/16)
Google ‘agrees’ to pay £130m in extra UK tax after outrage when it coughed up just £20m on UK sales of nearly £4bn Mail Online, Imogen Calderwood (22/01/16)
Google agrees to pay $185 million in UK tax settlement Bloomberg, Brian Womack (23/01/16)
Questions
- What is the difference between a tax on sales and a tax on profits?
- How can companies legally avoid tax? Do you think they have a moral duty to pay tax?
- If firms face higher rates of taxation, how will this affect their costs and profits?
- Why are the larger multinationals, such as Google more able to engage in tax avoidance schemes?
- Do you think the problem of tax avoidance is one of the negative consequences of globalisation?
- Is the criticism about the ‘low’ amount of taxes paid to HMRC justified?
- The OECD has taken a leading role in tightening international tax policy. Do you think this will negatively impact the competitiveness of the global market place?
- What are the costs and benefits to a country of having a low rate of corporation tax?
 The latest data in the Quarterly National Accounts show that UK households in 2015 spent £1.152 trillion, the equivalent of 62 per cent of the country’s Gross Domestic Product (GDP). In real terms, household spending rose by 2.8 per cent in 2015 in excess of the 2.3 per cent growth observed in GDP. In the final quarter of 2015 real household spending rose by 0.6 per – the same rate of growth as that recorded for the UK economy. This was the tenth consecutive quarter of positive consumption growth and the twelfth of economic growth.