 Many of the arguments used by both sides in the referendum debate centre on whether there will be a net economic gain from either remaining in or leaving the EU. This involves forecasting.
Forecasting the economic impact of the decision, however, is difficult, especially in the case of a leave vote, which would involve substantial change and uncertainty.
First, the effects of either remaining or leaving may be very different in the long run from the short run, and long-run forecasts are highly unreliable, as the economy is likely to be affected by so many unpredictable events – few people, for example, predicted the financial crisis of 2007–8.
Second, the effects of leaving depend on the nature of any future trading relationships with the EU. Various possibilities have been suggested, including ‘the Norwegian model’, where Britain leaves the EU, but joins the European Economic Area, giving access to the single market, but removing regulation in some key areas, such as fisheries and home affairs.  Another possibility is ‘the Swiss model’, where the UK would negotiate trade deals on an individual basis. Another would be ‘the Turkish model’ where the UK forms a customs union with the EU. At the extreme, the UK could make a complete break from the EU and simply use its membership of the WTO to make trade agreements.
Nevertheless, despite the uncertainty, economists have ventured to predict the effects of remaining or leaving. These are not precise predictions for the reasons given above. Rather they are based on likely assumptions.
In a poll of 100 economists for the Financial Times, ‘almost three-quarters thought leaving the EU would damage the country’s medium-term outlook, nine times more than the 8 per cent who thought the country would benefit from leaving’. Most fear damage to financial markets in the UK and to inward foreign direct investment.
Despite the barrage of pessimistic forecasts by economists about a British exit, there is a group of eight economists in favour of Brexit. They claim that leaving the EU would lead to a stronger economy, with higher GDP, a faster growth in real wages, lower unemployment and a smaller gap between imports and exports. The main argument they use to support their claims is that the UK would be more able to pursue trade creation freed from various EU rules and regulations.
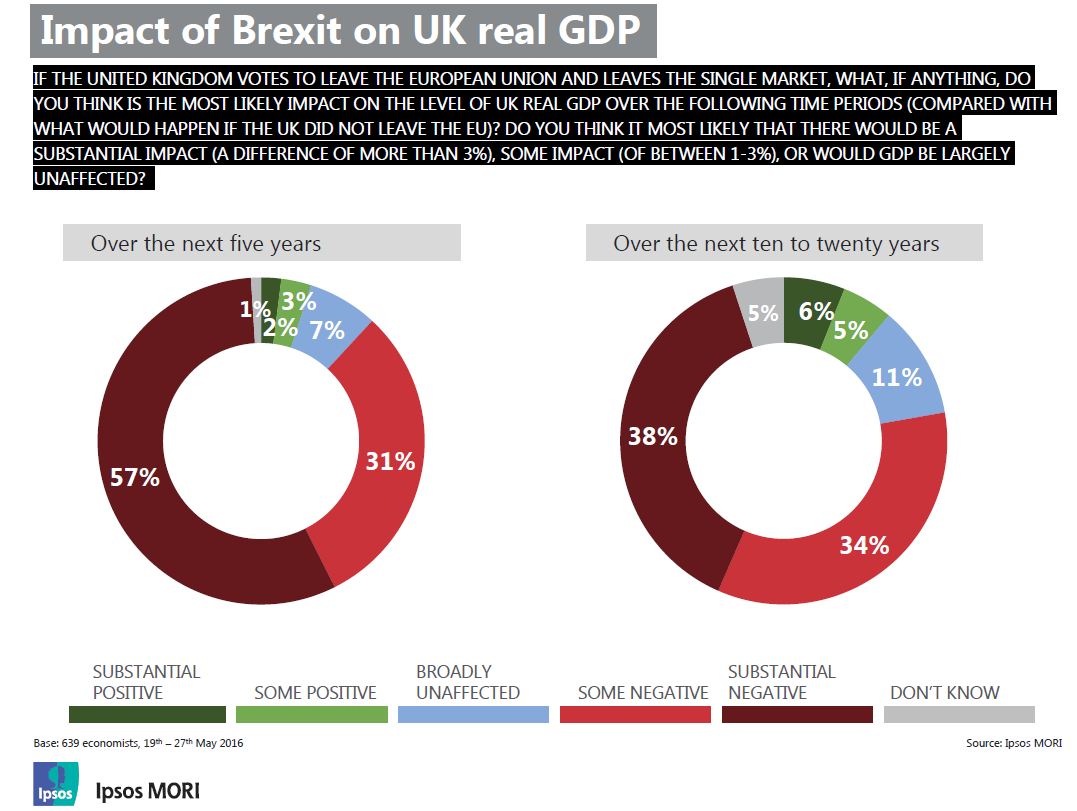 Then, less than four weeks before the vote, a poll of economists who are members of the Royal Economic Society and the Society of Business Economists came out strongly in favour of continued membership of the EU. Of the 639 respondents, 72 per cent thought that the most likely impact of Brexit on UK real GDP would be negative over the next 10 to 20 years; and 88 per cent thought the impact on GDP would be negative in the next five years (see chart: click to enlarge).
Of those stating that a negative impact on GDP in the next 5 years would be most likely, a majority cited loss of access to the single market (67%) and increased uncertainty leading to reduced investment (66%).
The views of the majority of economists accord with those of various organisations. Domestic ones, such as the Bank of England, the Treasury (see the blog Brexit costs), the Institute for Fiscal Studies and the National Institute for Economic and Social Research (NIESR) all warn that Brexit would be likely to result in lower growth – possibly a recession – increased unemployment, a fall in the exchange rate and higher prices and that greater economic uncertainty would damage investment.
International organisations, such as the OECD, the IMF and the WTO, also argue that leaving the EU would create great uncertainty over future trade relations and access to the Single Market and would reduce inward foreign direct investment and the flow of skills.
 But the forecasts of all these organisations depend on their assumptions about trade relations and that, in the event of the UK leaving the EU, would depend on the outcome of trade negotiations. The Leave campaign argues that other countries would want to trade with the UK and that therefore leaving would not damage trade. The Remain campaign argues that the EU would not wish to be generous to the UK for fear of encouraging other countries to leave the EU and that, anyway, the process of decoupling from the EU and negotiating new trade deals would take many years and, in the meantime, the uncertainty would be damaging to investment and growth.
The articles linked below looks at the economic arguments about Brexit and reflect the range of views of economists. Several are from ‘The Conversation’ as these are by academic economists. Although some economists are in favour of Brexit, the vast majority support the Remain side in the debate.
Articles
EU referendum: Pros and cons of Britain voting to leave Europe The Week (4/5/16)
The fatal contradictions in the Remain and Leave camps The Economist (3/6/16)
Four reasons a post-Brexit UK can’t copy Norway or Switzerland The Telegraph, Andrew Sentance (10/6/16)
What will Brexit do to UK trade? Independent, Ben Chu (2/6/16)
Leavers may not like economists but we are right about Brexit Institute for Fiscal Studies, Paul Johnson (9/6/15)
Why Brexit supporters should take an EU-turn – just like I did The Conversation, Wilfred Dolfsma (8/6/16)
The economic case for Brexit The Conversation, Philip B. Whyman (28/4/16)
Fact Check: do the Treasury’s Brexit numbers add up? The Conversation, Nauro Campos (20/4/16)
Which Brexit forecast should you trust the most? An economist explains The Conversation, Nauro Campos (25/4/16)
Why is the academic consensus on the cost of Brexit being ignored? The Conversation, Simon Wren-Lewis (17/5/16)
How Brexit would reduce foreign investment in the UK – and why that matters The Conversation, John Van Reenen (15/4/16)
The consensus on modelling Brexit NIESR, Jack Meaning, Oriol Carreras, Simon Kirby and Rebecca Piggott (23/5/16)
Reports, Press Conferences, etc.
Economists’ forecasts: Brexit would damage growth Financial Times, Chris Giles and Emily Cadman (3/1/16)
The Economy After Brexit, Economists for Brexit
Economists’ Views on Brexit Ipsos MORI (28/5/16)
Inflation Report Bank of England (May 2016)
EU referendum: HM Treasury analysis key facts HM Treasury (18/4/16)
Brexit and the UK’s public finances Institute for Fiscal Studies, Carl Emmerson , Paul Johnson , Ian Mitchell and David Phillips (25/5/16)
The Long and the Short of it: What price UK Exit from the EU? NIESR, Oriol Carreras, Monique Ebell, Simon Kirby, Jack Meaning, Rebecca Piggott and James Warren (12/5/16)
The Economic Consequences of Brexit: A Taxing Decision OECD (27/4/16)
Transcript of the Press Conference on the Release of the April 2016 World Economic Outlook IMF (12/4/16)
Macroeconomic implications of the United Kingdom leaving the Euroepan Union IMF Country Report 16/169 (1/6/16)
WTO warns on tortuous Brexit trade talks Financial Times, Shawn Donnan (25/5/16)
Questions
- Summarise the main economic arguments of the Remain side.
- What assumptions are made by the Remain side about Brexit?
- Summarise the main economic arguments of the Leave side.
- What assumptions are made by the Leave side about Brexit?
- Assess the realism of the assumptions of the two sides.
- If the UK exited the EU, would it be possible to continue gaining the benefits of the single market while restricting the free movement of labour?
- Would it be beneficial to go for a ‘free trade’ option of abolishing all import tariffs if the UK left the EU? Would it mean that UK exports would face no tariffs from other countries?
- If forecasting is unreliable, does this mean that nothing can be said about the costs and benefits of Brexit? Explain.
 In April we asked how sustainable is the UK’s appetite for credit? Data in the latest Bank of England’s Money and Credit publication suggest that such concerns are likely grow. It shows net lending (lending net of repayments) by monetary financial institutions (MFIs) to individuals in March 2016 was £9.3 billion, the highest monthly total since August 2007. This took net borrowing over the previous 12 months to £58.6 billion, the highest 12-month figure since September 2008.
The latest credit data raise fears about the impact on the financial well-being of individuals. The financial well-being of people, companies, banks and governments can have dramatic effects on economic activity. These were demonstrated vividly in the late 2000s when a downturn resulted from attempts by economic agents to improve their financial well-being. Retrenchment led to recession. Given the understandable concerns about financial distress we revisit our April blog.
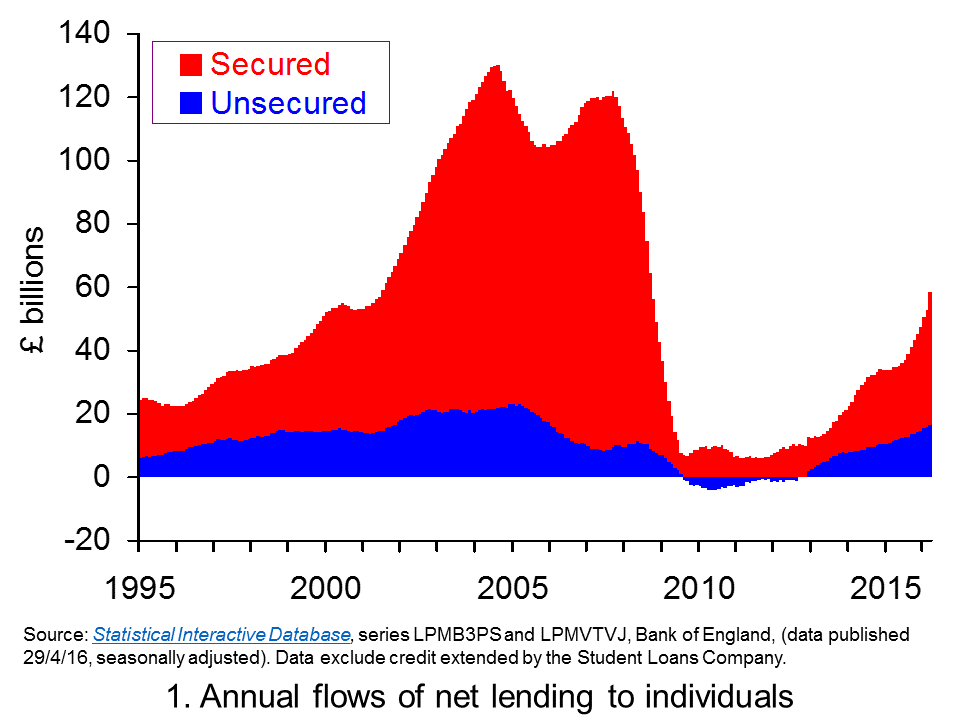 Chart 1 shows the annual flow of lending extended to individuals, net of repayments. (Click here to download a PowerPoint of Chart 1.) The chart provides evidence of cycles both in secured lending and in consumer credit (unsecured lending).
The growth in net lending during the 2000s was stark as was the subsequent squeeze on lending that followed. During 2004, for example, annual net flows of lending from MFIs to individuals exceeded £130 billion, the equivalent of close on 10.5 per cent of annual GDP. Secured lending was buoyed by strong house price growth with UK house price inflation rising above 14 per cent. Nonetheless, consumer credit was very strong too equivalent to 1.8 per cent of GDP.
Net lending collapsed following the financial crisis. In the 12 months to March 2011 the flow of net lending amounted to just £3.56 billion, a mere 0.2 per cent of annual GDP. Furthermore, net consumer credit was now negative. In other words, repayments were exceeding new sums being extended by MFIs.
Clearly, as Chart 1 shows, net lending to individuals is again on the rise. This partly reflects a rebound in sections of the UK housing market. Net secured lending in March was £7.435 billion, the highest monthly figure since November 2007. Over the past 12 months net secured lending has amounted to £42.1 billion, the highest 12-month figure since October 2008.
Yet the growth of unsecured credit has been even more spectacular. In March net consumer credit was £1.88 billion (excluding debt extended by the Student Loans Company). This is the highest month figure since March 2005. It has taken the amount of net consumer credit extended to individuals over the past 12 months to £16.435 billion, the highest figure since December 2005.
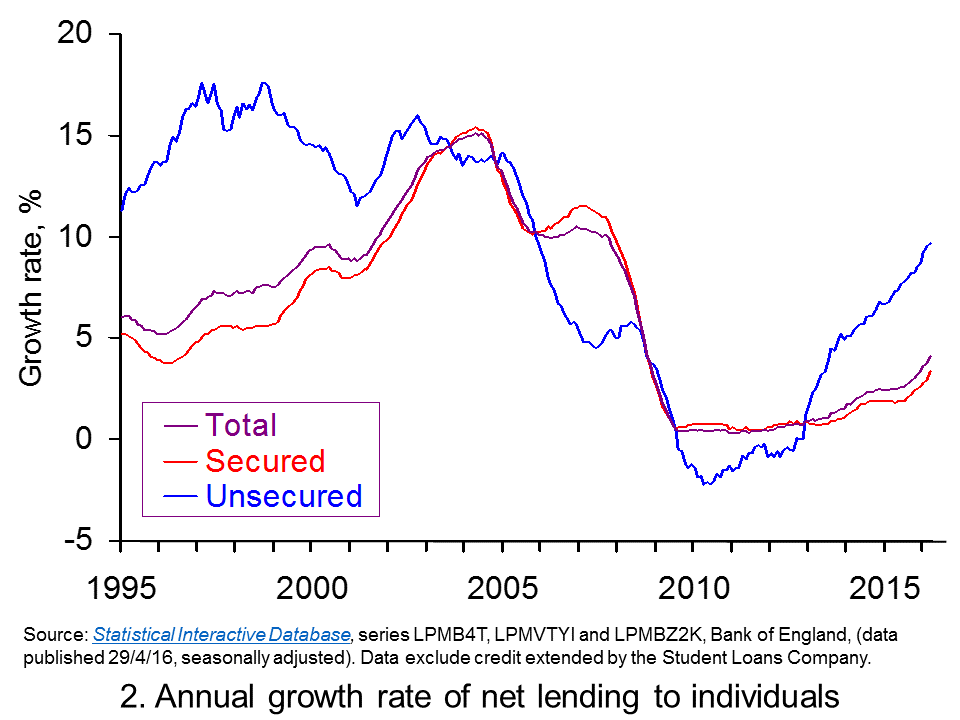 Chart 2 shows the annual growth rate of both forms of net lending by MFIs. In essence, this mirrors the growth rate in the stocks of debt – though changes in debt stocks can also be affected by the writing off of debts. The chart captures the very strong rates of growth in net unsecured lending from MFIs. We are now witnessing the strongest annual rate of growth in consumer credit since November 2005. (Click here to download a PowerPoint of the chart.)
The growth in household borrowing, especially that in consumer credit, evidences the need for individuals to be mindful of their financial well-being. Given that these patterns are now becoming well-established you can expect to see considerable comment in the months ahead about our appetite for credit. Can such an appetite for borrowing be sustained without triggering a further balance sheet recession as experienced at the end of the 2000s?
Articles
Consumer credit rises at fastest pace for 11 years The Guardian, Hilary Osborne (29/4/16)
Debt bubble fears increase as consumer credit soars to 11-year high The Telegraph, Szu Ping Chan (29/4/16)
Fears of households over-stretching on borrowing as consumer credit grows The Scotsman, (29/4/16)
History repeating? Fears of another financial crisis as borrowing reaches 11-year high Sunday Express, Lana Clements (29/4/16)
The chart that shows we put more on our credit cards in March than in any month in 11 years Independent, Ben Chu (1/4/16)
Britain’s free market economy isn’t working The Guardian (13/1/16)
Data
Money and Credit – March 2016 Bank of England
Bankstats (Monetary and Financial Statistics) – Latest Tables Bank of England
Statistical Interactive Database Bank of England
Questions
- What does it mean if individuals are financially distressed?
- How would we measure the financial well-being of individuals and households?
- What actions might individuals take it they are financially distressed? What might the economic consequences be?
- How might uncertainty affect spending and saving by households?
- What measures can policymakers take to reduce the likelihood that flows of credit become too excessive?
- What is meant by a balance sheet recession?
- Explain the difference between secured debt and unsecured debt.
- Should we be more concerned about the growth of consumer credit than secured debt?
 The Treasury has published a paper analysing the costs of Britain leaving the EU. Its central assumption is that the UK would negotiate a bilateral trade deal with the EU similar to that between Canada and the EU. Under this assumption the Treasury estimates that, by 2030, GDP would be 6.2% lower than if the UK had remained in the EU, meaning that the average household would be £4300 per year worse off than it would otherwise have been. The analysis also finds that there would be a total reduction in tax receipts of £36 billion per year – far greater than any savings from lower contributions to the EU budget.
Not surprisingly the ‘Vote Remain’ campaign for the UK to stay in the EU has welcomed the analysis, seeing it as strong evidence in support of their case. Also, not surprisingly, the Vote Leave campaign has questioned both the analysis and the assumptions on which it is based.
The Treasury analysis looks at three possible scenarios: (a) a Canada-style bilateral arrangement (the central estimate); (b) the UK becoming a member or the European Economic Area – the ‘Norwegian model’ (according to the Treasury, this would reduce GDP by 3.8%); (c) no specific deal with the EU, with the UK simply having the same access to the EU as any other country that is a mamber of the WTO (this would reduce GDP by 7.5%). Thus the Norwegian model would probably result in a smaller reduction in growth, but the UK would still continue to make contributions to the EU budget and have to allow free movement of labour. Only in option (c) would it have total control over migration. Each of the estimates has a margin of error, giving a range for the reduction in GDP across the three scenarios from 3.4% to 9.5%.
The Treasury used a three-stage process to arrive at its conclusions, as explained in the FT article below:
First, it uses gravity models to estimate the effect of different trade relationships on the quantity of trade and foreign direct investment. Gravity models take into account how close countries are to each other geographically, as well as their historical links, rather than assuming that trade flows to wherever the lowest tariffs are.
Second, it uses external academic results to estimate the consequences for productivity – the efficiency of the UK economy – from different levels of trade and foreign direct investment.
Third, it plugs the productivity numbers unto a global economic model run by the National Institute of Economic and Social Research to estimate the long-run differences in national income and prosperity.
Clearly there is large-scale uncertainty over any forecasts 14 years ahead, especially when the relationship with the EU and other countries post-EU exit can only be roughly estimated. The question is whether the assumptions are reasonable and whether there would be substantial costs from Brexit, but not necessarily of £4300 per household.
The following articles look at the analysis and its assumptions. Unlike many newspaper articles, which clearly have an agenda, these articles are relatively unbiased and try to assess the arguments. Of course, it would be difficult to be totally unbiased and it would be a good idea to try to spot any biases in each of the articles.
Articles
Treasury’s Brexit analysis: what it says — and what it doesn’t Financial Times, Chris Giles (18/4/16)
A Treasury analysis suggests the costs of Brexit would be high The Economist (18/4/16)
George Osborne says UK would lose £36bn in tax receipts if it left EU The Guardian, Anushka Asthana and Tom Clark (18/4/16)
Will each UK household be £4,300 worse off if the UK leaves the EU? The Guardian, Larry Elliott (18/4/16)
FactCheck Q&A: can we trust the Treasury on Brexit? Channel 4 News, Patrick Worrall (18/4/16)
Reality Check: Would Brexit cost your family £4,300? BBC News, Anthony Reuben (18/4/16)
Brexit sparks outbreak of agreement among economists Financial Times, Chris Giles (27/4/16)
Treasury analysis
EU referendum: HM Treasury analysis key facts HM Treasury (18/4/16)
HM Treasury analysis: the long-term economic impact of EU membership and the alternatives HM Treasury (18/4/16)
Questions
- Would households actually be poorer if the Treasury’s forecasts are correct?
- What alternative trade arrangements with the EU would be possible if the UK left the EU?
- What are the Treasury model’s main weaknesses?
- What considerations are UK voters likely to take into account in the referendum which are not included in the Treasury analysis?
- Make out the case for supporting the analysis of the Treasury.
- Make out the case for rejecting the analysis of the Treasury.
The latest Bank of England’s Money and Credit release shows net lending (lending net of repayments) by Monetary Financial Institutions (MFIs) to individuals in February was £4.9 billion. Although down on the £5.4 billion in January, it nonetheless means that over the last 12 months the flow of net lending amounted to £52.8 billion. This is the highest 12-month figure since October 2008.
The latest credit data raise concerns about levels of lending and their potential to again impact on the financial well-being of individuals, particularly in light of the falling proportion of income that households are saving. As we saw in UK growth fuelled by consumption as households again lose affection for their piggy banks the saving ratio fell to an historic low of 4.2 per cent for 2015.
An important factor affecting the financial well-being of individuals and households is the extent of their indebtedness. Flows of credit accumulate to become stocks of debt. Stocks of debt affect the extent to which household incomes becomes prey to debt servicing costs. Put simply, more and more income, all other things being equal, is needed for interest payments and capital repayments as debt stocks rise. Rising stocks of debt can also affect the ability of people to further fund borrowing, particularly if debt levels grow more quickly than asset values, such as the value of financial assets accumulated through saving. Consequently, the growth of debt can result in households incurring what is called balance sheet congestion with deteriorating financial well-being or increased financial stretch.
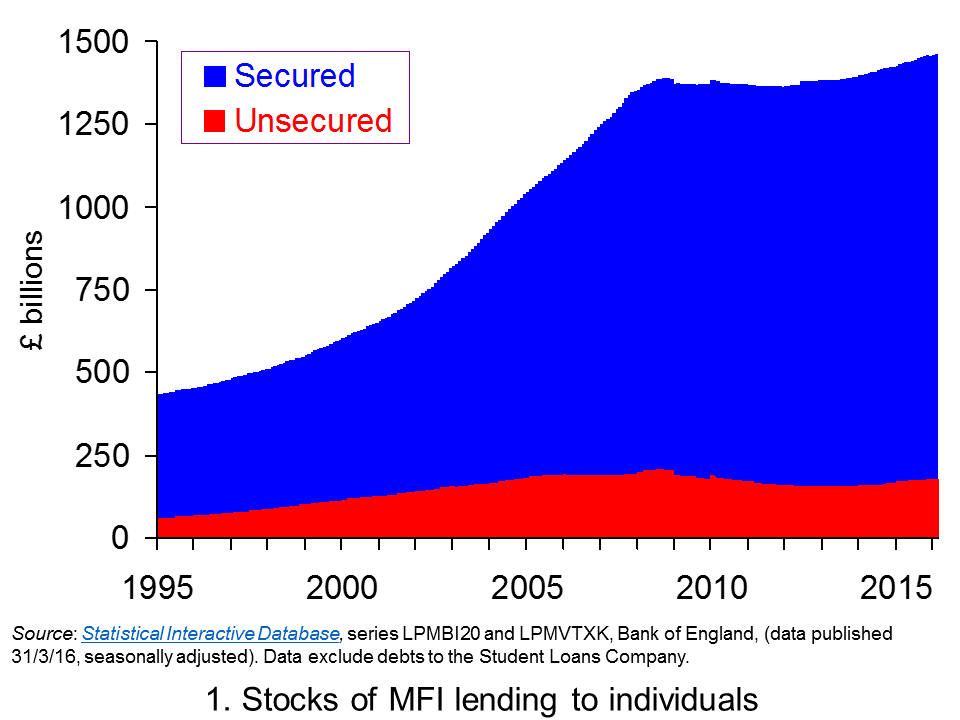 Chart 1 shows the stocks of debt acquired by individuals from MFIs, i.e. deposit-taking financial institutions. It shows both secured debt stocks (mortgage debt) and unsecured debt stocks (consumer credit). The scale of debt accumulation, particularly from the mid 1990s up to the financial crisis of the late 2000s is stark.
At the start of 1995 UK individuals had debts to MFIs of a little over £430 billion, the equivalent of roughly 55 per cent of annual GDP (Gross Domestic Product). By the autumn of 2008 this had hit £1.39 trillion, the equivalent of roughly 90 per cent of annual GDP. At both points around 85 per cent of the debt was secured debt, though around the start of the decade it had fallen back a little to around 80 per cent. (Click here to download a PowerPoint of Chart 1.)
The path of debt at the start of the 2010s is consistent with a story of consolidation. Both financially-distressed individuals and MFIs took steps to repair their balance sheets following the financial crisis. These steps, it is argued, are what resulted in a balance sheet recession. This saw the demand for and supply of additional credit wane. Consequently, as Chart 1 shows debt accumulation largely ceased.
More recently the indebtedness to MFIs of individuals has started to rise again. At the end of February 2014 the stock of debt was just shy of £1.4 trillion. By the end of February 2016 it had risen to £1.47 trillion (a little under 80 per cent of annual GDP). This is an increase of 4.7 per cent. Interestingly, the rise was largely driven by unsecured debt. It rose by 13.4 per cent from £159.4 billion to £180.7 billion. Despite the renewed buoyancy of the housing market, particularly in South East England, the stock of secured debt has risen by just 3.6 per cent from £1.24 trillion to £1.28 trillion.
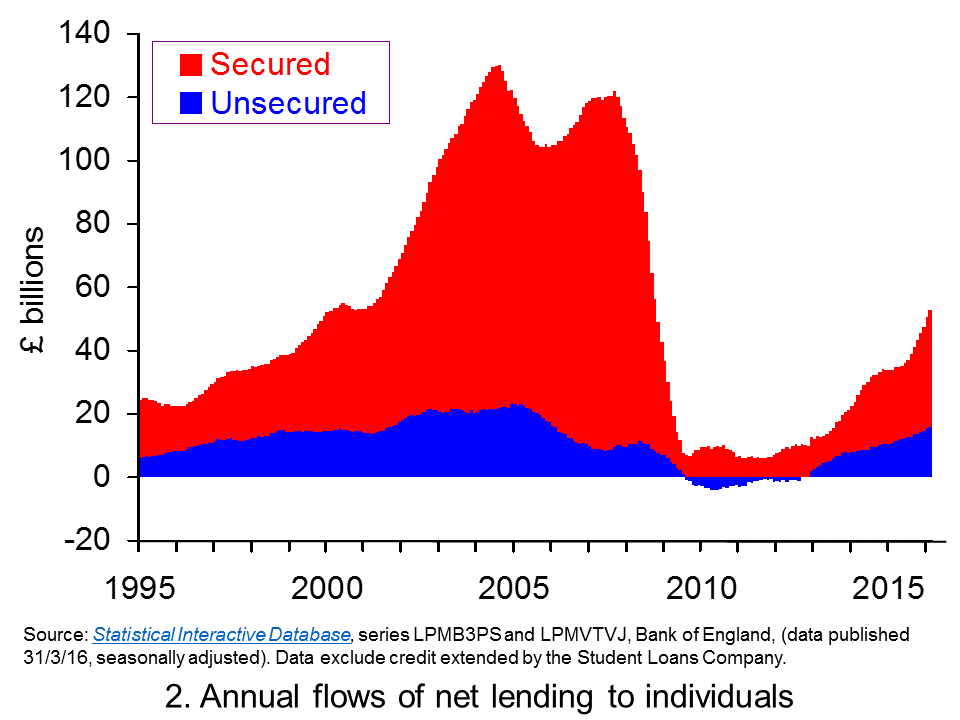 Chart 2 shows the annual flow of lending extended to individuals, net of repayments. (Click here to download a PowerPoint of Chart 2.) The chart provides evidence of cycles both in secured lending and in consumer credit (unsecured lending).
The growth in net lending during the 2000s was stark as was the subsequent squeeze on lending that followed. During 2004, for example, annual net flows of lending from MFIs to individuals exceeded £130 billion, the equivalent of close on 10.5 per cent of annual GDP. Secured lending was buoyed by strong house price growth with UK house price inflation rising above 14 per cent. Nonetheless, consumer credit was very strong too equivalent to 1.8 per cent of GDP.
Net lending collapsed following the financial crisis. In the 12 months to March 2011 the flow of net lending amounted to just £3.56 billion, a mere 0.2 per cent of annual GDP. Furthermore, net consumer credit was now negative. In other words, repayments were exceeding new sums being extended by MFIs.
Clearly, as Chart 2 shows, we can see that net lending to individuals is again on the rise. As we noted earlier, part of this this reflects a rebound in parts of the UK housing market. It is perhaps worth noting that secured lending helps individuals to purchase housing and thereby acquire physical wealth. While secured lending can find its way to fuelling spending, for example, through the purchase of goods and services when people move into a new home, consumer credit more directly fuels spending and so aggregate demand. Furthermore, consumer credit is not matched on the balance sheets by an asset in the same way that secured credit is.
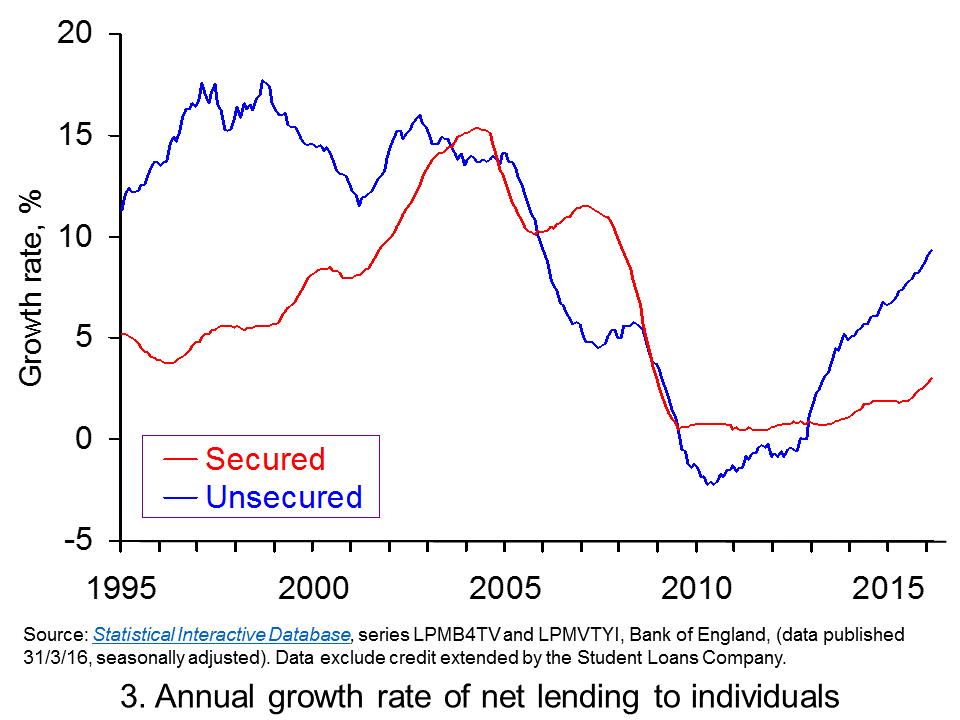 Chart 3 shows the annual growth rate of both forms of net lending by MFIs. In essence, this mirrors the growth rate in the stocks of debt though changes in the stocks of debt can also be affected by the writing off of debts. What the chart nicely shows is the strong rates of growth in net unsecured lending from MFIs. In fact, it is the strongest annual rate of growth since January 2006 (Click here to download a PowerPoint of the chart.)
The growth in consumer credit, the fall in the saving ratio and the growth in consumer spending point to a need for individuals to be mindful of their financial well-being. What is for sure, is that you can expect to see considerable comment in the months ahead about consumption, credit and income data. Fundamental to these discussions will be the sustainability of current lending patterns.
Articles
Consumer Lending Growth Highest Since 2005 Sky News, (31/3/16)
Britons raid savings to fund spending as economists warn recovery ‘built on sand’ Telegraph, Szu Ping Chan (31/3/16)
Household debt binge has no end in sight, says OBR Telegraph, Szu Ping Chan (17/3/16)
Surge in borrowing… as savings dwindle: Household savings are at an all-time low as families turn to cheap loans and credit cards Daily Mail, James Burton (1/4/16)
George Osborne banks on household debt time bomb to meet his Budget targets Mirror, Ben Glaze (29/3/16)
Britain’s free market economy isn’t working Guardian (13/1/16)
Data
Bankstats (Monetary and Financial Statistics) – Latest Tables Bank of England
Statistical Interactive Database Bank of England
Questions
- What does it mean if individuals are financially distressed?
- How would we measure the financial well-being of individuals and households?
- What actions might individuals take it they are financially distressed? What might the economic consequences be?
- How might uncertainty affect spending and saving by households?
- What measures can policymakers take to reduce the likelihood that flows of credit become too excessive?
- What is meant by a balance sheet recession?
- Explain the difference between secured debt and unsecured debt.
- Should we be more concerned about the growth of consumer credit than secured debt?
 According to the law of comparative advantage, trade can benefit all countries if they export goods which they can produce at lower opportunity costs than their trading partners. Trade enables all countries to consume beyond their production possibility frontier. What is more, trade can increase competition, which encourages firms to be more efficient.
That trade is beneficial has been generally accepted by governments around the world since the Second World War, with the General Agreement on Tariffs and Trade (GATT) and then the World Trade Organization (WTO) advocating the dismantling of trade barriers. Countries have participated in a series of trade ’rounds’, such as the Uruguay Round (1986–94) and most recently the Doha Round (2001–15). But since the financial crisis of 2008, there has been waning enthusiasm for freer trade and growing calls to protect strategic and/or vulnerable industries. To some extent this mirrors the growth in protection after the Great Depression of the early 1930s as countries sought to boost their own industries.
After some progress in the Doha round talks in Nairobi in December 2015, the talks effectively marked the end of a fourteen-year road for the round (see also). There was a failure to agree on a number of items and chances of resurrecting the talks seem slim.
 The classic response to calls for protection is that it can lead to a trade war, with a net loss in global output as less efficient domestic industries are shielded from competition from lower-cost imports. Consumers lose from no longer having access to cheaper imported goods. Trade wars, it is argued, are a negative sum game. Any gains to one country are more than offset by losses elsewhere. In fact, it is likely that all countries will lose.
One argument for protection recognises the efficiency gains from free trade, but argues that current trade is distorted. For example, countries may subsidise the export of products in which they have a comparative disadvantage and dump them on the rest of the world. The WTO recognises this as a legitimate argument for tariffs, if they are used to offset the effect of the subsidies and make import prices more reflective of the cost of production.
But increasingly arguments go beyond this. Industries that are regarded as strategic to a country’s future, such as the steel industry or agriculture, are seen as warranting protection. With protection, investment may flow to such industries, making them more efficient and even gaining a comparative advantage at some point in the future.
Then there is the question of income distribution. Trade with poor countries may help to close the gap somewhat between rich and poor countries. The reason is that poor countries, with an abundance of labour, are likely to have a comparative advantage in labour-intensive products. The demand for exports of such products will help to drive up wages in such countries. However, income distribution within the rich countries may become less equal. Cheap imports from developing countries may depress the wages of unskilled or low-skilled workers in the rich countries.
Another argument concerns the devastation caused to communities by the closure of plants which are major employers. Workers made redundant may find it hard to find alternative employment, especially if their skills are specific to the plant that has closed. At least in the short term, it is argued that such industries warrant protection to allow time for alternative employers to be attracted into the area.
Arguments such as these are being used today in many countries as they struggle with slowing growth in China, a glut of global resources and overcapacity in certain industries.
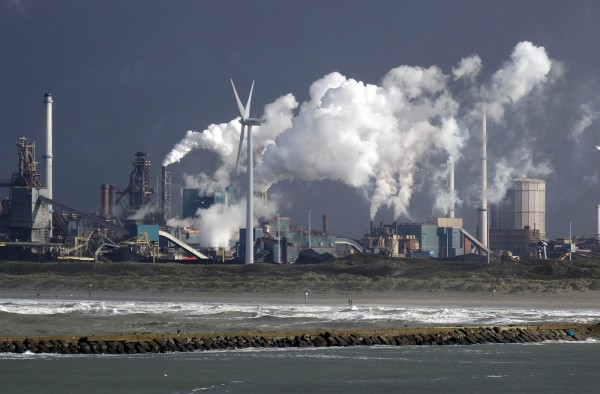 The steel industry is a case in point. The announcement by Tata Steel that it intends to close the Port Talbot steel works has been met with consternation and calls for protection against subsidised Chinese steel imports. The USA already imposes tariffs of 256% on corrosion-resistant Chinese steel. The EU has proposed raising tariffs on Chinese steel to the full amount of the subsidy, but the UK has blocked this, not wishing to trigger a trade war with China. In the meantime, China has announced the imposition of a tariff of 46% on a particular type of hi-tech steel imported from the EU.
On the other side of the Atlantic, there have been growing protectionist calls from presidential front runners. Donald Trump and Ted Cruz on the Republican side, and Bernie Sanders and now Hilary Clinton on the Democratic side, are opposed to the trade agreement that President Obama has been seeking with the EU – the Transatlantic Trade and Investment Partnership (TTIP). Donald Trump has proposed imposing tariffs of 45% on all Chinese imports.

The following articles look at the growing calls for protection, especially against China, and at the arguments about what should be done to protect the UK and EU steel industry.
Articles
Defiant China slaps steel tariffs on Britain as trade war looms The Telegraph, Ambrose Evans-Pritchard (1/4/16)
China’s soaring steel exports may presage a trade war, The Economist (9/12/15)
Trade, at what price? The Economist (30/3/16)
Free trade in America: Open argument The Economist (2/4/16)
Can the British steel industry be saved? Financial Times (2/4/16)
Steel crisis: UK government plays down China tariff fears BBC News (2/4/16)
The dogmas destroying UK steel also inhibit future economic growth The Observer, WIll Hutton (3/4/16)
UK accused of leading efforts to block limits to Chinese steel dumping The Guardian, Frances Perraudin (1/4/16)
There’s always an excuse to justify suspending free trade – Tata is the latest The Telegraph, Allister Heath (1/4/16)
Can one of the world’s top economies live without making steel? Bloomberg, Thomas Biesheuvel (1/4/16)
Trade policy is no longer just for political nerds: it matters in the UK and US The Guardian, Larry Elliott (27/3/16)
Steel shrivels while Britain’s balance of payments crisis grows The Observer, WIlliam Keegan (3/4/16)
Trump’s tariff plan could boomerang, spark trade wars with China, Mexico Reuters, David Lawder and Roberta Rampton (24/3/16)
Analysis: A Trump trade war could cost the U.S. millions of jobs Daily Herald (Chicago), Jim Tankersley (3/4/16)
Questions
- What is meant by the ‘law of comparative advantage’? Does the law imply that countries will always gain from totally free trade?
- Demonstrate the gains for each of two countries which choose to trade with each other (see, for example, pages 711–3 in Economics, 9th edition).
- What is meant by ‘strategic trade theory’? How would such theory relate to the case of steel production in south Wales?
- What are the arguments for and against the EU imposing tariffs on Chinese steel imports equal to the subsidy given by the Chinese government?
- Is protectionism always a negative sum game? Explain.
- Assess the validity of various arguments for protection.
- Why did it prove impossible to complete the Doha round?
- What is meant by the ‘Transatlantic Trade and Investment Partnership (TTIP)’? Why is there so much opposition to it?
- Are bilateral trade deals, such as the TTIP, the best way of moving forward in reaping the gains from freer trade?
 But the forecasts of all these organisations depend on their assumptions about trade relations and that, in the event of the UK leaving the EU, would depend on the outcome of trade negotiations. The Leave campaign argues that other countries would want to trade with the UK and that therefore leaving would not damage trade. The Remain campaign argues that the EU would not wish to be generous to the UK for fear of encouraging other countries to leave the EU and that, anyway, the process of decoupling from the EU and negotiating new trade deals would take many years and, in the meantime, the uncertainty would be damaging to investment and growth.