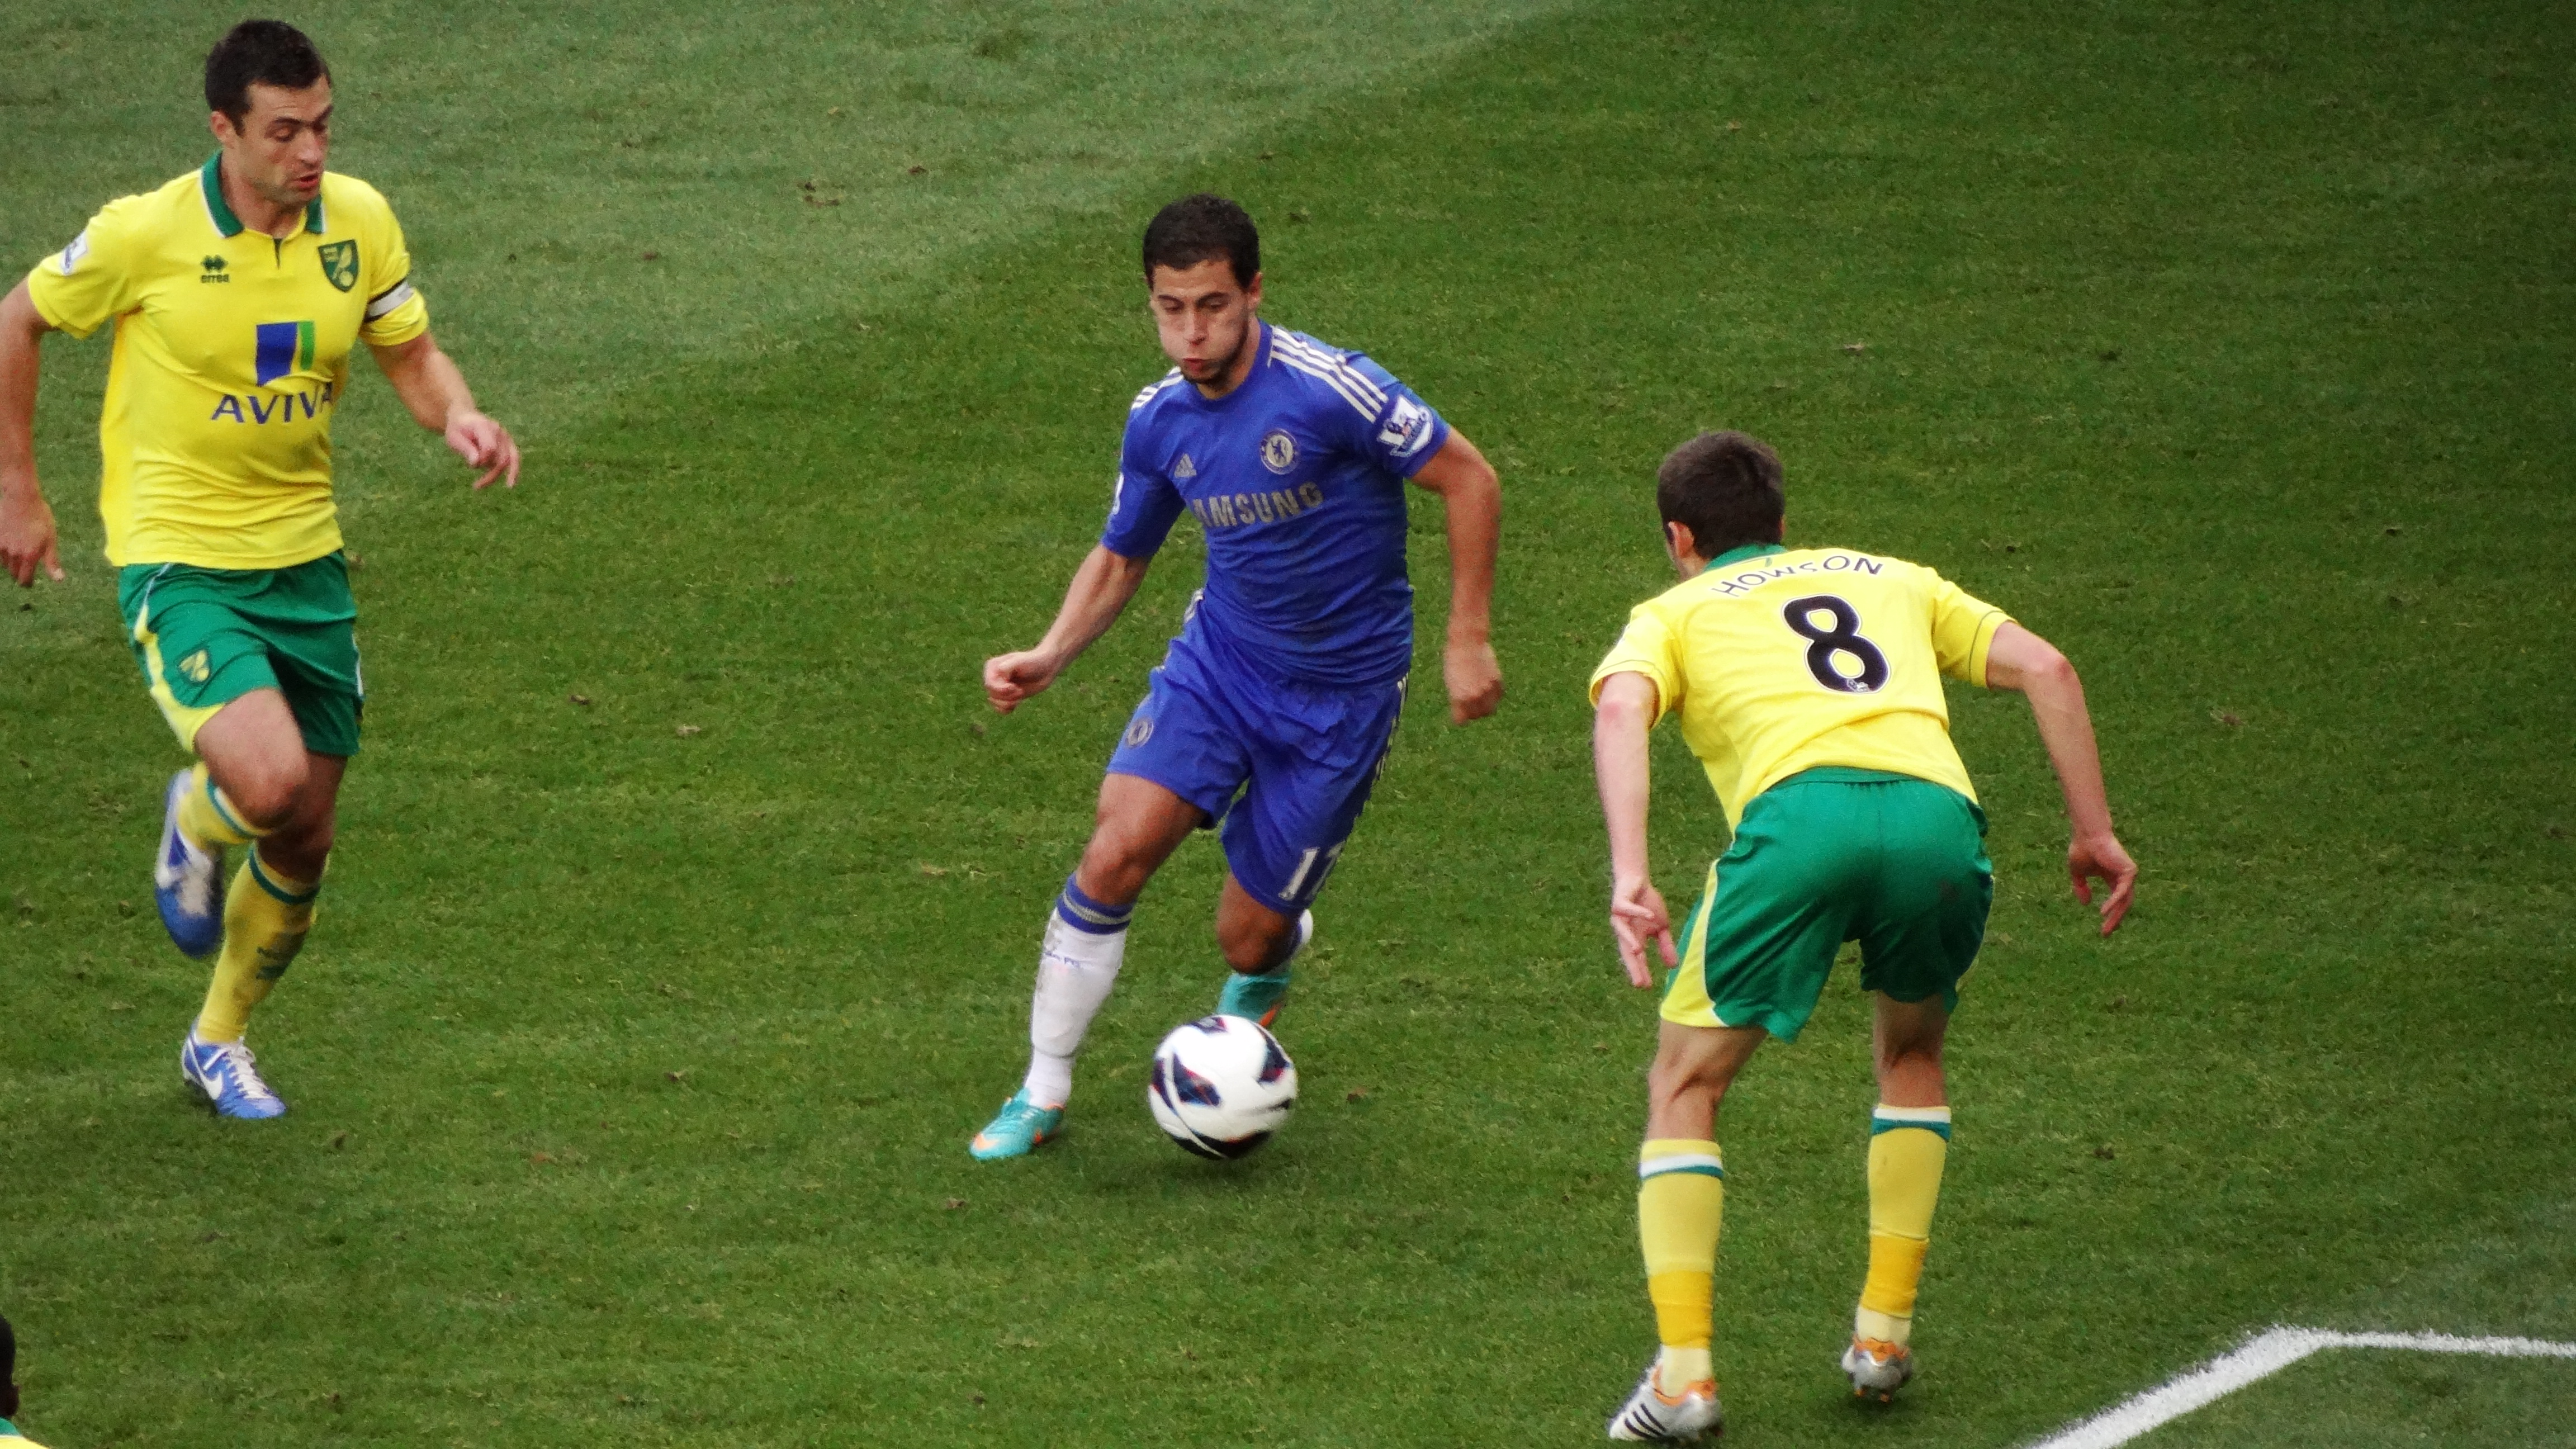
 Most observers were once again left stunned by how much media companies are willing to pay to secure the rights to broadcast live games in the English Premier League (EPL). At the same time the method used to sell those rights is being investigated by Ofcom following complaints made by Virgin Media. Virgin Media actually requested that the auction was halted until the investigation was completed.
Between them, BSkyB and BT Sport have paid £5.136bn to purchase the rights to broadcast live matches in the EPL over a three-year period beginning in the 2016–17 season. This is a 71% increase in the price paid for the previous three-year deal which runs from 2013 to 2016 and cost £3.018bn. However, the headline figure hides some big differences between the amounts paid by the two companies.
How exactly are the rights sold? The broadcast rights for the 168 live matches are split up into seven different packages labelled A through to G and are placed in seven different auctions. The type of auction used by the EPL is a sealed bid auction. Interested companies are invited to make an offer for any of the packages. However, when they make a bid they do not know (a) if other firms have also made a bid and (b) the size of any other bids. Another constraint is that one firm is not allowed to win more than five of the auctions. When the auction finishes the EPL only releases information about the winning offers. It never provides information about any of the failed bids.
Some of the packages are worth more than others to the broadcasters. The first five packages (A–E) each contain the rights for 28 games per season, while the other two packages (F and G) contain the rights for 14 matches. In some of the packages all of the games kick off at the same time and on the same day. For example all 28 games in package ‘A’ kick off at 12.30pm on a Saturday. Others contain more of a mixture. Some of the games in Package E take place on a Monday evening. while others take place on a Friday evening. Given the potential advertising revenue and number of viewers, the most valuable package is D, which has 28 games that kick off at 4.00pm on a Sunday.
Another factor that influences the value of a package is the number of ‘first picks’. In any given week, more than one broadcaster might want to screen the same match. To overcome this problem, each package is allocated a number of first, second, third, fourth and fifth ‘picks’. For example, package D comes with 18 first and 10 fourth round picks. This means that whichever company wins this package will get first choice on the games they want to broadcast on 18 occasions a year. Package C contains no ‘first picks’ but offers 15 second, 4 fourth and 7 fifth round picks. There is also a maximum and a minimum limit on the number of times games including a specific team can be broadcast.
BSkyB won the auctions for packages A, C, D, E and G for a price of £4.17bn. This means that it will be paying £1.396bn to broadcast 126 live games per season. This is an average payment of £11,031,700 per game. In the previous deal it paid £760million for the rights to broadcast 116 live games per season. This is an average payment of £6,551,724 per game. The new deal represents a cost increase of 68% per game. However, the number of first picks BskyB has secured in the new deal increases from 20 to 26.
BTSport won the auctions for packages B and F for a price of £960m. This means that it will be paying £320m for the rights to broadcast 42 live games per season. This is an average payment of £7,619,048 per game. In the previous deal it paid £246 million per year for the rights to broadcast 38 live games per season. This is an average payment of £6,473,684 per game. The new deal represents an increase in costs of 17.7% per game for BT Sport – a much lower figure than for BSkyB.
BSkyB has stated that it will cover the increase in the price it has paid for the rights with efficiency savings. However, many observers believe that it will ultimately result in significant increases in the subscription rates for SkySports. The impact of the deal on BskyB’s profit may well depend on the willingness of its customers to pay higher prices. What is the price elasticity of demand for SkySports at the current subscription rates they are charging?
There is still some uncertainty about the deal following Ofcom’s decision to investigate the legitimacy of the method used by the EPL to auction the rights. Virgin Media made a formal complaint in September 2014 about the collective selling of the live broadcast rights and argued that it was in breach of competition law. The investigation by Ofcom will make a judgment about whether the joint selling of the rights by the EPL is a contravention of Chapter I of the Competition Act 1998 and/or Article 101(1) of the Treaty on the Functioning of the European Union. An initial announcement will be made in March.
Premier League set to announce record £4.4bn TV rights deal BBC Sport (10/2/15)
Premier League TV rights: What does deal mean for fans & clubs BBC Sport, Ben Smith (11/2/15)
How Sky paid £4m more per Premier League match than BT The Telegraph, Ben Rumsby (11/2/15)
Premier League TV deal: Windfall must benefit grass roots and England The Telegraph, Henry Winter (10/2/15)
Sky and BT retain Premier League TV rights for record £5.14bn The Guardian, Owen Gibson (10/2/15)
Premier League TV rights: Sky Sports and BT Sport win UK broadcasting rights as price tops £5billion Independent, Tom Peck (10/2/15)
Questions
- Draw a demand curve for package A and package D of the live broadcast rights. Which one do you think will be furthest to the right? Explain your answer.
- What are the potential benefits to the EPL of not revealing the details of any of the losing bids?
- Explain how the price elasticity of demand is a useful concept for assessing the impact of the new deal on the profits of BSkyB and BTSport.
- Given the impact of the new deal of the size of Parachute payments, what impact might it have on the level of competitive balance in the Championship?
- Find out the key provisions of Chapter I of the Competition Act 1998 and Article 101(1) of the Treaty on the Functioning of the European Union.
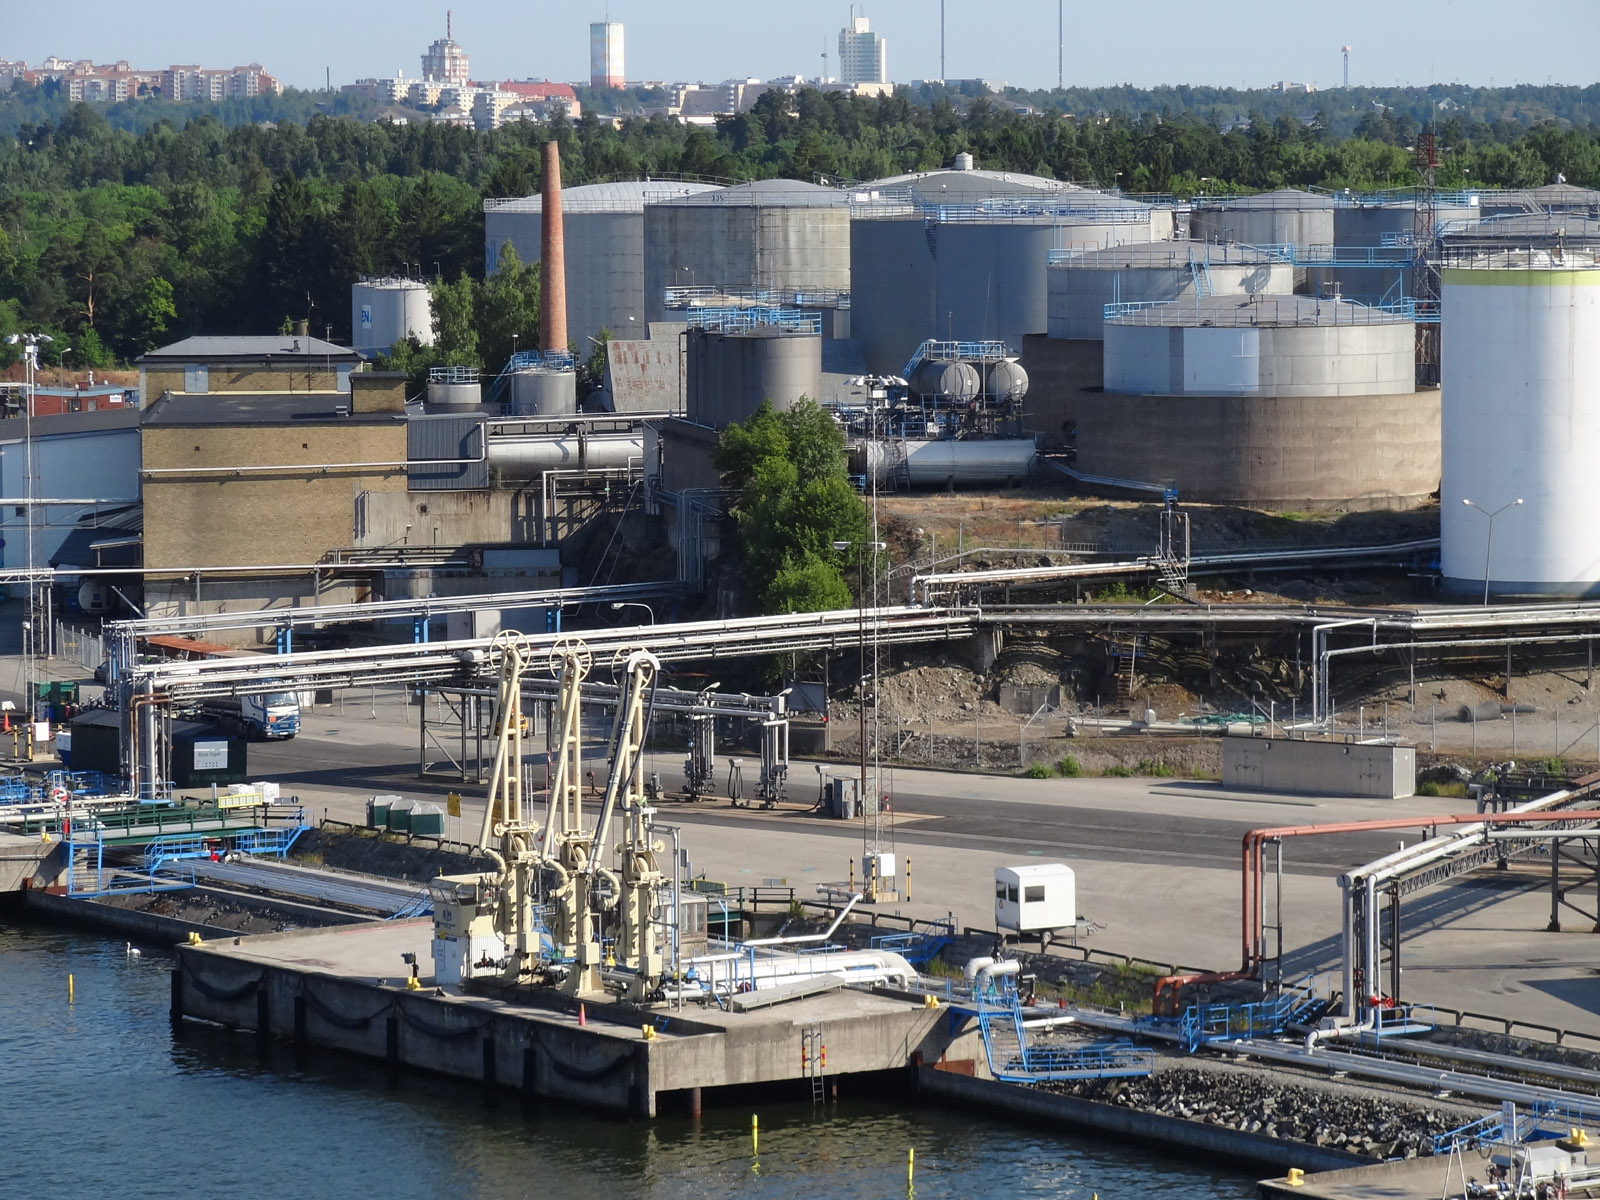
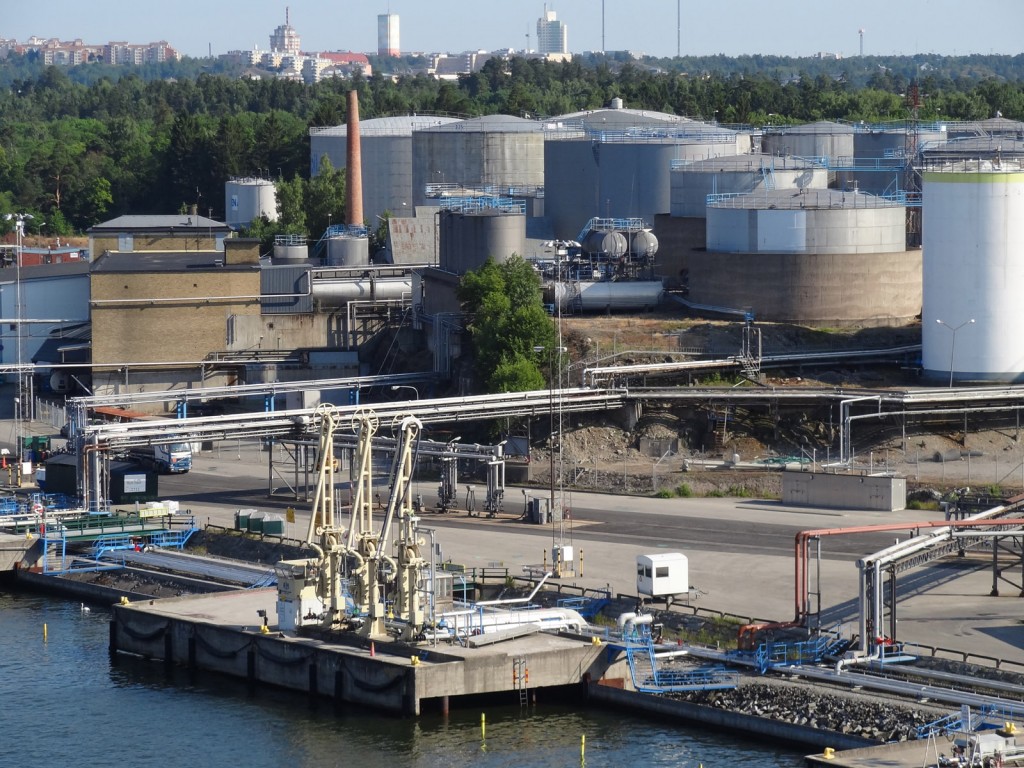 Over the past three months oil prices have been falling. From the beginning of September to the end of November Brent Crude has fallen by 30.8%: from $101.2 to a four-year low of $70.0 per barrel (see chart below: click here for a PowerPoint). The fall in price has been the result of changes in demand and supply.
As the eurozone, Japan, South America and other parts of the world have struggled to recover, so the demand for oil has been depressed. But supply has continued to expand as the USA and Canada have increased shale oil production through fracking. 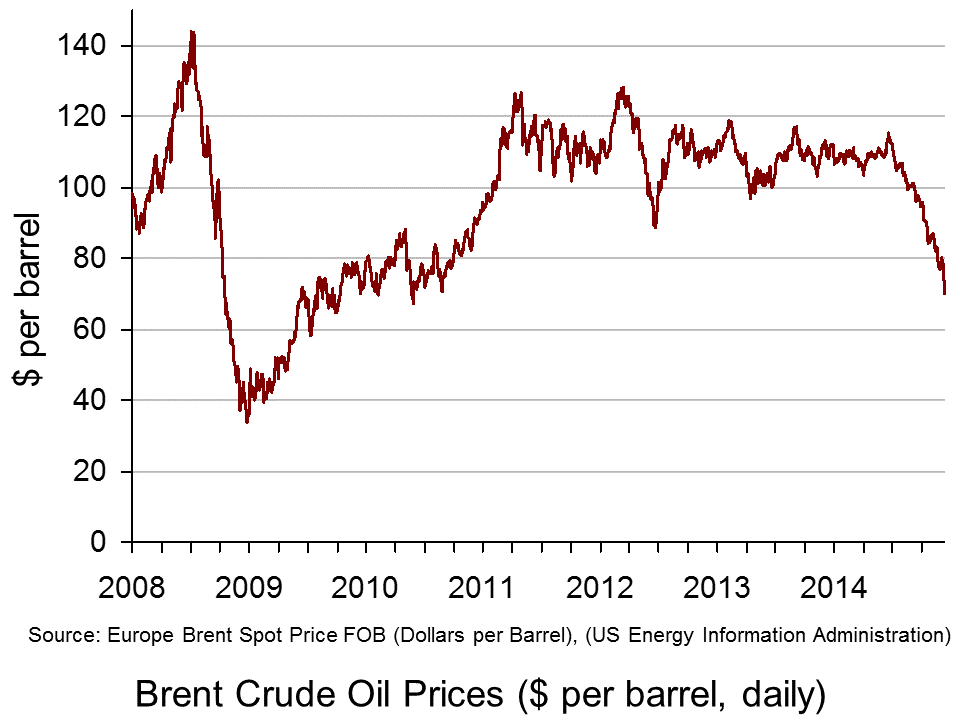 As far as OPEC is concerned, rather than cutting production, it decided at a meeting on 27 November to maintain the current target of 30 million barrels a day.
The videos and articles linked below look at these demand and supply factors and what is likely to happen to oil prices over the coming months.
They also look at the winners and losers. Although falling prices are likely in general to benefit oil importing countries and harm oil exporting ones, it is not as simple as that. The lower prices could help boost recovery and that could help to halt the oil price fall and be of benefit to the oil exporting countries. But if prices stay low for long enough, this could lower inflation and even cause deflation (in the sense of falling prices) in many countries. This, in turn, could dampen demand (see the blog post, Deflation danger). This is a particular problem in Japan and the eurozone. Major oil importing developing countries, such as China and India, however, should see a boost to growth from the lower oil prices.
Some oil exporting countries will be harder hit than others. Russia, in particular, has been badly affected, especially as it is also suffering from the economic sanctions imposed by Western governments in response to the situation in Ukraine. The rouble has fallen by some 32% this year against the US dollar and nearly 23% in the past three months alone.
Then there are the environmental effects. Cheaper oil puts less pressure on companies and governments to invest in renewable sources of energy. And then there are the direct effects on the environment of fracking itself – something increasingly being debated in the UK as well as in the USA and Canada.
Videos
 Oil price at four-year low as Opec meets BBC News, Mark Lobel (27/11/14)
Opec losing control of oil prices due to US fracking BBC News, Nigel Cassidy (4/12/13)
How the price of oil is set – video explainer The Telegraph, Oliver Duggan (28/11/14)
How Oil’s Price Plunge Impacts Wall Street Bloomberg TV, Richard Mallinson (28/11/14)
Oil Prices Plummet: The Impact on Russia’s Economy Bloomberg TV, Martin Lindstrom (28/11/14)
Articles
Oil prices plunge after Opec meeting BBC News (28/11/14)
Crude oil prices extend losses Financial Times, Dave Shellock (28/11/14)
Oil price plunges after Opec split keeps output steady The Guardian, Terry Macalister and Graeme Wearden (27/11/14)
Falling oil prices: Who are the winners and losers? BBC News, Tim Bowler (17/10/14)Hooray for cheap oil BBC News, Robert Peston (1/12/14)
Russian Recession Risk at Record as Oil Price Saps Economy Bloomberg, Andre Tartar and Anna Andrianova (28/11/14)
Rouble falls as oil price hits five-year low BBC News (1/12/14)
Data
Brent Spot Price US Energy Information Administration (select daily, weekly, monthly or annual: can be downloaded to Excel)
Spot exchange rate of Russian rouble against the dollar Bank of England
Questions
- Use a diagram to illustrate the effects of changes in the demand and supply of oil on oil prices.
- How does the price elasticity of demand and supply of oil affect the magnitude of these price changes?
- Explain whether (a) the demand for and (b) the supply of oil are likely to be relatively elastic or relatively inelastic? How are these elasticities likely to change over time?
- Distinguish between the spot price and forward prices of oil? If the three-month forward price is below the spot price, what are the implications of this?
- Analyse who gains and who loses from the recent price falls.
- What are the effects of a falling rouble on the Russian economy?
- What are likely to be the effects of further falls in oil prices on the eurozone economy?
 Commodity prices have been falling for the past three years and have reached a four-year low. Since early 2011, the IMF overall commodity price index (based on 2005 prices) has fallen by 16.5%: from 210.1 in April 2011 to 175.4 in August 2014. The last time it was this low was December 2010.
Some commodity prices have fallen by greater percentages, and in other cases the fall has been only slight. But in the past few months the falls have been more pronounced across most commodities. The chart below illustrates these falls in the case of three commodity groups: (a) food and beverages, (b) agricultural raw materials and (c) metals, ores and minerals. (Click here for a PowerPoint of the chart.)
Commodity prices are determined by demand and supply, and factors on both the demand and supply sides have contributed to the falls.
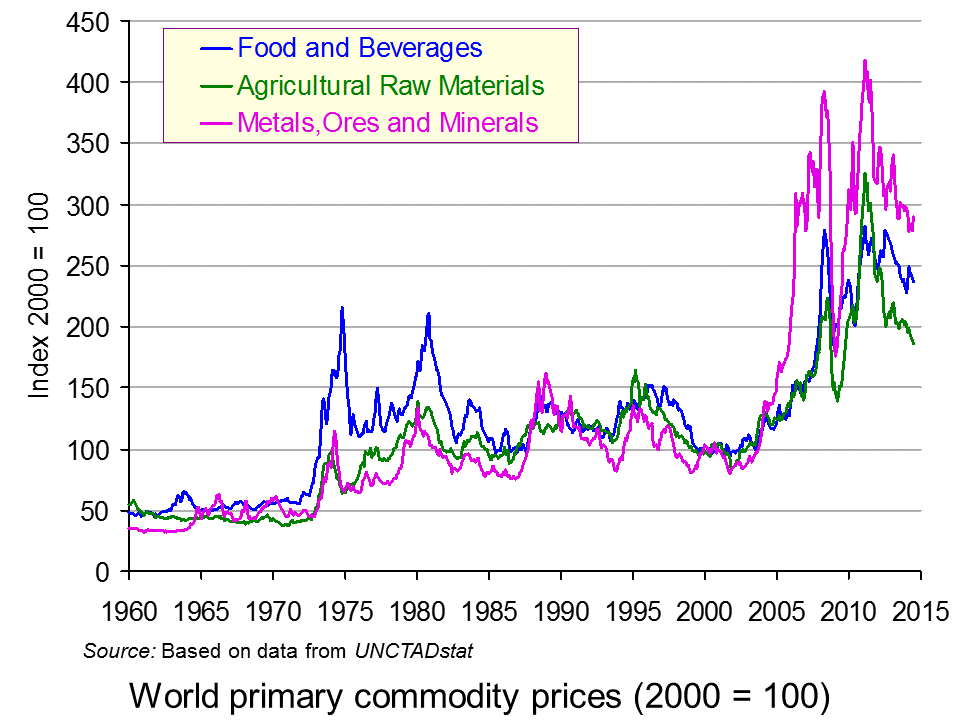
With growth slowing in China and with zero growth in the eurozone, demand for commodities has shown little growth and in some cases has fallen as stockpiles have been reduced.
On the supply side, investment in mining has boosted the supply of minerals and good harvests in various parts of the world have boosted the supply of many agricultural commodities.
But in historical terms, prices are still relatively high. There was a huge surge in commodity prices in the period up to the financial crisis of 2008 and then another surge as the world economy began to recover from 2009–11. Nevertheless, taking a longer-term perspective still, commodity prices have risen in real terms since the 1960s, but with considerable fluctuations around this trend, reflecting demand and supply at the time.
Articles
Commodities Fall to 5-Year Low With Plenty of Supplies Bloomberg Businessweek, Chanyaporn Chanjaroen (11/9/14)
Commodity ETFs at Multi-Year Lows on Supply Glut ETF Trends, Tom Lydon (11/9/14)
What dropping commodity prices mean CNBC, Art Cashin (11/9/14)
Goldman sees demand hitting commodity price DMM FX (12/9/14)
Commodity price slump is a matter of perspective Sydney Morning Herald, Stephen Cauchi (11/9/14)
Commodities index tumbles to five-year low Financial Times, Neil Hume (12/9/14)
Commodities: More super, less cycle HSBC Global Research, Paul Bloxham (8/1/13)
Commodity prices in the (very) long run The Economist (12/3/13)
Data
IMF Primary Commodity Prices IMF
UNCTADstat UNCTAD (Select: Commodities > Commodity price long-term trends)
Commodity prices Index Mundi
Questions
- Identify specific demand-and supply-side factors that have affected prices of (a) grains; (b) meat; (c) metal prices; (d) oil.
- Why is the demand for commodities likely to be relatively inelastic with respect to price, at least in the short term? What are the implications of this for price responses to changes in supply?
- Why may there currently be a ‘buying opportunity’ for potential commodity purchasers?
- What is meant by the ‘futures market’ and future prices? Why may the 6-month future price quoted today not necessarily be the same as the spot price (i.e. the actual price for immediate trading) in 6 months’ time?
- How does speculation affect commodity prices?
- How does a strong US dollar affect commodity prices (which are expressed in dollars)?
- How may changes in stockpiles give an indication of likely changes in commodity prices over the coming months?
- Distinguish between real and nominal commodity prices. Which have risen more and why?
- How do real commodity prices today compare with those in previous decades?
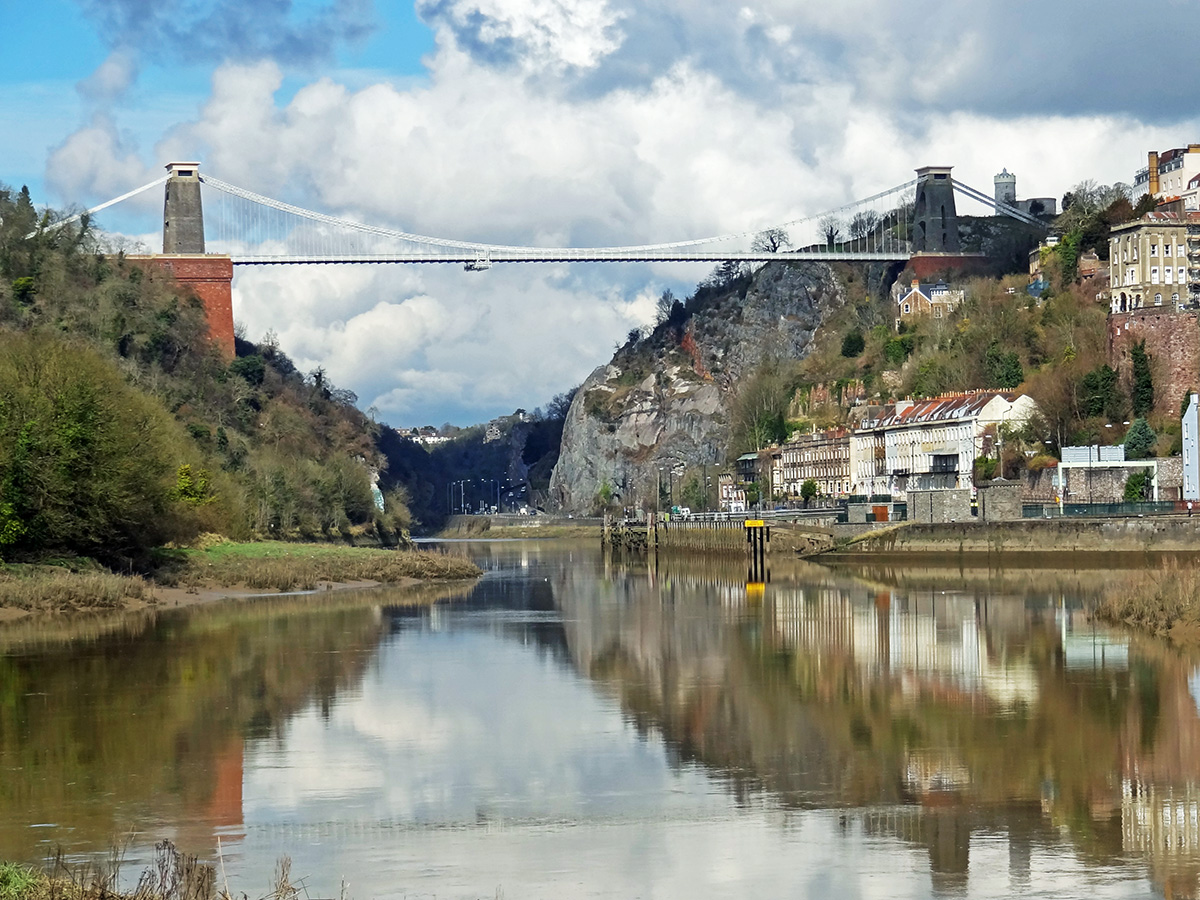
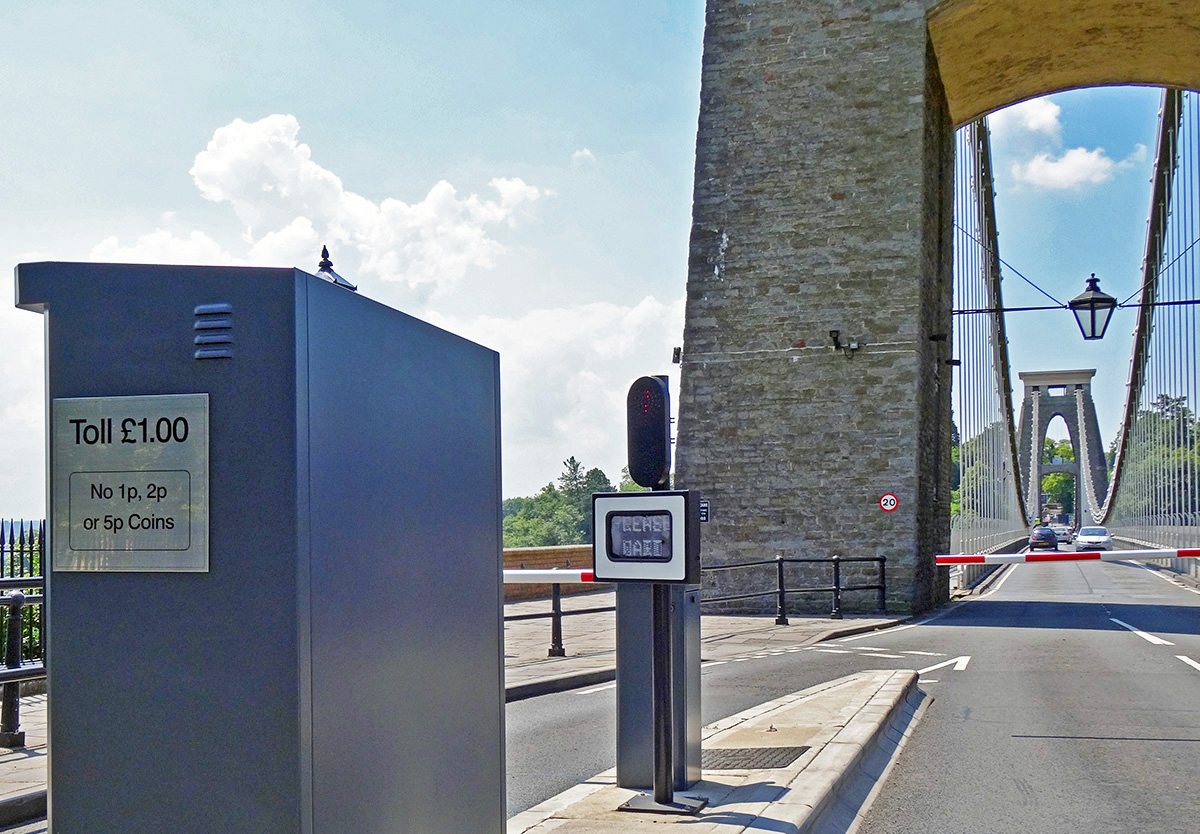
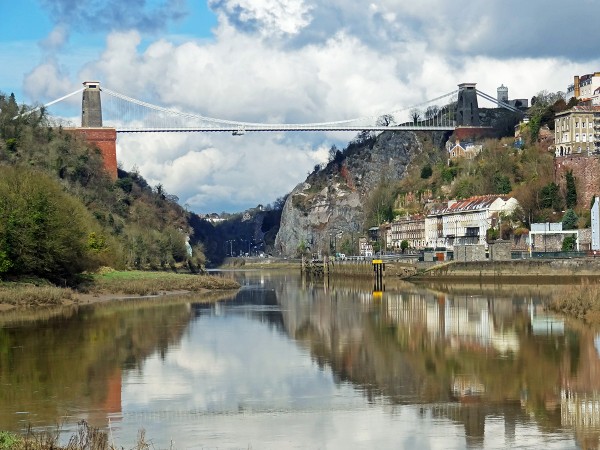 There have been two significant changes in prices for travel in Bristol. At the end of April, the toll on Brunel’s iconic Clifton Suspension Bridge doubled from 50p to £1 for a single crossing by car. The bridge over the Avon Gorge links North Somerset with the Clifton area of Bristol and is a major access route to the north west of the city. Avoiding the bridge could add around 2 miles or 8 minutes to a journey from North Somerset to Clifton.
The justification given by the Clifton Suspension Bridge Trust for the increase was that extra revenue was needed for maintenance and repair. As Trust Chairman Chris Booy said, ‘The higher toll will enable the Trust to continue its £9 million 10-year vital repair and maintenance programme which aims to secure the bridge’s long-term future as a key traffic route, one of Bristol’s major tourist destinations and the icon of the city’.
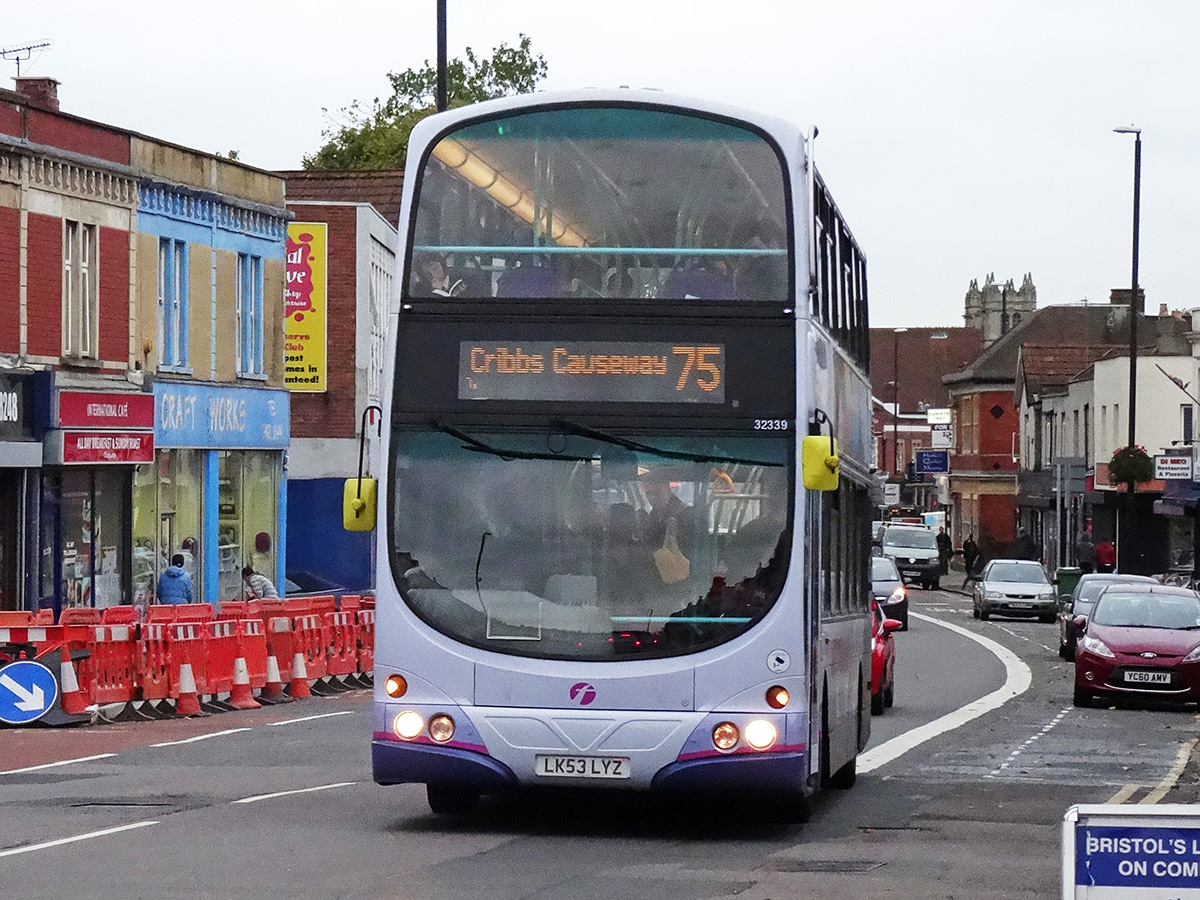
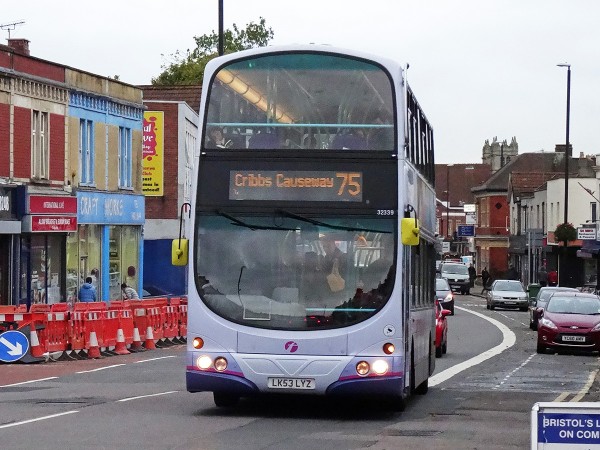 The other price change has been downwards. In November 2013, the First Group cut bus fares in Bristol and surrounding areas. Single fares for up to three miles were cut from £2.90 to £1.50; 30% discounts were introduced for those aged 16 to 21; half-price tickets were introduced for children from 5 to 15; and the two fare zones for £4 and £6 day tickets were substantially increased in size.
First hoped that the anticipated increase in passengers would lead to an increase in revenue. Evidence so far is that passenger numbers have increased, with journeys rising by some 15%. Part of this is due to other factors, such as extra bus services, new buses, free wifi and refurbished bus stops with larger shelters and seats. But the company attributes a 9% rise in passengers to the fare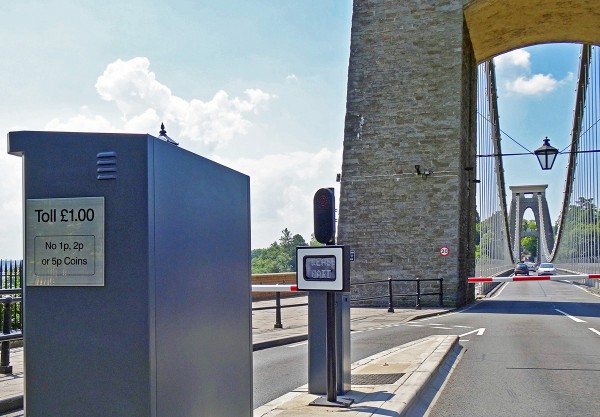 reductions. As far as revenue is concerned, indications from the company are that, after an initial fall, revenue has risen back to levels earned before the fare reduction.
What are the longer-term implications for revenue and profit of these two decisions? This depends on the price elasticity of demand and on changes in costs. Read the articles and then consider the implications by having a go at answering the questions.
Clifton Suspension Bridge toll to rise from 50p to £1 BBC News (9/4/14)
Regular Users of Clifton Suspension Bridge will be Protected from the Increase in the Bridge Toll Clifton Suspension Bridge (9/4/14)
Clifton Suspension Bridge Review Decision Letter Department of Transport (24/3/14)
Clifton Suspension Bridge Trust: bridge toll review inspector’s report Department of Transport (8/4/14)
Clifton Suspension Bridge Toll Increase – Account of the May 2013 Public Inquiry The National Alliance Against Tolls (NAAT)
First Bus Bristol fare cuts sees passenger growth BBC News (6/6/14)
First gamble over cheaper bus fares pays off as passengers increase in Bristol The Bristol Post (6/6/14)
Bristol bus fares deal to extend to South Gloucestershire and North Somerset The Bristol Post, Gavin Thompson (12/6/14)
Questions
- What assumptions is the Clifton Suspension Bridge Trust making about the price elasticity of demand for bridge crossings?
- What determines the price elasticity for bridge crossings in general? Why is this likely to differ from one bridge to another?
- How is the long-term price elasticity of demand likely to differ from the short-term elasticity for Clifton Suspension Bridge crossings and what implications will this have for revenues, costs and profit?
- How is the price elasticity of demand for the bridge likely to vary from one user to another?
- How is offering substantial price reductions for multiple-crossing cards likely to affect revenue?
- What determines the price elasticity of demand for bus travel?
- What could a local council do to encourage people to use buses?
- How is the long-term price elasticity of demand for bus travel likely to differ from the short-term elasticity?
- In the long run, is First likely to see profits increase from its fare reduction policy? Explain what will determine this likelihood.
 What does it take to create a successful business? From the looks of it: mud, electric barbed wire, icy water, enormous walls to climb, big jumps to make, team work and complete exhaustion – the recipe for every successful business.
Tough Mudder was founded in 2010 and runs gruelling extreme obstacle courses for anyone mad enough to think it might be fun. In the BBC News article below, you’ll see that there is a discussion as to intellectual property rights, but whatever the outcome, this company has become the main provider of such extreme sports in a remarkably short period of time. Within 2 years of being established, it had gained 500,000 participants and now records annual revenues of more than £60m. Add to this, that there has no external funding and this organic growth is beyond impressive.
A key question, then, is what creates such a successful business? Without a doubt, this depends on the product you are selling and the market a firm is in, but there are some aspects that apply across the board. Understanding what your customers want is crucial, as they represent your demand. Differentiating your product to create inelastic demand may be a good strategy to enable price rises, without losing a large number of sales, but the differentiated product is essential in establishing demand, loyalty and reputation. Marketing something in the right way and to the right audience is crucial – word-of-mouth is often the most effective form of advertising.
If you have all of these aspects, then you have the makings of a successful business. The next step is putting it into practice and climbing those high walls, taking the big jumps and hopefully avoiding the mud and ice. The following article considers Will Dean and his fast growing business.
Will Dean: ‘The Mark Zuckerberg of extreme sports’ BBC News, Will Smale (9/6/14)
Questions
- If you were starting up a business, how might you go about finding out if there is a demand for your product?
- Why is product differentiation a key aspect of a successful business? Using a diagram, explain how this might help a firm increase revenue and profits.
- What forms of marketing might be used in persuading customers to buy your product?
- In the case of Tough Mudder, which aspects have proved the most important in creating such a successful business?
- Are there any barriers to the entry of new firms in this sector? If so, what are they are how important are they in allowing Tough Mudder to retain a monopoly position?
- Which factors should be considered by a company when it is thinking of global expansion?
 Most observers were once again left stunned by how much media companies are willing to pay to secure the rights to broadcast live games in the English Premier League (EPL). At the same time the method used to sell those rights is being investigated by Ofcom following complaints made by Virgin Media. Virgin Media actually requested that the auction was halted until the investigation was completed.