 The Digital Markets Act (DMA) outlines a new regulatory approach that the European Commission (EC) is taking to address concerns over the lack of competition in digital platform markets. The DMA complements existing European Union competition law and officially came into force on 1st November 2022.
In the first stage of this new regulatory approach, the EC identified ten core platform services (CPS). Examples include search engines, online social networking services, video sharing services, cloud computing services, web browsers and operating systems. These services act as important gateways for large numbers of businesses and consumers to interact with one another. They also have some important economic characteristics, such as large economies of scale and very strong network effects.
The next stage of the regulatory process was to assess which of the large established businesses should be designated as ‘gatekeepers’ of these CPS. To be judged as a gatekeeper, a business had to meet three qualitative criteria. Using quantitative thresholds as a guide to see if these qualitative criteria had been met, the following six companies were designated as gatekeepers by the EC in September 2023: Alphabet (Google’s parent company), Amazon, Apple, ByteDance (owner of TikTok), Meta (owner of Facebook) and Microsoft. Individual companies can be gatekeeper for more than one CPS. For example, Apple was judged to be a gatekeeper for both web browsers (Safari) and operating systems (iOS and iPadOS).
Rules and compliance
 Once a business has been designated as a gatekeeper for one or more CPS, the DMA imposes a set of rules on its future conduct. Some of these rules refer to conduct that the business must follow, while others refer to types of behaviour that are prohibited. The EC sometimes refer to these rules as a list of “do’s” and “don’ts”.
One of the rules refers to interoperability. This is the degree to which different (a) software, (b) devices and (c) other applications can work seamlessly together (i.e. share functionality/data) without requiring any actions by the user (i.e. how compatible they are with one another).
For example, consider the degree of interoperability between the operating system of a gatekeeper, such as Apple, and other hardware/software services. One of the requirements of the DMA is for the gatekeeper to provide the same degree of interoperability for the hardware/software services provided by rival businesses as they do for similar hardware/software services they supply. This is sometimes referred to as the interoperability obligation.
Once a business is designated as a gatekeeper, it has 6 months to submit a compliance report to the EC that demonstrates how it is meeting the rules set out in the DMA. This should include descriptions of any changes the company has had to make to its conduct to meet the new requirements. Further compliance reports must then be submitted on an annual basis.
If, after assessing a compliance report, the EC suspects that a gatekeeper is still acting in ways that do not comply with the DMA, then it can launch either a non-compliance or specification procedure.
The case of Apple
 Apple submitted its first compliance report on 7 March 2024. It was far less extensive than those completed by other designated gatekeepers and adopted a very different tone: it directly challenged the EC’s view that the DMA rules would have a positive impact on consumer welfare.
In September 2024, the EC launched its first two specification proceedings that focused on Apple’s compliance with the interoperability obligation.
The first of these proceedings opened a formal discussion with Apple over the interoperability between the iPhone operating system (iOS) and connected devices such as smartwatches and headphones. The proceeding identified nine features that gave the iOS greater functional compatibility with connected devices produced by Apple than with those made by other businesses. For example:
- Only users of connected devices produced by Apple can (a) receive iOS notifications that contain images or other attachments and (b) select the iOS notifications they want to appear on the device.
- Only users of Apple’s wireless headphones have intelligent audio switching functionality that allows them to switch automatically to the device playing the most relevant audio.
- The Airdrop function, which enables users to share files wirelessly between devices, only works if they are both produced by Apple.
- Only connected devices made by Apple have the functionality for high-bandwidth data transfer from an iPhone without having to rely on network or cellular connection. This is useful for gaming and AI services.
The second specification proceeding focused on the process developed by Apple to deal with requests from other businesses that wanted to develop hardware or software services that are compatible with the iOS.
On 18th December 2024, the EC informed Apple of its preliminary specification decisions and opened a consultation exercise with other interested parties about the suitability of its proposals. Once this process was completed, the EC informed Apple of its final specification decisions on 19 March 2025.
The EC’s decisions
 The first decision included a set of measures that Apple must take to improve the interoperability of connected devices produced by other businesses with the iOS. The EC stated that:
The interoperability solutions for third parties will have to be equally effective to those available to Apple and must not require more cumbersome system setting or additional user friction.
The second decision outlined measures that Apple had to take to improve the process of dealing with requests for greater compatibility with the iOS. For example, it should provide outside businesses with more (a) access to technical documentation, (b) predictable timelines for the reviews and (c) timely updates.
Apple argued that being forced to introduce these measures will (a) create significant additional costs, (b) limit its ability to develop products that work seamlessly with one another and (c) lead to its having to share sensitive customer information with its rivals.
On 30th May 2025, Apple filed an appeal against the EC’s specification decisions to the General Court of the European Union. It will be interesting to see what judgment is made on this case by the General Court and the implications this has for the enforcement of the DMA.
Video
Articles
- The EU Digital Markets Act – The Holy Grail of Big Tech Regulation?
Morrison & Foerster, Andreas Grünwald, Christoph Nüßing and Theresa Oehm (19/7/22)
- Commission starts first proceedings to specify Apple’s interoperability obligations under the Digital Markets Act
EC Press Release (19/9/24)
- Apple hits out at Meta’s numerous interoperability requests
Reuters, Foo Yun Chee (19/12/24)
- 1st Anniversary of the Digital Markets Act (DMA): Lessons learned and road ahead
Hausfeld Competition Bulletin, Ann-Christin Richter and René Galle (28/3/25)
- EU accuses Google and Apple of breaking its rules, risking Trump clash
The Guardian, Rob Davies and Dan Milmo (19/3/25)
- Brussels takes action against Google and Apple despite Trump threat
Financial Times, Barbara Moens (19/3/25)
- Brussels Takes Action Against Google And Apple Despite Trump Threat
GNC (19/3/25)
- Commission provides guidance under Digital Markets Act to facilitate development of innovative products on Apple’s platforms
EC Press Release (19/3/25)
- European Commission Fines Both Apple, Meta For DMA Breaches
Silicon UK, Tom Jowitt (23/4/25)
- Apple Appeals European Commission Order on Interoperability With Competitors’ Products
PYMNTS (2/6/25)
- https://dig.watch/updates/apple-sues-european-commission-over-dma-interoperability-ruling
The Digital Watch (6/6/25)
- Meta, Apple Launch Legal Challenges to EU DMA Rulings
PYMNTS (3/6/25)
Questions
- Identifying core platform services is similar to defining relevant markets in standard competition policy but takes a more legalistic approach. Discuss some of the problems of defining a relevant market for a digital platform.
- Outline the three qualitative criteria and the quantitative thresholds that are used by the EC to designate a digital platform as a gatekeeper of a core platform service.
- Find an example of a digital platform that met the quantitative thresholds but did not meet the qualitative criteria and so was not designated as a gatekeeper.
- Find an example of a digital platform that did not meet the quantitative thresholds but did meet the qualitative criteria and so was designated as a gatekeeper.
- Interoperability is a type of conduct that is sometimes referred to as self-preferencing: i.e. behaviour by a digital platform that gives its own products/services preferential treatment over those provided by other firms that use the same platform. What other types of conduct are possible examples of self-preferencing?
- What is the difference between a non-compliance procedure and a specification procedure? Find some recent examples of non-compliance procedures that have been undertaken by the EC to enforce the DMA.
- What are the potential advantages and disadvantages for consumer welfare of the specification decisions made by the EC?
 In a 1987 address to the US nation, Republican President Ronald Reagan discussed the question of tariffs. His message was clear.
You see, at first, when someone says, ‘Let’s impose tariffs on foreign imports,’ it looks like they’re doing the patriotic thing by protecting American products and jobs. And sometimes for a short while it works – but only for a short time. What eventually occurs is:
First, homegrown industries start relying on government protection in the form of high tariffs. They stop competing and stop making the innovative management and technological changes they need to succeed in world markets.
And then, while all this is going on, something even worse occurs: high tariffs inevitably lead to retaliation by foreign countries and the triggering of fierce trade wars. The result is more and more tariffs, higher and higher trade barriers, and less and less competition. So, soon, because of the prices made artificially high by tariffs that subsidise inefficiency and poor management, people stop buying.
Then the worst happens: markets shrink and collapse; businesses and industries shut down; and millions of people lose their jobs.
The memory of all this occurring back in the thirties made me determined when I came to Washington to spare the American people the protectionist legislation that destroys prosperity.
Now, it hasn’t always been easy. There are those in this Congress, just as there were back in the ’30s, who want to go for the quick political advantage, who will risk America’s prosperity for the sake of a short-term appeal to some special interest group, who forget that more than five million American jobs are directly tied to the foreign export business and additional millions are tied to imports.
For those of us who lived through the Great Depression, the memory of the suffering it caused is deep and searing. And today, many economic analysts and historians argue that high tariff legislation, passed back in that period called the Smoot-Hawley Tariff, greatly deepened the Depression and prevented economic recovery.
 He returned to the topic of tariffs in November 1988, when he reflected on the benefits of free and fair trade and the dangers of protectionism.
Here in America, as we reflect on the many things we have to be grateful for, we should take a moment to recognize that one of the key factors behind our nation’s great prosperity is the open trade policy that allows the American people to freely exchange goods and services with free people around the world. The freedom to trade is not a new issue for America.
In 1776 our Founding Fathers signed the Declaration of Independence, charging the British with a number of offenses, among them, and I quote, ‘cutting off our trade with all parts of the world’.
And that same year, a Scottish economist named Adam Smith launched another revolution with a book entitled ‘The Wealth of Nations’, which exposed for all time the folly of protectionism. Over the past 200 years, not only has the argument against tariffs and trade barriers won nearly universal agreement among economists but it has also proven itself in the real world, where we have seen free-trading nations prosper while protectionist countries fall behind.
America’s most recent experiment with protectionism was a disaster for the working men and women of this country. When Congress passed the Smoot-Hawley tariff in 1930, we were told that it would protect America from foreign competition and save jobs in this country – the same line we hear today. The actual result was the Great Depression, the worst economic catastrophe in our history; one out of four Americans were thrown out of work. Two years later, when I cast my first ballot for President, I voted for Franklin Delano Roosevelt, who opposed protectionism and called for the repeal of that disastrous tariff.
Ever since that time, the American people have stayed true to our heritage by rejecting the siren song of protectionism. In recent years, the trade deficit led some misguided politicians to call for protectionism, warning that otherwise we would lose jobs. But they were wrong again. In fact, the United States not only didn’t lose jobs, we created more jobs than all the countries of Western Europe, Canada, and Japan combined. The record is clear that when America’s total trade has increased, American jobs have also increased. And when our total trade has declined, so have the number of jobs.
Part of the difficulty in accepting the good news about trade is in our words. We too often talk about trade while using the vocabulary of war. In war, for one side to win, the other must lose. But commerce is not warfare. Trade is an economic alliance that benefits both countries. There are no losers, only winners. And trade helps strengthen the free world.
Yet today protectionism is being used by some American politicians as a cheap form of nationalism, a fig leaf for those unwilling to maintain America’s military strength and who lack the resolve to stand up to real enemies – countries that would use violence against us or our allies. Our peaceful trading partners are not our enemies; they are our allies.
We should beware of the demagogs who are ready to declare a trade war against our friends – weakening our economy, our national security, and the entire free world – all while cynically waving the American flag. The expansion of the international economy is not a foreign invasion; it is an American triumph, one we worked hard to achieve, and something central to our vision of a peaceful and prosperous world of freedom.
After the Second World War, America led the way to dismantle trade barriers and create a world trading system that set the stage for decades of unparalleled economic growth. And in one week, when important multilateral trade talks are held in Montreal, we will be in the forefront of efforts to improve this system. We want to open more markets for our products, to see to it that all nations play by the rules, and to seek improvement in such areas as dispute resolution and agriculture. We also want to bring the benefits of free trade to new areas, including services, investment, and the protection of intellectual property. Our negotiators will be working hard for all of us.
Yes, back in 1776, our Founding Fathers believed that free trade was worth fighting for. And we can celebrate their victory because today trade is at the core of the alliance that secure the peace and guarantee our freedom; it is the source of our prosperity and the path to an even brighter future for America.
The questions below address whether these radio addresses by President Reagan are relevant in today’s context of the imposition of tariffs by President Trump.
Videos of Radio Addresses
Articles and postings
Questions
- Summarise Ronald Reagan’s arguments.
- How would Donald Trump reply to these arguments?
- Can tariffs ever be justified on efficiency grounds?
- Can tariffs be justified as a bargaining ploy? Can they be used as a means of achieving freer and fairer trade?
- Find out why the Smoot-Hawley Tariff Act was introduced in 1930 and what were its consequences.
- How does the World Trade Organization seek to promote freer and fairer trade? How does it resolve trade disputes?
According to Ofcom’s November 2024 Online Nation report (see report linked below), UK adults are falling out of love with dating apps. Use of the top three platforms in the UK (Tinder, Hinge, and Bumble) is declining, even though most users are juggling multiple apps at once. So, what’s going on? Economics may have some valuable insights to help explain the decline.
Too much choice
 First, dating platforms don’t function like typical commodity markets, where prices adjust until supply and demand balance. Instead, dating can be seen as what economists call a ‘matching market’, where success depends on mutual interest, not on a specific price. So even with thousands of potential matches, forming actual connections remains difficult, and more choice doesn’t necessarily translate into better outcomes.
In fact, more choice can backfire. The paradox of choice, a behavioural economics concept, suggests that too many options can lead to choice paralysis. Instead of feeling empowered by an abundance of potential partners, users can feel overwhelmed, unsure, and often less satisfied with whatever choice they end up making (if they make one at all).
So, while we often think of dating apps, like many other platforms, benefiting from positive network effects, where more users increase the platform’s value by offering more potential matches, this can also have negative effects. Swiping through endless profiles and repeating the same small talk, can turn dating into a chore rather than an exciting opportunity.
Adverse selection
 What makes this even harder is that users can’t easily distinguish between who’s genuinely looking for the same thing you are, and who’s just there to pass the time. This information asymmetry leads to the adverse selection problem – a concept famously explored by economist George Akerlof in his 1970 paper ‘The Market for Lemons’ (see link below). He showed how lack of information about product quality can cause high-quality sellers to exit, resulting in market failure where the market becomes dominated by low-quality goods (i.e. ‘lemons’).
A similar dynamic can play out on dating apps. If users believe most profiles are unserious or not genuine, they become less willing to engage, or even stay on the platform. Meanwhile, the most genuine users may give up altogether, worsening the quality of the pool and discouraging others.
In economics, there are some well-known ways in which the problem of adverse selection could be overcome. One such possibility is through signalling, where the more informed person tries to reveal important information to the uninformed person. Indeed, platforms have experimented with signalling mechanisms, like verification tools for example. Paid subscriptions have also been implemented, which could help to some extent (assuming that those who are willing to pay are those who are genuine and serious about finding a match). But these solutions only go so far, and with fewer users paying to signal intent, the problem persists.
Lack of innovation
 This ties into the wider revenue model of dating apps. Unlike many apps that rely on revenue from advertising on one side of the market to offer the app free to consumers on the other side, dating platforms often rely more on revenue through monthly subscriptions and paid upgrades. But with fewer users willing to pay, these platforms may be under pressure. This financial pressure may also affect their ability to innovate or improve the service.
In fact, in the dating app world, there is another reason why platforms may not be innovating as much as they should, aside from simply trying to convince their users to pay for a better service. While it seems like there’s endless choice in the dating app world, much of the market is controlled by a single company, InterActiveCorp (IAC), which owns Tinder, Hinge, Match.com and more. With limited competition, there’s less incentive to compete on quality.
Worse still, dating apps face a unique business problem: if their service works too well, users leave and delete the app. So, there may be a built-in tension between helping users succeed and keeping them swiping.
The outlook for dating apps
So, is the decline in dating app use just temporary, or the start of something bigger? Time will tell. However, from an economics perspective, there is a noticeable shift in demand towards substitutes, such as organised in-person social events and activities, which encourages more and more of these opportunities to emerge. This shift may reflect changing preferences and the costs (in terms of time and emotional energy) that users are willing to invest in online dating.
At the same time, AI already plays a key role in dating apps, and new possibilities seem to be emerging. For example, we could see a bigger rollout of AI-driven chatbots that facilitate conversations or even interact on behalf of users. This could make it easier to connect with potential matches and might help in addressing some of the other issues discussed above.
Articles
Video
Report
Questions
- How might ‘signalling’ and ‘screening’ be used to create new features or services that could help overcome the adverse selection problem in this market?
- Can you think of any other ways in which the adverse selection problem could be overcome in this context?
- Draw a diagram to illustrate the two-sided nature of the dating app market, making clear where there may be positive or negative network effects.
- How else might dating app platforms be making revenue that allows them to offer the app to users at no charge?
- Is the dating app market competitive? You might consider factors such as the availability of substitutes, barriers to entry and innovation.
 On April 2nd, Donald Trump announced sweeping new ‘reciprocal’ tariffs. These would be in addition to 25% tariffs on imports of cars, steel and aluminium already announced and any other tariffs in place on individual countries, such as China. The new tariffs would apply to US imports from every country, except for Canada and Mexico where tariffs had already been imposed.
The new tariffs would depend on the size of the country’s trade in goods surplus with the USA (i.e. the USA’s trade in goods deficit with that country). The bigger the percentage surplus, the bigger the tariff. But, no matter how small a country’s surplus or even if it runs a deficit (i.e. imports more goods from the USA than it sells), it would still face a minimum 10% ‘baseline’ tariff.
President Trump stated that these tariffs are to counter what he claims as unfair trade practices inflicted on the USA. People had been expecting that these tariffs would reflect the tariffs applied by other countries on US goods and possibly also non-tariff barriers, such as the ban on chlorine-washed chicken or hormone-injected beef in the EU and UK. But, by basing them on the size of a country’s trade surplus, this meant imposing them on many countries with which the USA has a free-trade deal with no tariffs at all.
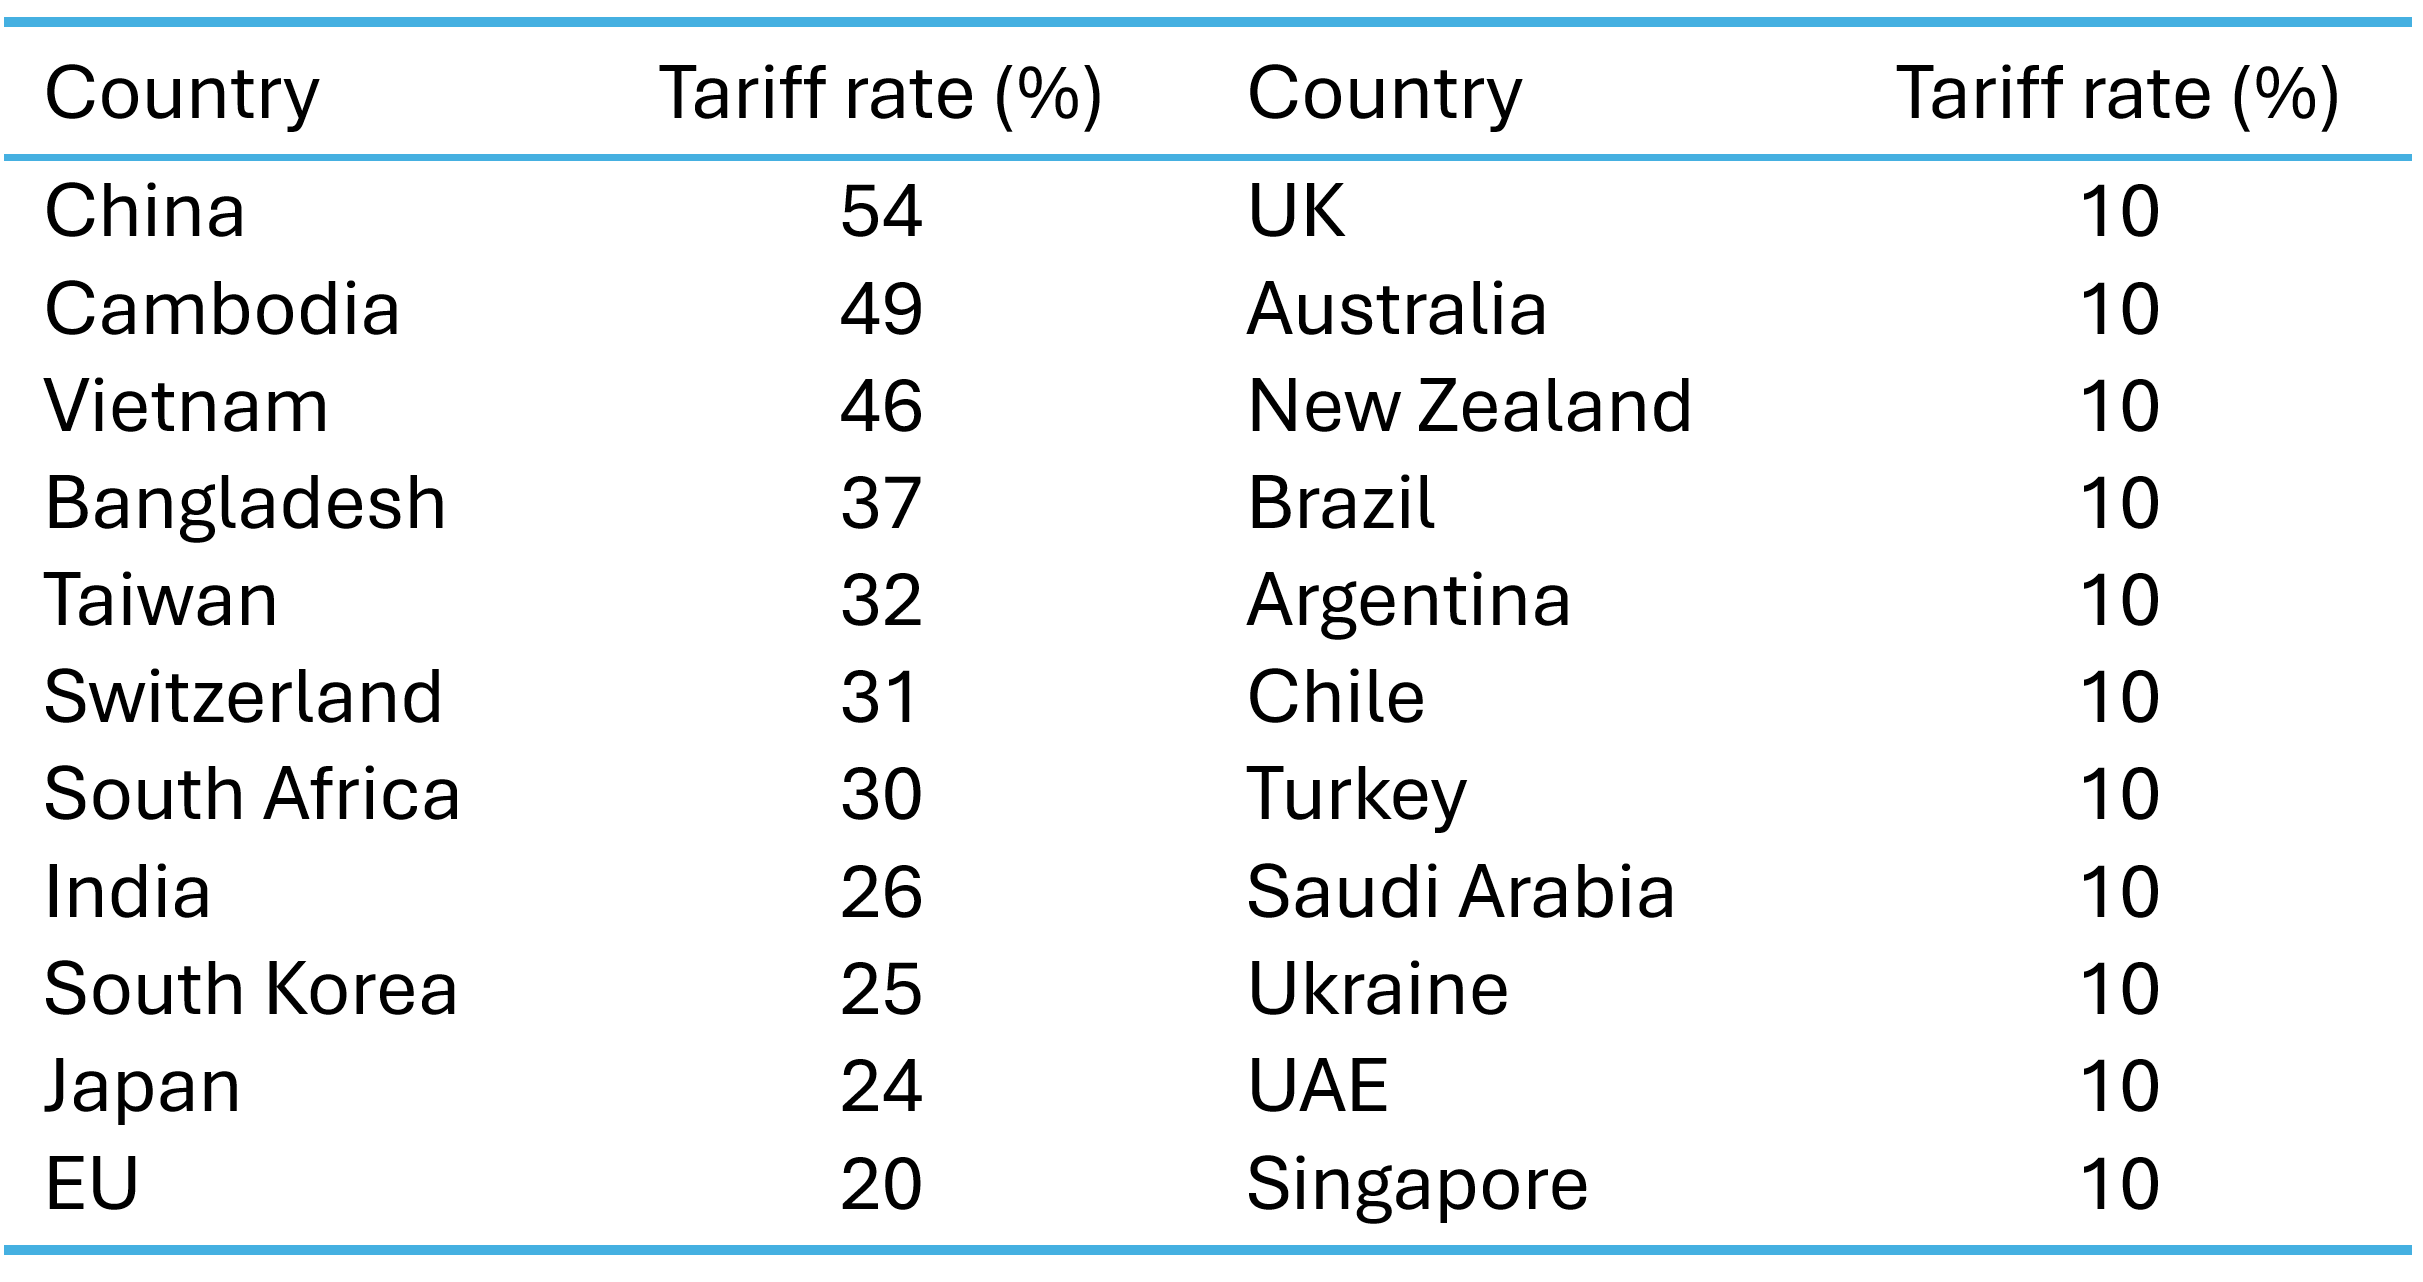 The table gives some examples of the new tariff rates. The largest rates would apply to China and south-east Asian countries, which supply low-priced products, such as clothing, footwear and electronics to the US market. In China’s case, it would a reciprocal tariff rate of 34% plus the previously imposed tariff rate of 20%, giving a massive 54%.
What is more, the ‘de minimis’ exemption will be scrapped for packages sent by private couriers. This had exempted goods of $800 or less sent direct to consumers from China and other countries from companies such as Temu and Alibaba. It is also intended to cut back on packages of synthetic opioids sent from these countries.
Since ‘liberation day’, President Trump has made several changes to these tariff rates. On 9 April he ‘paused’ the implementation of the tariffs above the 10% rate pending trade discussions with individual countries. However, in the case of China, there have been tit-for-tat tariff increases, so that by the end of April, the US tariff rate on Chinese imports was a massive 145% and the Chinese rate on US imports was 125%. The two countries seemed locked in a high-stakes game of chicken.
The US formula for reciprocal tariffs
As we have seen, the proposed (and then paused) reciprocal tariffs do not reflect countries’ tariff rates on the USA. Instead, rates for countries running a trade in goods surplus with the USA (a US trade deficit with these countries) are designed to reflect the size of that surplus as a percentage of their total imports from the USA. The White House has published the following formula.
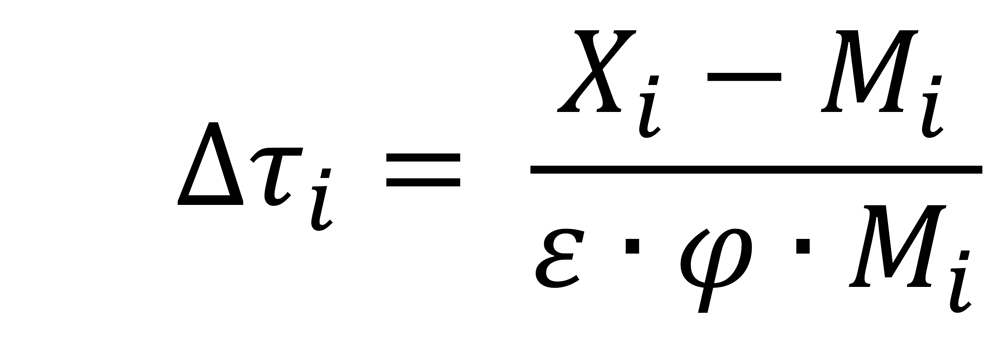
where:

When the two elasticities are multiplied together this gives 1 and so can be ignored. As there was no previous ‘reciprocal’ tariff, the rise in the reciprocal tariff rate is the actual reciprocal tariff rate. The formula for the reciprocal tariff rate thus becomes the percentage trade surplus of that country with the USA: (exports – imports) / imports, expressed as a percentage. This is then rounded up to the nearest whole number.
President Trump also stated that countries would be given a discount to show US goodwill. This involves halving the rate from the above formula and then rounding up to the nearest whole number.
Take the case of China. China’s exports of goods to the USA in 2024 were $439bn, while its imports of goods from the USA were $144bn, giving China a trade surplus with the USA of $295bn. Expressing this as a percentage of exports gives ($295/$439 × 100)/2 = 33.6%, rounded up to 34%. For the EU, the formula gives ($227bn/$584bn × 100)/2 = 19.4%, rounded up to 20%.
Questioning the value of φ. Even if you accept the formula itself as the basis for imposing tariffs, the value of the second term in the denominator, φ, is likely to be seriously undervalued. The term represents the elasticity of import prices with respect to tariff changes. It shows the proportion of a tariff rise that is passed on to consumers, which is assumed to be just one quarter, with producers bearing the remaining three quarters. In reality, it is highly likely that most of the tariff will get passed on, as it was with the tariffs applied in Donald Trump’s first presidency.
If the value for φ were 1 (i.e. all the tariff passed on to the consumer), the formula would give a ‘reciprocal tariff’ of just one quarter of that with a value of φ of 0.25. The figures in the table above would look very different. If the rates were then still halved, all countries with a tariff below 40% (such as the EU, Japan or India) would instead face just the baseline tariff of 10%. What is more, China’s rate would be reduced from 54% to 30% (the original 20% plus the baseline of 10%). Cambodia’s would be reduced to 13%. Even if the halving discount were no longer applied, the rates would still be only half of those shown in the table (and 37% for China).
Are the tariffs justified?
 Even if a correct value of φ were used, a percentage trade surplus is a poor way of measuring the protection used by a country. Many countries running a trade surplus with the USA are low-income countries with low labour costs. They have a comparative advantage in labour-intensive goods. That allows such goods to be purchased at low cost by Americans. Their trade surplus may not be a reflection of protection at all.
Also, if protection is to be used to reflect the trade imbalance with each country, then why impose a 10% baseline on countries, like the UK, with which the USA has a trade surplus? By the Trump administration’s logic, it ought to be subsidising UK imports or accepting of UK tariffs on imports of US goods.
But President Trump also wants to address the USA’s overall trade deficit. The US balance of trade in goods deficit was $1063bn in 2023 (the latest year for a full set of figures). But the overall balance of payments must balance. There were thus surpluses elsewhere on the balance of payments account (and some other deficits). There was a surplus on the services account of $278bn and on the financial account of $924bn. In other words, inward investment to the USA (both direct and portfolio) and the acquisition of dollars by other countries as a reserve asset were very large and helped to drive up the exchange rate. This made US goods less competitive and imports relatively cheaper.
The USA has a large national debt of some $36 trillion of which some $9 trillion is owed to foreign investors (people, institutions or countries). Servicing the debt pushes up US interest rates. This helps to maintain a high exchange rate, thereby making imports cheaper and worsening the trade deficit. The fiscal burden of servicing the debt also crowds out US government expenditure on items such as defence, education, law and order and infrastructure. President Trump hopes that tariffs will bring in additional revenue to help finance the deficit.
Effects on the USA
If the tariffs reduce spending on imports and if other countries do not retaliate, then the US balance of trade should improve. However, a tariff is effectively a tax on imported goods. It is charged to the importing company not to the manufacturer abroad. As we saw in the context of the false value for φ, most of the tariff will be passed on to American consumers. Theoretically the incidence of the tariff is shared between the supplier and the purchaser, but in practice, most of the higher cost to the importer will be passed on to the consumer. As with other taxes, the effect is to transfer money from the consumer to the government, making people poorer but giving the government extra revenue. This revenue will be dollars, not foreign currency.
As some of the biggest price rises will be for cheap manufactured products, such as imports from China, and various staple foodstuffs, the effects could be felt disproportionately by the poor. Higher import prices will allow domestic producers competing with these imports to raise their prices too. The tariffs are thus likely to be inflationary. But because the inflation would be the result of higher costs, not higher demand, this could lead to recession as real incomes fell.
American resources will be diverted by the tariffs from sectors in which the USA has a comparative advantage, such as advanced manufactured goods and services, to more basic products. Tariffs on cheap imports will make domestic versions of these products more profitable: even though they are more costly to produce, they will be sold at a higher price.
The tariffs will also directly affect goods produced by US companies. The reason is that many use complex supply chains involving parts produced abroad. Take the case of Apple. Even though it is an American company which designs its products in California, the company sources parts from several Asian countries and has factories in Vietnam, China, India, and Thailand. These components will face tariffs and thus directly affect the price of iPhones, iPads, MacBooks, etc. Similarly affected are other US tech hardware manufacturers, US car manufactures, clothing and footwear producers, such as The Gap and Nike, and home goods producers.
 Monetary policy response. How the Fed would respond is not clear. Higher inflation and lower growth, or even a recession, produces what is known as ‘stagflation’: inflation combined with stagnation. Many countries experienced stagflation following the Russian invasion of Ukraine, when higher commodity prices led to soaring inflation and economic slowdown. There was a cost-of-living crisis.
If a central bank has a simple mandate of keeping inflation to a target, higher inflation would be likely to lead to higher interest rates, making recession even more likely. It is the inflation of the two elements of stagflation (inflation and stagnation) that is addressed. The recession is thus likely to be deepened by monetary policy. But as the Fed has a dual mandate of controlling inflation but also of maximising employment, it may choose not to raise interest rates, or even to lower them, to get the optimum balance between these two targets.
If other countries retaliate by themselves raising tariffs on US exports and/or if consumers boycott American goods and services, this will further reduce incomes in the USA. Just two days after ‘liberation day’, China retaliated against America’s 34% additional tariff on Chinese imports by imposing its own 34% tariff on US imports to China.
A trade war will make the world poorer, especially the USA. Investors know this. In the two days following ‘liberation day’, stock markets around the world fell sharply and especially in the USA. The Dow Jones was down 9.3% and the tech-heavy Nasdaq Composite was down 11.4%.
Effects on the rest of the world
The effects of the tariffs on other countries will obviously depend on the tariff rate. The countries facing the largest tariffs are some of the poorest countries which supply the USA with simple labour-intensive products, such as garments, footwear, food and minerals. This could have a severe effect on their economies and cause rapidly increasing poverty and hardship.
 If countries retaliate, then this will raise prices of their imports from the USA and hurt their own domestic consumers. This will fuel inflation and push the more seriously affected countries into recession.
If the USA retaliates to this retaliation, thereby further escalating the trade war, the effects could be very serious. The world could be pushed into a deep recession. The benefits of trade, where all countries can gain by specialising in producing goods with low opportunity costs and importing those with high domestic opportunity costs, would be seriously eroded.
What President Trump hopes is that the tariffs will put him in a strong negotiating position. He could offer to reduce or scrap the tariffs on a particular country in exchange for something he wants. An example would be the offer to scrap or reduce the baseline 10% tariff on UK exports and/or the 25% tariff on UK exports of cars, steel and aluminium. This could be in exchange for the UK allowing the importation of US chlorinated chicken or abolishing the digital services tax. This was introduced in 2020 and is a 2% levy on tech firms, including big US firms such as Amazon, Alphabet (Google), Meta and X.
It will be fascinating but worrying to see how the politics of the trade war play out.
Videos
 Trump’s tariffs on China, EU and more, at a glance
BBC News, Michelle Fleury and Kayla Epstein (2/4/25)
- Why Trump’s tariffs aren’t really reciprocal
BBC News, Ben Chu (3/4/25)
- Trump Tariff calculations are “unreliable”
New Statesman on YouTube, Andrew Marr & Duncan Weldon (3/4/25)
- Here’s a look at Trump’s math for ‘reciprocal’ tariffs
Reuters on YouTube, Daniel Burns (3/4/25)
- The U.S. is the loser in Trump’s tariff war
MSNBC on YouTube, Steve Rattner (4/4/25)
- “American Empire Is in Decline”: Trump’s Trade War & Tariffs
Democracy Now on YouTube, Richard Wolff (3/4/25)
- ‘Our unity is our strength’ – EU responds to Trump’s tariffs
BBC News, Ursula von der Leyen, President of the European Commission (3/4/25)
Articles
- How were Donald Trump’s tariffs calculated?
BBC News, Ben Chu and Tom Edgington (3/4/25)
- How to read the White House’s tariff formula
Axios, Felix Salmon and Neil Irwin (3/4/25)
- Trump’s ‘idiotic’ and flawed tariff calculations stun economists
The Guardian, Richard Partington (3/4/25)
- Perilous and chaotic, Trump’s ‘liberation day’ endangers the world’s broken economy – and him
The Guardian, Martin Kettle (2/4/25)
- ‘In economic terms, Trump’s tariffs make no sense at all’
The Guardian, Heather Stewart and Richard Partington (4/3/25)
- Trump’s chaos-inducing global tariffs, explained in charts
The Guardian, Lauren Aratani, Lucy Swan, Ana Lucía González Paz and Aliya Uteuova (3/4/25)
- Trump’s trade war will hurt everyone – from Cambodian factories to US online shoppers
The Conversation, Lisa Toohey (3/4/25)
- Consumers are boycotting US goods around the world. Should Trump be worried?
The Conversation, Alan Bradshaw and Dannie Kjeldgaard (4/4/25)
- How the UK and Europe could respond to Trump’s ‘liberation day’ tariffs
The Conversation, Renaud Foucart (3/4/25)
- Trump just massively escalated his trade war. Here’s what he announced
CNN, Elisabeth Buchwald (2/4/25)
- EU plans countermeasures to new US tariffs, says EU chief
Reuters, Philip Blenkinsop and Benoit Van Overstraeten (3/4/25)
- Wall Street analysts anguish over ‘Liberation Day’
FT Alphaville, Robin Wigglesworth (3/4/25)
- Reciprocal tariffs: you won’t believe how they came up with the numbers
Financial Times, Alexandra Scaggs (3/4/25)
- Donald Trump baffles economists with tariff formula
Financial Times, Peter Foster and Sam Fleming (3/4/25)
- Five key takeaways from Trump’s ‘Liberation Day’ reciprocal tariffs
Aljazeera (3/4/25)
- These American companies are in big trouble from Trump tariffs
Axios, Nathan Bomey (3/4/25)
White House publications
Questions
- What is the law of comparative advantage? Does this imply that free trade is always the best alternative for countries?
- From a US perspective, what are the arguments for and against the tariffs announced by President Trump on 2 April 2025?
- What response to the tariffs is in the UK’s best interests and why?
- Should the UK align with the EU in responding to the tariffs?
- What is meant by a negative sum game? Explain whether a trade war is a negative sum game. Can a specific ‘player’ gain in a negative sum game?
- What happened to stock markets directly following President Trump’s announcement and what has happened since? Explain you findings.
 Economic growth is closely linked to investment. In the short term, there is a demand-side effect: higher investment, by increasing aggregate demand, creates a multiplier effect. GDP rises and unemployment falls. Over the longer term, higher net investment causes a supply-side effect: industrial capacity and potential output rise. This will be from both the greater quantity of capital and, if new investment incorporates superior technology, from a greater productivity of capital.
One of the biggest determinants of investment is certainty about the future: certainty allows businesses to plan investment. Uncertainty, by contrast, is likely to dampen investment. Investment is for future output and if the future is unknown, why undertake costly investment? After all, the cost of investment is generally recouped over several months or year, not immediately. Uncertainty thus increases the risks of investment.
 There is currently great uncertainty in the USA and its trading partners. The frequent changes in policy by President Trump are causing a fall in confidence and consequently a fall in investment. The past few weeks have seen large cuts in US government expenditure as his administration seeks to dismantle the current structure of government. The businesses supplying federal agencies thus face great uncertainty about future contracts. Laid-off workers will be forced to cut their spending, which will have knock-on effect on business, who will cut employment and investment as the multiplier and accelerator work through.
There are also worries that the economic chaos caused by President Trump’s frequent policy changes will cause inflation to rise. Higher inflation will prompt the Federal Reserve to raise interest rates. This, in turn, will increase the cost of borrowing for investment.
Tariff uncertainty
 Perhaps the biggest uncertainty for business concerns the imposition of tariffs. Many US businesses rely on imports of raw materials, components, equipment, etc. Imposing tariffs on imports raises business costs. But this will vary from firm to firm, depending on the proportion of their inputs that are imported. And even when the inputs are from other US companies, those companies may rely on imports and thus be forced to raise prices to their customers. And if, in retaliation, other countries impose tariffs on US goods, this will affect US exporters and discourage them from investing.
For many multinational companies, whether based in the USA or elsewhere, supply chains involve many countries. New tariffs will force them to rethink which suppliers to use and where to locate production. The resulting uncertainty can cause them to delay or cancel investments.
Uncertainty has also been caused by the frequent changes in the planned level of tariffs. With the Trump administration using tariffs as a threat to get trading partners to change policy, the threatened tariff rates have varied depending on how trading partners have responded. There has also been uncertainty on just how the tariff policy will be implemented, making it more difficult for businesses to estimate the effect on them.
Then there are serious issues for the longer term. Other countries will be less willing to sign trade deals with the USA if they will not be honoured. Countries may increasingly look to diverting trade from the USA to other countries.
Video
Articles
- Trump’s erratic trade policies are baffling businesses, threatening investment and economic growth
Associated Press, Paul Wiseman, Anne D’innocenzio and Mae Anderson (6/3/25)
- The world is beginning to tire of Trump’s whiplash leadership
CNN, Stephen Collinson (6/3/25)
- US stocks slide and Nasdaq enters correction as chaos over Trump’s tariffs intensifies
CNN, John Towfighi (6/3/25)
- Trump’s Tariffs And Trade: Uncertainty, Chaos Or Brilliance?
Forbes, Mike Patton (6/3/25)
- How Trump’s second term might affect the market and your finances
The Conversation, Art Durnev (4/3/25)
- US corporate bond investors cautiously navigate trade war uncertainty
Reuters, Matt Tracy (6/3/25)
- This week in Trumponomics: Playing chicken with markets
Yahoo Finance, Rick Newman (8/3/25)
- Measuring fear: What the VIX reveals about market uncertainty
The FRED Blog, Aakash Kalyani (13/2/25)
- Trump shrugs off stock market slump, but economic warning signs loom
The Conversation, Conor O’Kane (17/3/25)
Data
Questions
- Find out what tariffs have been proposed, imposed and changed since Donald Trump came to office on 20 January 2025.
- In what scenario might US investment be stimulated by Donald Trump’s policies?
- What countries’ economies have gained or are set to gain from Donald Trump’s policies?
- What is the USMCA agreement? Do Donald Trump’s policies break this agreement?
- Find out and explain what has happened to the US stock market since January 2025. How do share prices affect business investment?
- Which sector’s shares have risen and which have fallen?
- Using the Data link above, find out what has been happening to the US Policy Uncertainty Index since Donald Trump was elected and explain particular spikes in the index. Is this mirrored in the global Policy Uncertainty Index?
- Are changes in the Policy Uncertainty Index mirrored in the World Uncertainty Index (WUI) and the CBOE Volatility Index: VIX?