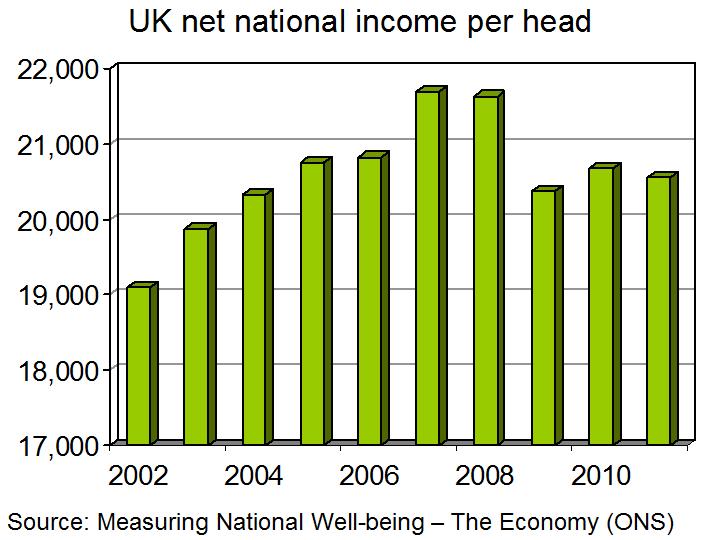
 Although every recession is different (for example in terms of length and magnitude), they do tend to have a few things in common. The focus of this blog is on consumer income and how it is affected in the aftermath of (or even during) a recession. According to data from the ONS, real national income per head has fallen by more than 13% since the start of 2008.
This latest data from the Office of National Statistics shows that in the aftermath of the 2008 recession, UK incomes have fallen by much more than they did in the 2 previous recessions experienced in the UK (click here for a PowerPoint of the chart). We would normally expect consumer incomes to fall during and possibly directly after a recession, as national output falls and confidence tends to be and remain low. However, the crucial thing to consider with falling consumer incomes is how it affects purchasing power. If my income is cut by 50%, but prices fall by 80%, then I’m actually better off in terms of my purchasing power.

The data from the ONS is all about purchasing power and shows how UK consumer incomes have fallen at the same time as inflation having been relatively high. It is the combination of these two variables that has been ‘eating into the value of the cash that people were earning’. Comparing the incomes in the four years after the 2008 recession with similar periods following the early 1980s and 1990s recession, the ONS has shown that this most recent recession had a much larger effect on consumer well-being. Part of this may be due to the rapid growth in incomes prior to the start of the credit crunch.
It’s not just the working population that has seen their incomes fall since 2008 – the retired population has also seen a decline in income and according to a report from the Institute for Fiscal Studies, it is the wealthiest portion of older households that have taken the largest hit since 2007. According to the IFS, the average person over 50 has experienced a fall in their gross wealth of about 10%, or close to £60,000. Of course for these older households, the concern is whether they will be able to make up this lost wealth before they retire. The concern for everyone is how long until incomes and purchasing power increase back to pre-crisis levels. The following articles consider this latest data on economic well-being and the impact the recession has had.
UK wellbeing still below financial crisis levels Guardian, Larry Elliott and Randeep Ramesh (23/10/12)
National income per head ‘down 13% in four years’ BBC Newsd (23/10/12)
Financial crisis hits UK retirement income Financial Times, Norma Cohen (23/10/12)
Over 50s ‘left £160,000 out of pocket by the financial crisis’ The Telegraph, James Kirkup (23/10/12)
Those near retirement in UK hit hard by crisis Wall Street Journal, Paul Hannon (23/10/12)
Living standards down 13pc since start of recession The Telegraph (23/10/12)
Questions
- Why is net national income per head said to be the best measure of economic well-being?
- Why is it so important to take into account inflation when measuring wellbeing?
- What explanation can be given for the larger fall in consumer incomes following the 2008 recession relative to the previous 2 recessions?
- According to data from the IFS, the richest portion of older households have suffered the most in terms of lost wealth. Why is this the case?
- What is meant by purchasing power?
- GDP has fallen by about 7%, whereas national income per head, taking inflation into account is down by over 13%. What is the explanation for these 2 different figures?
- How can recessions differ from each other? Think about the length, the magnitude of each.
- Is GDP a good measure of economic well-being? Are there any other ways we can measure it?
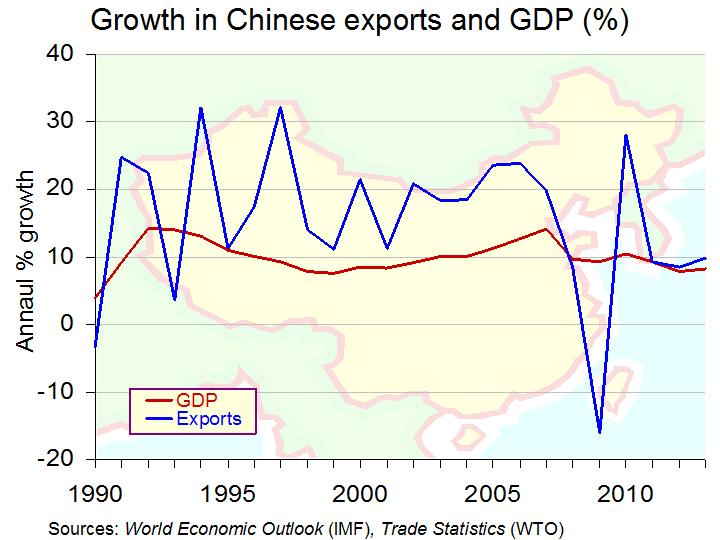 China has been one of the success stories of the past 20 years, with rapid growth in domestic and export demand. This has created the second largest economy in the world. From 1992 to 2007 annual GDP growth averaged 10.7% and annual export growth averaged 18.9% (see chart).
However, with the credit crunch and ensuing recession, growth rates in China have fallen somewhat. Annual GDP growth has averaged 9.6% and annual export growth has averaged 7.4%. Such growth rates may not seem bad, given that many Western economies have been struggling to achieve any growth, but they have been causing concern for this booming economy.
 In its May Outlook, the World Bank forecast China’s growth for the year at 8.2%, but it has since been reduced to 7.8%. A key part of China’s success story has been its export market, but it has been this market that has caused concerns for the mainland economy. In August of this year, its year-on-year export growth was at only 2.7%, but exports last month grew by more than expected, at approximately 7.4%. China has had a consistent trade surplus and according to government figures, this has widened to $27.67 billion in September from $26.66 billion in the previous month.
Recovery in this market will be crucial for the continued success of the economy, as a means of alleviating the fears of a slowdown. This higher growth of exports may be a misleading indicator, perhaps influenced by seasonal factors and thus may not be a sign of what’s to come. Indeed, many analysts have said that they are not convinced that these healthier trade figures will remain. Alistair Thornton, from IHS Global Economics said:
“It’s safe to say we are overshooting the trend here and we expect (the data) to come back in line in the months ahead.”
Citigroup economist, Ding Shaung also confirmed these sentiments:
”The trade data is a positive sign for the Chinese economy … But it remains to be seen whether import and export growth can remain at these levels.”
Part of this pessimism is due to the uncertainty surrounding the growth prospects of its biggest two trading partners – the US and the European Union. Exports to the former have remained relatively high, but exports to the European Union have suffered, falling by over 5.6%. It is likely that weaknesses in the global economy have held back China’s growth prospects in both exports and national output. The Chinese government was aiming for growth of 7.6% in 2012. Not a bad rate you may say, but when compared with growth rates for 2011 (9.3%) and 2010 (10.4%), it does represent a significant fall. The future of the Chinese economy is crucial for the recovery of the world economy, in part as it represents a big demand for imports from other countries, such as the US and Europe. The following articles consider the trade and growth prospects of the world’s second largest economy.
Chinese exports grow faster than expected in September BBC News (14/10/12)
Chinese exports grow faster than expected Financial Times, Patti Waldmeir (14/10/12)
China exports jump, but weaknesses seen ahead The Korea Herald (14/10/12)
China exports rise, hinting at a glimmer of revival New York Times, Keith Bradsher (13/10/12)
China’s trade surplus widens Wall Street Journal, William Kazer (13/10/12)
Chinese surplus widens as exports surge CNN, Paavan Mathemas (13/10/12)
 China’s economic slow-down BBC Today Programme, Linda Yueh (18/10/12)
Questions
- What is a trade surplus?
- Which factors have influenced Chinese exports and imports?
- Why is China’s growth rate such an important variable for the UK and other Western economies?
- Why has export growth in China fallen recently? Can you use the same explanation for its lower growth in national output?
- Explain why analysts remain pessimistic about the sustainability of these improved trade figures.
- Using a diagram, illustrate the effect that higher Chinese growth rates will have on GDP in a country such as the UK. Could there be a multiplier effect?
 With the winter fast approaching, consumers have already begun to stock up on warmer clothes. This has contributed towards consumer spending increasing faster in September than it has in the past 3 years. According to Visa Europe’s UK expenditure index, sales in August increased by 1.2pc, but in September they rose month-on-month by 3pc.
But whilst sales on the high-street increased, sales on-line and over the telephone declined. It seems that the recent decrease in temperature is just what the retail sector ordered, as people took to the high streets.
Furthermore, recent improvements in consumer income, together with lower inflation and rising employment have all contributed towards a growth in spending. However, as consumer confidence remains at a relatively low level, it is unlikely that the winter will bring much of a change to growth in the economy. The Chief Economist at Markit said:
However, consumer confidence remains historically low as uncertainty about the economy and job security persists, suggesting that the bounce in spending seen in the third quarter could be as good as it gets for the foreseeable future.
 Although the lower temperature has caused a boost in consumption, once people have made their ‘investment’ in warmer clothes, retail spending may once again decline. Hence the above comment by Markit, which suggests that further sustained increases in consumer spending may still be some way off.
The following few articles look at the latest data on retail spending.
UK consumer spending ‘rose in September’ BBC News (5/10/12)
Consumer spending increases by 3pc The Telegraph (5/10/12)
Consumer spending increases by 3% The Press Association (5/10/12)
UK retail sales: what the analysts say Guardian (20/9/12)
Online sales and wet weather boost John Lewis Scotsman, Peter Ranscombe (5/10/12)
Questions
- Which factors typically affect consumer spending?
- Using a diagram, illustrate the impact of this increase in consumption on national output and the price level.
- Is it possible that a multiplier effect may occur with the August and September rise in retail sales?
- Why is consumer confidence remaining low? Which components of aggregate demand does it affect?
- Explain why (a) lower inflation, (b) the colder weather and (c) rising employment have caused consumer spending to rise.
 In an attempt to kick start the UK housing industry, the government has proposed a series of measures to reduce regulations.
These include relaxing planning restrictions on building extensions to existing homes, shops and offices; relaxing current rules that all new housing developments should include affordable housing (which often makes little or no profit for the builders); an extra £280m for the FirstBuy scheme that provides loans to first-time buyers to raise money for a deposit; and a new “major infrastructure fast track” scheme, whereby developers of large commercial and residential projects currently stalled at local authority planning level can have their applications ‘fast tracked’ by the national Planning Inspectorate.
The government maintains that the measures will increase the flow of new houses coming onto the market by reducing ‘red tape’.

Critics maintain that the problem of the slump in house building has little to do with a lack of availability of new houses or new plots for building. Rather, it is a reflection of the recession in the economy as a whole. The solution, claim critics, is to stimulate the economy and then the new-build property market will recover along with other sectors.
The articles look at the likely success of these latest policy proposals for the property market.
Articles
David Cameron and Nick Clegg unveil plans to kick-start Britain’s ailing house building industry Independent, Oliver Wright (6/9/12)
Planning rules on extensions to be relaxed ‘to boost economy’ BBC News (6/9/12)
Q&A: Housing and planning shake-up BBC News (6/9/12)
Government plans are recipe for planning blight, says LGA BBC News (6/9/12)
Scepticism greets home improvements plan Financial Times, George Parker and Gill Plimmer (6/9/12)
Extensions and loft conversions could add nearly a quarter to the value of homes Independent, Alex Johnson (10/9/12)
Green groups condemn relaxation of house-building planning rules GreenWise (6/9/12)
Construction figures deal blow to government housebuilding plans Guardian, Philip Inman (4/9/12)
House builders sitting on 400,000 undeveloped plots of land with planning permission The Telegraph (5/9/12)
Weak demand hits building sector Independent, Jamie Grierson (4/9/12)
Free up green-belt land for new housing, says Policy Exchange Guardian, Nicholas Watt (13/9/12)
Relaxing Planning Laws Will Damage British Housing Huffington Post, Martin Roberts (7/9/12)
Will David Cameron’s planning reforms create jobs and growth? Guardian, Juliette Jowit (6/9/12)
Data
Economic Data freely available online (see site 30 for links to housing market data) Economics Network
Lending to individuals Bank of England
Questions
- Distinguish between supply-side and demand-side policy and the different types of each.
- How would you classify the types of policy proposals announced on freeing up the new-build property market in terms of your answer to question 1?
- What will determine the success of the policy measures in stimulating (a) the new-build property market; (b) the economy generally?
- What externalities are involved in relaxing the regulations on home extensions?
- If you were in power, how would you go about stimulating the property market? Would there be any downsides of your proposals?
 With droughts and poor harvests in both North America and in Russia and the Ukraine, there are worries that food prices are likely to see sharp rises in the coming months. This is clearly bad news for consumers, especially the poor for whom food accounts for a large proportion of expenditure.
But it’s also bad news more generally, as higher food prices are likely to have a dampening effect on the global economy, struggling to recover from five years of low or negative growth. And it’s not just food prices. Oil prices are rising again. Since mid June, they have risen by nearly 25%. This too is likely to have a dampening effect.
Another contributing factor to rising food prices is a response, in part, to rising oil prices. This is the diversion of land from growing food to growing crops for biofuels.

G20 countries held a conference call on 28 August to discuss food prices. Although representatives decided against an emergency meeting, they agreed to reassess the situation in a few weeks when the size of the US harvest would be clearer. If the situation proved as bad as feared, then the G20 would call an emergency meeting of the Rapid Response Forum, to consider what could be done.
But is the sole cause of rising food prices a lack of production? Are there other problems on the supply side, such as poor distribution systems and waste? And what about the role of demand? How is this contributing to long-term increases in food prices? The articles consider these various factors and what can be done to dampen food prices.
Articles
G20 points to ‘worrying’ food prices Financial Times, Javier Blas (28/8/12)
US food prices to surge on drought Gulf News(30/8/12)
Best to get used to high food and energy prices – they’re here to stay The Telegraph, Jeremy Warner (29/8/12)
Feeling a drought The Economist (14/8/12)
Q&A: World food and fuel prices BBC News (14/8/12)
G20 considers global meeting as food prices rise BBC News (28/8/12)
Biofuels and Food Prices (direct link) BBC ‘In the Balance’ programme (25/8/12)
U.N. body urges G20 action on food prices, waste Reuters, Patrick Lannin (27/8/12)
Ethanol industry hits back over food price claims EurActiv (28/8/12)
The era of cheap food may be over Guardian, Larry Elliott (2/9/12)
Data
Food Price Index Index Mundi
Questions
- Why have food prices been rising in recent weeks?
- Use a demand and supply diagram to demonstrate what has been happening to food prices.
- What determines the price elasticity of demand for wheat? What might this elasticity vary over time?
- What is the role of speculation in determining food prices?
- Illustrate on an aggregate demand and supply diagram the effect of a commodity price shock. What is likely to be the policy response from central banks?
- What determines the price elasticity of supply of food in (a) the short term and (b) the long term?
- What determines the cross price elasticity of supply of food to the price of oil? Is the cross price elasticity of supply positive or negative?
- What can governments do to reduce food prices, or at least reduce food price inflation?
- What benefits may come from higher food and fuel prices over the longer term?