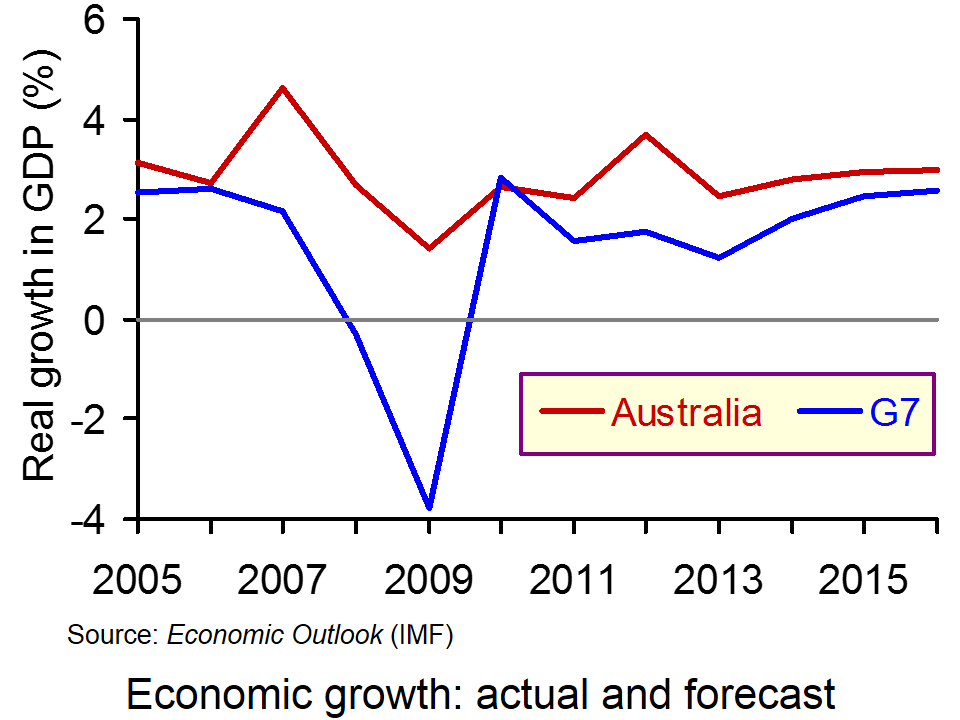
When the rest of the developed world went into recession after the financial crisis of 2007/8, the Australian economy kept growing, albeit at a slightly lower rate (see chart 1: click here for a PowerPoint). Then as the world economy began to grow again after 2009, Australian grow accelerated. Partly this was the result of a strong growth in demand for Australian mineral exports, such as coal, iron ore and bauxite, especially from China and other east Asian countries.
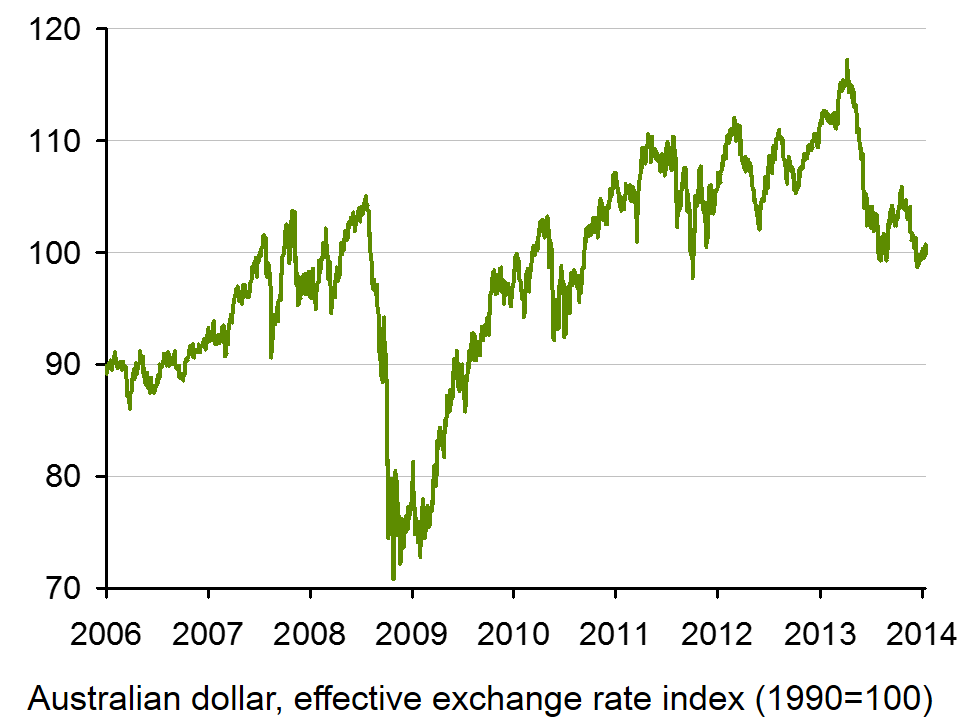
But in 2013, Australian growth slowed and jobs grew by their lowest rate for 17 years. Employment actually fell by 22,600 in December and unemployment was only prevented from rising by a fall in the participation rate. The Australian dollar, which has been depreciating in recent months, fell further on the news about jobs, reaching its lowest level for over two years (see chart 2: click here for a PowerPoint).
Chart 1 Chart 2
The following articles look at the reasons behind Australia’s slowing growth and at possible reactions of the Australian government and the Reserve Bank of Australia (Australia’s central bank). They also look at the link between economic performance and policy on the one hand and the exchange rate on the other.
Why has the Australian dollar been depreciating in recent months?
Why did the Australian dollar fall further on the news that economic growth had slowed and employment had fallen?
Find out what has been happening to commodity prices in the past three years (see Economic Data freely available online and especially site 26) How has this affected (a) the current account of Australia’s balance of payments; (b) the exchange rate of the Australian dollar?
If commodity prices are in US dollars, how is a depreciation of the Australian dollar likely to affect Australia’s balance of payments?
How are possible fiscal and monetary responses in Australia likely to affect the exchange rate of the Australian dollar?
What determines the magnitude of the rise or fall in demand for Australian exports as the world economy grows or declines? How are the determinants of the price and income elasticities of demand for Australian exports relevant to your answer?
The price of road fuel is falling. Petrol and diesel prices in the UK are now at their lowest level since February 2011. The average pump price for a litre of unleaded petrol has fallen to 130.44p in November – down nearly 8p per litre since September.
According to the AA, the reduction in price equates to a fall in the average monthly expenditure on petrol of a two-car family of £14.49 – down from £252.54 to £238.05. This saving can be used for spending on other things and can thus help to boost real aggregate demand. The fall in price has also helped to reduce inflation.
But will lower fuel prices lead to a rise in fuel consumption? In other words, will some of the savings people make when filling up be used for extra journeys? If so, how much extra will people consume? This, of course depends on the price elasticity of demand.
The following articles explain why the price of road fuel has fallen and look at its consequences.
Illustrate the fall in price of road fuel on a demand and supply diagram.
How does the size of the fall in price depend on the price elasticity of demand for road fuel?
If a fall in price results in a fall in expenditure on road fuel, what does this tell us about the price elasticity of demand?
Why may the price elasticity of demand for road fuel be more elastic in the long run than in the short run?
If a motorist decides to spend a fixed amount of money each week on petrol, irrespective of the price, what is that person’s price elasticity of demand?
Using the links to data above, find out what happened to the dollar price of sterling and the Brent crude oil price between September and November 2013.
How do changes in the exchange rate of the dollar to the pound influence the price of road fuel?
If the price of oil fell by x per cent, would you expect the price of road fuel to fall by more or less than x per cent? Explain.
Why do petrol prices vary significantly from one location to another?
Compared with pre-financial crisis levels, the British pound is significantly weaker when measured against a basket of foreign currencies. In this blog we provide a further update of Appreciating a depreciating pound which was published back in early December 2012. The significance of the depreciation should be seen in the context of the UK as an open, island-economy where the ratio of exports to GDP in 2012 was close to 32%.
The competitiveness of our exports is, in part, affected by the exchange rate. Floating exchange rates are notoriously volatile. For example, some of the articles below show how sensitive the British pound can be latest news on the economy. However, since the autumn of 2007 we have observed a significant depreciation of the UK exchange rate. A depreciation helps to make our exports more competitive abroad and can potentially boost aggregate demand.
Rather than simply focus on bilateral exchange rates and so at the British pound separately against other foreign currencies, we can estimate an average exchange rate against a whole bundle of currencies. The average rate is calculated by weighting the individual exchange rates by the amount of trade between Britain and the other countries. This trade-weighted exchange rate is known as the effective exchange rate.
In analysing the competitiveness of the exchange rate, we can go one step further and adjust for the average (domestic currency) price of our exports relative to the average (foreign currency) price of those goods we import. Therefore, as well as the nominal (actual) effective exchange rate we can calculate a real effective exchange rate. If the average price of our exports rises relative to the average price of imports, the real effective exchange rate rises relative to the nominal rate. It means that we are able to obtain a larger volume of imports from selling a given volume of exports.
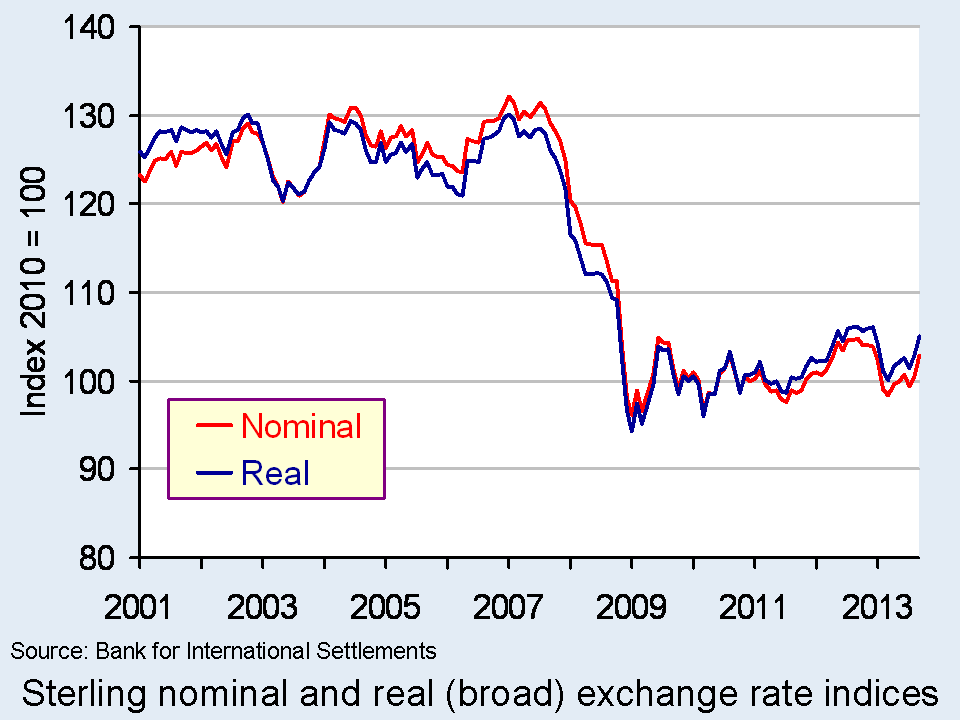
The chart shows the nominal (actual) and real effective exchange rate for the British pound since 2001. The chart shows clearly how from the autumn of 2007 the effective exchange rate fell sharply both in nominal and real terms.
Over the period from July 2007 to January 2009 the nominal effective exchange rate fell by 26.8 per cent while the real effective exchange rate fell by 26.6 per cent. In other words, the British pound depreciated more than one-quarter over an 18-month period. In comparison, the American dollar rose by 5.3 per cent in nominal terms and by 1.9 per cent in real terms. (Click here to download a PowerPoint of the chart.)
If we move the clock forward, we observe an appreciation of the British pound between July 2011 and September 2012. Over this period, the British pound appreciated by 7.0 per cent in nominal terms and by 7.3 per cent in real terms. However, this appreciation had effectively been wiped-out when by March 2013 the nominal rate had depreciated by 6.1 per cent and by 5.6 per cent in real terms. Subsequently, there has been a slight appreciation once more. As of September, the nominal rate had risen by 4.5 per cent and the real rate by 4.8 per cent.
While, as recent figures help to demonstrate, the British pound continues on its roller-coaster ride, there has been a very marked depreciation since the giddy-days prior to the financial crisis. The facts show that when comparing the effective exchange rate in September 2013 with July 2007 the British pound was 21.8 per cent lower in nominal terms and 18.3 per cent in real terms. Over the same period, the US dollar, for example, was only 1.3 per cent lower in nominal terms and 6.1 per cent in real terms. This constitutes a major competitive boost for our exporters. Nonetheless, there remain uncertainty about just how much British exporters can take advantage of this, the amount that it will boost British growth and the impact it will make on the country’s chronic balance of trade deficit in goods which was close to 7 per cent of GDP in 2012.
Explain how the foreign demand for goods and assets generates a demand for British pounds. How will this demand be affected by the foreign currency price of the British pound, i.e. the number of foreign currency units per £1?
Explain how the demand by British residents for foreign goods and assets generates a supply of British pounds. How will this supply be affected by the foreign currency price of the British pound, i.e. the number of foreign currency units per £1?
What factors are likely to shift the demand and supply curves for British pounds on the foreign exchange markets?
Illustrate the effect of a decrease in the demand for British goods and assets on the exchange rate (i.e. the foreign currency price of the British pound) using a demand-supply diagram.
What is the difference between a nominal and a real effective exchange rate? Which of these is a better indicator of the competitiveness of our country’s exports?
What factors are likely to have caused the depreciation of the British pound since 2007?
What is meant by a deficit on the balance of trade in goods?
What relationship exists between the demand and supply of currencies on the foreign exchange markets and the balance of payments?
In an interview with the Yorkshire Post, Mark Carney, Governor of the Bank of England, said that under current circumstances he did not feel that further quantitative easing was justified. He said:
My personal view is, given the recovery has strengthened and broadened, I don’t see a case for quantitative easing and I have not supported it.
In response to his speech, the pound strengthened against the dollar. It appreciated by just over 1 cent, or 0.7%. But why should the likelihood of no further quantitative easing lead to a strengthening of the pound?
The answer lies with people’s anticipation of future interest rates. If there is no further increase in money supply through QE, interest rates are likely to rise as the economy recovers and thus the demand for money rises. A rise in interest rates, in turn, is likely to lead to an inflow of finance into the country, thereby boosting the financial account of the balance of payments. The increased demand for sterling will tend to drive up the exchange rate.
However, an increase in aggregate demand will result in an increase in imports and a likely increase in the balance of trade deficit. Indeed, in July (the latest figures available) the balance of trade deficit rose to £3.085bn from £1.256bn in June. As recovery continues, the balance of trade deficit is likely to deteriorate further. Other things being equal, this would lead to a depreciation of the pound.
So if the pound appreciates, this suggests that the effect on the financial account is bigger than the effect on the current account – or is anticipated to be so. In fact, given the huge volumes of short-term capital that move across the foreign exchanges each day, financial account effects of interest rate changes – actual or anticipated – generally outweigh current account effects.
Explain how quantitative easing affects exchange rates.
What is happening concerning quantitative easing in the USA? How is this likely to affect the exchange rate of the US dollar to sterling; other currencies to sterling?
Why may an increase in the balance of trade deficit lead directly to an appreciation of the exchange rate?
Why is an anticipation of a policy change likely to have more of an effect on exchange rates than the actual policy change itself? Why, indeed, may a policy change have the reverse effect once it is implemented?
Under what circumstances may speculation against exchange rate changes be (a) stabilising; (b) destabilising?
How is quantitative easing (or an anticipation of it) likely to affect each of the main components of the current and financial accounts of the balance of payments?
For what reasons might sterling have been ‘overbought’ and hence be overvalued?
What is meant by the real exchange rate (REER)? Why may reference to the REER suggest that sterling is not currently overvalued?
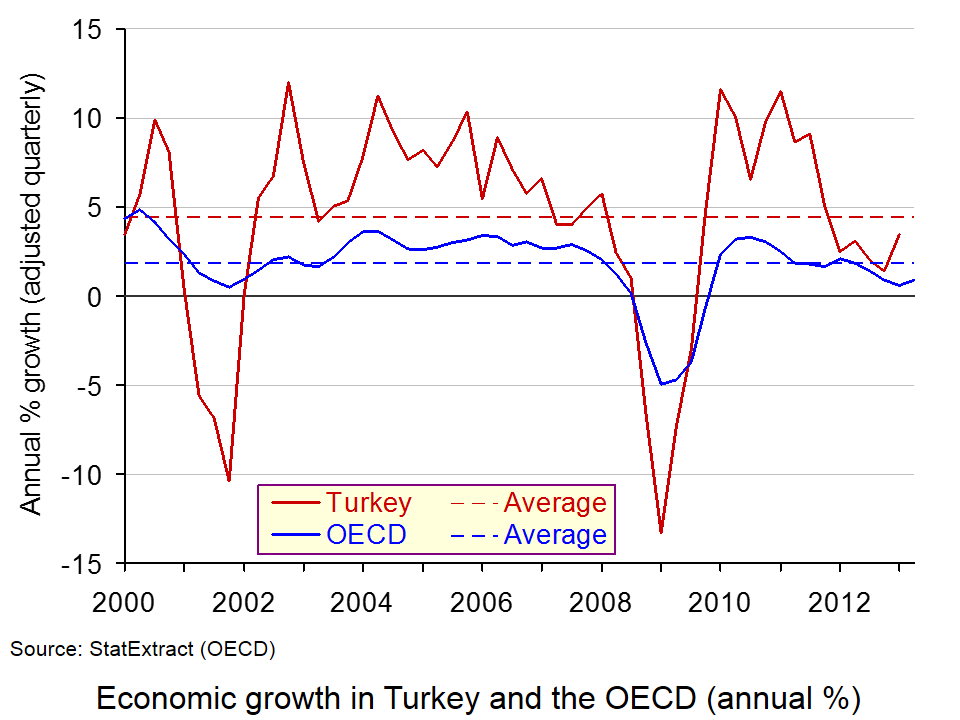
Turkey has experienced rapid economic growth in recent years and has attracted large inflows of foreign capital. The chart below illustrates how growth in real GDP in Turkey in most years since 2000 has considerably exceeded that in the OECD as a whole (click here for a PowerPoint). As you can see from the chart, growth in Turkey over the period has averaged 4.5%, while that in the OECD has averaged just 1.8%.
Indeed, Turkish growth has been compared with that of the BRICs (Brazil, Russia, India and China). However, like the BRICs, Turkey has been experiencing slowing growth in the past few months. Indeed, the slowdown has been especially marked in Turkey.
In recent years Turkey has benefited from large inflows of foreign capital. Partly these were direct investment flows, encouraged by a large and rapidly growing internal market, boosted by a rapid expansion of consumer credit, and also by a growing export sector. But to a large extent, especially in recent years, there has been a large rise in portfolio and other investment inflows. This has been encouraged by a large increase in global money supply resulting from policies of quantitative easing in the USA and other developed countries.
But the economic climate has changed. First investors have become worried about the conflict in Syria escalating and this impacting on Turkey. Second Turkey’s large financial account surpluses have allowed it to run large current account deficits and have maintained a high exchange rate. Third the tapering off and possible reversal of quantitative easing have led to recent outflows of finance from various countries perceived as being vulnerable, including Turkey.
The effect of this has been a depreciation of the Turkish lira and upward pressure on inflation. The lira has fallen by 14% since the beginning of 2013 and by nearly 7% since the beginning of August alone.
The question is whether the supply side of the Turkish economy has become robust enough to allow the country to ride out its current difficulties. Will foreign investors have sufficient faith in the long-term potential of the Turkish economy to continue with direct investment, even if short-term financial inflows diminish?
Why has the Turkish economy experienced such rapid growth in recent years and especially from 2010 to 2012?
Why has Turkish growth slowed over the past year?
Why has “Western financial prescription made Turkey ill”
Why has the Turkish lira depreciated? What has determined the size of this depreciation?
What are the beneficial and adverse effects of this depreciation?
Why must any surplus on the combined financial and capital accounts of the balance of payments be matched by a corresponding deficit on the current account?
How is a tapering off of quantitative easing likely to impact on developing countries? What will determine the size of this impact?
Istanbul has lost its bid to host the 2020 Olympic Games? How is this likely to affect the Turkish economy?
 When the rest of the developed world went into recession after the financial crisis of 2007/8, the Australian economy kept growing, albeit at a slightly lower rate (see chart 1: click here for a PowerPoint). Then as the world economy began to grow again after 2009, Australian grow accelerated. Partly this was the result of a strong growth in demand for Australian mineral exports, such as coal, iron ore and bauxite, especially from China and other east Asian countries.