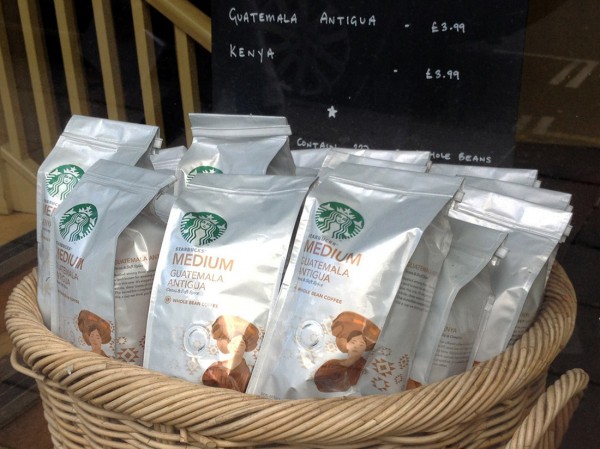
 Coffee prices have been falling on international commodity markets. In August, the International Coffee Organization’s ‘composite indicator price’ fell to its lowest level since September 2009 (see). This reflects changes in demand and supply. According to the ICO’s monthly Coffee Market Report for August 2013 (see):
“Total exports in July 2013 reached 9.1 million bags, 6.6% less than July 2012, but total exports for the first ten months of the coffee year are still up 3.6% at 94.5 million bags. In terms of coffee consumption, an increase of 2.1% is estimated in calendar year 2012 to around 142 million bags, compared to 139.1 million bags in 2011.”
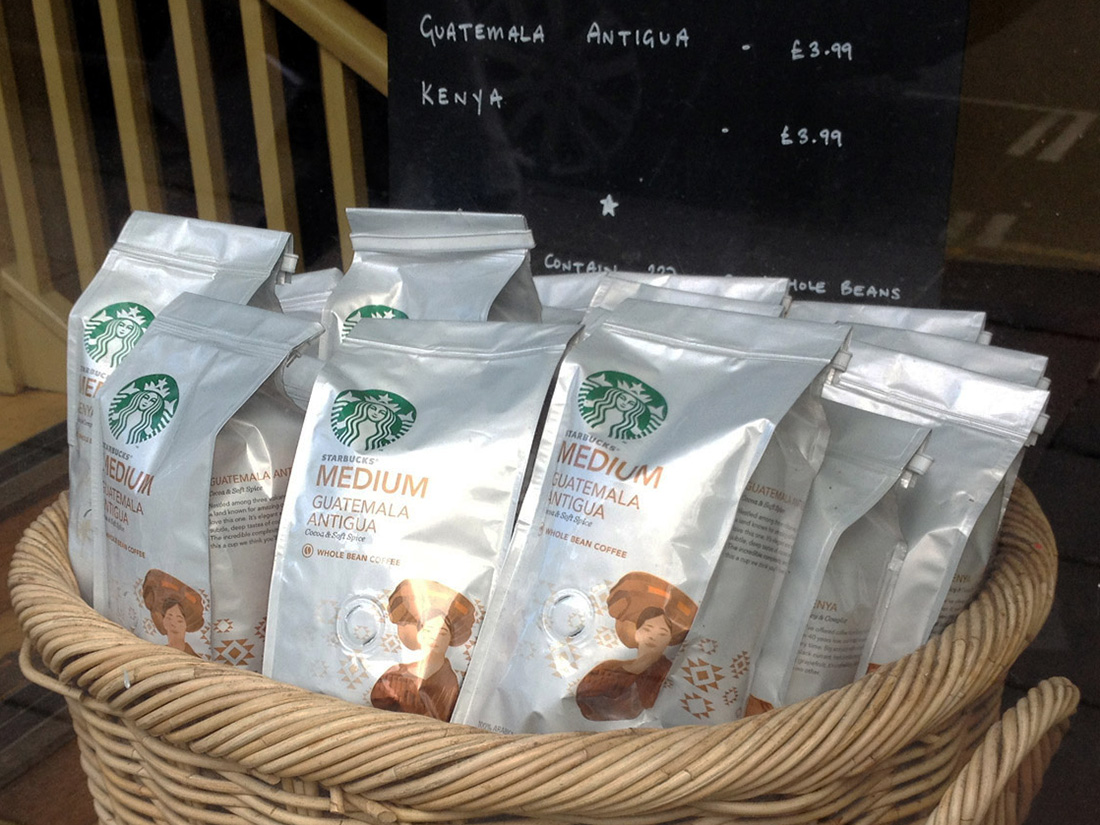
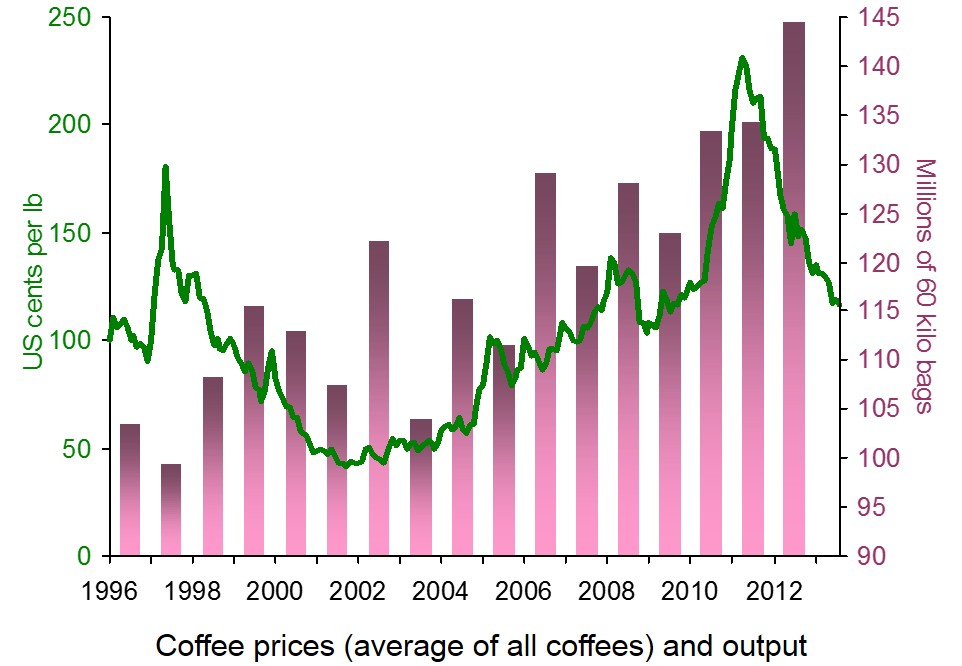 But despite the fall in wholesale coffee prices, the price of a coffee in your local coffee shop, or of a jar of coffee in the supermarket, has not been falling. Is this what you would expect, given the structure of the industry? Is it simply a blatant case of the abuse of market power of individual companies, such as Starbucks, or even of oligopolistic collusion? Or are more subtle things going on?
The following articles look at recent trends in coffee prices at both the wholesale and retail level.
Articles
Coffee Prices Continue Decline Equities.com, Joel Anderson (17/9/13)
Arabica coffee falls Business Recorder (19/9/13)
Brazil Launches Measures to Boost Coffee Prices N. J. Douek, Jeffrey Lewis (7/9/13)
 Coffee Prices Destroyed Bloomberg (4/9/13)
The surprising reality behind your daily coffee: The CUP costs twice as much as the beans that are flown in from South America Mail Online, Mario Ledwith (23/9/13)
Coffeenomics: Four Reasons Why You Can’t Get a Discount Latte Bloomberg Businessweek, Kyle Stock (19/9/13)
Here’s who benefits from falling coffee costs CNBC, Alex Rosenberg (9/9/13)
The great coffee rip-off is no myth Sydney Morning Herald, BusnessDay, Michael Pascoe (23/9/13)
Monthly Coffee Market Report International Coffee Organization (August 2013)
Data
Coffee Prices ICO
ICO Indicator Prices – Annual and Monthly Averages: 1998 to 2013 ICO
Coffee, Other Mild Arabicas Monthly Price – US cents per Pound Index Mundi
Coffee, Robusta Monthly Price – US cents per Pound Index Mundi
Questions
- Why have wholesale coffee prices fallen so much since 2011? Are the reasons on the demand side, the supply side or both? Illustrate your answer with a supply and demand diagram.
- What determines the price elasticity of demand for coffee (a) on international coffee markets; (b) in supermarkets; (c) in coffee shops?
- Why has the gap between Arabica and Robusta coffee prices narrowed in recent months?
- Identify the reasons why coffee prices have not fallen in coffee shops.
- The cost of the coffee beans accounts for around 4% of the cost of a cup of coffee in a coffee shop. If coffee beans were to double in price and other costs and profits were to remain constant, by what percentage would a cup of coffee rise?
- How would you set about establishing whether oligopolistic collusion was taking place between coffee shops?
- What is meant by ‘hedging’ in coffee markets? How does hedging affect wholesale coffee prices?
- Explain the statement “If they have hedged correctly, Starbucks and such competitors as Green Mountain Coffee Roasters (GMCR) are likely paying far more for beans right now than current market rates.”
- What are “buffer stocks”. How can governments use buffer stocks (e.g. of coffee beans) to stabilise prices? What is the limitation on their power to do so? Can buffer stocks support higher prices over the long term?
- What are “coffee futures”? What determines their price? What effect will coffee future prices have on (a) the current price of coffee; (b) the actual price of coffee in the future?
 Imagine that the team you support has made the final of a major competition or a your favourite band is playing a live concert this summer. You desperately want a ticket and are willing to pay the advertised price. They go on sale at 9.00am in the morning and you go on-line at 8.59am but unfortunately the webpage will not load. You keep pressing the refresh button but with no success. Eventually, annoyed and frustrated, you give up at 10.00am!
Tickets for sporting, musical or other live shows are initially sold by people who organise the events in two ways. They may choose to sell some or all of the tickets directly to the customer. For example you can buy tickets for a West End show from the box office in the theatre. With some football games it is still possible to buy tickets on the day at the stadium. Another approach is to sell some or all of the tickets via an authorised ticket agent. These businesses are usually members of STAR (The Society of Ticket Agents and Retailers) and the organisers of the sporting, musical or live show provide them with tickets to sell on their behalf. Some of the larger and well known agents such as Ticketmaster, Ticketline and Seetickets usually sell the tickets at face value although some booking fees are often added to the price. This initial sale of tickets by either the event organiser themselves or an agent acting on their behalf is referred to as the primary market.
For example, British Athletics sold all of its 130,000 tickets for its two day Anniversary Games on the 26th and 27th July via its authorised ticket agent in 75 minutes!! However an internet search for this event will quickly reveal that tickets are still available!! Unfortunately in most cases the advertised price will be far greater than the face value of the ticket. How is this possible? The answer is that the internet has helped a thriving secondary market for tickets to develop. The secondary market refers to situations where people who have already purchased tickets through the primary market re-sell them to other members of the public. Prior to the internet the main way of buying a ticket in the secondary market was to visit the venue on the day of the event and hunt for some-one willing to sell. However technology has dramatically reduced these transaction costs and made it much easier for potential buyers and sellers to make an exchange. For example companies such as Viagogo, Seatwave, GetMeIn and Stubhub have created websites that allow members of the public to buy and sell tickets. As Viagogo publish on their webpage:
You are buying tickets from a third party, Viagogo is not the ticket seller. Ticket prices are set by the seller and may be above or below face value.
Why does this secondary market exist? An economist would argue that it can only happen if the quantity of tickets demanded is greater than the quantity of tickets for sale at the price set by the event organiser. If this was not the case then customers would be able to buy tickets through the primary market on the day of the match, concert or show. The puzzle is to explain why prices do not rise in the primary market. If the quantity demanded of any product is greater than the quantity supplied then market forces should put upward pressure on prices. However it would appear that many of the event organisers appear to resist this incentive and consistently set prices below the level that would limit demand to the number of tickets available. This leaves an opportunity for sellers in the secondary market to sell tickets much closer to their market clearing rate. Navin Kekane, the business operations director of Stubhub, stated that
What we do is all about supply and demand, and you can sometimes find tickets at below face value.
Some of these companies in the secondary market have recently established formal partnerships with a number of English Premier League (EPL) football clubs and other major sporting bodies. For example Viagogo have signed deals with 10 EPL clubs while Stubhub have deals with 3 EPL clubs as well as Leicester Tigers and the Lawn Tennis Association.
However some observers have expressed grave reservations about the growth of the secondary market. For example Malcolm Clarke, chairman of the Football Supporters Federation, stated that
At the moment if you are fan trying to sell a spare ticket and are not authorised to do so then you face a criminal conviction, even if you sell at the face value.
But secondary ticketing exchanges, because they are authorised, are allowed to do so. Many clubs grant these agencies the right to allow the re-sale of tickets for their matches at above face value. I don’t think that can be right.
Joe Cohen, the founder of Seatwave counters that
Touts is an emotional, dehumanising word. The reality is that they are just speculators. No one likes speculators until you need something from them.
Some have called for more regulation of the secondary market. For example Sharon Hodgson, Labour MP for Washington and Sunderland West, unsuccessfully tried to get a Private Members Bill through Parliament which would have made it illegal to re-sell tickets for more than 10% above their face value.
Articles
Questions
- Give some potential advantages for a football club or sporting body of using an authorised ticket agent to sell tickets in the primary market.
- Using a demand and supply diagram explain what happens in a market if the price is continually set below its market clearing rate. Illustrate and explain how mutually beneficial trade can take place in the secondary market at prices above those in the primary market.
- Can you explain why it is less likely for a secondary market to exist for cinema tickets than a popular West End show?
- Can you think of any reasons why it might be in the interests of a profit maximising organiser of a sporting or music event to sell tickets below the market clearing rate.
- What non-price methods could be used to allocate tickets for popular events? Consider some of the advantages/disadvantages of using these non-price methods.
- Do you think it is in the interests of society to allow people to re-sell tickets at a price above their face value?
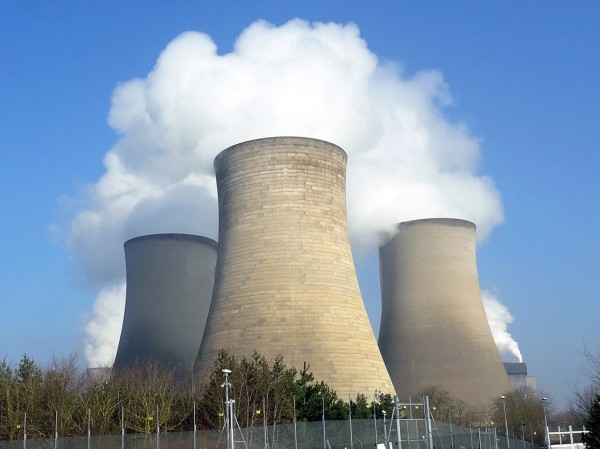 The UK economy faces a growing problem of energy supplies as energy demand continues to rise and as old power stations come to the end of their lives. In fact some 10% of the UK’s electricity generation capacity will be shut down this month.
Energy prices have risen substantially over the past few years and are set to rise further. Partly this is the result of rising global gas prices.
In 2012, the response to soaring gas prices was to cut gas’s share of generation from 39.9% per cent to 27.5%. Coal’s share of generation increased from 29.5% to 39.3%, its highest share since 1996 (see The Department of Energy and Climate Change’s Energy trends section 5: electricity). But with old coal-fired power stations closing down and with the need to produce a greater proportion of energy from renewables, this trend cannot continue.
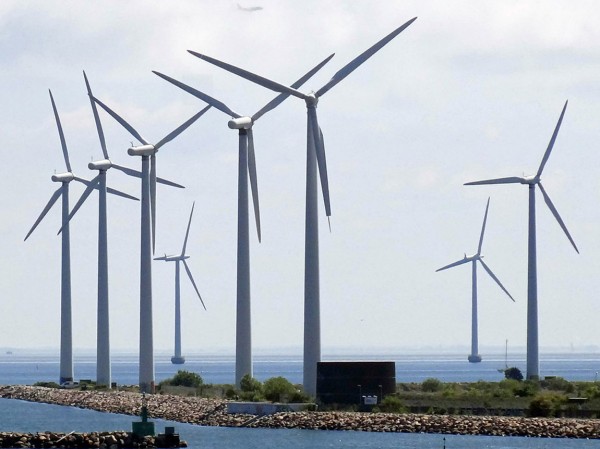 But new renewable sources, such as wind and solar, take a time to construct. New nuclear takes much longer (see the News Item, Going nuclear). And electricity from these low-carbon sources, after taking construction costs into account, is much more expensive to produce than electricity from coal-fired power stations.
So how will the change in balance between demand and supply affect prices and the security of supply in the coming years. Will we all have to get used to paying much more for electricity? Do we increasingly run the risk of the lights going out? The following video explores these issues.
Webcast
UK may face power shortages as 10% of energy supply is shut down BBC News, Joe Lynam (4/4/13)
Data
Electricity Statistics Department of Energy & Climate Change
Quarterly energy prices Department of Energy & Climate Change
Questions
- What factors have led to a rise in electricity prices over the past few years? Distinguish between demand-side and supply-side factors and illustrate your arguments with a diagram.
- Are there likely to be power cuts in the coming years as a result of demand exceeding supply?
- What determines the price elasticity of demand for electricity?
- What measures can governments adopt to influence the demand for electricity? Will these affect the position and/or slope of the demand curve?
- Why have electricity prices fallen in the USA? Could the UK experience falling electricity prices for similar reasons in a few years’ time?
- In what ways could the government take into account the externalities from power generation and consumption in its policies towards the energy sector?
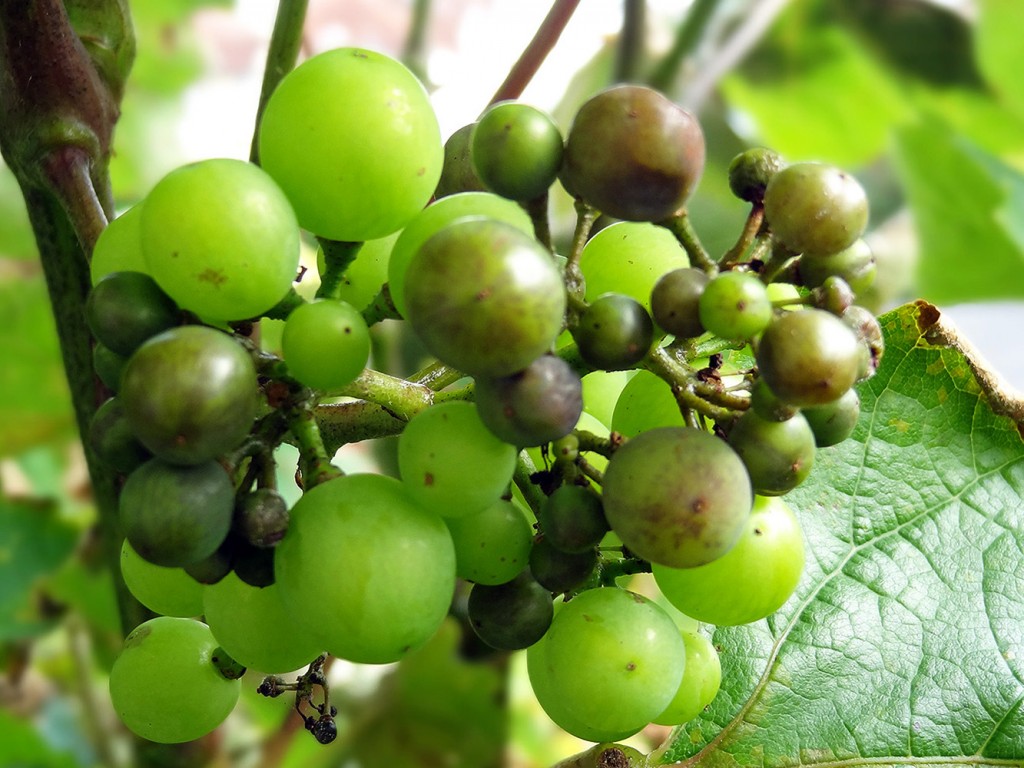 European wine producers have seen one of the worst grape harvests for decades. With exceptionally wet weather in the northern European growing areas and exceptionally hot and dry weather in the southern ones, yields are well down in most countries.
In France, the world’s largest wine producer, wine production is forecast to be 19% down on the previous year. In Italy and Spain, Europe’s second and third largest producers, production is forecast to be 3% and 6% down respectively. Production in the EU as a whole, which produces some 57% of world output, is expected to be 9% down and at a historically low level. What is more, the past five years in the EU have all seen modest harvests.
And the poor harvests are not confined to Europe. Argentina’s production is some 24% down on 2011, with New Zealand’s 17% down. And despite a few countries expecting an increase, including the USA and Chile, overall world production is expected to be 6% down on 2011 and more than 7% down on the average for 2008–11.

So is this good news or bad? At first sight it would seem to be bad, especially for the countries with large falls in output. It would also seem to be bad news for the consumer, with prices set to rise.
But for some it’s good news. If prices rise, then producers experiencing an increase in output will have a double gain. And a fall in output is only part of the story. For some producers, the smaller yield has been accompanied by an increase in quality. And then there’s the question of stocks. For several years, global production of wine has exceeded consumption. Indeed the gap widened after the financial crisis and recession of 2007–9 as consumption of wine fell. This year’s poor global harvest should help to slow down the increase in stocks or may even lead to a reduction in stocks, depending on the extent to which demand recovers.
Articles
World Wine Output to Fall to 37-Year Low, Depleting Stocks BloombergBusinessweek, Rudy Ruitenberg (30/10/12)
World wine drought after weather ruins harvests The Telegraph, John-Paul Ford Rojas (31/10/12)
Wine Experts: Drought, Cold Bring Worst Harvest in 50 Years Skye (30/10/12)
Wine experts: worst grape harvest in half century Washington Examiner (17/10/12)
Small 2012 harvest sparks supply fears thedrinksbusiness.com, Gabriel Savage (30/10/12)
Wine shortage to follow poor 2012 grape harvest BBC News (31/10/12)
Hot summer cools business prospects for Madrid vintners BBC News, Jaime Gonzales (24/9/12)
World awash in wine, so Europe’s poor grape harvest won’t hit Edmonton goblets just yet Edmonton Journal, Dan Barnes (17/10/12)
Data
Wine in figures Wines from Spain
2012 global economic vitiviniculture data Wines from Spain (Note that the countries in Table 1 have been entered in the wrong order.)
Questions
- Illustrate the effect of the global wine harvest on a demand and supply diagram.
- Will a fall in grape production of x per cent lead to a rise in the price of wine of more or less than x percent? How is the price elasticity of demand relevant to your answer?
- What elements are there in the supply chain from planting vines to consuming wine?
- How does the holding of stocks affect (a) the profitability of wine production; (b) the price volatility of wine?
- The Greek grape harvest is predicted to be higher in 2012 than in 2011. How will this affect the prices of Greek wines in (a) Greece; (b) outside Greece?
- How is the fallacy of composition relevant in assessing the benefits to owners of vineyards of a good grape harvest?
 Induced hydraulic fracturing or “fracking”, is a technique used to make fractures in shale beds, normally deep underground, through the injection of liquids under high pressure. The idea is to release oil or gas. Fracking has transformed the oil industry by allowing vast reserves to be tapped.
Although the main ingredient of the fracking liquid is water, it is also necessary to include sand and a gelling agent to increase the viscosity of the liquid and bind in the sand. The commonest gelling agent is guar gum, a gel made from powdered guar seeds, which are grown in the semi-desert regions of India and Pakistan. Guar gum is also widely used in the food industry as a binding, thickening, texturising and moisture control agent.

With the rapid growth in fracking, especially in the USA, the demand for guar gum has rocketed – and so has its price. In just one year the price of guar beans, from which the seeds are extracted, has risen ten fold from about 30 rupees (about 34 pence) to around 300 rupees per kilo. This has transformed the lives of many poor farmers. Across the desert belt of north-west India, fields are being planted with guar.

But will it last? What will the oil and gas extraction companies do in response to the higher price? What will the food industry do? What will happen to the demand and supply of guar gum over the longer term? Is it risky for farmers in India and Pakistan to rely on a single crop, or should they take advantage of the high prices while they last? These types of questions are central to many mono-crop economies.
Webcast
The little green bean in big fracking demand CNN, Mallika Kapur (10/9/12)
Articles
Frackers in frantic search for guar bean substitutes Reuters, Braden Reddall (13/8/12)
After first-half surge, US drillers find respite in guar wars Reuters (20/7/12)
Guar Gum Exports From India to Drop on Halliburton Stocks BloombergBusinessweek, Prabhudatta Mishra (3/9/12)
Frackers Seek Guar Bean Substitutes The Ithaca Independent, Ed Sutherland (13/8/12)
Synthetic Fracking Ingredient to Replace Guar Bean Greener Ideas, Madison E. Rowe (15/8/12)
From emu farms to guar crops: Why the desert is fertile for Ponzi schemes The Economic Times of India, Vikram Doctor (10/9/12)
Guar gum replacer cuts cost by up to 40% Food Manufacture, Lorraine Mullaney (4/9/12)
Less Guar Needed: TIC Gums Introduces Ticaloid Lite Powder TIC Gums (27/8/12)
Immediate Supply of Guar Gum Available in the US PRLog (1/9/12)
Questions
- Why have guar bean, powder and gum prices risen so rapidly? Use a demand and supply diagram to illustrate your answer.
- How is the price elasticity of supply of guar likely to differ between the short term and the long term? What will be the implications of this for guar prices and the livelihood of guar growers?
- How is the price elasticity of demand for guar likely to differ between the short term and the long term? What will be the implications of this for guar prices and the livelihood of guar growers?
- What would you advise guar growers to do and why?
- What is the role of speculation in determining the price of guar?
- What is a ‘ponzi scheme’? Why is the ‘desert so fertile for ponzi schemes’? (Note that the symbol for a rupee is Rs or ₹, that 100,000 rupees are referred to as 1 Lakh and that 100 Lakh are referred to as 1 Crore.)
 Coffee prices have been falling on international commodity markets. In August, the International Coffee Organization’s ‘composite indicator price’ fell to its lowest level since September 2009 (see). This reflects changes in demand and supply. According to the ICO’s monthly Coffee Market Report for August 2013 (see):