 The rate of inflation in the UK is measured using the Consumer Prices Index (CPI). This is made up of a basket of goods and the ONS updates this ‘basket’ each year to ensure it is representative of what the average UK household buys. The basket contains 703 items, with 110,000 individual prices collected each month.
In past years, items such as lip gloss have been added to the basket of goods, together with tablet computers and teenage fiction. In the recent update by the ONS, e-cigarettes have been added, together with specialist ‘craft’ beers and music streaming. On the other hand, other items have been removed, as the world changes. For example, during the recession, champagne was removed as an item that the representative household was no longer buying. In other cases, items are removed as they become outdated or obsolete with technology changing. This is the case with satellite navigation systems. As people turn to using their smartphones to navigate their way from A to B, satellite navigation systems are no longer seen as an item bought by the representative household.
The UK inflation rate is at an all-time low of 0.3% and there have been concerns that it may become negative, meaning we enter the world of deflation. However, if this does occur, many suggest that it is not bad deflation, as it is being driven by the extremely low oil prices. No matter what the inflation rate, the ONS will always continue to update the basket of goods that calculates inflation. It is therefore essential that these changes are made each year, as consumer buying habits do fluctuate considerably, as income changes, technology changes and general tastes change. The following articles consider what’s in and what’s out.
From craft beer to e-cigarettes, inflation basket reflects Britain’s changing shopping habits The Guardian, Katie Allen (17/3/15)
Inflation-measuring basket of goods adds protein powder, e-cigarettes The Grocer, Andrew Don (17/3/15)
E-cigareets and craft beers in updated inflation basket BBC News (17/3/15)
E-cigs added to inflation basket Mail Online (17/3/15)
Craft beer, e-cigarettes and protein shakes dded to price basket used to calculate inflation Independent, Hazel Sheffield (17/3/15)
U.K. hipsters and gym junkies win approval in new price basket Bloomberg, Tom Beardsworth (17/3/15)
Spotify in and sat navs out: take a look at the new inflation basket The Telegraph, Szu Ping Chan (17/3/15)
E-cigarettes, craft beer and Spotify enter UK inflation basket Reuters, Toby Melville (17/3/15)
Craft beer and e-cigarettes added to CPI basket Financial Times (17/3/15)
Questions
- What is the difference between the CPI and RPI? Which is usually higher? Explain your answer.
- Explain why champagne was removed from the basket of goods during the recession. What is sensible?
- How is the CPI calculated and hence how is inflation measured?
- Why has there been a movement towards chilled pizzas and away from frozen pizzas? Is the change likely to affect their relative price? Use a diagram to support your answer.
- What impact has technological progress had on the basket of goods that the representative household purchases? Do you think that technological progress make it more or less important for the basket of goods to be reviewed annually?
- Do you think products such as the iPad and e-cigarettes should be included in the CPI? Are they truly representative?
- In the BBC News article, you can access a list of the products that are ‘in and out’. Is there anything on there that you think should be in or that should be out? Be sure to justify your answer!
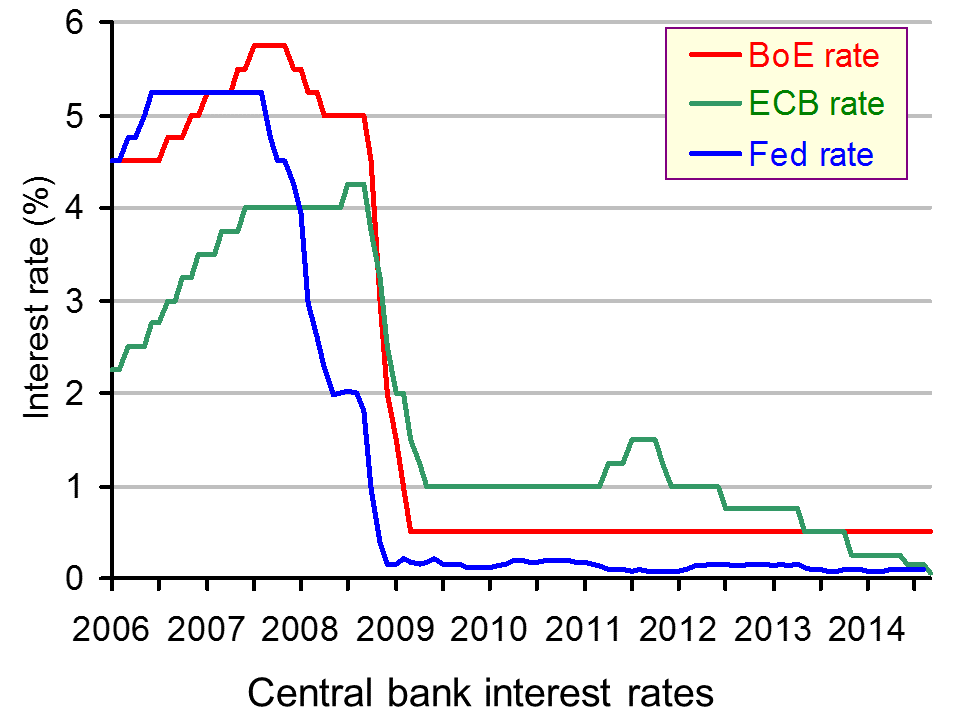
 In March 2009, interest rates in the UK fell to a record low of 0.5%. At the time, it is unlikely that anyone expected that we would still be talking about such low interest rates 6 years later. There has been no movement in the UK rate of interest over the past 6 years and many believe that we are unlikely to see an increase before 2016 or late 2015 at the earliest. With inflation at 0.3%, there is ‘little reason to raise the cost of borrowing’.
The cut in interest rates back in 2009 was in response to the financial crisis and recession. A key instrument of monetary policy, interest rates affect many of the components of aggregate demand. Lower interest rates reduce the cost of borrowing, reduce the return on savings and hence encourage consumption. They can also reduce mortgage repayments and have a role in reducing the exchange rate. All of these factors are crucial for any economic stimulus. As the recovery in the UK took hold, discussions started to focus on when (and not if) interest rates would increase. As the 6 year anniversary occurs, with the MPC keeping rates at 0.5% for March, this question has once again been raised.
Interest rates are used to target inflation and the target in the UK is 2% +/- 1%. With inflation at 0.3% and some predicting that it will turn negative, thanks to such a large fall in oil prices, perhaps the most likely change in interest rates is that they will fall further. A senior Economic Adviser to the EY Item Club commented:
“While the risks of an earlier rate rise have probably increased lately, we still think it most likely that the Bank will wait until February 2016, by which time inflation will be back above 1% and heading towards the 2% target.”
This was echoed by the Chief Economist at the British Chambers of Commerce, who said:
“The strengthening pound against the euro is already posing challenges for many UK exporters and higher interest rates would only make matters worse…Given this background, business confidence will be strengthened if the Monetary Policy Committee (MPC) clearly states that interest rates are likely to stay on hold until at least early 2016.”
Some might question the logic of keeping interest rates so low, given that unemployment is falling and the economy is growing. In such cases, we would normally expect interest rates to increase, especially given how low they are and the fact that it has been 6 years since they went down. However, with oil prices down, inflation has fallen and wage growth does remain relatively weak. Furthermore, there are still some areas within the UK that are still in the recovery process.
The strength of the economy relative to Europe is also putting upward pressure on the pound, which will adversely affect the competitiveness of UK exports. These factors together mean that retaining interest rates at 0.5% received unanimous support amongst the MPC. The only disagreement was on the future direction of interest rates. It is this disagreement that is perhaps what is causing problems, as confirmation of what will happen to interest rates over the rest of 2015 would give greater certainty to an economy. The following articles consider this anniversary.
UK interest rates mark six-year anniversary at record low The Guardian, Angela Monaghan (5/3/15)
UK interest rates mark six years at record low of 0.5% BBC News (5/3/15)
Bank of England keeps interest rates on hold Financial Times, Emily Cadman (5/3/15)
Carney facing seven-year itch as BOE holds rates Bloomberg, Jennifer Ryan (5/3/15)
Bank of England rates have now been on hold six years. Here’s how it has affected you The Telegraph, Szu Ping Chan (5/3/15)
Bank of England keeps rates on hold, six years after crisis cut Reuters (5/3/15)
Bank of England keeps key rate at record low Wall Street Journal, Jason Douglas (5/3/15)
Questions
- By outlining the key components of aggregate demand, explain the mechanisms by which interest rates will affect each component.
- How can inflation rates be affected by interest rates?
- Why is there a debate amongst the MPC as to the future direction of interest rates?
- The Chief Economist at the British Chambers of Commerce has said that the strengthening pound is creating problems in the UK and higher interest rates would make matters worse. Why is this?
- Who would be helped and harmed by a rate rise?
- Consider the main macroeconomic objectives and in each case explain whether economic theory would suggest that interest rates should (a) fall , (b) remain at 0.5% or (c) rise.
 Ever been to the cinema and found it almost empty? And then wondered why you paid the full price? Perhaps you’ve taken advantage of Orange Wednesday or only go if there’s a particularly good film on? Often it might be cheaper to wait until the film is out on DVD!
Going to the cinema can be an expensive outing. The ticket, the popcorm, a drink, ice cream – it all adds up! Orange Wednesday has recently disappeared and this will definitely have an impact on consumption of movies at your local Odeon, Vue or Showcase. The impact will be on how many seats are left empty.
However, a new app could be set to generate revenues for the cinema and provide cheaper entertainment for your everyday consumer. This new app will allow cinemas to send out alerts to people in the local area advising them that a screening will have many empty seats. What’s the incentive? Perhaps a discount, or some food. But, why would they do such a thing?
If a movie is being shown at a cinema, there will be a large fixed cost. However, what happens as each additional consumer enters the theatre? Does the cost to the cinema rise? Perhaps there is a small cost with more cleaning required, but the additional cost of actually showing the film if there 11 rather than 10 people is almost (if not equal to) zero. That is, the marginal cost of an extra user is zero. Therefore, if there is a screening with many empty seats, wouldn’t the cinema be better to offer the seats for half price. After all, if you can earn £5 from selling a ticket and the additional cost is almost zero, then it’s better to sell it for £5 than not sell it for £10! The following article and video from BBC News considers this new app and other strategies to maximise cinema usage!
 Apps in pockets, bums on cinema seats BBC News, Dave Lee (27/2/15)
Questions
- What would the budget constraint look like for a cinema where a discount was offered if you purchased two cinema tickets and then received the third ticket for half price?
- Why is the marginal cost of an extra user at the cinema almost zero?
- If the MC = 0, does this mean that a cinema is a public good?
- How will this new app allow a cinema to increase total revenue and profit?
- If it is cheaper to buy a DVD rather than go to a cinema, why do people still go to the cinema?
 House prices are always a good signal for the strength or direction of the economy. While there will always be certain areas that are more sought after than others and such differences will be reflected in relative house prices, the regional divide that we currently see in the UK is quite astonishing.
Prior to the financial crisis, house prices had been rising across the county, but in the year following the financial crisis, they declined by 19 per cent. It was only in 2013, when prices began to increase and, perhaps more importantly, when the variation in regional house prices began to increase significantly. In mid-2014, the UK’s annual house price inflation rate was 11.7 per cent, but the rates in London and the South East were 19.1 and 12.2 per cent, respectively. Elsewhere in the UK, the average rate was 7.9 per cent.
These regional differences have continued and figures show that the current differential between the cheapest and most expensive regional average house price is now over £350,000. In particular, data from the Land Registry shows that the average house price in London is £458,283, while in the North East, it is only £97,974.
Those people who own a house in London have benefited from such high house prices, in many cases finding that their equity in their house has grown significantly. Furthermore, any home-owners selling their house in London and moving elsewhere are benefiting from lower house prices outside London.
However, most first-time buyers looking for a house in London are being competed out of the market, finding themselves unable to gain a mortgage and deposit for the amount that they require. The opposite is, of course, happening in other parts of the country. First-time buyers are more able to enter the property market, but home-owners are finding that they have much less equity in their house.
This has also caused other problems, in particular in the labour market. Workers who are moving to jobs in London are finding the house price differentials problematic. Although wage rates are often higher in London than in other parts of the country, the house price differential is significantly bigger. This means that if someone is offered a job in London, they may find it impossible to find a house of similar size in London compared to where they had been. After all, an average family home in the North East can be purchased for under £100,000, whereas an average family home in London will cost almost £500,000.
The housing market is problematic because of particular characteristics.
Supply tends to be relatively fixed, as it can take a long time to build new houses and hence to boost supply. Furthermore, the UK has a relatively dense population, with limited available land, and so planning restrictions have to be kept quite tight, which is another reason why supply can be difficult to increase.
On the demand-side, we are seeing a change in demographics, with more single-person households; people living longer; second home purchases and many other factors. 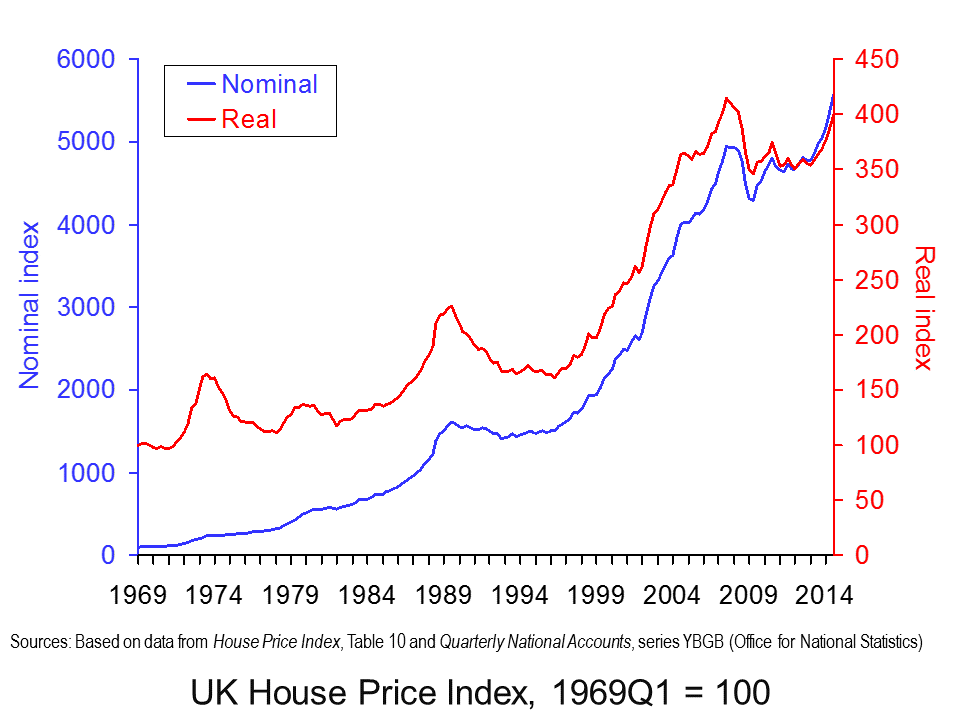 These things tend to push up demand and, with restricted supply, house prices rise. Furthermore, with certain areas being particularly sought after, perhaps due to greater job availability, ease of commuting, schools, etc., house price differentials can be significant.
The Conservatives, together with the other main parties, have promised to build more houses to help ease the problem, but this really is a long-run solution.
The Bank of England will undoubtedly have a role to play in the future of the housing market. The affordability of mortgages is very dependent on interest rate changes by the Bank’s Monetary Policy Committee.
Although house prices in London have recently fallen a little, the housing cost gap between living in London and other areas is unlikely to close by much as long as people continue to want to live in the capital. The following articles consider the housing market and its regional variations.
Articles
London’s homeowners have made £144,000 on average since 2009 International Business Times, Sean Martin (20/2/15)
Wide gap in regional house prices, Land Registry figures show BBC News, Kevin Peachey (27/2/15)
Mapped: 10 years of Britain’s house price boom (and bust) The Telegraph, Anna White (27/2/15)
Oxford houses less affordable than London Financial Times, Kate Allen (26/2/15)
January’s UK house prices show unexpected climb The Guardian (5/2/15)
House prices since 2008: best and worst regions The Telegraph, Tom Brooks-Pollock (22/8/14)
House prices hit new record high of £274k with six regions now past pre-crisis peak – but the North lags behind This is Money, Lee Boyce (14/10/14)
Data
House price indices: Data Tables ONS
Links to sites with data on UK house prices Economic Data freely available online, The Economics Network
Regional House Prices Q4 2014 Lloyds Banking Group
Questions
- What are the main factors that determine the demand for housing? In each case, explain what change would shift the demand curve for housing to the right or the left.
- Which factors determine supply? Which way will they shift the supply curve?
- Put the demand and supply for housing together and use that to explain the recent trends we have seen in house prices.
- Use your answers to question 1 – 3 to explain why house prices in London are so much higher than those in the North East of England.
- Why are interest rates such an important factor in the housing market?
- Explain the link between house prices and the labour market.
- Do you think government policy should focus on reducing regional variations in house prices? What types of policies could be used?
 In the UK, we take it for granted that if you need to see a doctor, you go and give little, if any thought, to the cost. It may be petrol costs, time off work or the cost of a prescription, but beyond that, receiving treatment is free at the point of use. Funded through a progressive tax system, the NHS is seen as being one of the more equitable health care systems.
When a mother gives birth, the main thing she will have to worry about is the labour – and not whether to have certain painkillers or stay an extra night, because of the cost.
The International Federation of Health Plans (IFHP) looked at data on the cost of giving birth, based on insurance company payments. For someone living in the UK, the figures make for quite astonishing reading. In the USA, a normal delivery will cost $10,000, while a caesarean totals $15,000, meaning that giving birth in the USA is the most expensive place in the world. The article linked below takes the case of Mari Roberts, whose total delivery bill came to over $100,000. The insurance did cover it, but that’s not always the case. Medical bills in the United States are one of the leading reasons for bankruptcy and with these types of figures, perhaps it’s hardly surprising.
Other countries also see high costs for delivery, where expectant mothers really do need to give consideration to the length of their stay in hospital and perhaps even whether they are willing to forgo a pain-relieving drug and save some money. There is often said to be an efficiency–equity trade-off in the area of healthcare, with countries offering a free at the point of use service delivering an equitable system, but with a lack of responsiveness to the demands of the patients. In the UK, you don’t pay to see a doctor but, with a ‘free’ service, demand is understandably very high, thus creating a shortage and waiting lists. In countries, such as the USA, a higher price for treatment does limit demand, creating more inequity but a responsive system.
There are certainly lessons that can be learned from all health care systems and living in a developed country, we should certainly consider ourselves lucky. There are many countries where access to even the most basic health care is a luxury that most cannot afford. So, where does have the best health care system? I’ll leave that to you.
Video and article
How much do women around the world pay to give birth? BBC News, Mariko Oi (13/2/15)
Report
Research for Universal Health Coverage, World Health Report 2013 World Health Organisation August 2013
Health Systems Financing: The Path to Universal Coverage, World Health Report 2010 World Health Organisation August 2010
Questions
- Using a demand and supply diagram, explain why there may be a trade-off between efficiency and equity.
- If there is over-consumption of a service such as health care, does this suggest that the market fails?
- What are the main market failures that exist in health care?
- Is the concept of opportunity cost relevant to mothers in labour? Think about the country in question.
- How would you go about ranking health care systems if you worked for an organisation such as the OECD or WHO?
- Pick a country whose health care system you are familiar with. What changes have occurred to the way in which health care is organised and financed in this country? How has it affected the key objectives that formed part of your answer to question 5?
 The rate of inflation in the UK is measured using the Consumer Prices Index (CPI). This is made up of a basket of goods and the ONS updates this ‘basket’ each year to ensure it is representative of what the average UK household buys. The basket contains 703 items, with 110,000 individual prices collected each month.