 Unemployment is a key macroeconomic objective for governments across the world. The unemployment rate for the UK now stands at 7.9% according to the ONS, which recorded 2.56 million people out of work. But why is unemployment of such importance? What are the costs?
The economy is already in a vulnerable state and with unemployment rising by 70,000 people between December and February 2013, the state of the economic recovery has been questioned. Indeed, following the news of the worsening unemployment data, the pound fell significantly against the dollar, suggesting a lack of confidence in the British economy.
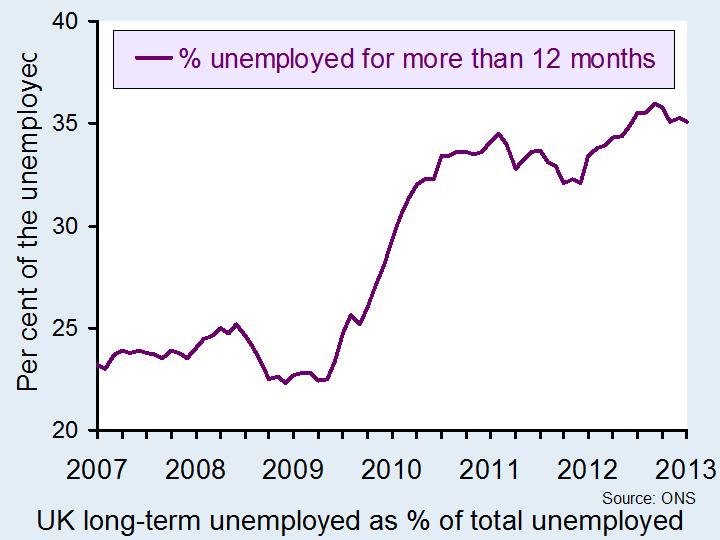 Although the increase in the number of people out of work is concerning, perhaps of more concern should be the number of long-term unemployed. The ONS suggests that more than 900,000 have now been out of work for more than a year. Not only does this pose costs for the individual in terms of lost earnings and skills, but it also imposes costs on friends and family and the wider economy. (Click here for a PowerPoint of the first chart, which shows the percentage of unemployed people out for work longer than 12 months.)
The chief executive of the Prince’s Trust focused on the costs of youth unemployment in particular, saying:
Thousands of these young people are long-term unemployed, often facing further challenges such as poverty and homelessness. We must act now to support these young people into work and give them the chance of a better future.
(Click here for a PowerPoint of the second chart, which shows how much higher the unemployment rate is for young people aged 18 to 24 than it is for the working age population as a whole.)
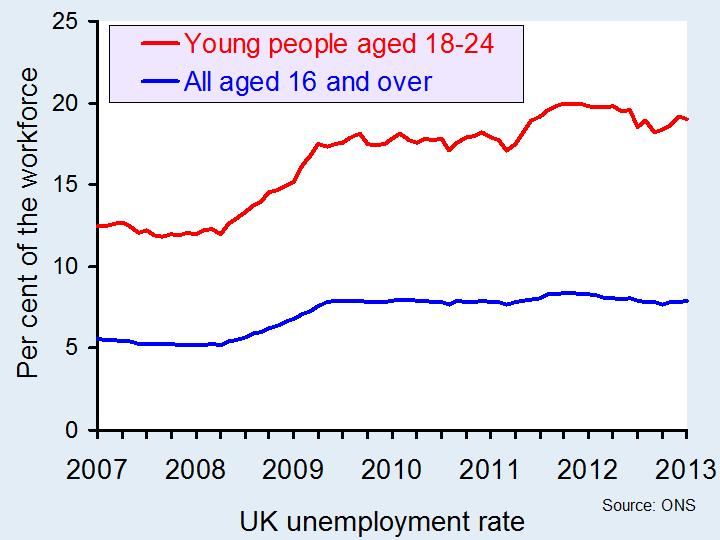 Furthermore, with so many people unemployed, we are operating below full-employment and thus below our potential output. Furthermore, the longer people are out of work, the more likely it is that they will lose their skills and thus require re-training in the future or find that there are now fewer jobs available to them based on their lower skill level.
In addition to this there are monetary costs for the government through lower tax receipts, in terms of income tax, national insurance contributions and even VAT receipts. With more people unemployed, the numbers claiming various unemployment-related benefits will rise, thus imposing a further cost on the government and the taxpayer. Another cost to the government of this latest data is likely to be the expectations of the future course of the economy. Numerous factors affect business confidence and unemployment data is certainly one of them. The concern is that business confidence affects many other variables as well and until we receive more positive data, the economy recovery is likely to remain uncertain. The following articles consider this topic.
UK unemployment rise adds to pressure on Osborne’s austerity strategy The Guardian, Phillip Inman (18/4/13)
Unemployment figures are ‘worrying’, David Cameron’s spokesman says The Telegraph, Peter Dominiczak (17/4/13)
UK unemployment rises to 2.56 million BBC News (17/4/13)
Unemployment jumps to 7.9% as rise in the number of young people out of work takes figure ‘dangerously’ close to a million Mail Online, Leon Watson (17/4/13)
Unemployment up as stay-at-home mothers head back to the job-centre Independent, Ben Chu (17/4/13)
Jobs data points to finely balanced market Financial Times, Brian Groom (18/4/13)
 Hugh’s review: making sense of the stats BBC News (19/4/13)
Questions
- How is unemployment measured?
- What are the costs to the individual of being unemployed?
- What are the wider non-monetary costs to society?
- Explain the main financial costs to the wider economy of a rising unemployment rate.
- Illustrate the problem of unemployment by using a production possibility frontier.
- Could there be a negative multiplier effect from a rise in unemployment?
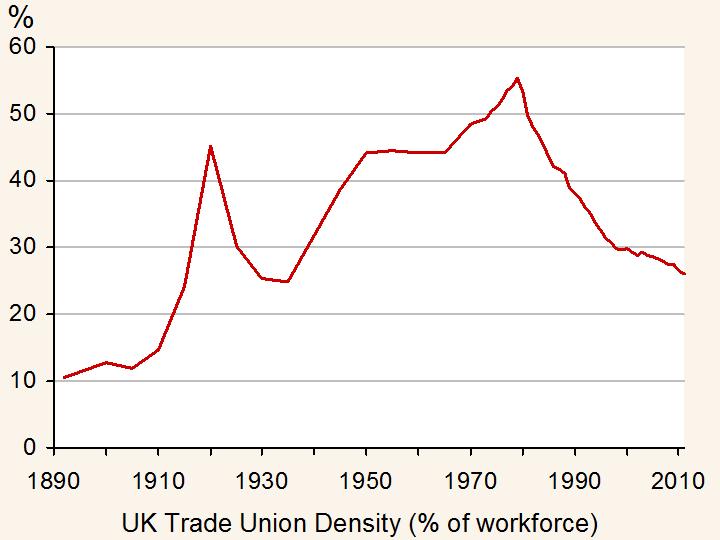 The most common demands for trade unions are for higher wages and better working conditions. However, pensions have become an increasingly important issue that many public-sector workers in particular have raised concerns over. While actions by trade unions have been less frequent and public in recent months, the Public and Commercial Services Union (PCS) has voted to strike.
The labour market works like any other market – there is a demand for and supply of labour. The intersection of the demand and supply of labour give the equilibrium wage rate and equilibrium number of workers. Trade unions may aim to push up the wage rate above this equilibrium and the impact on the number of workers employed will depend on the type of labour market. If we have a competitive labour market, then the increase in wage will create an excess supply of labour: that is, unemployment. This is often a choice a trade union has to make. However, if the market is a monopsony, then it is possible for a trade union to force up wages and yet there may not be any fall in the number of workers employed.
Pay is just one of the issues being raised by the PCS. Public-sector pay was frozen for two years for those earning above £21,000. According to the Cabinet Office, this was necessary to ‘protect jobs in the public sector and support high quality public services.’ A 5% pay rise has been requested to counter an alleged 7% fall in earnings since 2008. 61% of those who voted in the ballot were in favour of strike action. Other concerns include job losses and pensions.
One concern of the PCS will be the low turn-out. Only 28% of the union’s members voted in this ballot and this is likely to weaken the union’s bargaining position. The government has monopsony power in employing civil servants and this is one of the reasons why a powerful trade union is likely to emerge: it acts to reduce the power of the monopsonist employer. Negotiations will typically take place between the employer and the trade union and with such a low turn-out, the power is certainly with the government. However, with the threat of strike action to occur around the time of the Budget, this does present something of a concern for the government, especially with growth remaining weak and the loss of the AAA rating.
Two separate pay offers have been made to 1.6 million public-sector workers, but Unison has suggested that members of PCS should reject them. If headway is not made in negotiations between PCS and the government, then strike action could be just around the corner. The following articles consider this looming industrial action.
Articles
Questions
- Use a diagram to illustrate a competitive market for labour and show how a trade union will aim to push up the wage rate. Show why a trade-off exists between the higher wage and the number of workers employed.
- Illustrate a diagram showing a monopsony and explain why the MC curve exceeds the AC curve. Why is it possible for a trade union to force up wages without creating a decline in the equilibrium number of workers employed?
- What other actions, besides striking, are available for trade union members? What are the costs and benefits of each relative to striking?
- Which factors, besides a low turn-out in the ballot, will reduce the trade union’s negotiating power?
- Public-sector pay was frozen for two years. If the government accepted the trade union’s pay demands, what would be the impact on the budget deficit? Could the higher pay help boost economic growth by creating a multiplier effect?
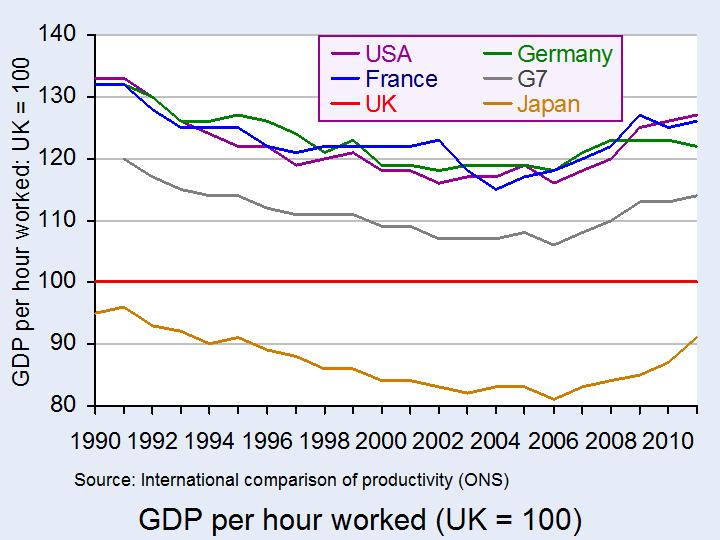
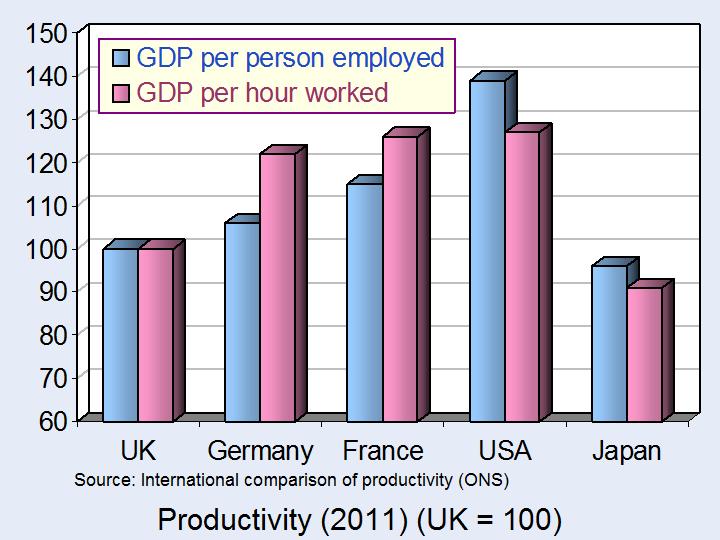 Recent figures from the ONS suggest that the UK lags well behind its competitors in terms of labour productivity. In terms of output per hour worked, Germany produces 22% more than the UK, France produces 26% more, the USA produces 27% more, the Netherlands 31% more and Ireland 43% more. The first chart illustrates some of these figures.
(Click here for a PowerPoint of this chart.)
And in the past few years the problem has been getting worse. This is shown in the second chart. This, however, is a relatively recent phenomenon. Until 2006, the gap was narrowing, but since then it has widened. (Click here for a PowerPoint of the second chart.)
 What has caused this widening of the gap? Part of the problem is a historical lack of investment in the UK. Between 2005 and 2012, the UK invested on average 15.7% of GDP. The USA invested 16.5%, Germany 17.9% and France 20.1%. And part of the problem has been the cut back in private-sector investment in response to the recession (which has been deeper in the UK) and in public-sector investment as part of the government’s austerity measures.
Part of the problem has been lower levels of inward investment. Inward direct investment to the UK in 2011 was only 24 per cent of that in 2007. In France, Germany, Italy and the USA, the figures were 43, 50, 66 and 105 per cent respectively.
Part of the problem has been the size of the financial sector in the UK. This is considerably larger as a proportion of the economy than in most the UK’s major competitors. And it was this sector most hard hit by the crisis of 2007/8.
 With this poor productivity performance, you might expect unemployment to have soared. In fact, the UK has one of the lowest unemployment rates of the developed countries and in recent months it has been falling while other countries have seen their unemployment rates rise.
In fact, low productivity and high employment are compatible. If people produce less than their counterparts abroad, then more people will be needed to produce the same level of output. The problem, of course, is that this only works if wages are kept down. Indeed, wages have fallen in real terms and now stand at the level of 10 years ago.
The problem of falling real wages is that this translates into a lack of demand – especially when people are trying to reduce their debts. Not only does this result in a lack of economic growth, it discourages firms from investing – and investment is one of the prime drivers of future productivity growth!
The following articles explore the problem of low productivity and its relationship with employment and with both short-term and long-term economic growth.
Articles
UK has widest productivity gap since 1993 City A.M., Ben Southwood (14/2/13)
Productivity ‘key to UK’s economic future’ SnowdropKCS (7/2/13)
Low wages and lack of investment – why UK’s productivity has slumped Wales Online, David Williamson (2/3/13)
Recovery in jobs gives a fillip before the news on growth Independent, Russell Lynch (23/1/13)
U.K. Triple-Dipping as Productivity Falls Slate, Matthew Yglesias (25/1/13)
UK productivity puzzle baffles economists BBC News, By Andrew Walker (18/10/12)
Is low productivity a structural problem in the UK? BBC Today Programme, Bridget Rosewell and Andrew Sentance (4/1/13)
We Need to Talk About the Middle Huffington Post, Stewart Wood (14/2/13)
UK Wages Slump to Lowest Level in a Decade – ONS International Business Times, Shane Croucher (13/2/13)
Britain’s low-wage economy serves as a bind on the country The Guardian, Philip Inman (13/2/13)
Real wages fall back to 2003 levels in UK The Guardian, Hilary Osborne (13/2/13)
Data
International Comparisons of Productivity – Final Estimates for 2011 ONS (13/2/13)
International Comparisons of Productivity, datasets ONS (13/2/13)
Changes in real earnings in the UK and London, 2002 to 2012 ONS (13/2/13)
Questions
- Which is a better measure of productivity – output per worker or output per hour worked? Why, do you think, does the USA produce 39% more per worker, but only 27% more per hour worked?
- What policies should the government adopt in order to encourage a growth in productivity?
- If productivity growth increased, what would be the likely effect on employment? Explain.
- Why has unemployment not risen in recent months?
 Pressure has been growing in the UK for people to be paid no less than a living wage. The Living Wage Foundation claims that this should be £8.55 per hour in London and £7.45 in the rest of the UK. The current minimum wage is £6.19.
There has been considerable support for a living wage across the political spectrum. Ed Miliband, the Labour leader, has stated that a Labour government would ensure that government employees were paid at least the living wage and that government contracts would go only to firms paying living wages. Other firms that paid less could be ‘named and shamed’. The living wage has also been supported by Boris Johnson, Conservative Mayor of London. The Prime Minister said that a living wage is ‘an idea whose time has come’, although many Conservatives oppose the idea.
The hourly living wage rate is calculated annually by the Centre for Research in Social Policy and is based on the basic cost of living. The London rate is calculated by the Greater London Authority.
Advocates of people being paid at least the living wage argue that not only would this help to reduce poverty, it would also help to reduce absenteeism and increase productivity by improving motivation and the quality of people’s work.
 It would also bring in additional revenue to the government. According to a report by the Institute for Public Policy Research and the Resolution Foundation, if everyone were paid at least a living wage, this would increase the earnings of the low paid by some £6.5bn per year. Of this, some £3.6bn would go to the government in the form of higher income tax and national insurance payments and reduced spending on benefits and tax credits. Of this £6.5bn, an extra £1.3 billion would be paid to public-sector workers, leaving the Treasury with a net gain of £2.3bn.
But what would be the effect on employment? Would some firms be forced to reduce their workforce and by how much? Or would the boost to aggregate demand from extra consumer spending more than offset this and lead to a rise in employment?. The following articles look at the possible effects.
Articles
Living wage for all workers would boost taxes and GDP Independent, Nigel Morris (28/12/12)
Living wage could save £2bn – think tank research BBC News (28/12/12)
‘Living wage’ would save money, says study Financial Times, Helen Warrell (28/12/12)
Why the Resolution Foundation and IPPR can go boil their heads Adam Smith Institute, Tim Worstall (30/12/12)
Living wage for public servants moves a step closer The Observer,
Yvonne Roberts and Toby Helm (15/12/12/)
Living wage: Ed Miliband pledge over government contracts BBC News (5/11/12)
‘London Living Wage’ increased to £8.55 by mayor BBC News (5/11/12)
Q&A: The living wage BBC News (5/11/12)
Scrooges in UK firms must pay a Living Wage This is Money, John Sentamu (23/12/12)
Report
What price a living wage? IPPR and The Resolution Foundation, Matthew Pennycook (May 2012)
Questions
- How would you set about determining what the living wage rate should be?
- Distinguish between absolute and relative poverty. Would people being paid below a living wage be best described as absolute or relative poverty (or both or neither)?
- What do you understand by the term ‘efficiency wage’? How is this concept relevant to the debate about the effects of firms paying a living wage?
- Under what circumstances would raising the statutory minimum wage rate to the living wage rate result in increased unemployment? How is the wage elasticity of demand for labour relevant to your answer and how would this elasticity be affected by all firms having to pay at least the living wage rate?
- What would be the macroeconomic effects of all workers being paid at least the living wage rate? What would determine the magnitude of these effects?
 If aggregate demand were to expand, would there be sufficient spare capacity to allow aggregate supply to expand to meet the additional demand? This is the question addressed by the podcast and article below.
If there is plenty of spare capacity, policies to increase aggregate demand could help to take up the slack and thereby achieve economic growth – at least as long as spare capacity remains. In other words, in the short run the aggregate supply curve may be horizontal or only gently upward sloping at the current point of intersection with the aggregate demand curve. This is illustrated by point a in the diagram. A rightward shift in the aggregate demand curve would cause a movement along the aggregate supply curve to a new higher level of real national income (Y).
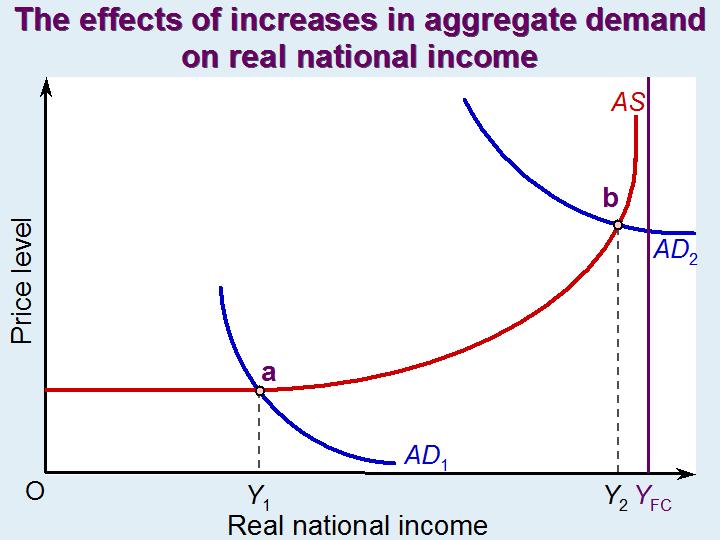
If, however, there is little or no spare capacity, an increase in nominal aggregate demand is likely to be purely inflationary, or virtually so. This would the case at point b in the diagram. Real national income cannot expand beyond the full-capacity level, YFC. Under such circumstances, any attempt by the government to stimulate economic growth should focus on the supply side and attempt to shift the aggregate supply curve to the right. Examples of supply-side policy include incentives to encourage research and development, incentives for the private sector to invest in new capacity and direct public investment in infrastructure.
Unemployment is not just caused by a lack of aggregate demand relative to aggregate supply. It may be the result of a mismatching of labour supply with the demand for labour. People may have the wrong qualifications or not be where the jobs are. Unemployment may co-exist with quite high levels of vacancies. There may be vacancies for highly qualified scientists, technicians or craftspeople and unemployment of people with low skills or skills no longer in high demand. The same may apply to capital equipment. There may be a shortage of high-tech equipment or equipment to produce goods in high demand and redundant older equipment or equipment in areas of declining demand.
Part of a comprehensive set of policies to tackle unemployment and achieve economic growth would be to focus on the whole balance of the economy and the matching of the demand and supply of inputs.
Podcast
Is there ‘spare capacity’ in the economy? BBC Today Programme, Evan Davis and Andrew Sentance (4/12/12)
Article
OBR’s supply pessimism could be the ruin of this government The Telegraph, Roger Bootle (25/11/12)
Data
Claimant count and vacancies dataset ONS (14/11/12)
Labour Market Statistics, November 2012 ONS (14/11/12)
Actual weekly hours worked ONS (14/11/12)
Usual weekly hours worked ONS (14/11/12)
Questions
- Distinguish between ‘unemployment’, ‘underemployment’ and ‘disguised unemployment’?
- To what extent does the level of unemployment provide a good measure of spare capacity?
- Is the UK economy suffering from a deflationary gap? If so, how would you measure the size of that gap?
- If there is substantial spare capacity, is expansionary fiscal policy the best means of achieving economic growth?
- What policies are likely to have both a positive supply-side effect and a positive demand-side effect?
- What constraints does the government face in attempting to boost aggregate demand?
- Why might policies designed to stimulate aggregate demand also increase supply capacity?
- What policies would you recommend for tackling the mismatching of the demand and supply of inputs?
 Unemployment is a key macroeconomic objective for governments across the world. The unemployment rate for the UK now stands at 7.9% according to the ONS, which recorded 2.56 million people out of work. But why is unemployment of such importance? What are the costs?