 The International Monetary Fund has just published its six-monthly World Economic Outlook (WEO). The publication assesses the state of the global economy and forecasts economic growth and other indicators over the next few years. So what is this latest edition predicting?
Well, once again the IMF had to adjust its global economic growth forecasts down from those made six months ago, which in turn were lower than those made a year ago. As Larry Elliott comments in the Guardian article linked below:
Every year, economists at the fund predict that recovery is about to move up a gear, and every year they are disappointed. The IMF has over-estimated global growth by one percentage point a year on average for the past four years.
In this latest edition, the IMF is predicting that growth in 2015 will be slightly higher in developed countries than in 2014 (2.0% compared with 1.8%), but will continue to slow for the fifth year in emerging market and developing countries (4.0% in 2015 compared with 4.6% in 2014 and 7.5% in 2010).
In an environment of declining commodity prices, reduced capital flows to emerging markets and pressure on their currencies, and increasing financial market volatility, downside risks to the outlook have risen, particularly for emerging market and developing economies.
So what is the cause of this sluggish growth in developed countries and lower growth in developing countries? Is lower long-term growth the new norm? Or is this a cyclical effect – albeit protracted – with the world economy set to resume its pre-financial-crisis growth rates eventually?
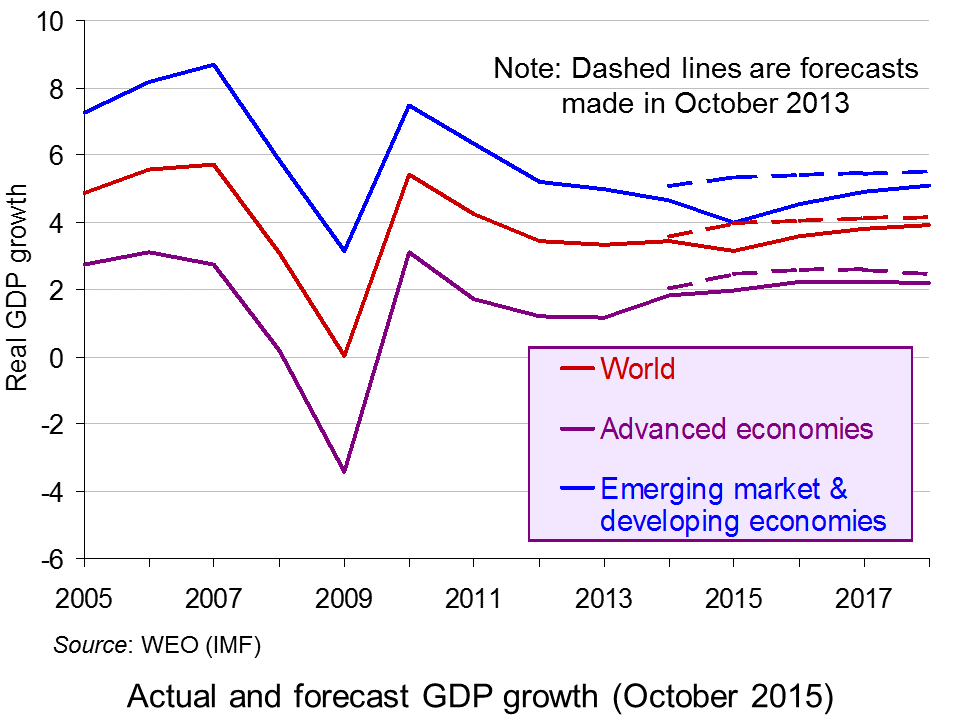 To achieve faster economic growth in the longer term, potential national output must grow more rapidly. This can be achieved by a combination of more rapid technological progress and higher investment in both physical and human capital. But in the short term, aggregate demand must expand sufficiently rapidly. Higher short-term growth will encourage higher investment, which in turn will encourage faster growth in potential national output.
But aggregate demand remains subdued. Many countries are battling to cut budget deficits, and lending to the private sector is being constrained by banks still seeking to repair their balance sheets. Slowing growth in China and other emerging economies is dampening demand for raw materials and this is impacting on primary exporting countries, which are faced with lower exports and lower commodity prices.
Quantitative easing and rock bottom interest rates have helped somewhat to offset these adverse effects on aggregate demand, but as the USA and UK come closer to raising interest rates, so this could dampen global demand further and cause capital to flow from developing countries to the USA in search of higher interest rates. This will put downward pressure on developing countries’ exchange rates, which, while making their exports more competitive, will make it harder for them to finance dollar-denominated debt.
As we have seen, long-term growth depends on growth in potential output, but productivity growth has been slower since the financial crisis. As the Foreword to the report states:
The ongoing experience of slow productivity growth suggests that long-run potential output growth may have fallen broadly across economies.  Persistently low investment helps explain limited labour productivity and wage gains, although the joint productivity of all factors of production, not just labour, has also been slow. Low aggregate demand is one factor that discourages investment, as the last World Economic Outlook report showed. Slow expected potential growth itself dampens aggregate demand, further limiting investment, in a vicious circle.
But is this lower growth in potential output entirely the result of lower demand? And will the effect be permanent? Is it a form of hysteresis, with the effect persisting even when the initial causes have disappeared? Or will advances in technology, especially in the fields of robotics, nanotechnology and bioengineering, allow potential growth to resume once confidence returns?
Which brings us back to the short and medium terms. What can be done by governments to stimulate sustained recovery? The IMF proposes a focus on productive infrastructure investment, which will increase both aggregate demand and aggregate supply, and also structural reforms. At the same time, loose monetary policy should continue for some time – certainly as long as the current era of falling commodity prices, low inflation and sluggish growth in demand persists.
Articles
Uncertainty, Complex Forces Weigh on Global Growth IMF Survey Magazine (6/10/15)
A worried IMF is starting to scratch its head The Guardian, Larry Elliott (6/10/15)
Storm clouds gather over global economy as world struggles to shake off crisis The Telegraph, Szu Ping Chan (6/10/15)
Five charts that explain what’s going on in a miserable global economy right now The Telegraph, Mehreen Khan (6/10/15)
IMF warns on worst global growth since financial crisis Financial Times, Chris Giles (6/10/15)
Global economic slowdown in six steps Financial Times, Chris Giles (6/10/15)
IMF Downgrades Global Economic Outlook Again Wall Street Journal, Ian Talley (6/10/15)
WEO publications
World Economic Outlook, October 2015: Adjusting to Lower Commodity Prices IMF (6/10/15)
 Global Growth Slows Further, IMF’s latest World Economic Outlook IMF Podcast, Maurice Obstfeld (6/10/15)
Transcript of the World Economic Outlook Press Conference IMF (6/10/15)
World Economic Outlook Database IMF (October 2015 edition)
Questions
- Look at the forecasts made in the WEO October editions of 2007, 2010 and 2012 for economic growth two years ahead and compare them with the actual growth experienced. How do you explain the differences?
- Why is forecasting even two years ahead fraught with difficulties?
- What factors would cause a rise in (a) potential output; (b) potential growth?
- What is the relationship between actual and potential economic growth?
- Explain what is meant by hysteresis. Why may recessions have a permanent negative effect, not only on trend productivity levels, but on trend productivity growth?
- What are the current downside risks to the global economy?
- Why have commodity prices fallen? Who gains and who loses from lower commodity prices? Does it matter if falling commodity prices in commodity importing countries result in negative inflation?
- To what extent can exchange rate depreciation help commodity exporting countries?
- What is meant by the output gap? How have IMF estimates of the size of the output gap changed and what is the implication of this for actual and potential economic growth?
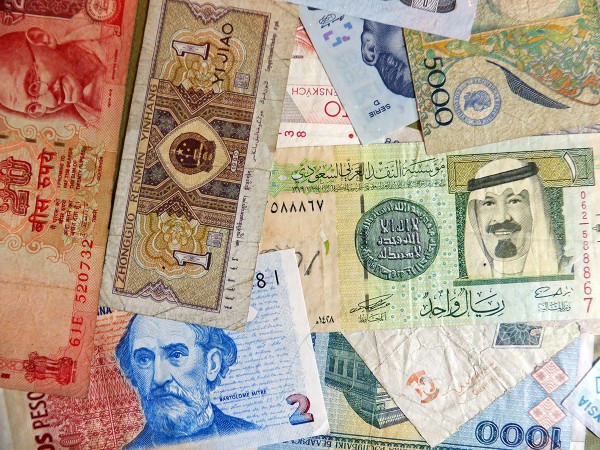 If you asked virtually any banker or economist a few years ago whether negative (nominal) interest rates were possible, the answer would almost certainly be no.
Negative real interest rates have been common at many points in time – whenever the rate of inflation exceeds the nominal rate of interest. People’s debts and savings are eroded by inflation as the interest due or earned does not keep pace with rising prices.
But negative nominal rates? Surely this could never happen? It was generally believed that zero (or slightly above zero) nominal rates represented a floor – ‘a zero lower bound’.
The reasoning was that if there were negative nominal rates on borrowing, you would effectively be paid by the bank to borrow.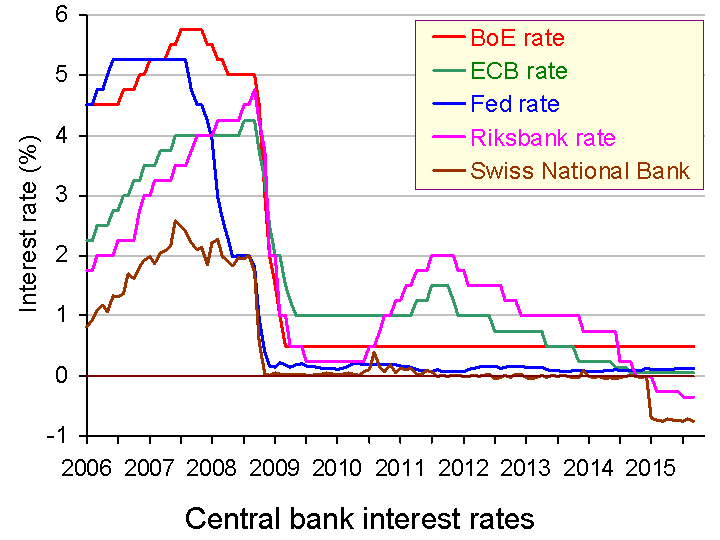 In such a case, you might as well borrow as much as you can, as you would owe less later and could pocket the difference.
A similar argument was used with savings. If nominal rates were negative, savers might as well withdraw all their savings from bank accounts and hold them as cash (perhaps needing first to buy a safe!) Given, however, that this might be inconvenient and potentially costly, some people may be prepared to pay banks for looking after their savings.
Central bank interest rates have been hovering just above zero since the financial crisis of 2008. And now, some of the rates have turned negative (see chart above). The ECB has three official rates:
|
|
| • |
The interest rate on the main refinancing operations (MRO), which provide the bulk of liquidity to the banking system. |
| • |
The rate on the deposit facility, which banks may use to make overnight deposits with the Eurosystem. |
| • |
The rate on the marginal lending facility, which offers overnight credit to banks from the Eurosystem. |
The first of these is the most important rate and remains above zero – just. Since September 2014, it has been 0.05%. This rate is equivalent to the Bank of England’s Bank Rate (currently still 0.5%) and the Fed’s Federal Funds Rate (currently still between 0% and 0.25%).
The third of the ECB’s rates is currently 0.3%, but the second – the rate on overnight deposits in the ECB by banks in the eurozone – is currently –0.2%.  In other words, banks have to pay the ECB for making these overnight deposits (deposits that can be continuously rolled over). The idea has been to encourage banks to lend rather than simply keeping unused liquidity.
In Nordic countries, the experiment with negative rates has gone further. With plenty of slack in the Swedish economy, negative inflation and an appreciating krona, the Swedish central bank – the Riksbank – cut its rates below zero.
Many City analysts believe that the Riksbank will continue cutting, reducing its key interest rate to minus 0.5% by the end of the year [it is currently 0.35%]. Switzerland’s is already deeper still, at minus 0.75%, while Denmark and the eurozone have joined them as members of the negative zone.
But the nominal interest rate on holding cash is, by definition, zero. If deposit rates are pushed below zero, then will more and more people hold cash instead?  The hope is that negative nominal interest rates on bank accounts will encourage people to spend. It might, however, merely encourage them to hoard cash.
The article below from The Telegraph looks at some of the implications of an era of negative rates. The demand for holding cash has been increasing in many countries and, along with it, the supply of banknotes, as the chart in the article shows. Here negative interest are less effective. In Nordic countries, however, the use of cash is virtually disappearing. Here negative interest rates are likely to be more effective in boosting aggregate demand.
Article
How Sweden’s negative interest rates experiment has turned economics on its head The Telegraph, Peter Spence (27/9/15)
Data
Central bank and monetary authority websites Bank for International Settlements
Central banks – summary of current interest rates global-rates.com
Questions
- Distinguish between negative real and negative nominal interest rates.
- What is the opportunity cost of holding cash – the real or the nominal interest rate forgone by not holding it in a bank?
- Are there any dangers of central banks setting negative interest rates?
- Why may negative interest rates be more effective in Sweden than in the UK?
- ‘Andy Haldane, a member of the Monetary Policy Committee (MPC) … suggested that to achieve properly negative rates, the abolition of cash itself might be necessary.’ Why?
- Why does Switzerland have notes of SF1000 and the eurozone of €500? Should the UK have notes of £100 or even £500?
- Why do some banks charge zero interest rates on credit cards for a period of time to people who transfer their balances from another card? Is there any incentive for banks to cut interest rates on credit cards below zero?
 What will production look like in 20 years time? Will familiar jobs in both manufacturing and the services be taken over by robots? And if so, which ones? What will be the effect on wages and on unemployment? Will most people be better off, or will just a few gain while others get by with minimum-wage jobs or no jobs at all?
The BBC has been running a series looking at new uses for robots and whether they will take people’s jobs? This complements three reports: one by Boston Consulting one by Deloitte and an earlier one by Deloitte and Michael Osborne and Carl Frey from Oxford University’s Martin School. As Jane Wakefield, the BBC’s technology reporter states:
Boston Consulting Group predicts that by 2025, up to a quarter of jobs will be replaced by either smart software or robots, while a study from Oxford University has suggested that 35% of existing UK jobs are at risk of automation in the next 20 years.
Jobs at threat from machines include factory work, office work, work in the leisure sector, work in medicine, law, education and other professions, train drivers and even taxi and lorry drivers. At present, in many of these jobs machines work alongside humans. For example, robots on production lines are common, and robots help doctors perform surgery and provide other back-up services in medicine.
A robot may not yet have a good bedside manner but it is pretty good at wading through huge reams of data to find possible treatments for diseases.
Even if robots don’t take over all jobs in these fields, they are likely to replace an increasing proportion of many of these jobs, leaving humans to concentrate on the areas that require judgement, creativity, human empathy and finesse.
 These developments raise a number of questions. If robots have a higher marginal revenue product/marginal cost ratio than humans, will employers choose to replace humans by robots, wholly or in part? How are investment costs factored into the decision? And what about industrial relations? Will employers risk disputes with employees? Will they simply be concerned with maximising profit or will they take wider social concerns into account?
Then there is the question of what new jobs would be created for those who lose their jobs to machines. According to the earlier Deloitte study, which focused on London, over 80% of companies in London say that over the next 10 years they will be most likely to take on people with skills in ‘digital know-how’, ‘management’ and ‘creativity’.
 But even if new jobs are created through the extra spending power generated by the extra production – and this has been the pattern since the start of the industrial revolution some 250 years ago – will these new jobs be open largely to those with high levels of transferable skills? Will the result be an ever widening of the income gap between rich and poor? Or will there be plenty of new jobs throughout the economy in a wide variety of areas where humans are valued for the special qualities they bring? As the authors of the later Deloitte paper state:
The dominant trend is of contracting employment in agriculture and manufacturing being more than offset by rapid growth in the caring, creative, technology and business services sectors.
The issues of job replacement and job creation, and of the effects on income distribution and the balance between work and leisure, are considered in the following videos and articles, and in the three reports.
Videos
What is artificial intelligence? BBC News, Valery Eremenko (13/9/15)
What jobs will robots take over? BBC News, David Botti (15/8/14)
Could a robot do your job? BBC News, Rory Cellan-Jones (14/9/15)
Intelligent machines: The robots that work alongside humans BBC News, Rory Cellan-Jones (14/9/15)
Intelligent machines: Will you be replaced by a robot? BBC News, John Maguire (14/9/15)
Will our emotions change the way adverts work? BBC News, Dan Simmons (24/7/15)
Could A Robot Do My Job? BBC Panorama, Rohan Silva (14/9/15)
Articles
Technology has created more jobs in the last 144 years than it has destroyed, Deloitte study finds Independent, Doug Bolton (18/8/15)
Technology has created more jobs than it has destroyed, says 140 years of data The Guardian, Katie Allen (18/8/15)
Will a robot take your job? BBC News (11/9/15)
Intelligent Machines: The jobs robots will steal first BBC News, Jane Wakefield (14/9/15)
Robots Could Take 35 Per Cent Of UK Jobs In The Next 20 Years Says New Study Huffington Post, Thomas Tamblyn (14/9/15)
The new white-collar fear: will robots take your job? The Telegraph, Rohan Silva (12/9/15)
Does technology destroy jobs? Data from 140 years says no Catch news, Sourjya Bhowmick (11/9/15)
Reports
Takeoff in Robotics Will Power the Next Productivity Surge in Manufacturing Boston Consulting Group (10/2/15)
Agiletown: the relentless march of technology and London’s response Deloitte (November 2014)
Technology and people: The great job-creating machine Deloitte, Ian Stewart, Debapratim De and Alex Cole (August 2015)
Questions
- Which are the fastest growing and fastest declining occupations? To what extent can these changes be explained by changes in technology?
- What type of unemployment is caused by rapid technological change?
- Why, if automation replaces jobs, have jobs increased over the past 250 years?
- In what occupations is artificial intelligence (AI) most likely to replace humans?
- To what extent are robots and humans complementary rather than substitute inputs into production?
- “Our analysis of more recent employment data also reveals a clear pattern to the way in which technology has affected work.” What is this pattern? Explain.
- Why might AI make work more interesting for workers?
- Using a diagram, show how an increase in workers’ marginal productivity from working alongside robots can result in an increase in employment. Is this necessarily the case? Explain.
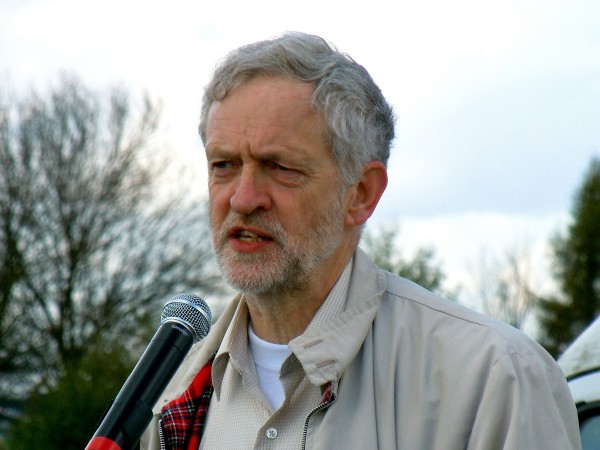 Jeremy Corbyn, the newly elected leader of the Labour Party, is proposing a number of radical economic policies. One that has attracted considerable attention is for a new form of QE, which has been dubbed ‘people’s quantitative easing’.
This would involve newly created money by the Bank of England being directly used to fund spending on large-scale housing, energy, transport and digital projects. Rather than the new money being used to purchase assets, as has been the case up to now, with the effect filtering only indirectly into aggregate demand and even more indirectly into aggregate supply, under the proposed scheme, both aggregate demand and aggregate supply would be directly boosted.
Although ‘conventional’ QE has worked to some extent, the effects have been uneven. Asset holders and those with large debts, such as mortgages, have made large gains from higher asset prices and lower interest rates. By contrast, savers in bank and building society accounts have seen the income from their savings decline dramatically. What is more, the indirect nature of the effects has meant time lags and uncertainty over the magnitude of the effects.
But despite the obvious attractiveness of the proposals, they have attracted considerable criticism. Some of these are from a political perspective, with commentators from the right arguing against an expansion of the state. Other criticisms focus on the operation and magnitude of the proposals
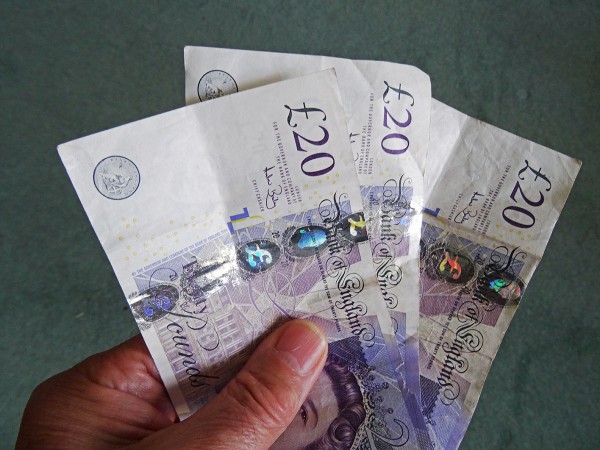 One is that it would change the relationship between the Bank of England and the government. If the Bank of England created money to fund government projects, that would reduce or even eliminate the independence of the Bank. Independence has generally been seen as desirable to prevent manipulation of the central bank by the government for short-term political gain. Those in favour of people’s QE argue that the money would be directed into a National Investment Bank, which would then make the investment allocation decisions. The central bank would still be independent in deciding the amount of QE.
This leads to the second criticism and that is about whether further QE is necessary at the current time. Critics argue that while QE of whatever type was justified when the economy was in recession and struggling to recover, now would be the wrong time for further stimulus. Indeed, it could be highly inflationary. The economy is currently expanding. If banks respond by increasing credit, the velocity of circulation of narrow money could rise and broad money supply grow, providing enough money to underpin a growing economy.
Many advocates of people’s QE accept this second point and see it as a contingency plan in case the economy fails to recover and further monetary stimulus is deemed necessary. If further QE is not felt necessary by the Bank of England, then the National Investment Bank could fund investment through conventional borrowing.
The following articles examine people’s QE and look at its merits and dangers. Given the proposal’s political context, several of the articles approach the issue from a very specific political perspective. Try to separate the economic analysis in the articles from their political bias.
Jeremy Corbyn’s proposal
The Economy in 2020 Jeremy Corbyn (22/7/15)
Articles
People’s quantitative easing — no magic Financial Times, Chris Giles (13/8/15)
How Green Infrastructure Quantitative Easing would work Tax Research UK, Richard Murphy (12/3/15)
What is QE for the people? Money Week, Simon Wilson (22/8/15)
QE or not QE? A slippery slope to breaking the Bank EconomicsUK.com, David Smith (23/8/15)
We don’t need “People’s QE”, basic economic literacy is enough Red Box, Jonathan Portes (13/8/15)
Is Jeremy Corbyn’s policy of ‘quantitative easing for people’ feasible? The Guardian, Larry Elliott (14/8/15)
Corbynomics: Quantitative Easing for People (PQE) Huffington Post, Adnan Al-Daini (7/9/15)
Corbyn’s “People’s QE” could actually be a decent idea FT Alphaville, Matthew C. Klein (6/8/15)
Jeremy Corbyn’s ‘People’s QE’ would force Britain into three-year battle with the EU The Telegraph, Peter Spence (15/8/15)
Would Corbyn’s ‘QE for people’ float or sink Britain? BBC News, Robert Peston (12/8/15)
Strategic Quantitative Easing – public money for public benefit New Economics Foundation blog, Josh Ryan-Collins (12/8/15)
People’s QE and Corbyn’s QE Mainly Macro blog, Simon Wren-Lewis
You can print money, so long as it’s not for the people The Guardian, Zoe Williams (4/10/15)
Questions
- What is meant by ‘helicopter money’? How does it differ from quantitative easing as practised up to now?
- Is people’s QE the same as helicopter money?
- Can people’s QE take place alongside an independent Bank of England?
- What is meant by the velocity of circulation of money? What happened to the velocity of circulation following the financial crisis?
- How does conventional QE feed through into aggregate demand?
- Under what circumstances would people’s QE be inflationary?
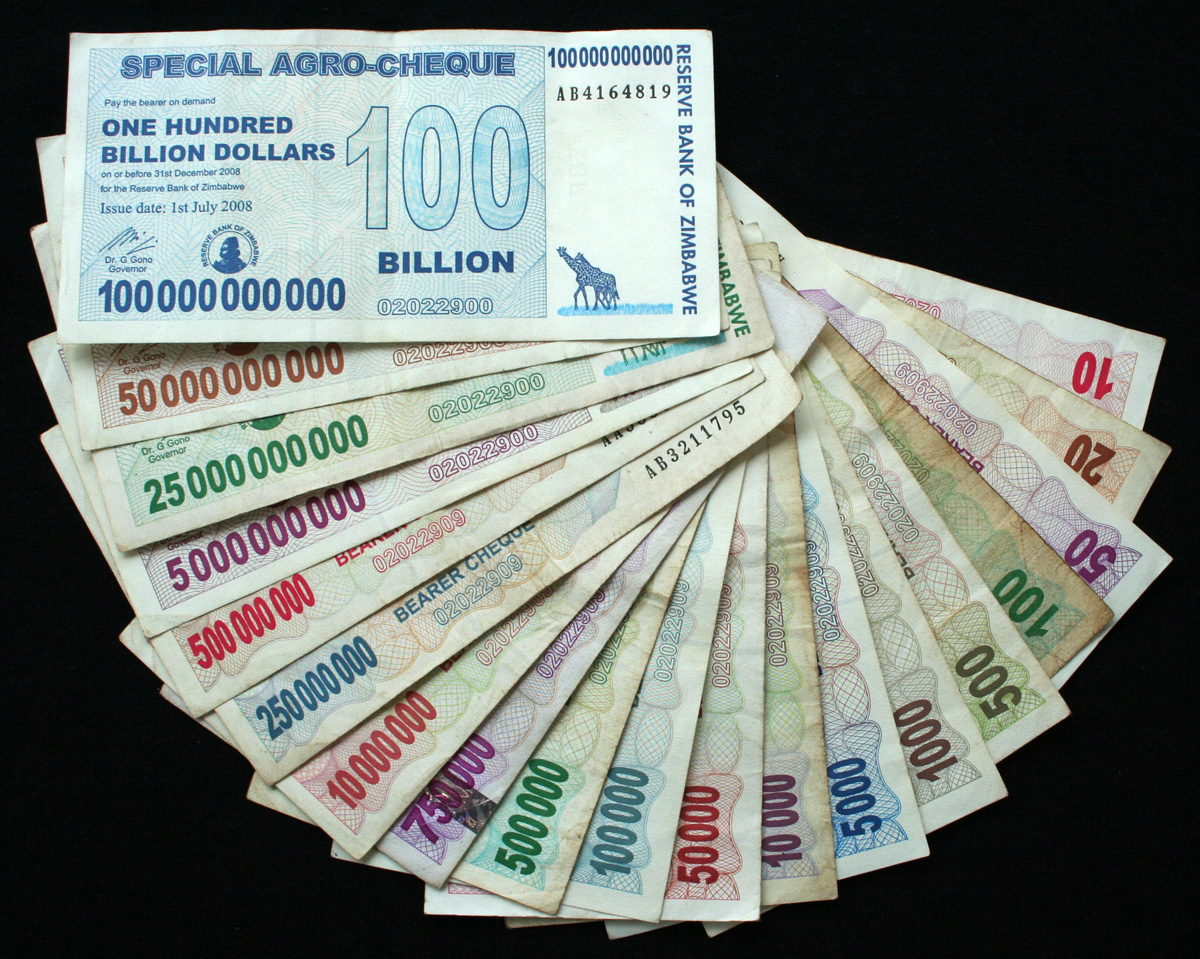
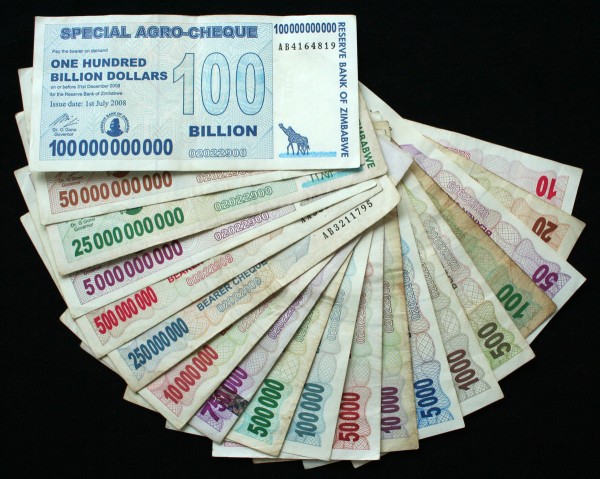 In the late 2000s, Zimbabwe experienced hyperinflation. As a post on this site in January 2009 said, two estimates of the inflation rate were made: one of 5 sextillion per cent (5 and 21 zeros); the other of 6.5 quindecillion novemdecillion per cent (65 and 107 zeros). In January 2009, in a last attempt to save the Zimbabwean currency, a new series of banknotes was issued, including a Z$100 trillion note.
Prices were typically being adjusted at least twice a day and people had to carry large bags of money around even to buy a couple of simple items. The currency was virtually worthless. As the Guardian article below states:
Hyperinflation in Zimbabwe left pensions, wages and investments worthless and spread poverty as everyday items became unaffordable. It also caused severe cash shortages, because the government could not afford to print bank notes to keep pace with inflation.
The solution was to allow other currencies, mainly the US dollar and the South African rand, to be used alongside the local currency. Although the Zimbabwean currency was still legal tender, it effectively went out of use. Prices stabilised and since then inflation has been in single figures.
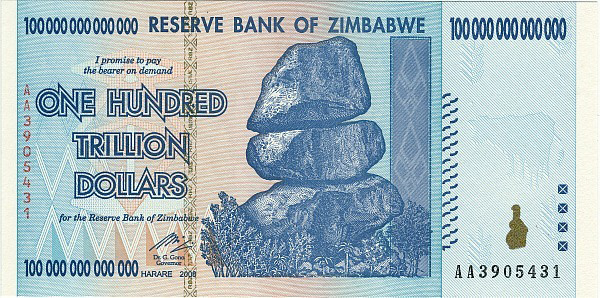 But many people still have stocks of the virtually worthless old currency, either in cash or in savings accounts. The Zimbabwean government has now said that it will exchange Zimbabwean dollar notes for US dollars at the rate of US$1 = Z$250tn (250,000,000,000). People have until September to do so. Up to now, they have mainly been used to sell as souvenirs to tourists! For people with Zimbabwean dollars in their bank accounts, they will get a minimum of US$5. For amounts beyond Z$175,000tn they will get an additional US dollar for each Z$35,000tn.
Historical examples of hyperinflation
As case study 15.5 in Economics 9e’s MyEconLab points out, several countries experienced hyperinflation after the First World War. In Austria and Hungary prices were several thousand times their pre-war level. In Poland they were over 2 million times higher, and in the USSR several billion times higher.
Germany in the 1920s
But even these staggering rates of inflation seem insignificant beside those of Germany. Following the chaos of the war, the German government resorted to printing money, not only to meet its domestic spending requirements in rebuilding a war-ravaged economy, but also to finance the crippling war reparations imposed on it by the allies in the Treaty of Versailles.
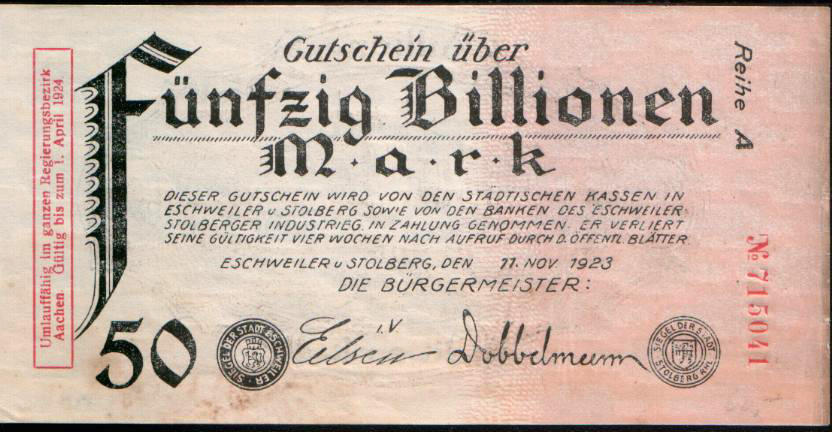
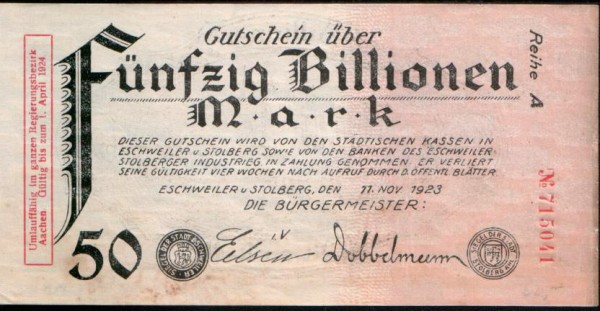 From mid 1921 the rate of monetary increase soared and inflation soared with it. By autumn 1923 the annual rate of inflation had reached a mind-boggling 7,000,000,000,000 per cent! As price increases accelerated, people became reluctant to accept money: before they knew it, the money would be worthless. People thus rushed to spend their money as quickly as possible. But this in turn further drove up prices. (The note shown above is in old billions, where a billion was a million million. So the note was for 50,000,000,000,000 marks.)
For many Germans the effect was devastating. People’s life savings were wiped out. Others whose wages were not quickly adjusted found their real incomes plummeting. Many were thrown out of work as businesses, especially those with money assets, went bankrupt. Poverty and destitution were widespread.
By the end of 1923 the German currency was literally worthless. In 1924, therefore, it was replaced by a new currency – one whose supply was kept tightly controlled by the government.
Serbia and Montenegro 1993–5
After the break-up of Yugoslavia in 1992, the economy of the remaining part of Yugoslavia (Serbia and Montenegro) collapsed. The government relied more and more on printing money to finance public expenditure. Prices soared.
 The government attempted to control the inflation by imposing price controls. But these simply made production unprofitable and output fell further. The economy nosedived. Unemployment exceeded 30 per cent.
In October 1993, the government created a new currency, the new dinar, worth one million old dinars. In other words, six zeros were knocked off the currency. But this did not solve the problem. Between October 1993 and January 1994, prices rose by 5 quadrillion per cent (5 and fifteen zeros). Normal life could not function. Shops ran out of produce; savings were wiped out; barter replaced normal market activity.
At the beginning of January 1994 a ‘new new dinar’ was introduced, worth 1 billion new dinars. On 24 January this was replaced by a ‘novi dinar’ pegged 1 to 1 against the Deutsche Mark. This was worth approximately 13 million new new dinars. The novi dinar remained pegged to the Deutsche Mark and inflation was quickly eliminated.
Articles
Zimbabweans get chance to swap ‘quadrillions’ for a few US dollars The Guardian (13/6/15)
175 Quadrillion Zimbabwean Dollars Are Now Worth $5 Bloomberg, Godfrey Marawanyika and Paul Wallace (11/6/15)
Zimbabwe is paying people $5 for 175 quadrillion Zimbabwe dollars Washington Post, Matt O’Brien (12/6/15)
Zimbabwe dollars phased out BBC News Africa (12/6/15)
Zimbabwe ditches its all but worthless currency Financial Times (12/6/15)
Zeroing in Thomson Reuters, Breaking News, Edward Hadas (12/6/15)
Old articles
Could inflation fell Mugabe? BBC News (28/7/08)
ZIMBABWE: Inflation at 6.5 quindecillion novemdecillion percent IRIN (21/1/09)
The Worst Episode of Hyperinflation in History: Yugoslavia 1993-94 Roger Sherman Society, Thayer Watkins (31/7/08)
Questions
- Why have several governments in the past been prepared to allow hyperinflation to develop?
- Itemise the types of cost imposed on people by hyperinflation.
- Does anyone gain from hyperinflation?
- What are the solutions to hyperinflation?
- What difficulties are there in eliminating hyperinflation? What costs are imposed on people in the process?
- Why might the causes of hyperinflation be described as always political?
 The International Monetary Fund has just published its six-monthly World Economic Outlook (WEO). The publication assesses the state of the global economy and forecasts economic growth and other indicators over the next few years. So what is this latest edition predicting?